Zip Codes with the Highest Percentage of Families with Income Above $200,000 in Lenexa, KS
RELATED REPORTS & OPTIONS
Family Income | $200k+
Lenexa
Compare Zip Codes
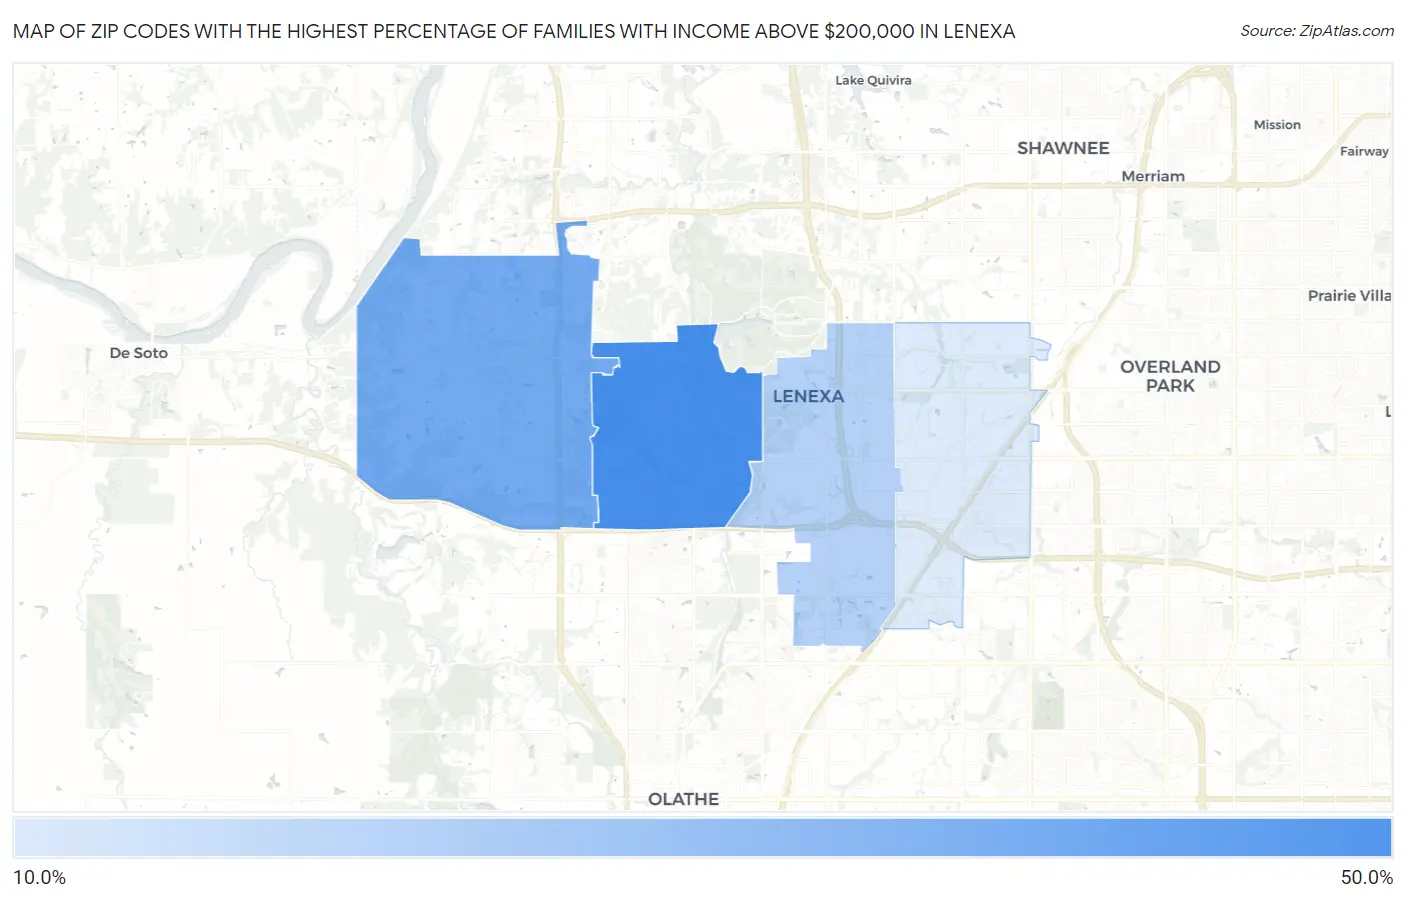
Map of Zip Codes with the Highest Percentage of Families with Income Above $200,000 in Lenexa
10.4%
45.3%
Zip Codes with the Highest Percentage of Families with Income Above $200,000 in Lenexa, KS
| Zip Code | Families with Income > $200k | vs State | vs National | |
| 1. | 66220 | 45.3% | 11.1%(+34.2)#6 | 14.8%(+30.5)#923 |
| 2. | 66227 | 34.1% | 11.1%(+23.0)#19 | 14.8%(+19.3)#1,951 |
| 3. | 66219 | 19.1% | 11.1%(+8.00)#53 | 14.8%(+4.30)#5,120 |
| 4. | 66215 | 10.4% | 11.1%(-0.700)#127 | 14.8%(-4.40)#10,381 |
1
Common Questions
What are the Top 3 Zip Codes with the Highest Percentage of Families with Income Above $200,000 in Lenexa, KS?
Top 3 Zip Codes with the Highest Percentage of Families with Income Above $200,000 in Lenexa, KS are:
What zip code has the Highest Percentage of Families with Income Above $200,000 in Lenexa, KS?
66220 has the Highest Percentage of Families with Income Above $200,000 in Lenexa, KS with 45.3%.
What is the Percentage of Families with Income Above $200,000 in Lenexa, KS?
Percentage of Families with Income Above $200,000 in Lenexa is 21.6%.
What is the Percentage of Families with Income Above $200,000 in Kansas?
Percentage of Families with Income Above $200,000 in Kansas is 11.1%.
What is the Percentage of Families with Income Above $200,000 in the United States?
Percentage of Families with Income Above $200,000 in the United States is 14.8%.