Menlo, KS Map & Demographics
Menlo Map
Menlo Overview
$149,668
PER CAPITA INCOME
80.9%
WAGE / INCOME GAP [ % ]
19.1¢/ $1
WAGE / INCOME GAP [ $ ]
0.59
INEQUALITY / GINI INDEX
37
TOTAL POPULATION
22
MALE POPULATION
15
FEMALE POPULATION
146.67
MALES / 100 FEMALES
68.18
FEMALES / 100 MALES
44.1
MEDIAN AGE
2.8
AVG FAMILY SIZE
2.6
AVG HOUSEHOLD SIZE
21
LABOR FORCE [ PEOPLE ]
67.7%
PERCENT IN LABOR FORCE
Menlo Area Codes
Income in Menlo
Income Overview in Menlo
| Characteristic | Number | Measure |
| Per Capita Income | 37 | $149,668 |
| Median Family Income | 13 | $0 |
| Mean Family Income | 13 | $372,662 |
| Median Household Income | 14 | $0 |
| Mean Household Income | 14 | $346,043 |
| Income Deficit | 13 | $0 |
| Wage / Income Gap (%) | 37 | 80.90% |
| Wage / Income Gap ($) | 37 | 19.10¢ per $1 |
| Gini / Inequality Index | 37 | 0.59 |
Earnings by Sex in Menlo
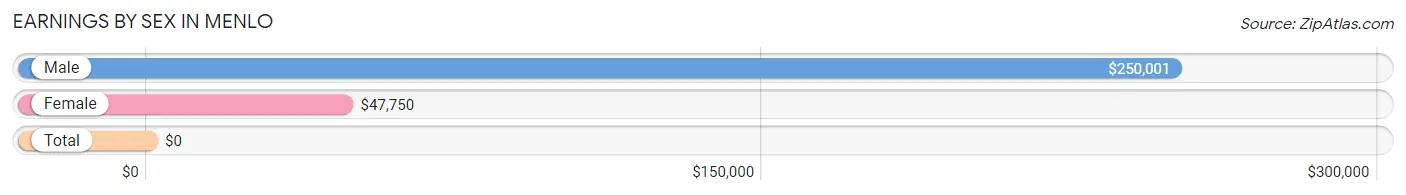
| Sex | Number | Average Earnings |
| Male | 12 (57.1%) | $250,001 |
| Female | 9 (42.9%) | $47,750 |
| Total | 21 (100.0%) | $0 |
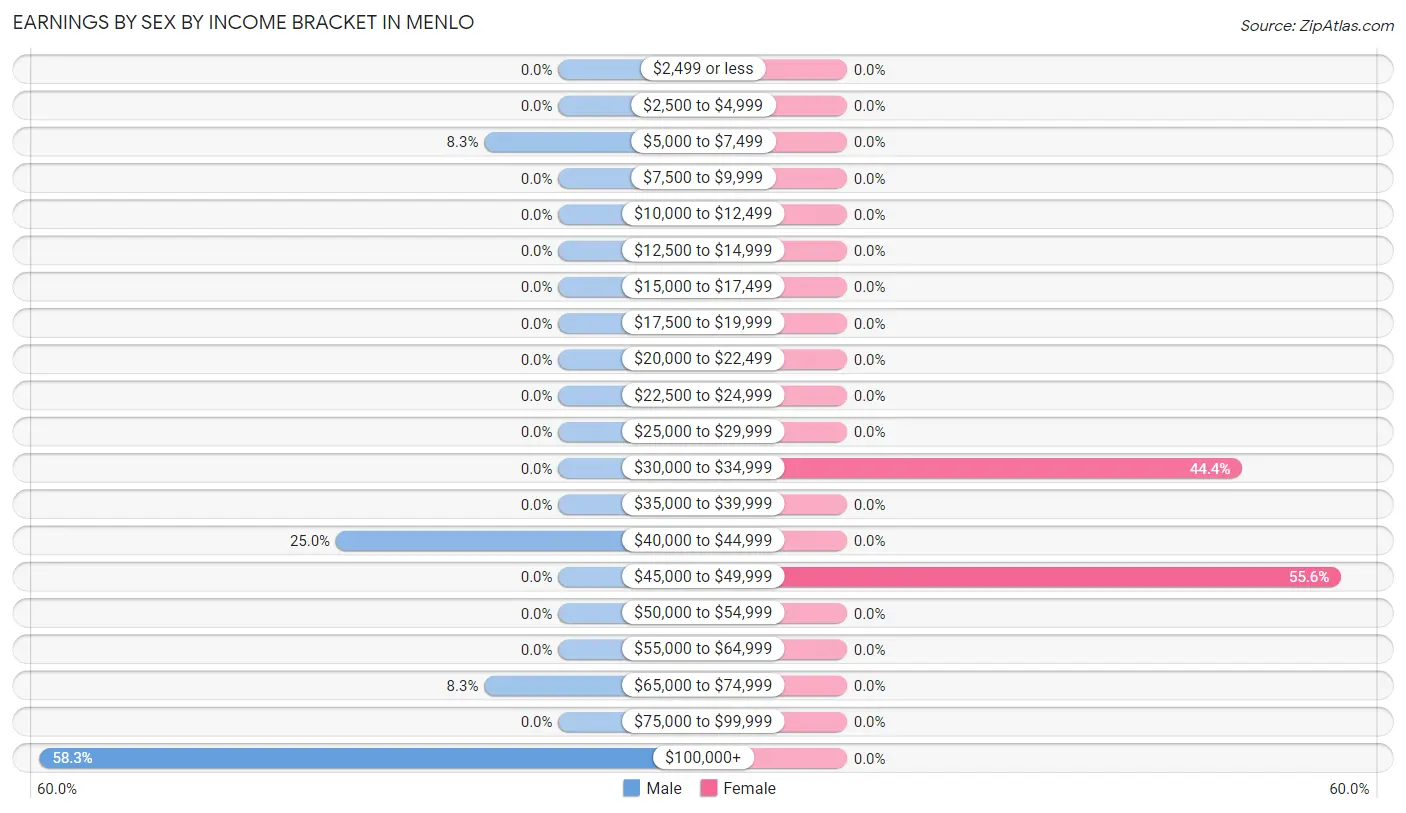
Earnings by Sex by Income Bracket in Menlo
The most common earnings brackets in Menlo are $100,000+ for men (7 | 58.3%) and $45,000 to $49,999 for women (5 | 55.6%).
| Income | Male | Female |
| $2,499 or less | 0 (0.0%) | 0 (0.0%) |
| $2,500 to $4,999 | 0 (0.0%) | 0 (0.0%) |
| $5,000 to $7,499 | 1 (8.3%) | 0 (0.0%) |
| $7,500 to $9,999 | 0 (0.0%) | 0 (0.0%) |
| $10,000 to $12,499 | 0 (0.0%) | 0 (0.0%) |
| $12,500 to $14,999 | 0 (0.0%) | 0 (0.0%) |
| $15,000 to $17,499 | 0 (0.0%) | 0 (0.0%) |
| $17,500 to $19,999 | 0 (0.0%) | 0 (0.0%) |
| $20,000 to $22,499 | 0 (0.0%) | 0 (0.0%) |
| $22,500 to $24,999 | 0 (0.0%) | 0 (0.0%) |
| $25,000 to $29,999 | 0 (0.0%) | 0 (0.0%) |
| $30,000 to $34,999 | 0 (0.0%) | 4 (44.4%) |
| $35,000 to $39,999 | 0 (0.0%) | 0 (0.0%) |
| $40,000 to $44,999 | 3 (25.0%) | 0 (0.0%) |
| $45,000 to $49,999 | 0 (0.0%) | 5 (55.6%) |
| $50,000 to $54,999 | 0 (0.0%) | 0 (0.0%) |
| $55,000 to $64,999 | 0 (0.0%) | 0 (0.0%) |
| $65,000 to $74,999 | 1 (8.3%) | 0 (0.0%) |
| $75,000 to $99,999 | 0 (0.0%) | 0 (0.0%) |
| $100,000+ | 7 (58.3%) | 0 (0.0%) |
| Total | 12 (100.0%) | 9 (100.0%) |
Earnings by Sex by Educational Attainment in Menlo
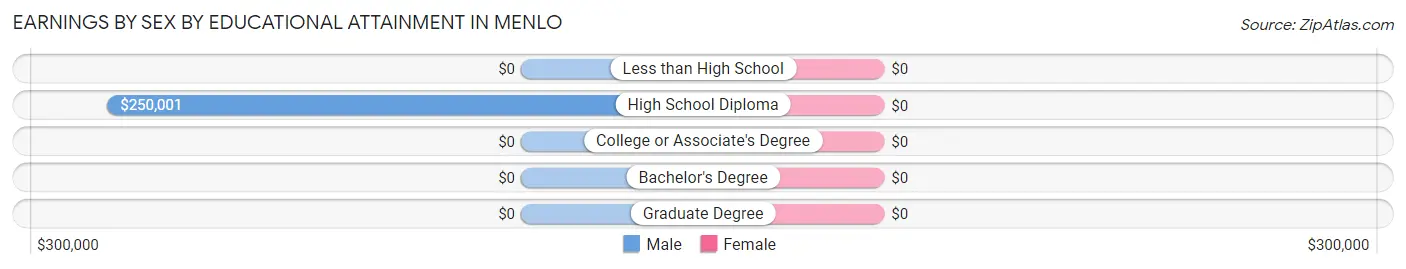
| Educational Attainment | Male Income | Female Income |
| Less than High School | - | - |
| High School Diploma | $250,001 | $0 |
| College or Associate's Degree | - | - |
| Bachelor's Degree | - | - |
| Graduate Degree | - | - |
| Total | $250,001 | $47,750 |
Family Income in Menlo
Family Income Brackets in Menlo
According to the Menlo family income data, there are 5 families falling into the $200,000+ income range, which is the most common income bracket and makes up 38.5% of all families.
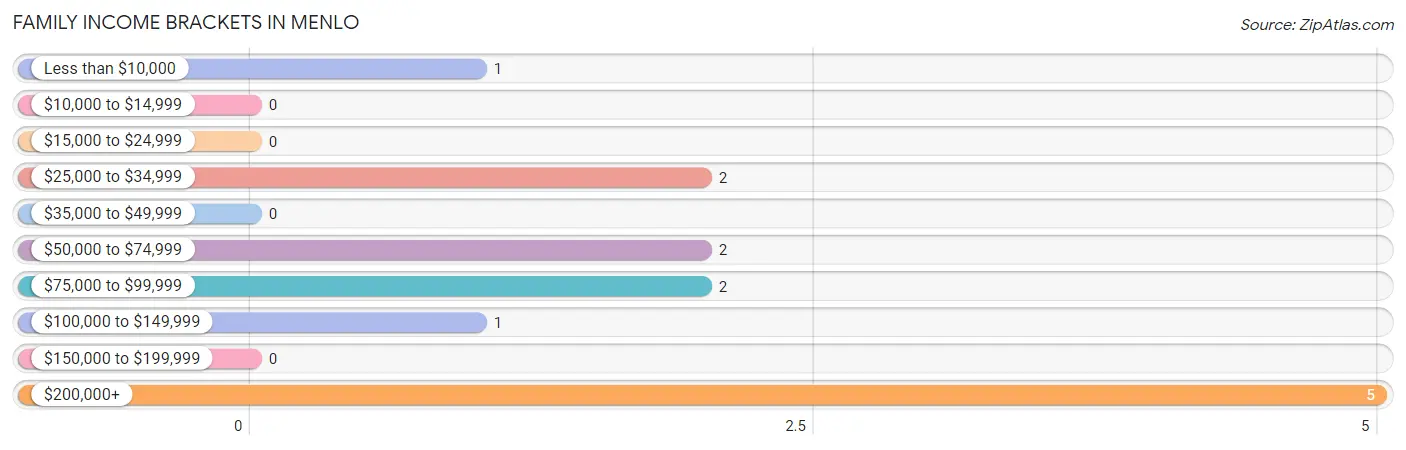
| Income Bracket | # Families | % Families |
| Less than $10,000 | 1 | 7.7% |
| $10,000 to $14,999 | 0 | 0.0% |
| $15,000 to $24,999 | 0 | 0.0% |
| $25,000 to $34,999 | 2 | 15.4% |
| $35,000 to $49,999 | 0 | 0.0% |
| $50,000 to $74,999 | 2 | 15.4% |
| $75,000 to $99,999 | 2 | 15.4% |
| $100,000 to $149,999 | 1 | 7.7% |
| $150,000 to $199,999 | 0 | 0.0% |
| $200,000+ | 5 | 38.5% |
Family Income by Famaliy Size in Menlo
2-person families (9 | 69.2%) account for the highest median family income in Menlo with $250,001 per family, while 2-person families (9 | 69.2%) have the highest median income of $125,000 per family member.
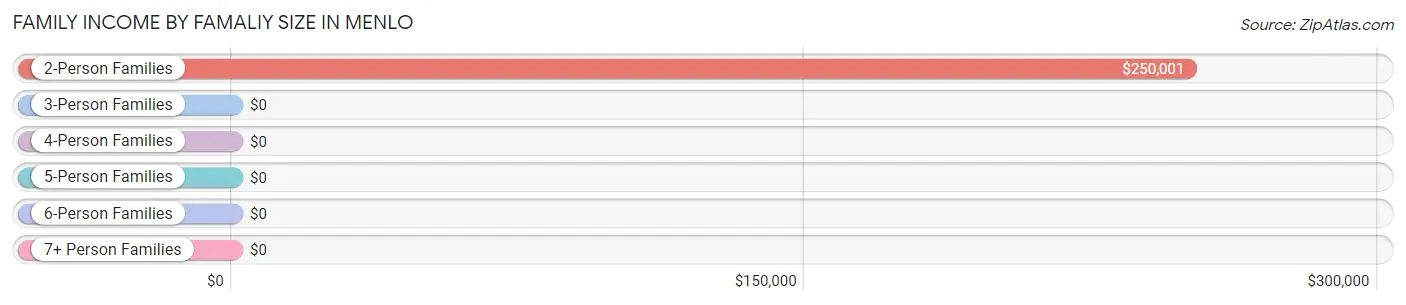
| Income Bracket | # Families | Median Income |
| 2-Person Families | 9 (69.2%) | $250,001 |
| 3-Person Families | 0 (0.0%) | $0 |
| 4-Person Families | 2 (15.4%) | $0 |
| 5-Person Families | 2 (15.4%) | $0 |
| 6-Person Families | 0 (0.0%) | $0 |
| 7+ Person Families | 0 (0.0%) | $0 |
| Total | 13 (100.0%) | $0 |
Family Income by Number of Earners in Menlo
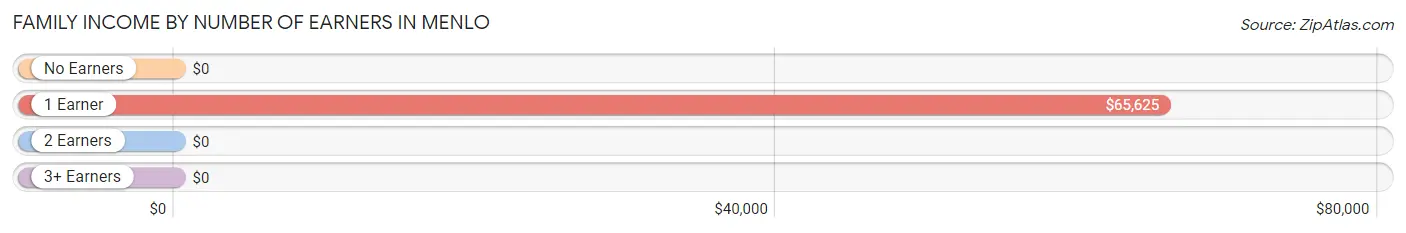
| Number of Earners | # Families | Median Income |
| No Earners | 1 (7.7%) | $0 |
| 1 Earner | 5 (38.5%) | $65,625 |
| 2 Earners | 5 (38.5%) | $0 |
| 3+ Earners | 2 (15.4%) | $0 |
| Total | 13 (100.0%) | $0 |
Household Income in Menlo
Household Income Brackets in Menlo
With 5 households falling in the category, the $200,000+ income range is the most frequent in Menlo, accounting for 35.7% of all households.
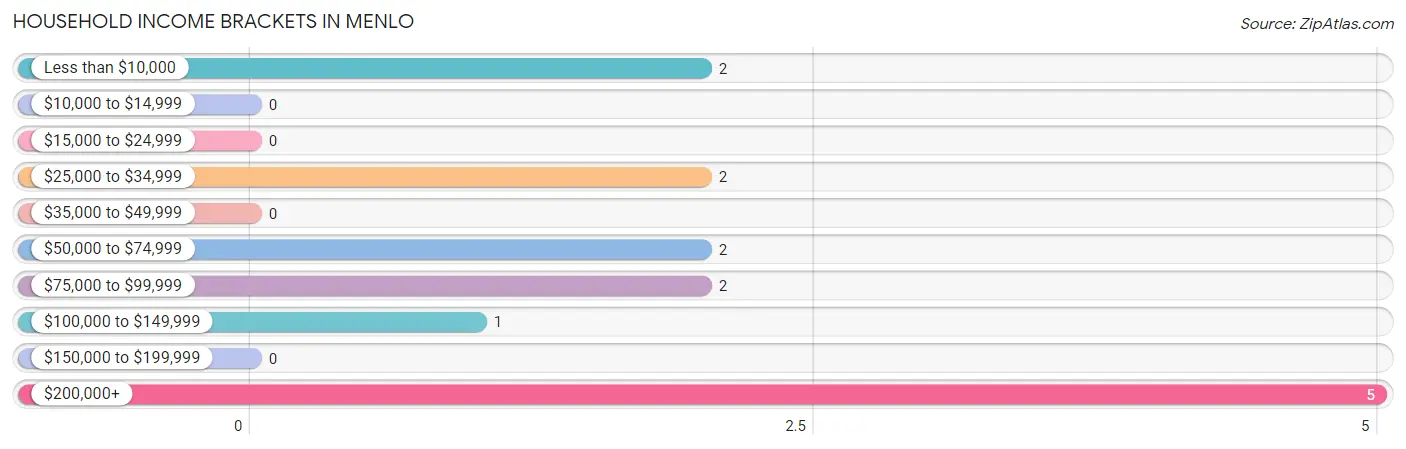
| Income Bracket | # Households | % Households |
| Less than $10,000 | 2 | 14.3% |
| $10,000 to $14,999 | 0 | 0.0% |
| $15,000 to $24,999 | 0 | 0.0% |
| $25,000 to $34,999 | 2 | 14.3% |
| $35,000 to $49,999 | 0 | 0.0% |
| $50,000 to $74,999 | 2 | 14.3% |
| $75,000 to $99,999 | 2 | 14.3% |
| $100,000 to $149,999 | 1 | 7.1% |
| $150,000 to $199,999 | 0 | 0.0% |
| $200,000+ | 5 | 35.7% |
Household Income by Householder Age in Menlo
| Income Bracket | # Households | Median Income |
| 15 to 24 Years | 0 (0.0%) | $0 |
| 25 to 44 Years | 10 (71.4%) | $0 |
| 45 to 64 Years | 3 (21.4%) | $0 |
| 65+ Years | 1 (7.1%) | $0 |
| Total | 14 (100.0%) | $0 |
Poverty in Menlo
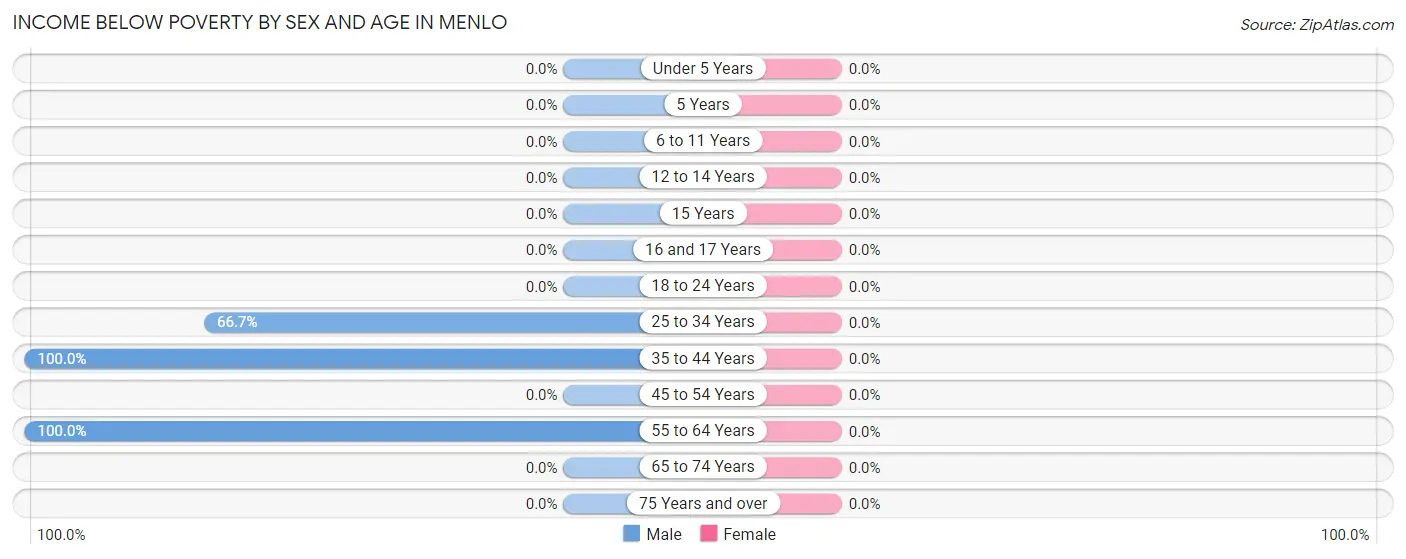
Income Below Poverty by Sex and Age in Menlo
| Age Bracket | Male | Female |
| Under 5 Years | 0 (0.0%) | 0 (0.0%) |
| 5 Years | 0 (0.0%) | 0 (0.0%) |
| 6 to 11 Years | 0 (0.0%) | 0 (0.0%) |
| 12 to 14 Years | 0 (0.0%) | 0 (0.0%) |
| 15 Years | 0 (0.0%) | 0 (0.0%) |
| 16 and 17 Years | 0 (0.0%) | 0 (0.0%) |
| 18 to 24 Years | 0 (0.0%) | 0 (0.0%) |
| 25 to 34 Years | 2 (66.7%) | 0 (0.0%) |
| 35 to 44 Years | 1 (100.0%) | 0 (0.0%) |
| 45 to 54 Years | 0 (0.0%) | 0 (0.0%) |
| 55 to 64 Years | 1 (100.0%) | 0 (0.0%) |
| 65 to 74 Years | 0 (0.0%) | 0 (0.0%) |
| 75 Years and over | 0 (0.0%) | 0 (0.0%) |
| Total | 4 (18.2%) | 0 (0.0%) |
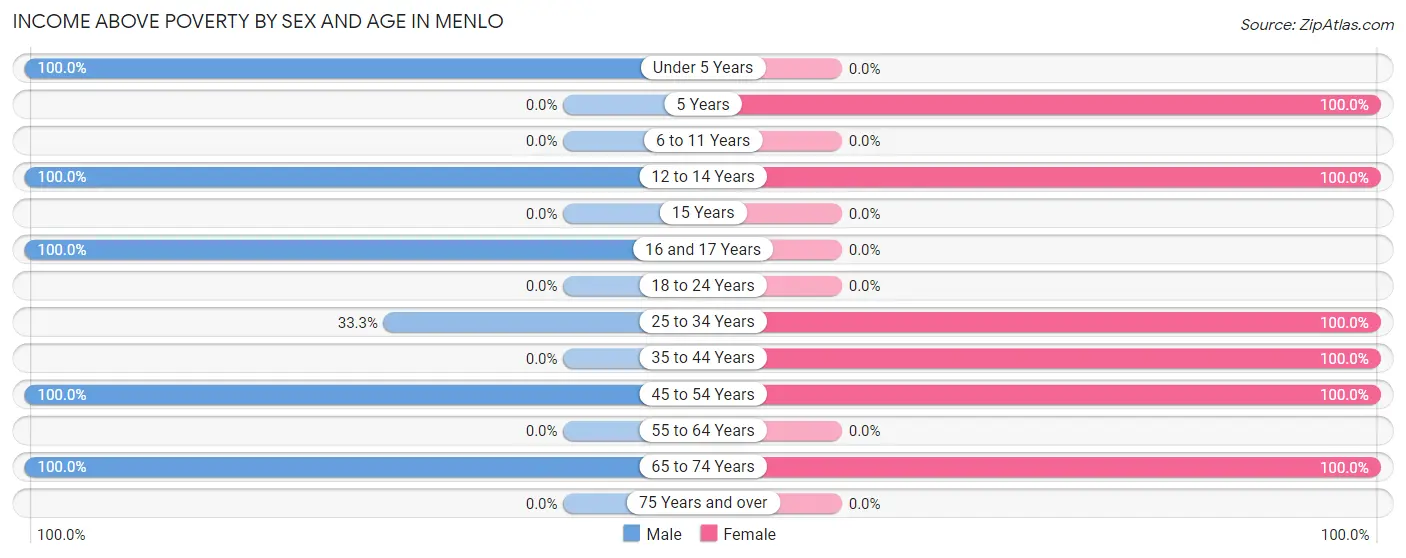
Income Above Poverty by Sex and Age in Menlo
According to the poverty statistics in Menlo, males aged under 5 years and females aged 5 years are the age groups that are most secure financially, with 100.0% of males and 100.0% of females in these age groups living above the poverty line.
| Age Bracket | Male | Female |
| Under 5 Years | 2 (100.0%) | 0 (0.0%) |
| 5 Years | 0 (0.0%) | 2 (100.0%) |
| 6 to 11 Years | 0 (0.0%) | 0 (0.0%) |
| 12 to 14 Years | 1 (100.0%) | 1 (100.0%) |
| 15 Years | 0 (0.0%) | 0 (0.0%) |
| 16 and 17 Years | 4 (100.0%) | 0 (0.0%) |
| 18 to 24 Years | 0 (0.0%) | 0 (0.0%) |
| 25 to 34 Years | 1 (33.3%) | 2 (100.0%) |
| 35 to 44 Years | 0 (0.0%) | 7 (100.0%) |
| 45 to 54 Years | 8 (100.0%) | 2 (100.0%) |
| 55 to 64 Years | 0 (0.0%) | 0 (0.0%) |
| 65 to 74 Years | 2 (100.0%) | 1 (100.0%) |
| 75 Years and over | 0 (0.0%) | 0 (0.0%) |
| Total | 18 (81.8%) | 15 (100.0%) |
Income Below Poverty Among Married-Couple Families in Menlo
| Children | Above Poverty | Below Poverty |
| No Children | 6 (100.0%) | 0 (0.0%) |
| 1 or 2 Children | 2 (100.0%) | 0 (0.0%) |
| 3 or 4 Children | 2 (100.0%) | 0 (0.0%) |
| 5 or more Children | 0 (0.0%) | 0 (0.0%) |
| Total | 10 (100.0%) | 0 (0.0%) |
Income Below Poverty Among Single-Parent Households in Menlo
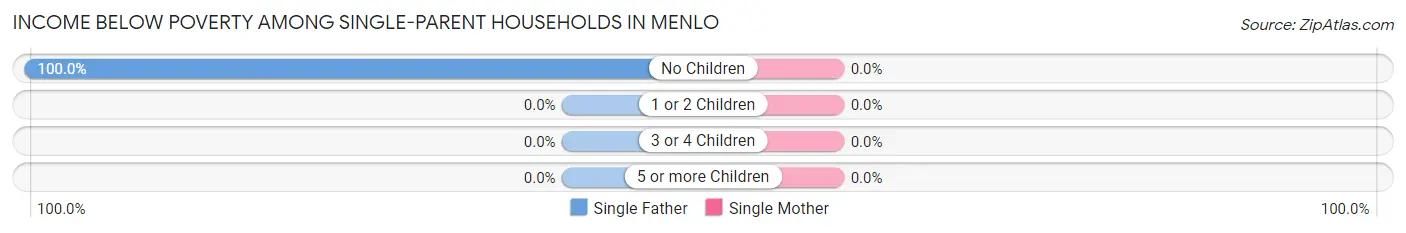
| Children | Single Father | Single Mother |
| No Children | 1 (100.0%) | 0 (0.0%) |
| 1 or 2 Children | 0 (0.0%) | 0 (0.0%) |
| 3 or 4 Children | 0 (0.0%) | 0 (0.0%) |
| 5 or more Children | 0 (0.0%) | 0 (0.0%) |
| Total | 1 (100.0%) | 0 (0.0%) |
Income Below Poverty Among Married-Couple vs Single-Parent Households in Menlo
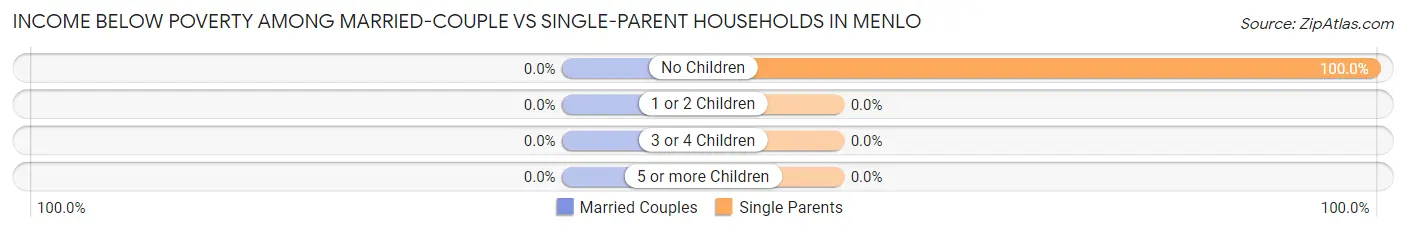
| Children | Married-Couple Families | Single-Parent Households |
| No Children | 0 (0.0%) | 1 (100.0%) |
| 1 or 2 Children | 0 (0.0%) | 0 (0.0%) |
| 3 or 4 Children | 0 (0.0%) | 0 (0.0%) |
| 5 or more Children | 0 (0.0%) | 0 (0.0%) |
| Total | 0 (0.0%) | 1 (33.3%) |
Race in Menlo
The most populous races in Menlo are White / Caucasian (31 | 83.8%), Black / African American (5 | 13.5%), and Hispanic or Latino (5 | 13.5%).
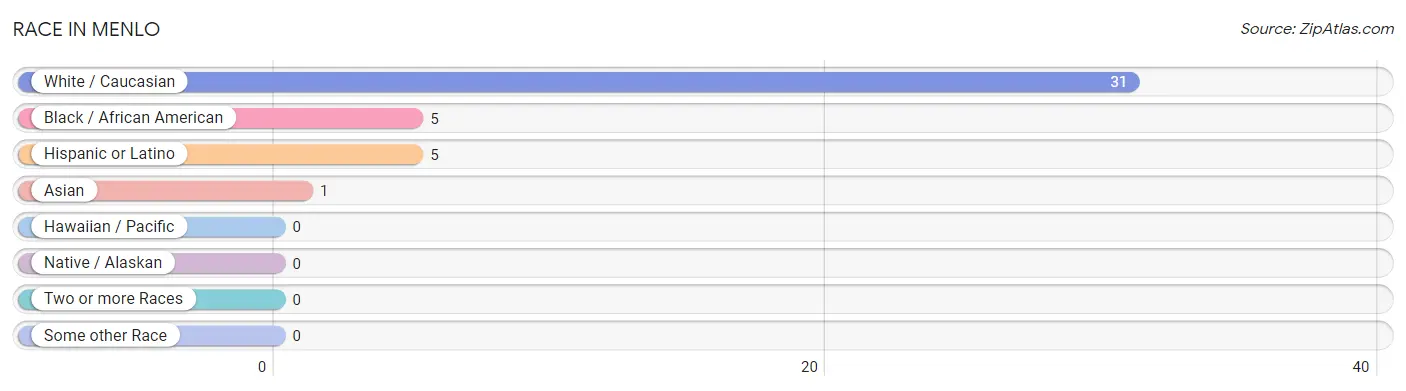
| Race | # Population | % Population |
| Asian | 1 | 2.7% |
| Black / African American | 5 | 13.5% |
| Hawaiian / Pacific | 0 | 0.0% |
| Hispanic or Latino | 5 | 13.5% |
| Native / Alaskan | 0 | 0.0% |
| White / Caucasian | 31 | 83.8% |
| Two or more Races | 0 | 0.0% |
| Some other Race | 0 | 0.0% |
| Total | 37 | 100.0% |
Ancestry in Menlo
The most populous ancestries reported in Menlo are German (15 | 40.5%), Irish (5 | 13.5%), Mexican (5 | 13.5%), British (4 | 10.8%), and English (2 | 5.4%), together accounting for 83.8% of all Menlo residents.
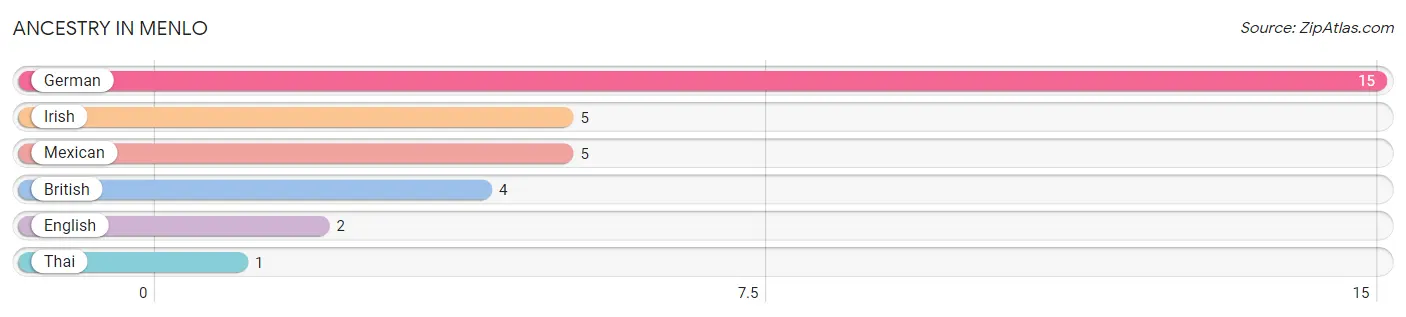
| Ancestry | # Population | % Population |
| British | 4 | 10.8% |
| English | 2 | 5.4% |
| German | 15 | 40.5% |
| Irish | 5 | 13.5% |
| Mexican | 5 | 13.5% |
| Thai | 1 | 2.7% | View All 6 Rows |
Immigrants in Menlo
The most numerous immigrant groups reported in Menlo came from Asia (1 | 2.7%), India (1 | 2.7%), and South Central Asia (1 | 2.7%), together accounting for 8.1% of all Menlo residents.
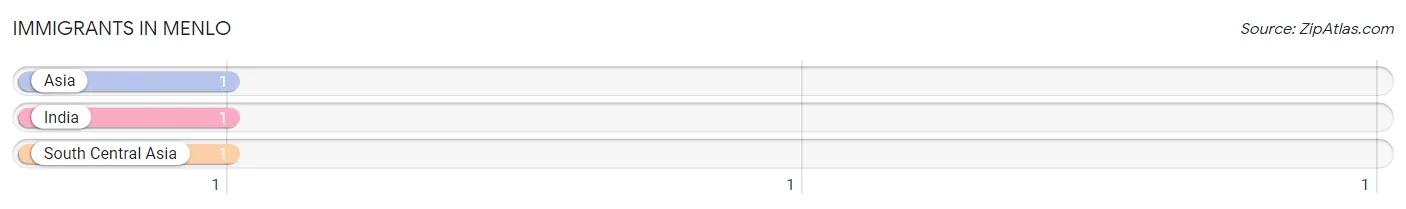
| Immigration Origin | # Population | % Population |
| Asia | 1 | 2.7% |
| India | 1 | 2.7% |
| South Central Asia | 1 | 2.7% | View All 3 Rows |
Sex and Age in Menlo
Sex and Age in Menlo
The most populous age groups in Menlo are 50 to 54 Years (6 | 27.3%) for men and 40 to 44 Years (5 | 33.3%) for women.
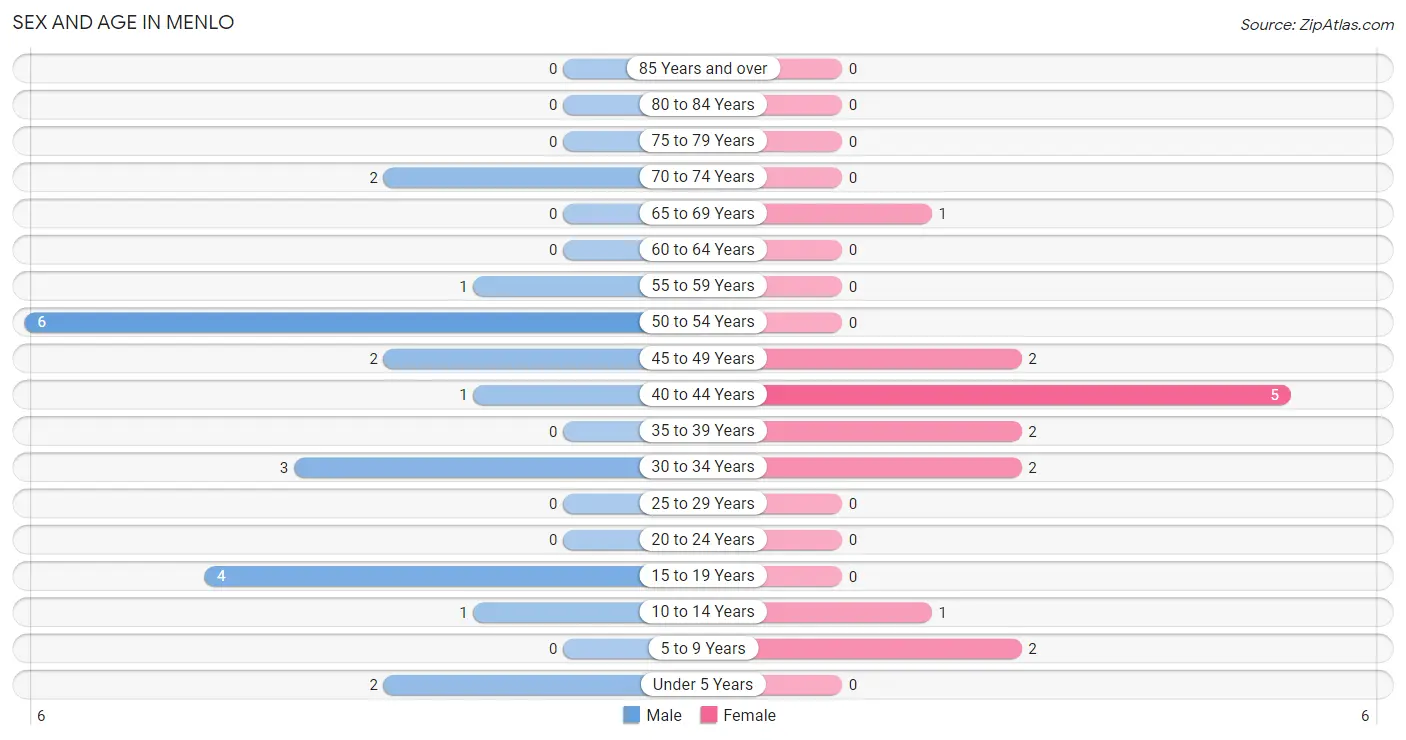
| Age Bracket | Male | Female |
| Under 5 Years | 2 (9.1%) | 0 (0.0%) |
| 5 to 9 Years | 0 (0.0%) | 2 (13.3%) |
| 10 to 14 Years | 1 (4.5%) | 1 (6.7%) |
| 15 to 19 Years | 4 (18.2%) | 0 (0.0%) |
| 20 to 24 Years | 0 (0.0%) | 0 (0.0%) |
| 25 to 29 Years | 0 (0.0%) | 0 (0.0%) |
| 30 to 34 Years | 3 (13.6%) | 2 (13.3%) |
| 35 to 39 Years | 0 (0.0%) | 2 (13.3%) |
| 40 to 44 Years | 1 (4.5%) | 5 (33.3%) |
| 45 to 49 Years | 2 (9.1%) | 2 (13.3%) |
| 50 to 54 Years | 6 (27.3%) | 0 (0.0%) |
| 55 to 59 Years | 1 (4.5%) | 0 (0.0%) |
| 60 to 64 Years | 0 (0.0%) | 0 (0.0%) |
| 65 to 69 Years | 0 (0.0%) | 1 (6.7%) |
| 70 to 74 Years | 2 (9.1%) | 0 (0.0%) |
| 75 to 79 Years | 0 (0.0%) | 0 (0.0%) |
| 80 to 84 Years | 0 (0.0%) | 0 (0.0%) |
| 85 Years and over | 0 (0.0%) | 0 (0.0%) |
| Total | 22 (100.0%) | 15 (100.0%) |
Families and Households in Menlo
Median Family Size in Menlo
The median family size in Menlo is 2.77 persons per family, with single male/father families (1 | 7.7%) accounting for the largest median family size of 3 persons per family. On the other hand, single female/mother families (2 | 15.4%) represent the smallest median family size with 2.50 persons per family.
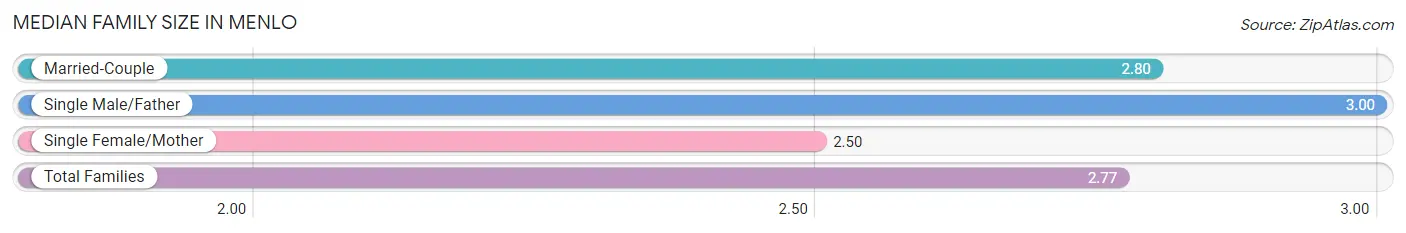
| Family Type | # Families | Family Size |
| Married-Couple | 10 (76.9%) | 2.80 |
| Single Male/Father | 1 (7.7%) | 3.00 |
| Single Female/Mother | 2 (15.4%) | 2.50 |
| Total Families | 13 (100.0%) | 2.77 |
Median Household Size in Menlo
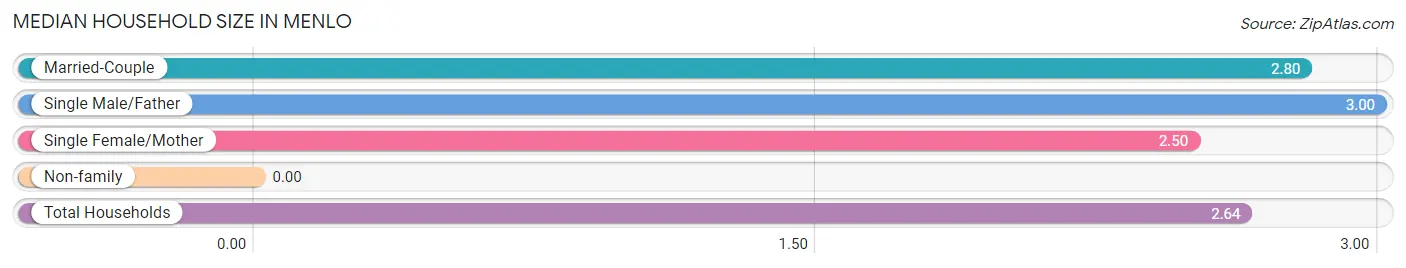
| Household Type | # Households | Household Size |
| Married-Couple | 10 (71.4%) | 2.80 |
| Single Male/Father | 1 (7.1%) | 3.00 |
| Single Female/Mother | 2 (14.3%) | 2.50 |
| Non-family | 1 (7.1%) | - |
| Total Households | 14 (100.0%) | 2.64 |
Household Size by Marriage Status in Menlo
Out of a total of 14 households in Menlo, 13 (92.9%) are family households, while 1 (7.1%) are nonfamily households. The most numerous type of family households are 2-person households, comprising 9, and the most common type of nonfamily households are 1-person households, comprising 1.
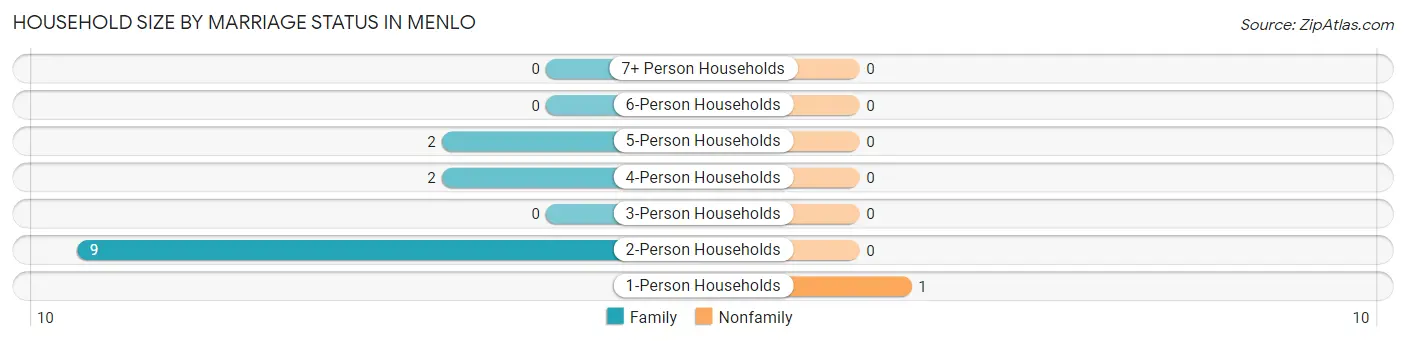
| Household Size | Family Households | Nonfamily Households |
| 1-Person Households | - | 1 (7.1%) |
| 2-Person Households | 9 (64.3%) | 0 (0.0%) |
| 3-Person Households | 0 (0.0%) | 0 (0.0%) |
| 4-Person Households | 2 (14.3%) | 0 (0.0%) |
| 5-Person Households | 2 (14.3%) | 0 (0.0%) |
| 6-Person Households | 0 (0.0%) | 0 (0.0%) |
| 7+ Person Households | 0 (0.0%) | 0 (0.0%) |
| Total | 13 (92.9%) | 1 (7.1%) |
Female Fertility in Menlo
Fertility by Age in Menlo
| Age Bracket | Women with Births | Births / 1,000 Women |
| 15 to 19 years | 0 (0.0%) | 0.0 |
| 20 to 34 years | 0 (0.0%) | 0.0 |
| 35 to 50 years | 0 (0.0%) | 0.0 |
| Total | 0 (0.0%) | 0.0 |
Fertility by Age by Marriage Status in Menlo
| Age Bracket | Married | Unmarried |
| 15 to 19 years | 0 (0.0%) | 0 (0.0%) |
| 20 to 34 years | 0 (0.0%) | 0 (0.0%) |
| 35 to 50 years | 0 (0.0%) | 0 (0.0%) |
| Total | 0 (0.0%) | 0 (0.0%) |
Fertility by Education in Menlo
| Educational Attainment | Women with Births | Births / 1,000 Women |
| Less than High School | 0 (0.0%) | 0.0 |
| High School Diploma | 0 (0.0%) | 0.0 |
| College or Associate's Degree | 0 (0.0%) | 0.0 |
| Bachelor's Degree | 0 (0.0%) | 0.0 |
| Graduate Degree | 0 (0.0%) | 0.0 |
| Total | 0 (0.0%) | 0.0 |
Fertility by Education by Marriage Status in Menlo
| Educational Attainment | Married | Unmarried |
| Less than High School | 0 (0.0%) | 0 (0.0%) |
| High School Diploma | 0 (0.0%) | 0 (0.0%) |
| College or Associate's Degree | 0 (0.0%) | 0 (0.0%) |
| Bachelor's Degree | 0 (0.0%) | 0 (0.0%) |
| Graduate Degree | 0 (0.0%) | 0 (0.0%) |
| Total | 0 (0.0%) | 0 (0.0%) |
Employment Characteristics in Menlo
Employment by Class of Employer in Menlo
Among the 21 employed individuals in Menlo, private company employees (12 | 57.1%), and self-employed (not incorporated) (9 | 42.9%) make up the most common classes of employment.
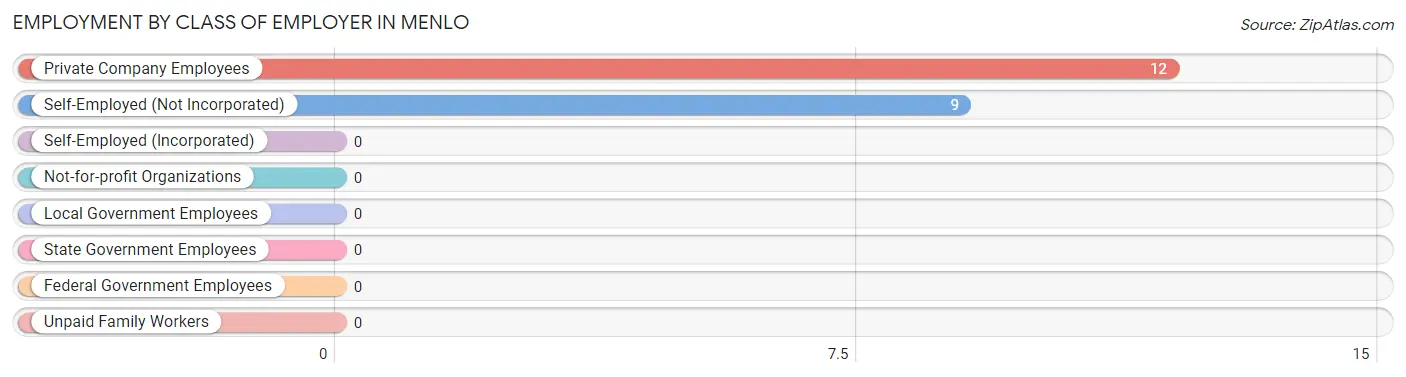
| Employer Class | # Employees | % Employees |
| Private Company Employees | 12 | 57.1% |
| Self-Employed (Incorporated) | 0 | 0.0% |
| Self-Employed (Not Incorporated) | 9 | 42.9% |
| Not-for-profit Organizations | 0 | 0.0% |
| Local Government Employees | 0 | 0.0% |
| State Government Employees | 0 | 0.0% |
| Federal Government Employees | 0 | 0.0% |
| Unpaid Family Workers | 0 | 0.0% |
| Total | 21 | 100.0% |
Employment Status by Age in Menlo
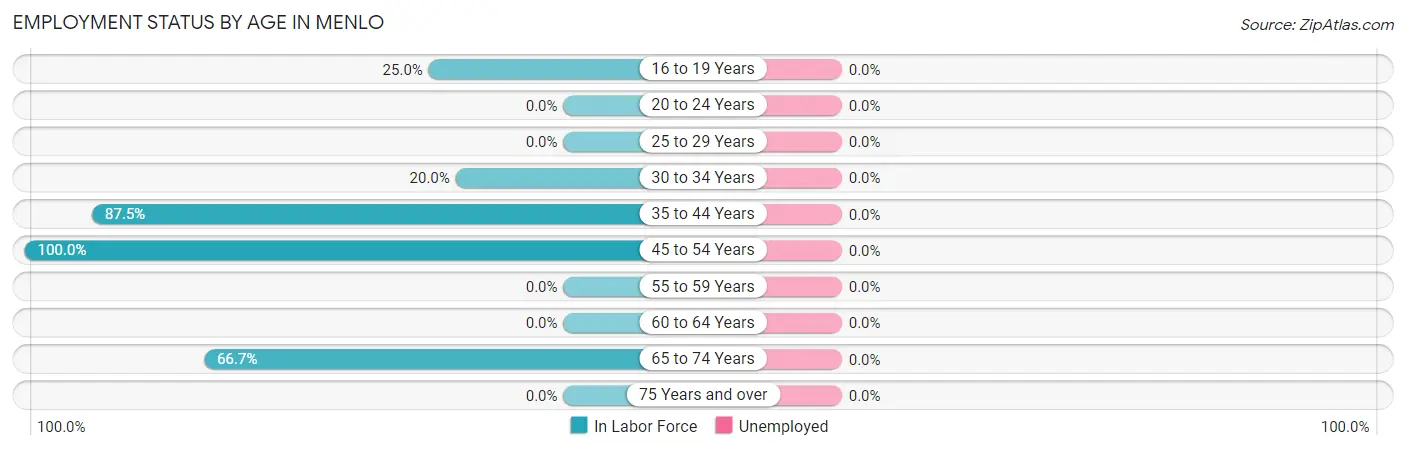
| Age Bracket | In Labor Force | Unemployed |
| 16 to 19 Years | 1 (25.0%) | 0 (0.0%) |
| 20 to 24 Years | 0 (0.0%) | 0 (0.0%) |
| 25 to 29 Years | 0 (0.0%) | 0 (0.0%) |
| 30 to 34 Years | 1 (20.0%) | 0 (0.0%) |
| 35 to 44 Years | 7 (87.5%) | 0 (0.0%) |
| 45 to 54 Years | 10 (100.0%) | 0 (0.0%) |
| 55 to 59 Years | 0 (0.0%) | 0 (0.0%) |
| 60 to 64 Years | 0 (0.0%) | 0 (0.0%) |
| 65 to 74 Years | 2 (66.7%) | 0 (0.0%) |
| 75 Years and over | 0 (0.0%) | 0 (0.0%) |
| Total | 21 (67.7%) | 0 (0.0%) |
Employment Status by Educational Attainment in Menlo
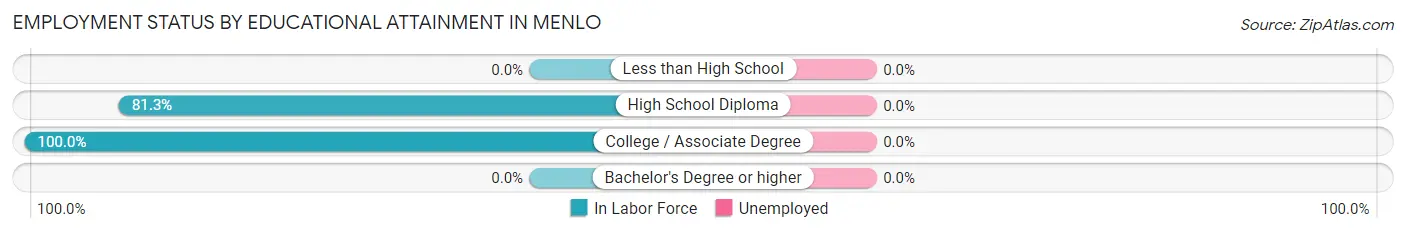
| Educational Attainment | In Labor Force | Unemployed |
| Less than High School | 0 (0.0%) | 0 (0.0%) |
| High School Diploma | 13 (81.3%) | 0 (0.0%) |
| College / Associate Degree | 5 (100.0%) | 0 (0.0%) |
| Bachelor's Degree or higher | 0 (0.0%) | 0 (0.0%) |
| Total | 18 (75.0%) | 0 (0.0%) |
Employment Occupations by Sex in Menlo
Management, Business, Science and Arts Occupations
The most common Management, Business, Science and Arts occupations in Menlo are Management (7 | 33.3%), and Business & Financial (5 | 23.8%).
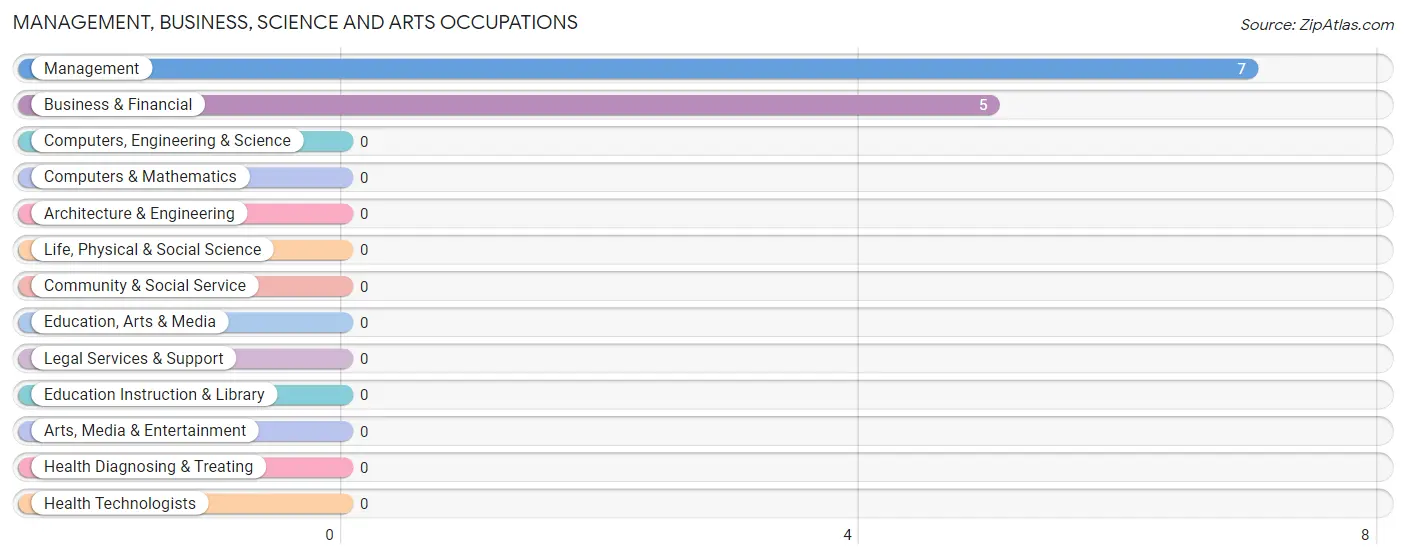
Management, Business, Science and Arts Occupations by Sex
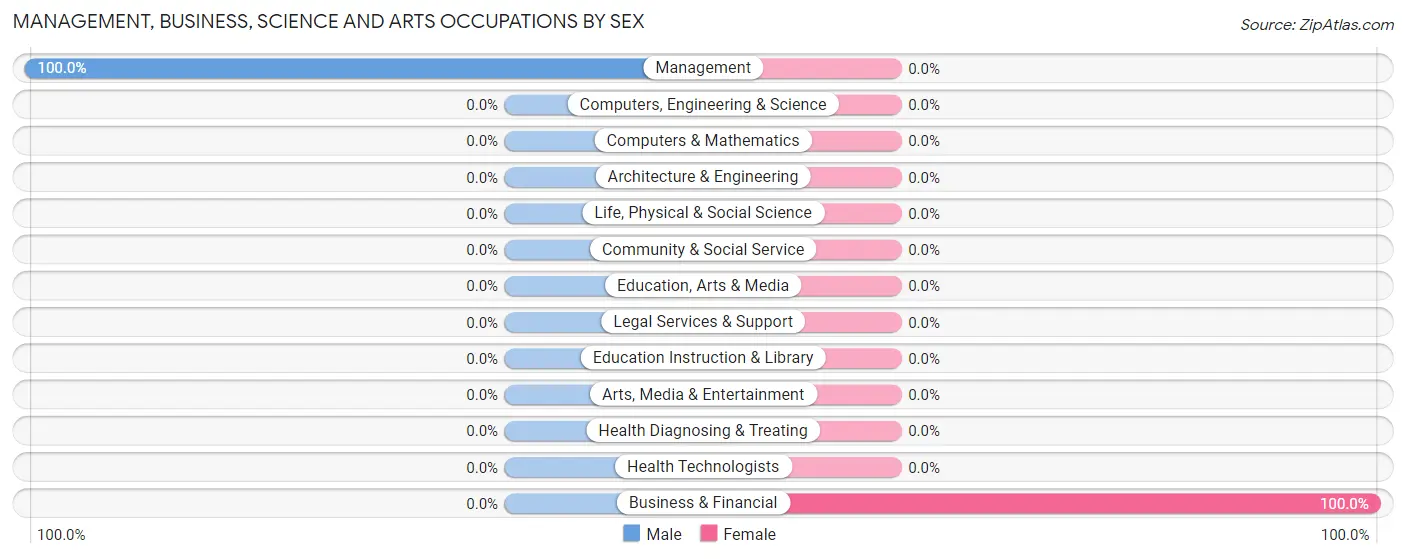
| Occupation | Male | Female |
| Management | 7 (100.0%) | 0 (0.0%) |
| Business & Financial | 0 (0.0%) | 5 (100.0%) |
| Computers, Engineering & Science | 0 (0.0%) | 0 (0.0%) |
| Computers & Mathematics | 0 (0.0%) | 0 (0.0%) |
| Architecture & Engineering | 0 (0.0%) | 0 (0.0%) |
| Life, Physical & Social Science | 0 (0.0%) | 0 (0.0%) |
| Community & Social Service | 0 (0.0%) | 0 (0.0%) |
| Education, Arts & Media | 0 (0.0%) | 0 (0.0%) |
| Legal Services & Support | 0 (0.0%) | 0 (0.0%) |
| Education Instruction & Library | 0 (0.0%) | 0 (0.0%) |
| Arts, Media & Entertainment | 0 (0.0%) | 0 (0.0%) |
| Health Diagnosing & Treating | 0 (0.0%) | 0 (0.0%) |
| Health Technologists | 0 (0.0%) | 0 (0.0%) |
| Total (Category) | 7 (58.3%) | 5 (41.7%) |
| Total (Overall) | 12 (57.1%) | 9 (42.9%) |
Services Occupations
The most common Services occupations in Menlo are , and Personal Care & Service (2 | 9.5%).
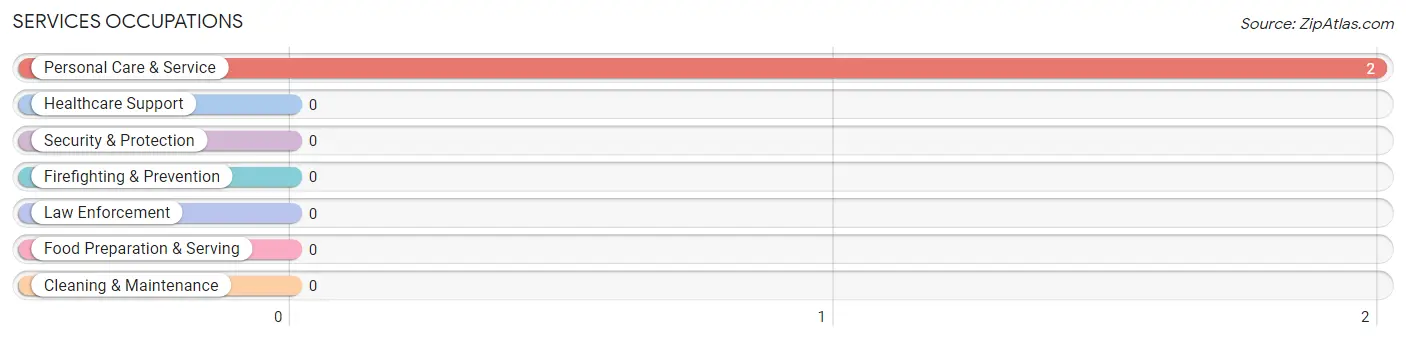
Services Occupations by Sex
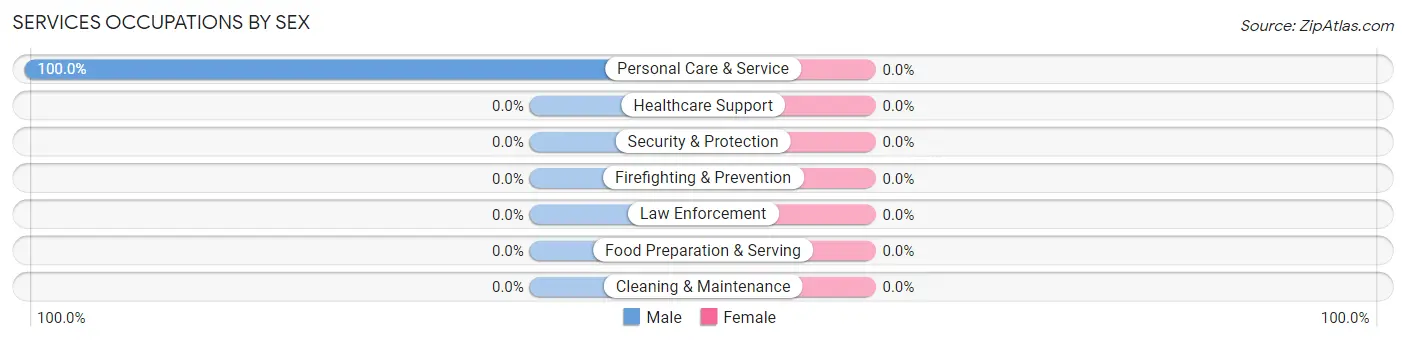
| Occupation | Male | Female |
| Healthcare Support | 0 (0.0%) | 0 (0.0%) |
| Security & Protection | 0 (0.0%) | 0 (0.0%) |
| Firefighting & Prevention | 0 (0.0%) | 0 (0.0%) |
| Law Enforcement | 0 (0.0%) | 0 (0.0%) |
| Food Preparation & Serving | 0 (0.0%) | 0 (0.0%) |
| Cleaning & Maintenance | 0 (0.0%) | 0 (0.0%) |
| Personal Care & Service | 2 (100.0%) | 0 (0.0%) |
| Total (Category) | 2 (100.0%) | 0 (0.0%) |
| Total (Overall) | 12 (57.1%) | 9 (42.9%) |
Sales and Office Occupations
The most common Sales and Office occupations in Menlo are Sales & Related (2 | 9.5%), and Office & Administration (2 | 9.5%).

Sales and Office Occupations by Sex

| Occupation | Male | Female |
| Sales & Related | 2 (100.0%) | 0 (0.0%) |
| Office & Administration | 0 (0.0%) | 2 (100.0%) |
| Total (Category) | 2 (50.0%) | 2 (50.0%) |
| Total (Overall) | 12 (57.1%) | 9 (42.9%) |
Natural Resources, Construction and Maintenance Occupations
The most common Natural Resources, Construction and Maintenance occupations in Menlo are , and Installation, Maintenance & Repair (1 | 4.8%).
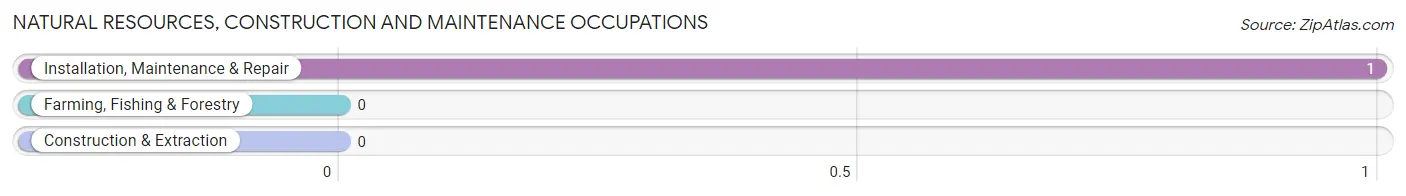
Natural Resources, Construction and Maintenance Occupations by Sex

| Occupation | Male | Female |
| Farming, Fishing & Forestry | 0 (0.0%) | 0 (0.0%) |
| Construction & Extraction | 0 (0.0%) | 0 (0.0%) |
| Installation, Maintenance & Repair | 1 (100.0%) | 0 (0.0%) |
| Total (Category) | 1 (100.0%) | 0 (0.0%) |
| Total (Overall) | 12 (57.1%) | 9 (42.9%) |
Production, Transportation and Moving Occupations
The most common Production, Transportation and Moving occupations in Menlo are , and Transportation (2 | 9.5%).
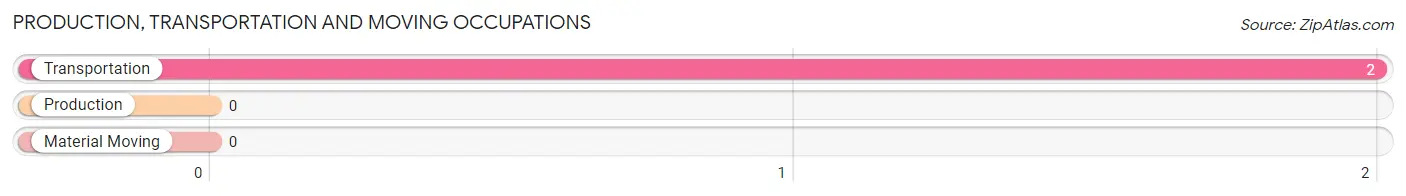
Production, Transportation and Moving Occupations by Sex

| Occupation | Male | Female |
| Production | 0 (0.0%) | 0 (0.0%) |
| Transportation | 0 (0.0%) | 2 (100.0%) |
| Material Moving | 0 (0.0%) | 0 (0.0%) |
| Total (Category) | 0 (0.0%) | 2 (100.0%) |
| Total (Overall) | 12 (57.1%) | 9 (42.9%) |
Employment Industries by Sex in Menlo
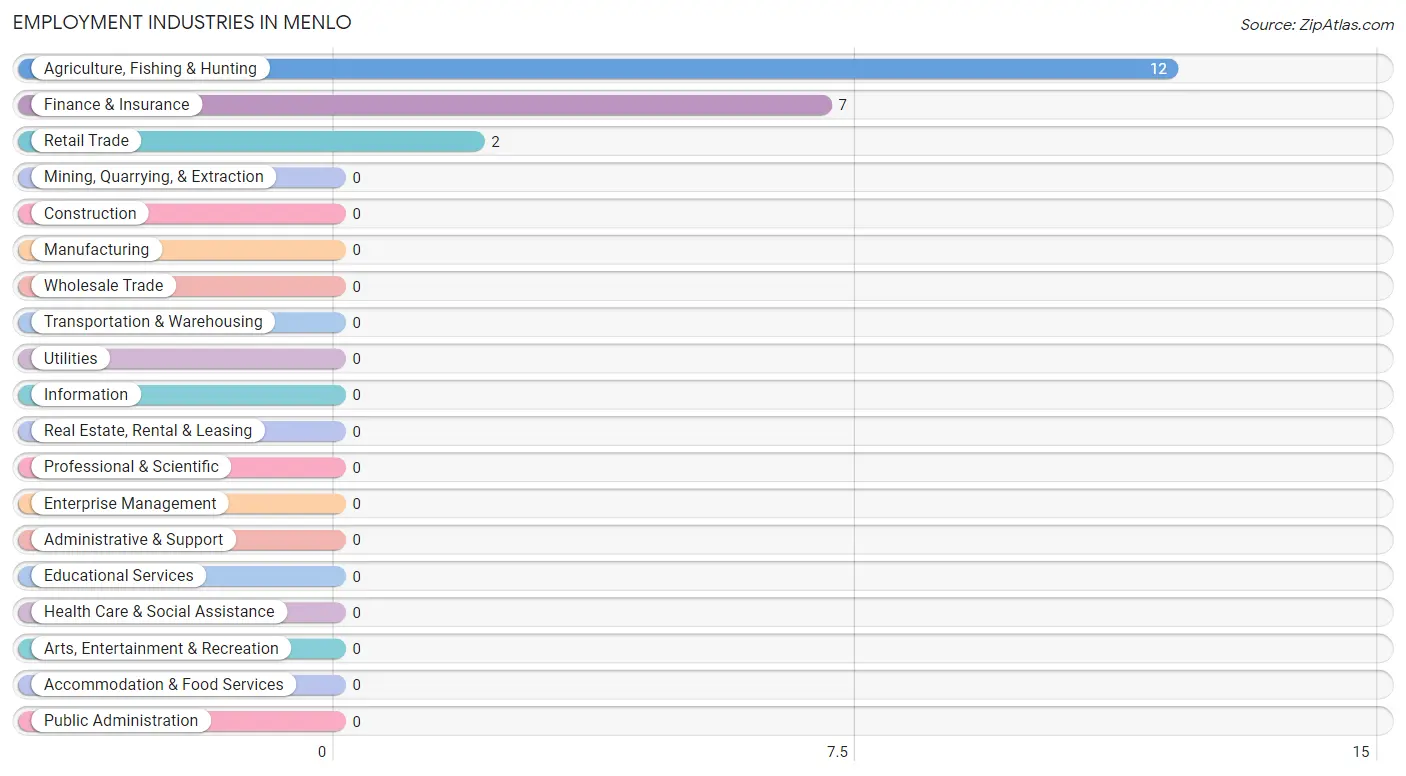
Employment Industries in Menlo
The major employment industries in Menlo include Agriculture, Fishing & Hunting (12 | 57.1%), Finance & Insurance (7 | 33.3%), and Retail Trade (2 | 9.5%).
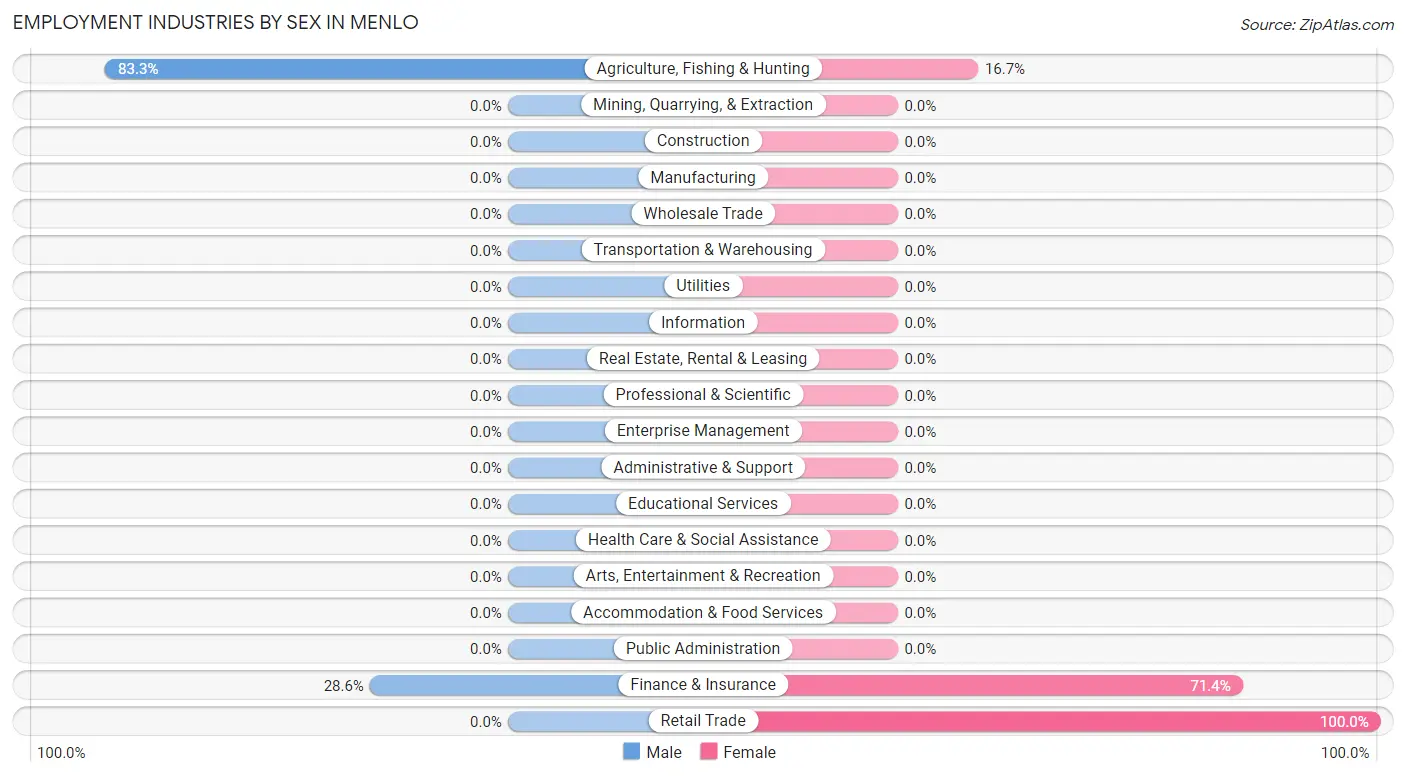
Employment Industries by Sex in Menlo
The Menlo industries that see more men than women are Agriculture, Fishing & Hunting (83.3%), and Finance & Insurance (28.6%), whereas the industries that tend to have a higher number of women are Retail Trade (100.0%), Finance & Insurance (71.4%), and Agriculture, Fishing & Hunting (16.7%).
| Industry | Male | Female |
| Agriculture, Fishing & Hunting | 10 (83.3%) | 2 (16.7%) |
| Mining, Quarrying, & Extraction | 0 (0.0%) | 0 (0.0%) |
| Construction | 0 (0.0%) | 0 (0.0%) |
| Manufacturing | 0 (0.0%) | 0 (0.0%) |
| Wholesale Trade | 0 (0.0%) | 0 (0.0%) |
| Retail Trade | 0 (0.0%) | 2 (100.0%) |
| Transportation & Warehousing | 0 (0.0%) | 0 (0.0%) |
| Utilities | 0 (0.0%) | 0 (0.0%) |
| Information | 0 (0.0%) | 0 (0.0%) |
| Finance & Insurance | 2 (28.6%) | 5 (71.4%) |
| Real Estate, Rental & Leasing | 0 (0.0%) | 0 (0.0%) |
| Professional & Scientific | 0 (0.0%) | 0 (0.0%) |
| Enterprise Management | 0 (0.0%) | 0 (0.0%) |
| Administrative & Support | 0 (0.0%) | 0 (0.0%) |
| Educational Services | 0 (0.0%) | 0 (0.0%) |
| Health Care & Social Assistance | 0 (0.0%) | 0 (0.0%) |
| Arts, Entertainment & Recreation | 0 (0.0%) | 0 (0.0%) |
| Accommodation & Food Services | 0 (0.0%) | 0 (0.0%) |
| Public Administration | 0 (0.0%) | 0 (0.0%) |
| Total | 12 (57.1%) | 9 (42.9%) |
Education in Menlo
School Enrollment in Menlo
The most common levels of schooling among the 8 students in Menlo are high school (5 | 62.5%), nursery / preschool (2 | 25.0%), and middle school (1 | 12.5%).
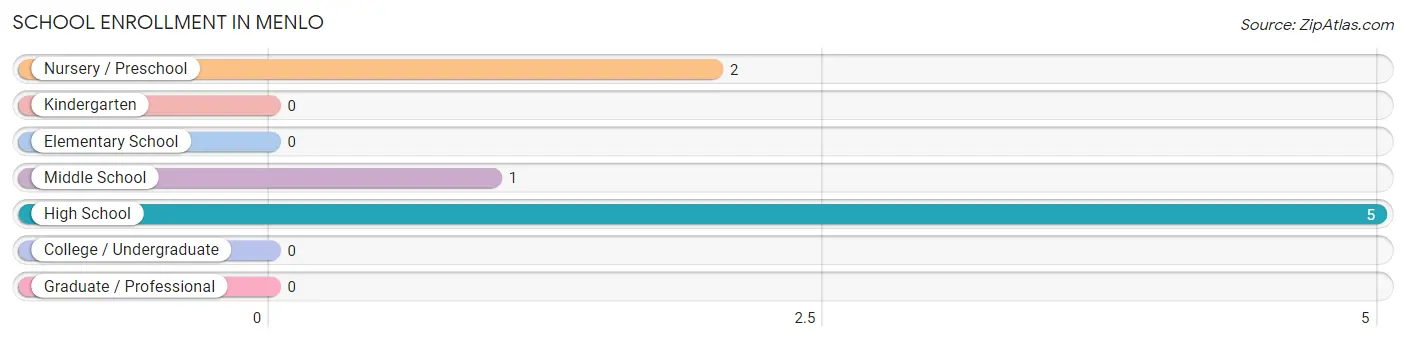
| School Level | # Students | % Students |
| Nursery / Preschool | 2 | 25.0% |
| Kindergarten | 0 | 0.0% |
| Elementary School | 0 | 0.0% |
| Middle School | 1 | 12.5% |
| High School | 5 | 62.5% |
| College / Undergraduate | 0 | 0.0% |
| Graduate / Professional | 0 | 0.0% |
| Total | 8 | 100.0% |
School Enrollment by Age by Funding Source in Menlo
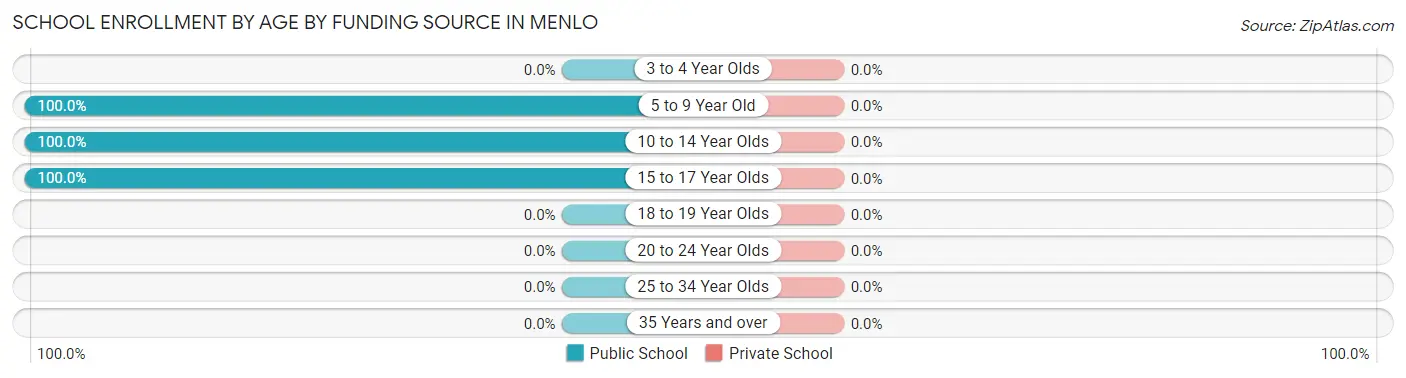
| Age Bracket | Public School | Private School |
| 3 to 4 Year Olds | 0 (0.0%) | 0 (0.0%) |
| 5 to 9 Year Old | 2 (100.0%) | 0 (0.0%) |
| 10 to 14 Year Olds | 2 (100.0%) | 0 (0.0%) |
| 15 to 17 Year Olds | 4 (100.0%) | 0 (0.0%) |
| 18 to 19 Year Olds | 0 (0.0%) | 0 (0.0%) |
| 20 to 24 Year Olds | 0 (0.0%) | 0 (0.0%) |
| 25 to 34 Year Olds | 0 (0.0%) | 0 (0.0%) |
| 35 Years and over | 0 (0.0%) | 0 (0.0%) |
| Total | 8 (100.0%) | 0 (0.0%) |
Educational Attainment by Field of Study in Menlo
Business (4 | 57.1%), arts & humanities (2 | 28.6%), and engineering (1 | 14.3%) are the most common fields of study among 7 individuals in Menlo who have obtained a bachelor's degree or higher.
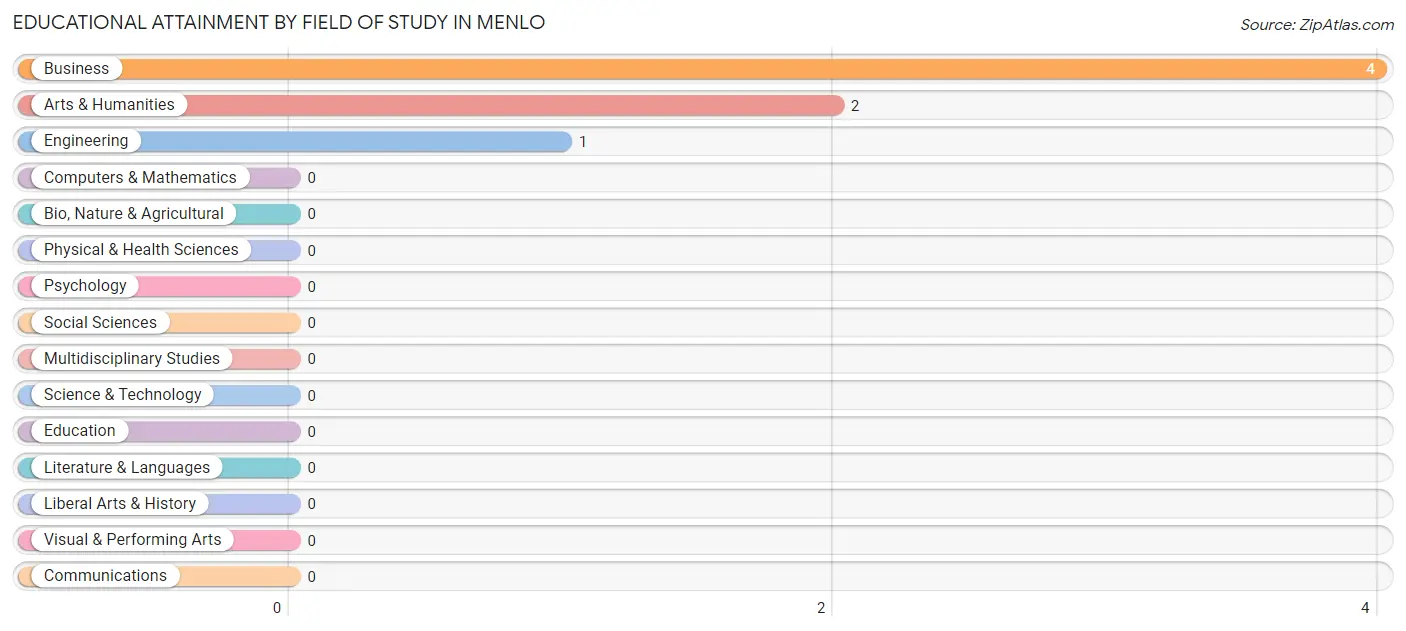
| Field of Study | # Graduates | % Graduates |
| Computers & Mathematics | 0 | 0.0% |
| Bio, Nature & Agricultural | 0 | 0.0% |
| Physical & Health Sciences | 0 | 0.0% |
| Psychology | 0 | 0.0% |
| Social Sciences | 0 | 0.0% |
| Engineering | 1 | 14.3% |
| Multidisciplinary Studies | 0 | 0.0% |
| Science & Technology | 0 | 0.0% |
| Business | 4 | 57.1% |
| Education | 0 | 0.0% |
| Literature & Languages | 0 | 0.0% |
| Liberal Arts & History | 0 | 0.0% |
| Visual & Performing Arts | 0 | 0.0% |
| Communications | 0 | 0.0% |
| Arts & Humanities | 2 | 28.6% |
| Total | 7 | 100.0% |
Transportation & Commute in Menlo
Vehicle Availability by Sex in Menlo
The most prevalent vehicle ownership categories in Menlo are males with 2 vehicles (10, accounting for 83.3%) and females with 2 vehicles (5, making up 111.1%).
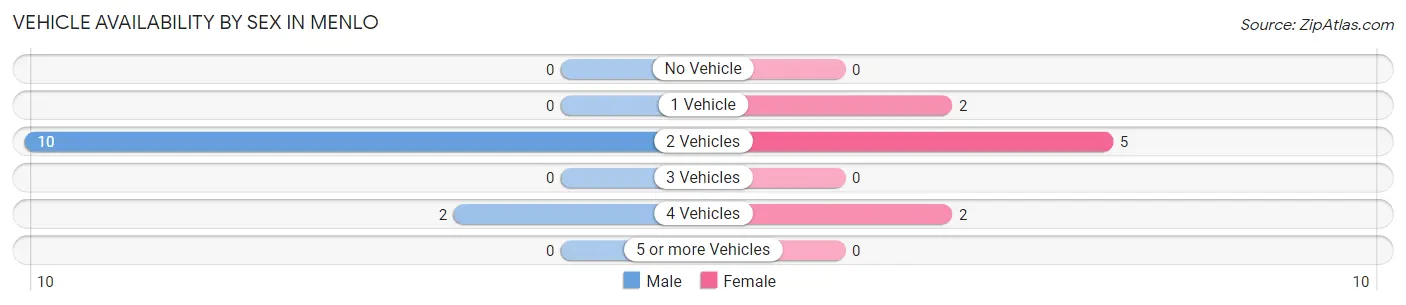
| Vehicles Available | Male | Female |
| No Vehicle | 0 (0.0%) | 0 (0.0%) |
| 1 Vehicle | 0 (0.0%) | 2 (22.2%) |
| 2 Vehicles | 10 (83.3%) | 5 (55.6%) |
| 3 Vehicles | 0 (0.0%) | 0 (0.0%) |
| 4 Vehicles | 2 (16.7%) | 2 (22.2%) |
| 5 or more Vehicles | 0 (0.0%) | 0 (0.0%) |
| Total | 12 (100.0%) | 9 (100.0%) |
Commute Time in Menlo
The most frequently occuring commute durations in Menlo are 20 to 24 minutes (9 commuters, 42.9%), 60 to 89 minutes (6 commuters, 28.6%), and less than 5 minutes (4 commuters, 19.1%).
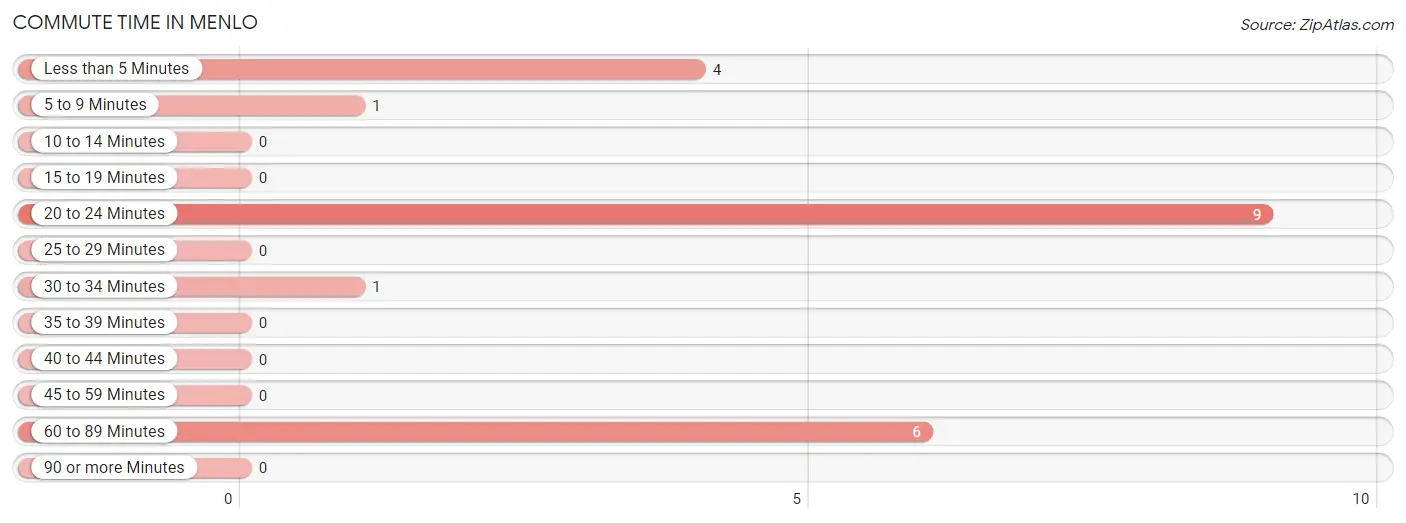
| Commute Time | # Commuters | % Commuters |
| Less than 5 Minutes | 4 | 19.1% |
| 5 to 9 Minutes | 1 | 4.8% |
| 10 to 14 Minutes | 0 | 0.0% |
| 15 to 19 Minutes | 0 | 0.0% |
| 20 to 24 Minutes | 9 | 42.9% |
| 25 to 29 Minutes | 0 | 0.0% |
| 30 to 34 Minutes | 1 | 4.8% |
| 35 to 39 Minutes | 0 | 0.0% |
| 40 to 44 Minutes | 0 | 0.0% |
| 45 to 59 Minutes | 0 | 0.0% |
| 60 to 89 Minutes | 6 | 28.6% |
| 90 or more Minutes | 0 | 0.0% |
Commute Time by Sex in Menlo
The most common commute times in Menlo are 60 to 89 minutes (6 commuters, 50.0%) for males and 20 to 24 minutes (7 commuters, 77.8%) for females.
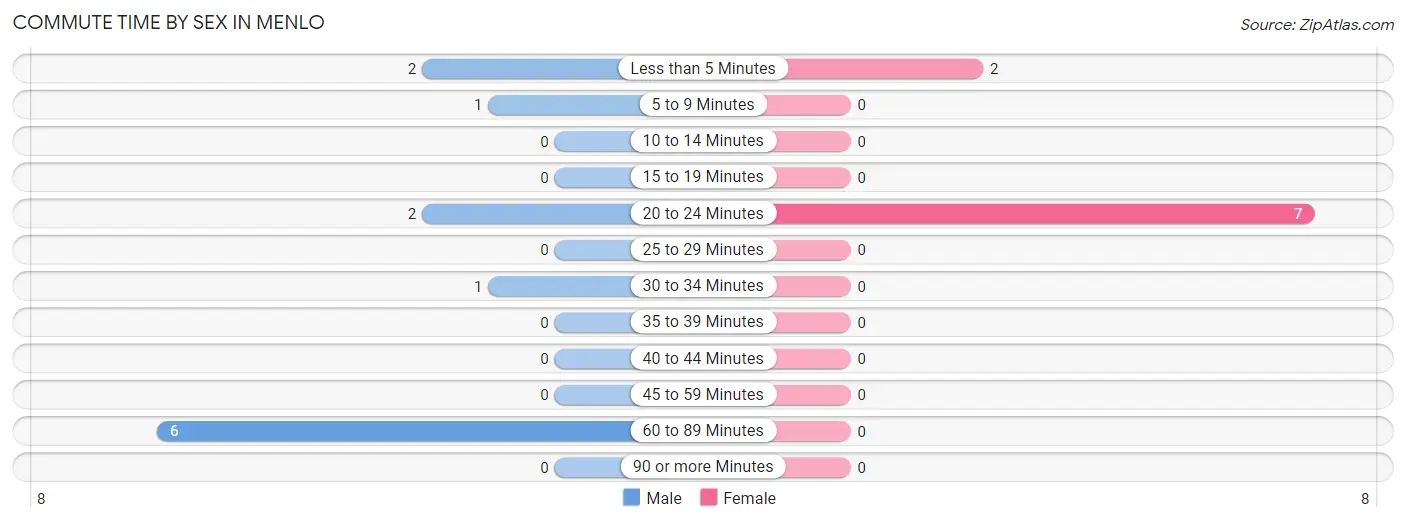
| Commute Time | Male | Female |
| Less than 5 Minutes | 2 (16.7%) | 2 (22.2%) |
| 5 to 9 Minutes | 1 (8.3%) | 0 (0.0%) |
| 10 to 14 Minutes | 0 (0.0%) | 0 (0.0%) |
| 15 to 19 Minutes | 0 (0.0%) | 0 (0.0%) |
| 20 to 24 Minutes | 2 (16.7%) | 7 (77.8%) |
| 25 to 29 Minutes | 0 (0.0%) | 0 (0.0%) |
| 30 to 34 Minutes | 1 (8.3%) | 0 (0.0%) |
| 35 to 39 Minutes | 0 (0.0%) | 0 (0.0%) |
| 40 to 44 Minutes | 0 (0.0%) | 0 (0.0%) |
| 45 to 59 Minutes | 0 (0.0%) | 0 (0.0%) |
| 60 to 89 Minutes | 6 (50.0%) | 0 (0.0%) |
| 90 or more Minutes | 0 (0.0%) | 0 (0.0%) |
Time of Departure to Work by Sex in Menlo
The most frequent times of departure to work in Menlo are 7:30 AM to 7:59 AM (8, 66.7%) for males and 7:30 AM to 7:59 AM (7, 77.8%) for females.
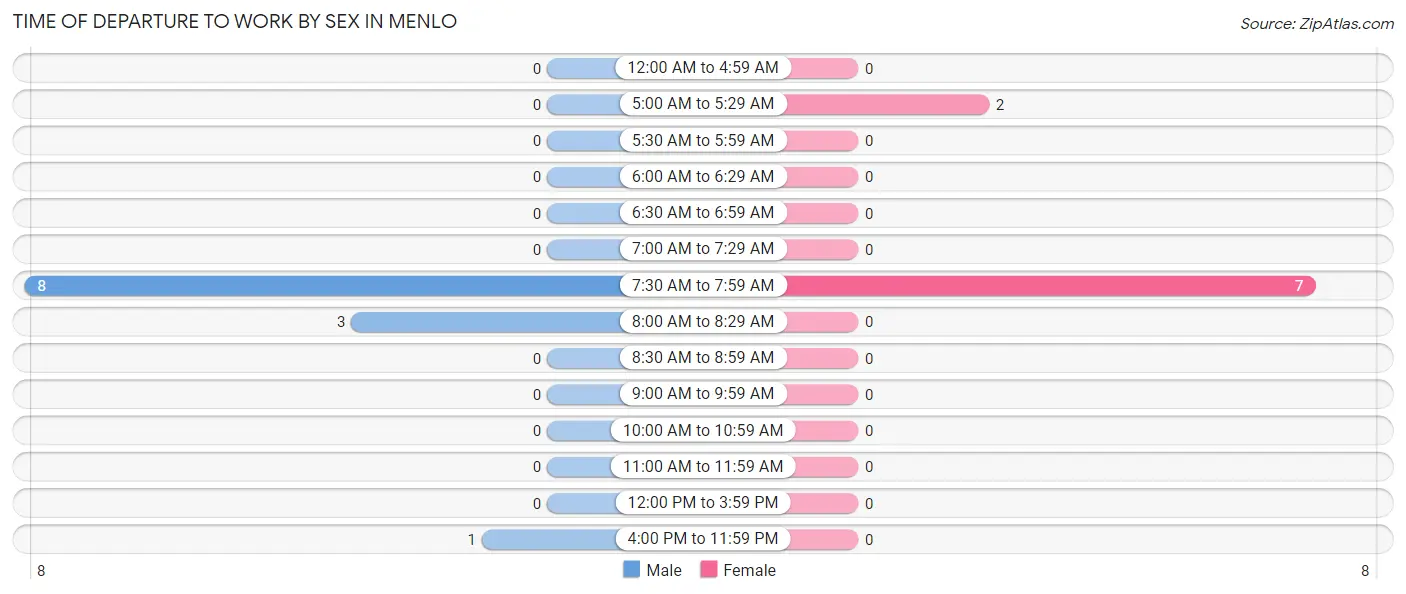
| Time of Departure | Male | Female |
| 12:00 AM to 4:59 AM | 0 (0.0%) | 0 (0.0%) |
| 5:00 AM to 5:29 AM | 0 (0.0%) | 2 (22.2%) |
| 5:30 AM to 5:59 AM | 0 (0.0%) | 0 (0.0%) |
| 6:00 AM to 6:29 AM | 0 (0.0%) | 0 (0.0%) |
| 6:30 AM to 6:59 AM | 0 (0.0%) | 0 (0.0%) |
| 7:00 AM to 7:29 AM | 0 (0.0%) | 0 (0.0%) |
| 7:30 AM to 7:59 AM | 8 (66.7%) | 7 (77.8%) |
| 8:00 AM to 8:29 AM | 3 (25.0%) | 0 (0.0%) |
| 8:30 AM to 8:59 AM | 0 (0.0%) | 0 (0.0%) |
| 9:00 AM to 9:59 AM | 0 (0.0%) | 0 (0.0%) |
| 10:00 AM to 10:59 AM | 0 (0.0%) | 0 (0.0%) |
| 11:00 AM to 11:59 AM | 0 (0.0%) | 0 (0.0%) |
| 12:00 PM to 3:59 PM | 0 (0.0%) | 0 (0.0%) |
| 4:00 PM to 11:59 PM | 1 (8.3%) | 0 (0.0%) |
| Total | 12 (100.0%) | 9 (100.0%) |
Housing Occupancy in Menlo
Occupancy by Ownership in Menlo
Of the total 14 dwellings in Menlo, owner-occupied units account for 12 (85.7%), while renter-occupied units make up 2 (14.3%).
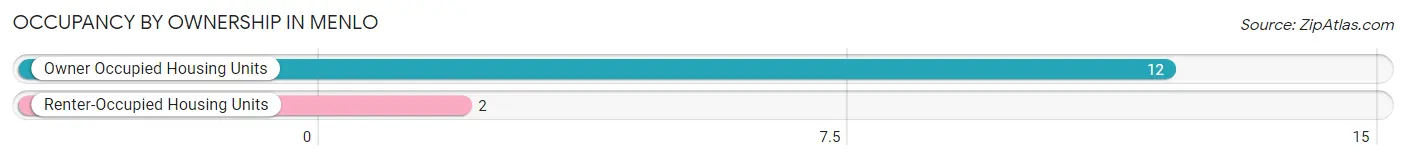
| Occupancy | # Housing Units | % Housing Units |
| Owner Occupied Housing Units | 12 | 85.7% |
| Renter-Occupied Housing Units | 2 | 14.3% |
| Total Occupied Housing Units | 14 | 100.0% |
Occupancy by Household Size in Menlo
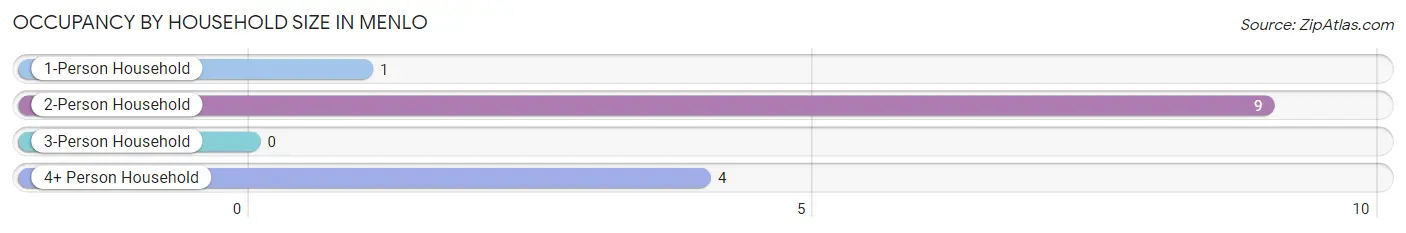
| Household Size | # Housing Units | % Housing Units |
| 1-Person Household | 1 | 7.1% |
| 2-Person Household | 9 | 64.3% |
| 3-Person Household | 0 | 0.0% |
| 4+ Person Household | 4 | 28.6% |
| Total Housing Units | 14 | 100.0% |
Occupancy by Ownership by Household Size in Menlo
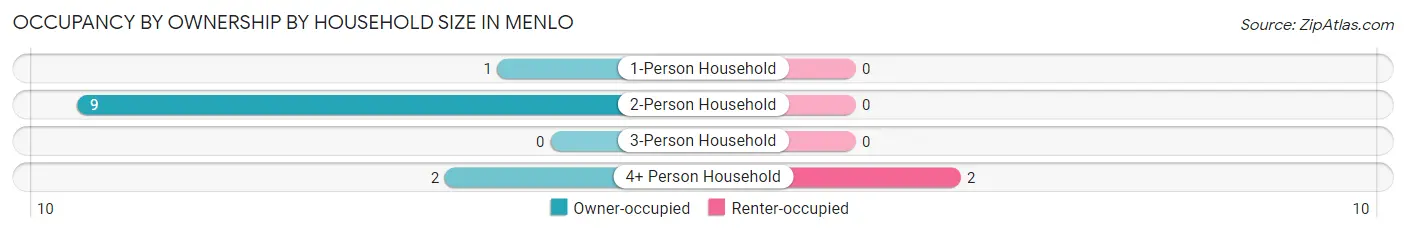
| Household Size | Owner-occupied | Renter-occupied |
| 1-Person Household | 1 (100.0%) | 0 (0.0%) |
| 2-Person Household | 9 (100.0%) | 0 (0.0%) |
| 3-Person Household | 0 (0.0%) | 0 (0.0%) |
| 4+ Person Household | 2 (50.0%) | 2 (50.0%) |
| Total Housing Units | 12 (85.7%) | 2 (14.3%) |
Occupancy by Educational Attainment in Menlo
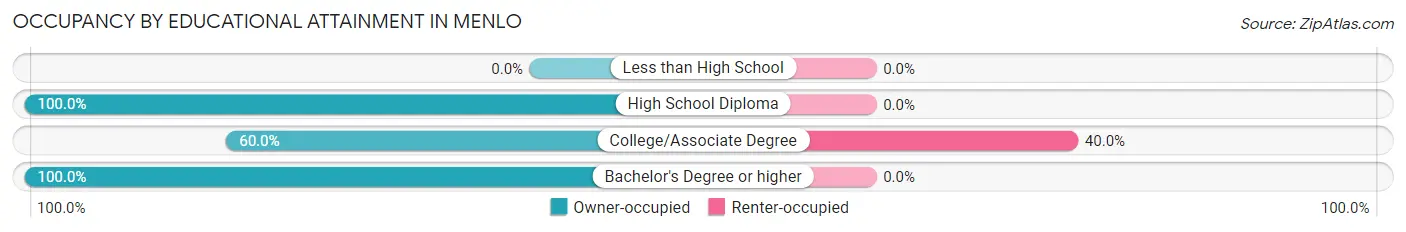
| Household Size | Owner-occupied | Renter-occupied |
| Less than High School | 0 (0.0%) | 0 (0.0%) |
| High School Diploma | 6 (100.0%) | 0 (0.0%) |
| College/Associate Degree | 3 (60.0%) | 2 (40.0%) |
| Bachelor's Degree or higher | 3 (100.0%) | 0 (0.0%) |
Occupancy by Age of Householder in Menlo
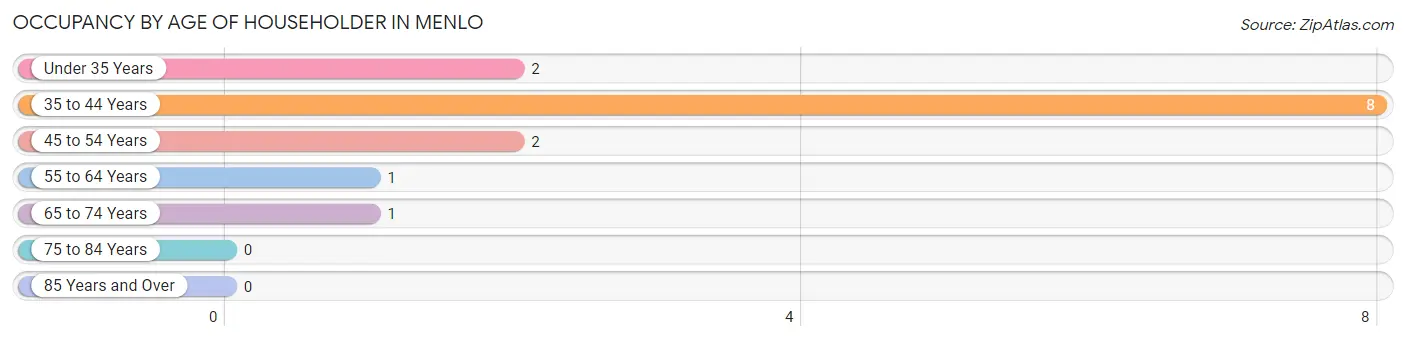
| Age Bracket | # Households | % Households |
| Under 35 Years | 2 | 14.3% |
| 35 to 44 Years | 8 | 57.1% |
| 45 to 54 Years | 2 | 14.3% |
| 55 to 64 Years | 1 | 7.1% |
| 65 to 74 Years | 1 | 7.1% |
| 75 to 84 Years | 0 | 0.0% |
| 85 Years and Over | 0 | 0.0% |
| Total | 14 | 100.0% |
Housing Finances in Menlo
Median Income by Occupancy in Menlo
| Occupancy Type | # Households | Median Income |
| Owner-Occupied | 12 (85.7%) | $0 |
| Renter-Occupied | 2 (14.3%) | $0 |
| Average | 14 (100.0%) | $0 |
Occupancy by Householder Income Bracket in Menlo
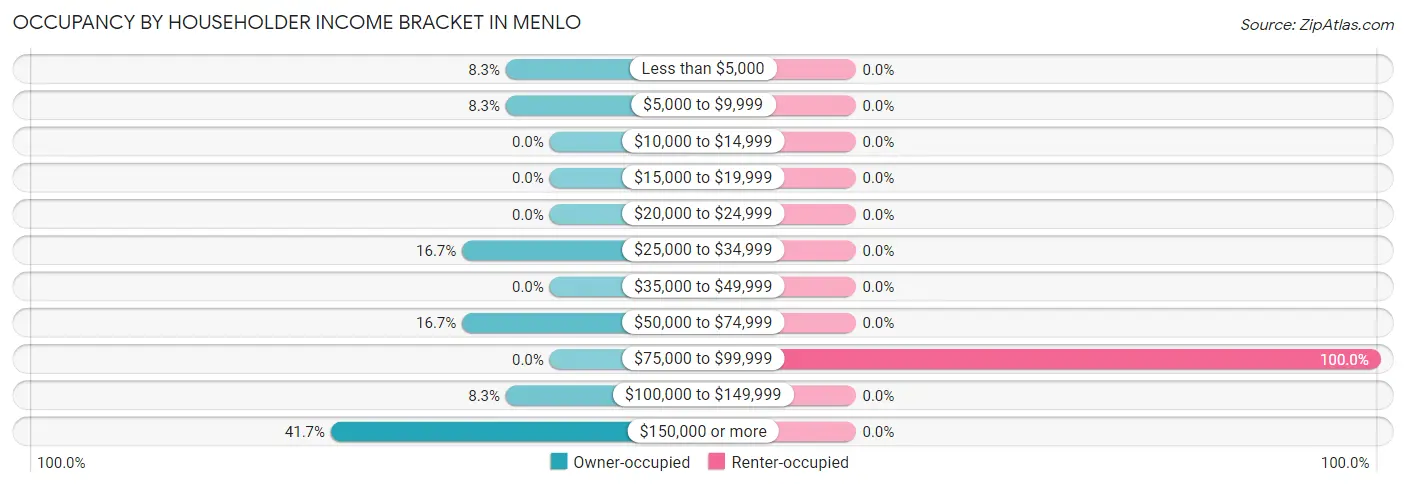
| Income Bracket | Owner-occupied | Renter-occupied |
| Less than $5,000 | 1 (8.3%) | 0 (0.0%) |
| $5,000 to $9,999 | 1 (8.3%) | 0 (0.0%) |
| $10,000 to $14,999 | 0 (0.0%) | 0 (0.0%) |
| $15,000 to $19,999 | 0 (0.0%) | 0 (0.0%) |
| $20,000 to $24,999 | 0 (0.0%) | 0 (0.0%) |
| $25,000 to $34,999 | 2 (16.7%) | 0 (0.0%) |
| $35,000 to $49,999 | 0 (0.0%) | 0 (0.0%) |
| $50,000 to $74,999 | 2 (16.7%) | 0 (0.0%) |
| $75,000 to $99,999 | 0 (0.0%) | 2 (100.0%) |
| $100,000 to $149,999 | 1 (8.3%) | 0 (0.0%) |
| $150,000 or more | 5 (41.7%) | 0 (0.0%) |
| Total | 12 (100.0%) | 2 (100.0%) |
Monthly Housing Cost Tiers in Menlo
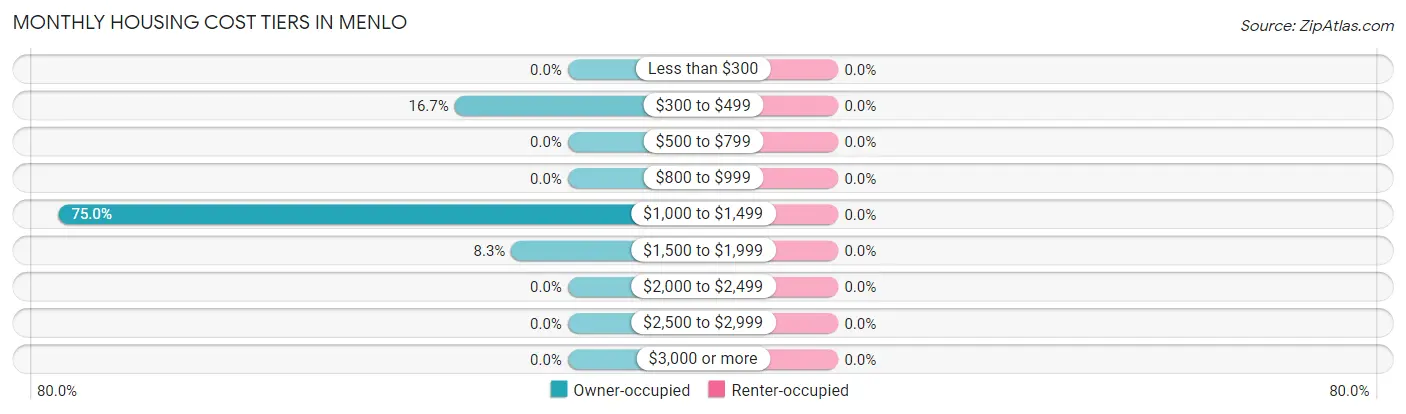
| Monthly Cost | Owner-occupied | Renter-occupied |
| Less than $300 | 0 (0.0%) | 0 (0.0%) |
| $300 to $499 | 2 (16.7%) | 0 (0.0%) |
| $500 to $799 | 0 (0.0%) | 0 (0.0%) |
| $800 to $999 | 0 (0.0%) | 0 (0.0%) |
| $1,000 to $1,499 | 9 (75.0%) | 0 (0.0%) |
| $1,500 to $1,999 | 1 (8.3%) | 0 (0.0%) |
| $2,000 to $2,499 | 0 (0.0%) | 0 (0.0%) |
| $2,500 to $2,999 | 0 (0.0%) | 0 (0.0%) |
| $3,000 or more | 0 (0.0%) | 0 (0.0%) |
| Total | 12 (100.0%) | 2 (100.0%) |
Physical Housing Characteristics in Menlo
Housing Structures in Menlo
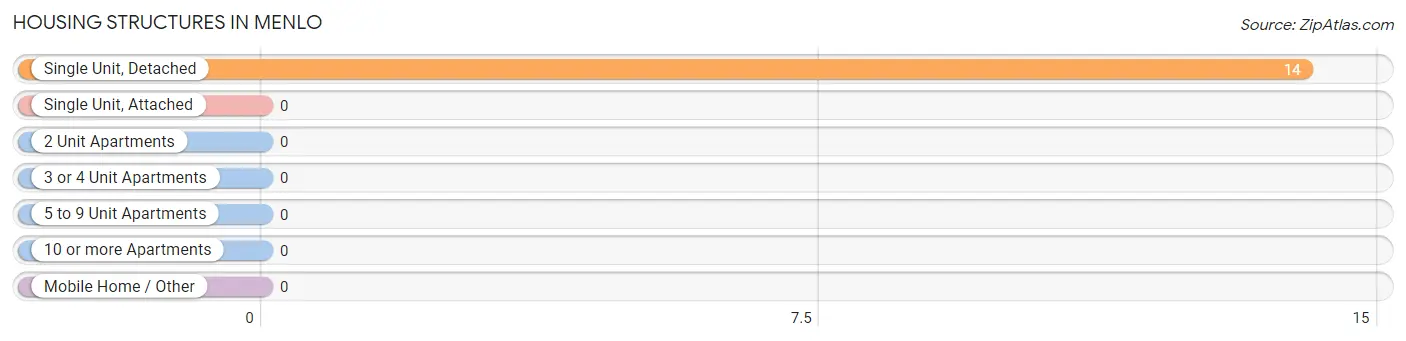
| Structure Type | # Housing Units | % Housing Units |
| Single Unit, Detached | 14 | 100.0% |
| Single Unit, Attached | 0 | 0.0% |
| 2 Unit Apartments | 0 | 0.0% |
| 3 or 4 Unit Apartments | 0 | 0.0% |
| 5 to 9 Unit Apartments | 0 | 0.0% |
| 10 or more Apartments | 0 | 0.0% |
| Mobile Home / Other | 0 | 0.0% |
| Total | 14 | 100.0% |
Housing Structures by Occupancy in Menlo
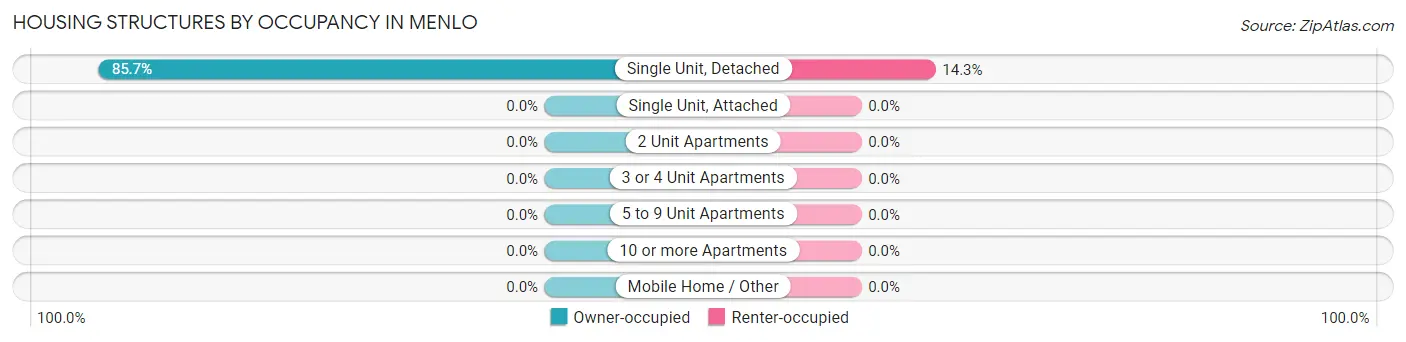
| Structure Type | Owner-occupied | Renter-occupied |
| Single Unit, Detached | 12 (85.7%) | 2 (14.3%) |
| Single Unit, Attached | 0 (0.0%) | 0 (0.0%) |
| 2 Unit Apartments | 0 (0.0%) | 0 (0.0%) |
| 3 or 4 Unit Apartments | 0 (0.0%) | 0 (0.0%) |
| 5 to 9 Unit Apartments | 0 (0.0%) | 0 (0.0%) |
| 10 or more Apartments | 0 (0.0%) | 0 (0.0%) |
| Mobile Home / Other | 0 (0.0%) | 0 (0.0%) |
| Total | 12 (85.7%) | 2 (14.3%) |
Housing Structures by Number of Rooms in Menlo
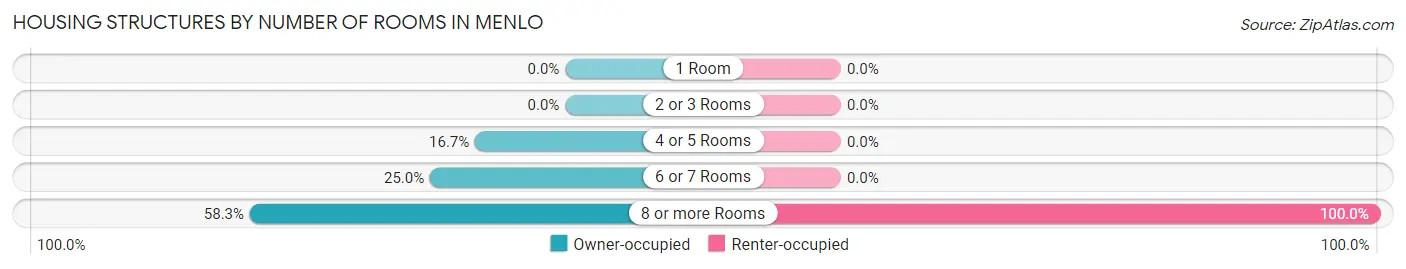
| Number of Rooms | Owner-occupied | Renter-occupied |
| 1 Room | 0 (0.0%) | 0 (0.0%) |
| 2 or 3 Rooms | 0 (0.0%) | 0 (0.0%) |
| 4 or 5 Rooms | 2 (16.7%) | 0 (0.0%) |
| 6 or 7 Rooms | 3 (25.0%) | 0 (0.0%) |
| 8 or more Rooms | 7 (58.3%) | 2 (100.0%) |
| Total | 12 (100.0%) | 2 (100.0%) |
Housing Structure by Heating Type in Menlo
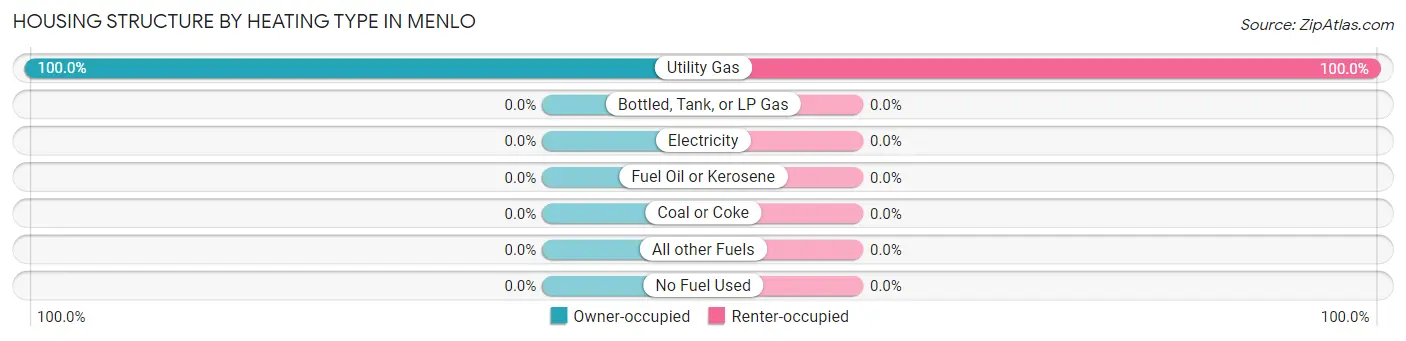
| Heating Type | Owner-occupied | Renter-occupied |
| Utility Gas | 12 (100.0%) | 2 (100.0%) |
| Bottled, Tank, or LP Gas | 0 (0.0%) | 0 (0.0%) |
| Electricity | 0 (0.0%) | 0 (0.0%) |
| Fuel Oil or Kerosene | 0 (0.0%) | 0 (0.0%) |
| Coal or Coke | 0 (0.0%) | 0 (0.0%) |
| All other Fuels | 0 (0.0%) | 0 (0.0%) |
| No Fuel Used | 0 (0.0%) | 0 (0.0%) |
| Total | 12 (100.0%) | 2 (100.0%) |
Household Vehicle Usage in Menlo
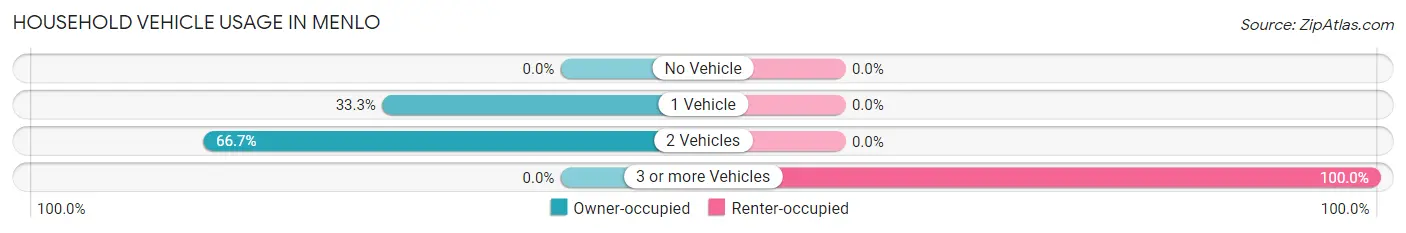
| Vehicles per Household | Owner-occupied | Renter-occupied |
| No Vehicle | 0 (0.0%) | 0 (0.0%) |
| 1 Vehicle | 4 (33.3%) | 0 (0.0%) |
| 2 Vehicles | 8 (66.7%) | 0 (0.0%) |
| 3 or more Vehicles | 0 (0.0%) | 2 (100.0%) |
| Total | 12 (100.0%) | 2 (100.0%) |
Real Estate & Mortgages in Menlo
Real Estate and Mortgage Overview in Menlo
| Characteristic | Without Mortgage | With Mortgage |
| Housing Units | 2 | 10 |
| Median Property Value | - | - |
| Median Household Income | - | - |
| Monthly Housing Costs | - | - |
| Real Estate Taxes | - | - |
Property Value by Mortgage Status in Menlo
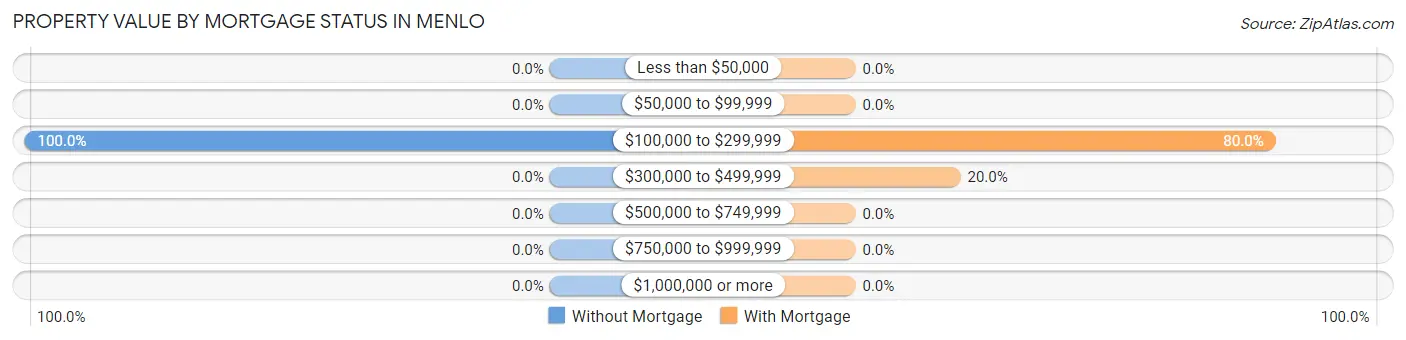
| Property Value | Without Mortgage | With Mortgage |
| Less than $50,000 | 0 (0.0%) | 0 (0.0%) |
| $50,000 to $99,999 | 0 (0.0%) | 0 (0.0%) |
| $100,000 to $299,999 | 2 (100.0%) | 8 (80.0%) |
| $300,000 to $499,999 | 0 (0.0%) | 2 (20.0%) |
| $500,000 to $749,999 | 0 (0.0%) | 0 (0.0%) |
| $750,000 to $999,999 | 0 (0.0%) | 0 (0.0%) |
| $1,000,000 or more | 0 (0.0%) | 0 (0.0%) |
| Total | 2 (100.0%) | 10 (100.0%) |
Household Income by Mortgage Status in Menlo
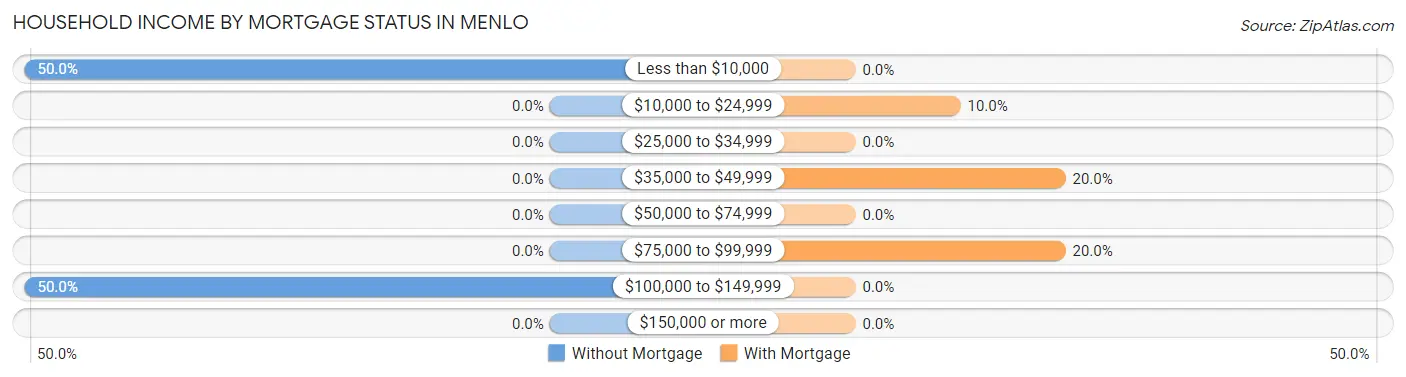
| Household Income | Without Mortgage | With Mortgage |
| Less than $10,000 | 1 (50.0%) | 0 (0.0%) |
| $10,000 to $24,999 | 0 (0.0%) | 1 (10.0%) |
| $25,000 to $34,999 | 0 (0.0%) | 0 (0.0%) |
| $35,000 to $49,999 | 0 (0.0%) | 2 (20.0%) |
| $50,000 to $74,999 | 0 (0.0%) | 0 (0.0%) |
| $75,000 to $99,999 | 0 (0.0%) | 2 (20.0%) |
| $100,000 to $149,999 | 1 (50.0%) | 0 (0.0%) |
| $150,000 or more | 0 (0.0%) | 0 (0.0%) |
| Total | 2 (100.0%) | 10 (100.0%) |
Property Value to Household Income Ratio in Menlo
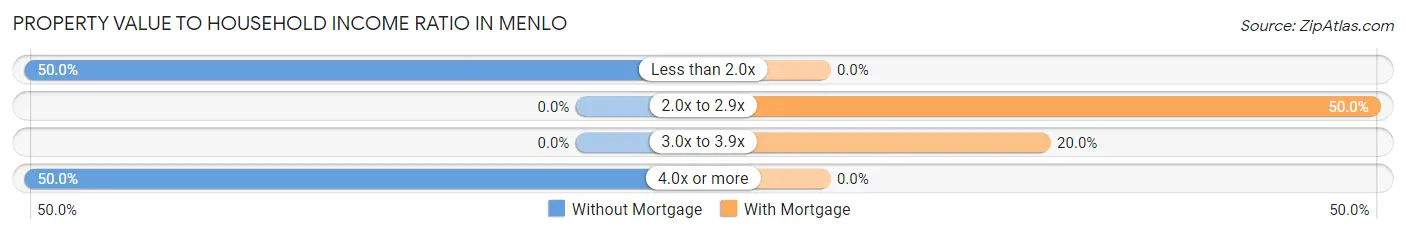
| Value-to-Income Ratio | Without Mortgage | With Mortgage |
| Less than 2.0x | 1 (50.0%) | 0 (0.0%) |
| 2.0x to 2.9x | 0 (0.0%) | 5 (50.0%) |
| 3.0x to 3.9x | 0 (0.0%) | 2 (20.0%) |
| 4.0x or more | 1 (50.0%) | 0 (0.0%) |
| Total | 2 (100.0%) | 10 (100.0%) |
Real Estate Taxes by Mortgage Status in Menlo
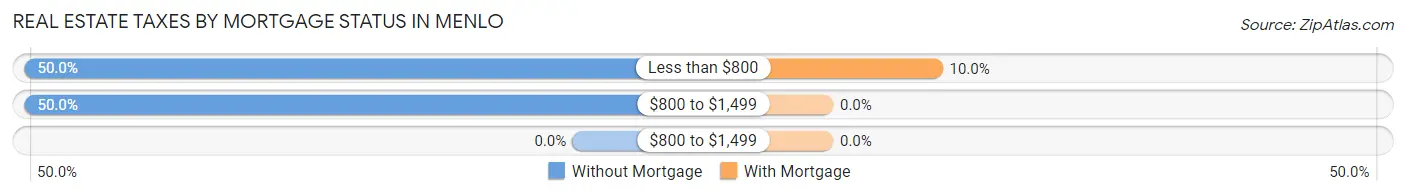
| Property Taxes | Without Mortgage | With Mortgage |
| Less than $800 | 1 (50.0%) | 1 (10.0%) |
| $800 to $1,499 | 1 (50.0%) | 0 (0.0%) |
| $800 to $1,499 | 0 (0.0%) | 0 (0.0%) |
| Total | 2 (100.0%) | 10 (100.0%) |
Health & Disability in Menlo
Health Insurance Coverage by Age in Menlo
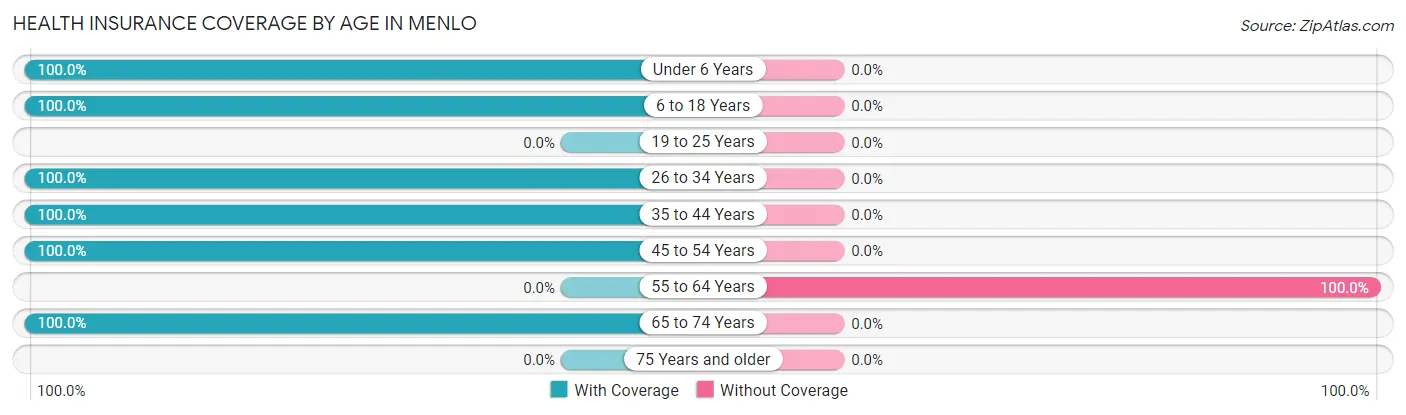
| Age Bracket | With Coverage | Without Coverage |
| Under 6 Years | 4 (100.0%) | 0 (0.0%) |
| 6 to 18 Years | 6 (100.0%) | 0 (0.0%) |
| 19 to 25 Years | 0 (0.0%) | 0 (0.0%) |
| 26 to 34 Years | 5 (100.0%) | 0 (0.0%) |
| 35 to 44 Years | 8 (100.0%) | 0 (0.0%) |
| 45 to 54 Years | 10 (100.0%) | 0 (0.0%) |
| 55 to 64 Years | 0 (0.0%) | 1 (100.0%) |
| 65 to 74 Years | 3 (100.0%) | 0 (0.0%) |
| 75 Years and older | 0 (0.0%) | 0 (0.0%) |
| Total | 36 (97.3%) | 1 (2.7%) |
Health Insurance Coverage by Citizenship Status in Menlo

| Citizenship Status | With Coverage | Without Coverage |
| Native Born | 4 (100.0%) | 0 (0.0%) |
| Foreign Born, Citizen | 6 (100.0%) | 0 (0.0%) |
| Foreign Born, not a Citizen | 0 (0.0%) | 0 (0.0%) |
Health Insurance Coverage by Household Income in Menlo
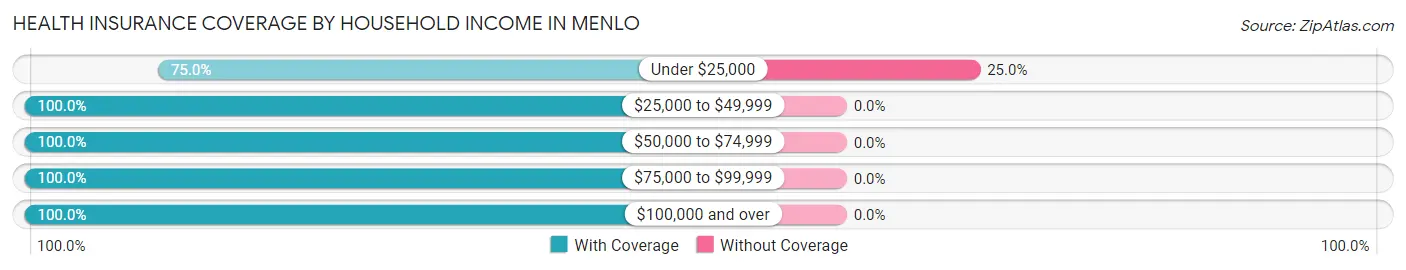
| Household Income | With Coverage | Without Coverage |
| Under $25,000 | 3 (75.0%) | 1 (25.0%) |
| $25,000 to $49,999 | 5 (100.0%) | 0 (0.0%) |
| $50,000 to $74,999 | 7 (100.0%) | 0 (0.0%) |
| $75,000 to $99,999 | 6 (100.0%) | 0 (0.0%) |
| $100,000 and over | 15 (100.0%) | 0 (0.0%) |
Public vs Private Health Insurance Coverage by Age in Menlo
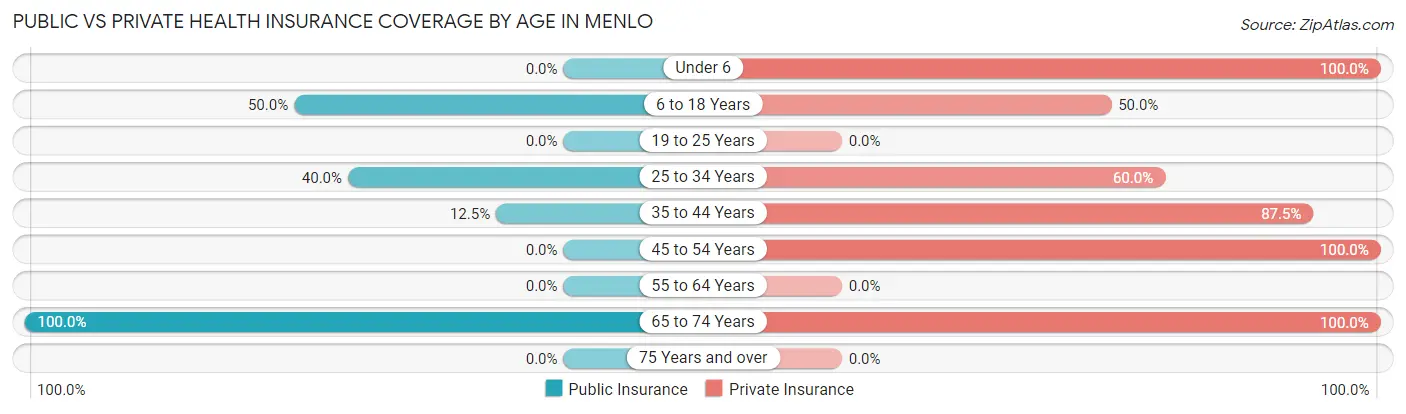
| Age Bracket | Public Insurance | Private Insurance |
| Under 6 | 0 (0.0%) | 4 (100.0%) |
| 6 to 18 Years | 3 (50.0%) | 3 (50.0%) |
| 19 to 25 Years | 0 (0.0%) | 0 (0.0%) |
| 25 to 34 Years | 2 (40.0%) | 3 (60.0%) |
| 35 to 44 Years | 1 (12.5%) | 7 (87.5%) |
| 45 to 54 Years | 0 (0.0%) | 10 (100.0%) |
| 55 to 64 Years | 0 (0.0%) | 0 (0.0%) |
| 65 to 74 Years | 3 (100.0%) | 3 (100.0%) |
| 75 Years and over | 0 (0.0%) | 0 (0.0%) |
| Total | 9 (24.3%) | 30 (81.1%) |
Disability Status by Sex by Age in Menlo
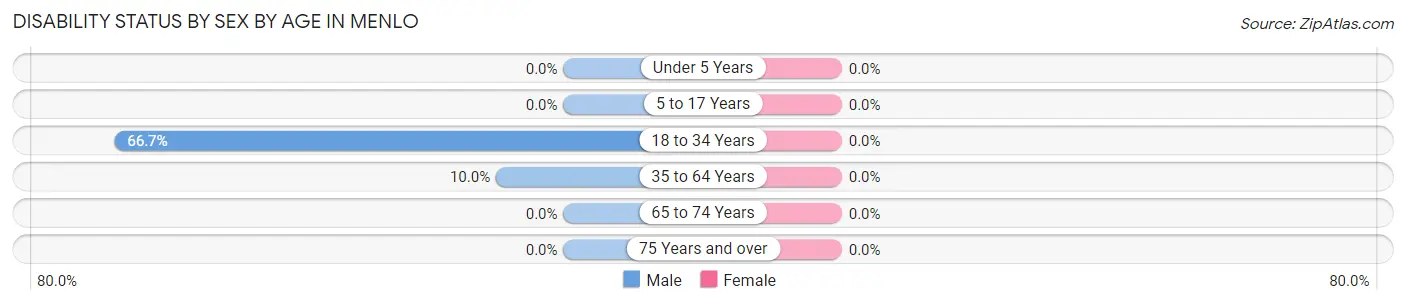
| Age Bracket | Male | Female |
| Under 5 Years | 0 (0.0%) | 0 (0.0%) |
| 5 to 17 Years | 0 (0.0%) | 0 (0.0%) |
| 18 to 34 Years | 2 (66.7%) | 0 (0.0%) |
| 35 to 64 Years | 1 (10.0%) | 0 (0.0%) |
| 65 to 74 Years | 0 (0.0%) | 0 (0.0%) |
| 75 Years and over | 0 (0.0%) | 0 (0.0%) |
Disability Class by Sex by Age in Menlo
Disability Class: Hearing Difficulty
| Age Bracket | Male | Female |
| Under 5 Years | 0 (0.0%) | 0 (0.0%) |
| 5 to 17 Years | 0 (0.0%) | 0 (0.0%) |
| 18 to 34 Years | 0 (0.0%) | 0 (0.0%) |
| 35 to 64 Years | 0 (0.0%) | 0 (0.0%) |
| 65 to 74 Years | 0 (0.0%) | 0 (0.0%) |
| 75 Years and over | 0 (0.0%) | 0 (0.0%) |
Disability Class: Vision Difficulty
| Age Bracket | Male | Female |
| Under 5 Years | 0 (0.0%) | 0 (0.0%) |
| 5 to 17 Years | 0 (0.0%) | 0 (0.0%) |
| 18 to 34 Years | 0 (0.0%) | 0 (0.0%) |
| 35 to 64 Years | 0 (0.0%) | 0 (0.0%) |
| 65 to 74 Years | 0 (0.0%) | 0 (0.0%) |
| 75 Years and over | 0 (0.0%) | 0 (0.0%) |
Disability Class: Cognitive Difficulty
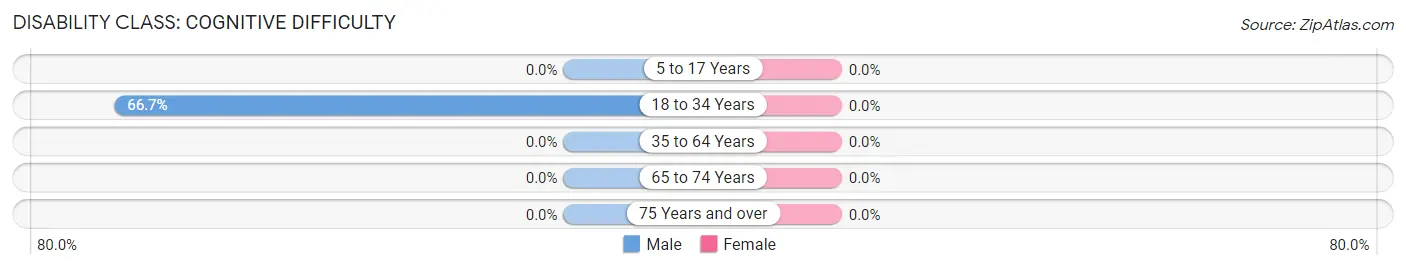
| Age Bracket | Male | Female |
| 5 to 17 Years | 0 (0.0%) | 0 (0.0%) |
| 18 to 34 Years | 2 (66.7%) | 0 (0.0%) |
| 35 to 64 Years | 0 (0.0%) | 0 (0.0%) |
| 65 to 74 Years | 0 (0.0%) | 0 (0.0%) |
| 75 Years and over | 0 (0.0%) | 0 (0.0%) |
Disability Class: Ambulatory Difficulty
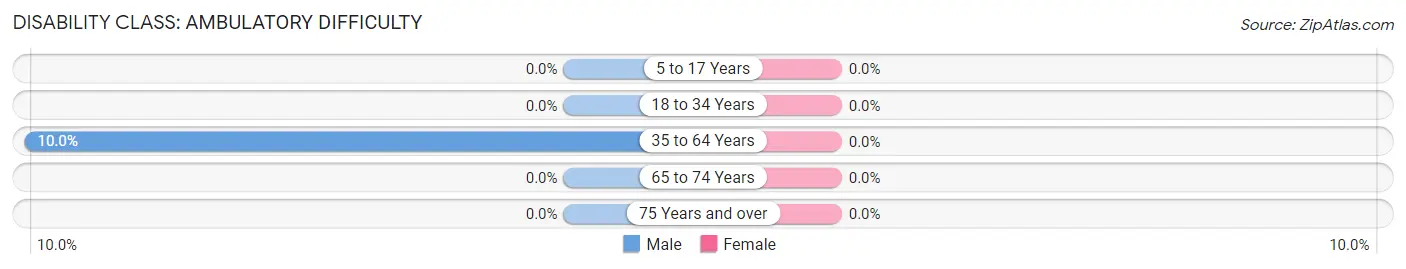
| Age Bracket | Male | Female |
| 5 to 17 Years | 0 (0.0%) | 0 (0.0%) |
| 18 to 34 Years | 0 (0.0%) | 0 (0.0%) |
| 35 to 64 Years | 1 (10.0%) | 0 (0.0%) |
| 65 to 74 Years | 0 (0.0%) | 0 (0.0%) |
| 75 Years and over | 0 (0.0%) | 0 (0.0%) |
Disability Class: Self-Care Difficulty
| Age Bracket | Male | Female |
| 5 to 17 Years | 0 (0.0%) | 0 (0.0%) |
| 18 to 34 Years | 0 (0.0%) | 0 (0.0%) |
| 35 to 64 Years | 0 (0.0%) | 0 (0.0%) |
| 65 to 74 Years | 0 (0.0%) | 0 (0.0%) |
| 75 Years and over | 0 (0.0%) | 0 (0.0%) |
Technology Access in Menlo
Computing Device Access in Menlo
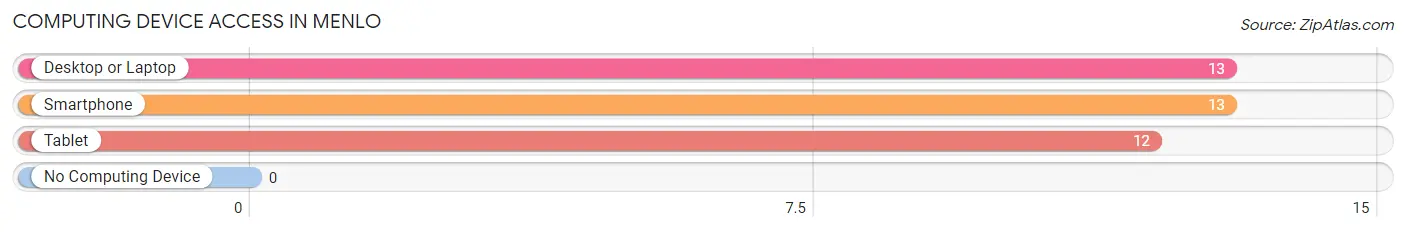
| Device Type | # Households | % Households |
| Desktop or Laptop | 13 | 92.9% |
| Smartphone | 13 | 92.9% |
| Tablet | 12 | 85.7% |
| No Computing Device | 0 | 0.0% |
| Total | 14 | 100.0% |
Internet Access in Menlo
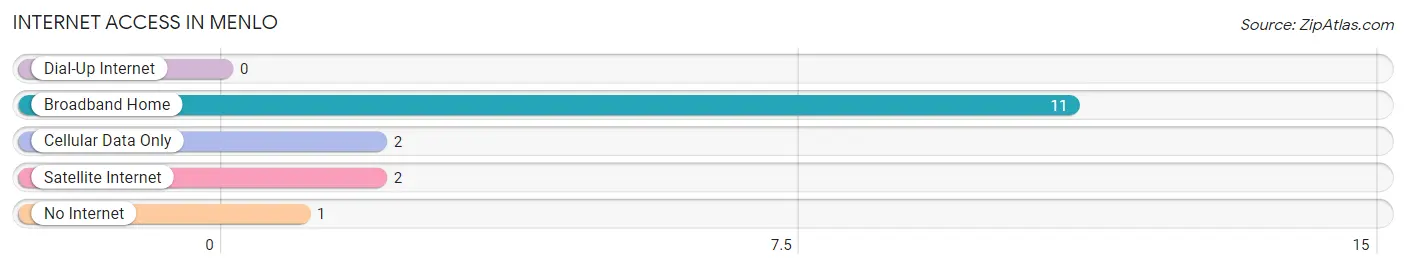
| Internet Type | # Households | % Households |
| Dial-Up Internet | 0 | 0.0% |
| Broadband Home | 11 | 78.6% |
| Cellular Data Only | 2 | 14.3% |
| Satellite Internet | 2 | 14.3% |
| No Internet | 1 | 7.1% |
| Total | 14 | 100.0% |
Menlo Summary
Menlo, Kansas is a small town located in the northwest corner of the state, in the county of Sherman. It is situated on the banks of the Little Arkansas River, and is surrounded by rolling hills and prairies. The town was founded in 1887, and has a population of just over 500 people.
Menlo is located in the heart of the Great Plains, and is part of the Great Plains region of the United States. The town is situated in an area of the state that is known for its agricultural production, and is home to a variety of crops, including wheat, corn, and soybeans. The town is also home to a variety of livestock, including cattle, sheep, and hogs.
The geography of Menlo is characterized by its flat terrain, with the Little Arkansas River running through the town. The town is located in an area of the state that is known for its mild climate, with temperatures ranging from the mid-30s in the winter to the mid-80s in the summer. The town is also located in an area of the state that is known for its strong winds, which can reach up to 50 miles per hour.
The economy of Menlo is largely based on agriculture, with the town being home to a variety of farms and ranches. The town is also home to a variety of small businesses, including a grocery store, a hardware store, and a few restaurants. The town is also home to a variety of services, including a post office, a bank, and a library.
The demographics of Menlo are largely made up of white residents, with a small percentage of African American and Hispanic residents. The town is also home to a variety of religious denominations, including Baptist, Methodist, and Catholic. The town is also home to a variety of educational institutions, including a public school system, a community college, and a technical college.
Menlo is a small town with a rich history and a strong sense of community. The town is home to a variety of businesses and services, and is a great place to live and work. The town is also home to a variety of recreational activities, including fishing, hunting, and camping. The town is also home to a variety of cultural events, including the annual Menlo Days Festival. Menlo is a great place to live and work, and is a great place to raise a family.
Common Questions
What is Per Capita Income in Menlo?
Per Capita income in Menlo is $149,668.
What is Income or Wage Gap in Menlo?
Income or Wage Gap in Menlo is 80.9%.
Women in Menlo earn 19.1 cents for every dollar earned by a man.
What is Inequality or Gini Index in Menlo?
Inequality or Gini Index in Menlo is 0.59.
What is the Total Population of Menlo?
Total Population of Menlo is 37.
What is the Total Male Population of Menlo?
Total Male Population of Menlo is 22.
What is the Total Female Population of Menlo?
Total Female Population of Menlo is 15.
What is the Ratio of Males per 100 Females in Menlo?
There are 146.67 Males per 100 Females in Menlo.
What is the Ratio of Females per 100 Males in Menlo?
There are 68.18 Females per 100 Males in Menlo.
What is the Median Population Age in Menlo?
Median Population Age in Menlo is 44.1 Years.
What is the Average Family Size in Menlo
Average Family Size in Menlo is 2.8 People.
What is the Average Household Size in Menlo
Average Household Size in Menlo is 2.6 People.
How Large is the Labor Force in Menlo?
There are 21 People in the Labor Forcein in Menlo.
What is the Percentage of People in the Labor Force in Menlo?
67.7% of People are in the Labor Force in Menlo.