Sublette, KS Map & Demographics
Sublette Map
Sublette Overview
$34,741
PER CAPITA INCOME
$107,734
AVG FAMILY INCOME
$66,354
AVG HOUSEHOLD INCOME
42.6%
WAGE / INCOME GAP [ % ]
57.4¢/ $1
WAGE / INCOME GAP [ $ ]
0.39
INEQUALITY / GINI INDEX
1,385
TOTAL POPULATION
672
MALE POPULATION
713
FEMALE POPULATION
94.25
MALES / 100 FEMALES
106.10
FEMALES / 100 MALES
37.6
MEDIAN AGE
3.3
AVG FAMILY SIZE
2.7
AVG HOUSEHOLD SIZE
675
LABOR FORCE [ PEOPLE ]
63.0%
PERCENT IN LABOR FORCE
Sublette Zip Codes
Sublette Area Codes
Income in Sublette
Income Overview in Sublette
Per Capita Income in Sublette is $34,741, while median incomes of families and households are $107,734 and $66,354 respectively.
| Characteristic | Number | Measure |
| Per Capita Income | 1,385 | $34,741 |
| Median Family Income | 347 | $107,734 |
| Mean Family Income | 347 | $109,792 |
| Median Household Income | 517 | $66,354 |
| Mean Household Income | 517 | $89,522 |
| Income Deficit | 347 | $0 |
| Wage / Income Gap (%) | 1,385 | 42.57% |
| Wage / Income Gap ($) | 1,385 | 57.43¢ per $1 |
| Gini / Inequality Index | 1,385 | 0.39 |
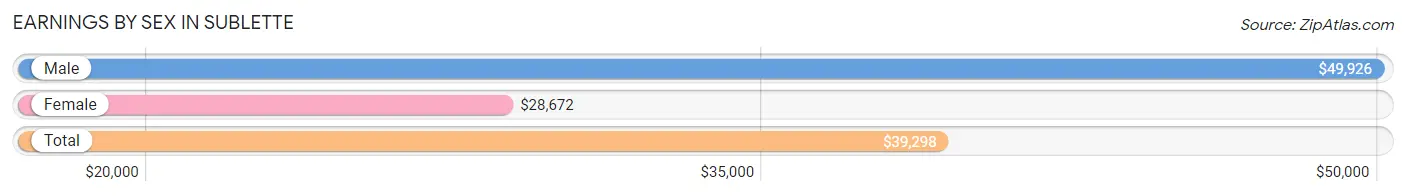
Earnings by Sex in Sublette
Average Earnings in Sublette are $39,298, $49,926 for men and $28,672 for women, a difference of 42.6%.
| Sex | Number | Average Earnings |
| Male | 403 (54.9%) | $49,926 |
| Female | 331 (45.1%) | $28,672 |
| Total | 734 (100.0%) | $39,298 |
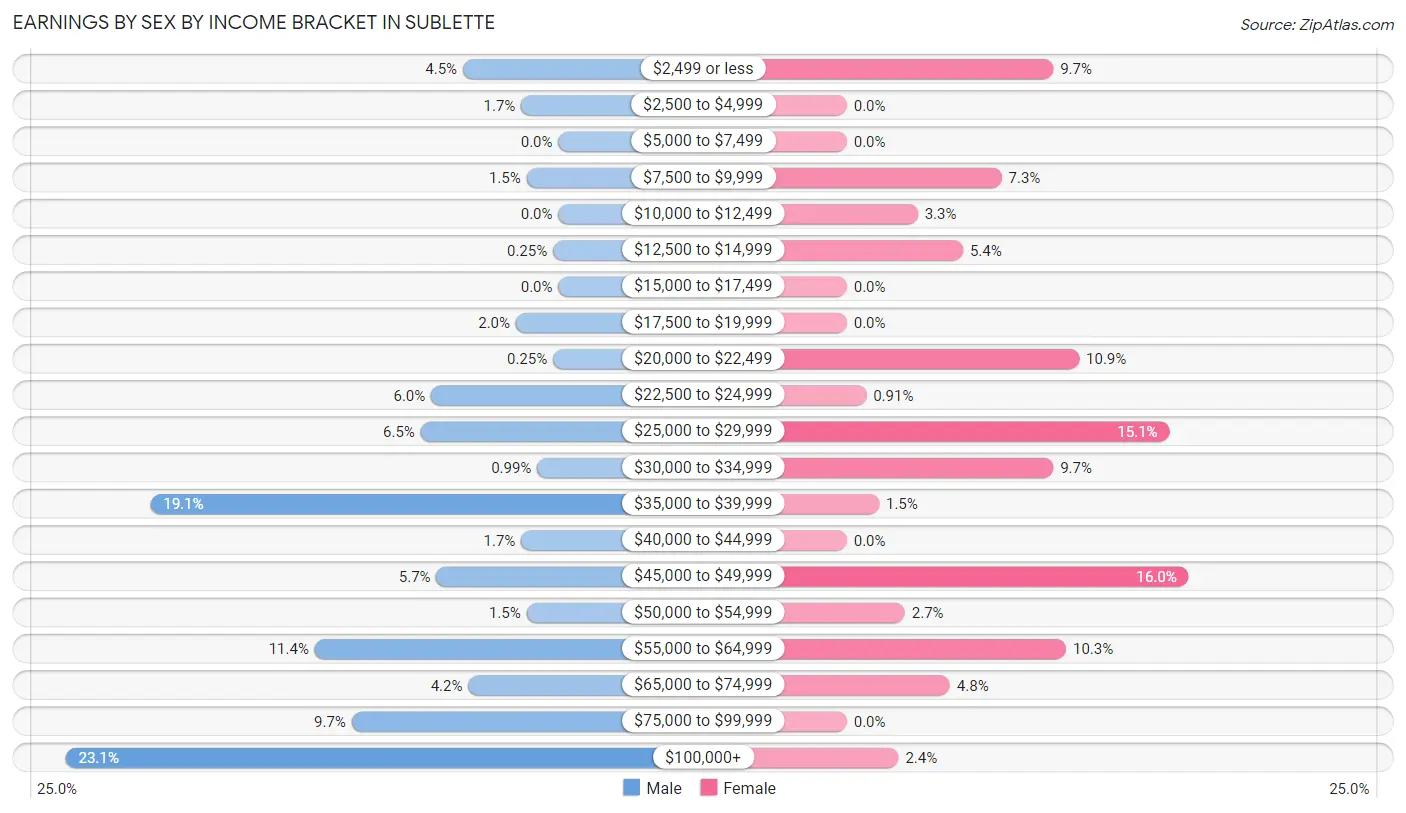
Earnings by Sex by Income Bracket in Sublette
The most common earnings brackets in Sublette are $100,000+ for men (93 | 23.1%) and $45,000 to $49,999 for women (53 | 16.0%).
| Income | Male | Female |
| $2,499 or less | 18 (4.5%) | 32 (9.7%) |
| $2,500 to $4,999 | 7 (1.7%) | 0 (0.0%) |
| $5,000 to $7,499 | 0 (0.0%) | 0 (0.0%) |
| $7,500 to $9,999 | 6 (1.5%) | 24 (7.2%) |
| $10,000 to $12,499 | 0 (0.0%) | 11 (3.3%) |
| $12,500 to $14,999 | 1 (0.3%) | 18 (5.4%) |
| $15,000 to $17,499 | 0 (0.0%) | 0 (0.0%) |
| $17,500 to $19,999 | 8 (2.0%) | 0 (0.0%) |
| $20,000 to $22,499 | 1 (0.3%) | 36 (10.9%) |
| $22,500 to $24,999 | 24 (6.0%) | 3 (0.9%) |
| $25,000 to $29,999 | 26 (6.5%) | 50 (15.1%) |
| $30,000 to $34,999 | 4 (1.0%) | 32 (9.7%) |
| $35,000 to $39,999 | 77 (19.1%) | 5 (1.5%) |
| $40,000 to $44,999 | 7 (1.7%) | 0 (0.0%) |
| $45,000 to $49,999 | 23 (5.7%) | 53 (16.0%) |
| $50,000 to $54,999 | 6 (1.5%) | 9 (2.7%) |
| $55,000 to $64,999 | 46 (11.4%) | 34 (10.3%) |
| $65,000 to $74,999 | 17 (4.2%) | 16 (4.8%) |
| $75,000 to $99,999 | 39 (9.7%) | 0 (0.0%) |
| $100,000+ | 93 (23.1%) | 8 (2.4%) |
| Total | 403 (100.0%) | 331 (100.0%) |
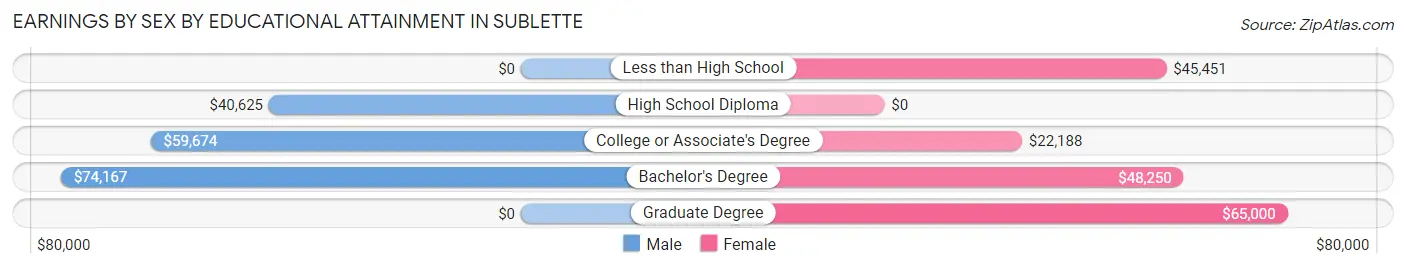
Earnings by Sex by Educational Attainment in Sublette
Average earnings in Sublette are $57,609 for men and $29,609 for women, a difference of 48.6%. Men with an educational attainment of bachelor's degree enjoy the highest average annual earnings of $74,167, while those with high school diploma education earn the least with $40,625. Women with an educational attainment of graduate degree earn the most with the average annual earnings of $65,000, while those with college or associate's degree education have the smallest earnings of $22,188.
| Educational Attainment | Male Income | Female Income |
| Less than High School | - | - |
| High School Diploma | $40,625 | $0 |
| College or Associate's Degree | $59,674 | $22,188 |
| Bachelor's Degree | $74,167 | $48,250 |
| Graduate Degree | - | - |
| Total | $57,609 | $29,609 |
Family Income in Sublette
Family Income Brackets in Sublette
According to the Sublette family income data, there are 133 families falling into the $100,000 to $149,999 income range, which is the most common income bracket and makes up 38.3% of all families.
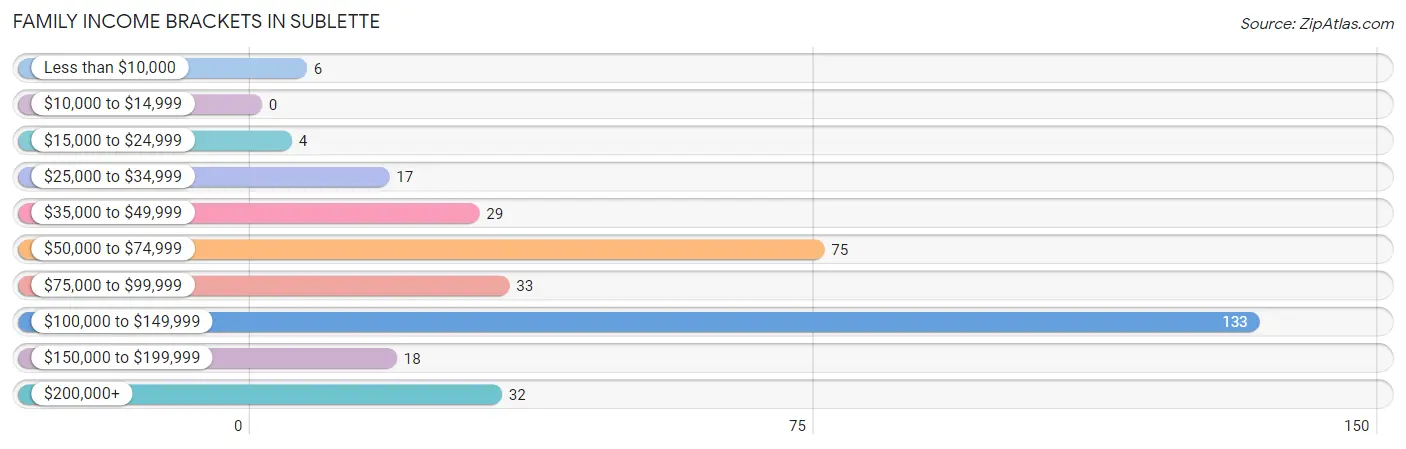
| Income Bracket | # Families | % Families |
| Less than $10,000 | 6 | 1.7% |
| $10,000 to $14,999 | 0 | 0.0% |
| $15,000 to $24,999 | 4 | 1.2% |
| $25,000 to $34,999 | 17 | 4.9% |
| $35,000 to $49,999 | 29 | 8.4% |
| $50,000 to $74,999 | 75 | 21.6% |
| $75,000 to $99,999 | 33 | 9.5% |
| $100,000 to $149,999 | 133 | 38.3% |
| $150,000 to $199,999 | 18 | 5.2% |
| $200,000+ | 32 | 9.2% |
Family Income by Famaliy Size in Sublette
3-person families (77 | 22.2%) account for the highest median family income in Sublette with $121,146 per family, while 2-person families (180 | 51.9%) have the highest median income of $41,666 per family member.
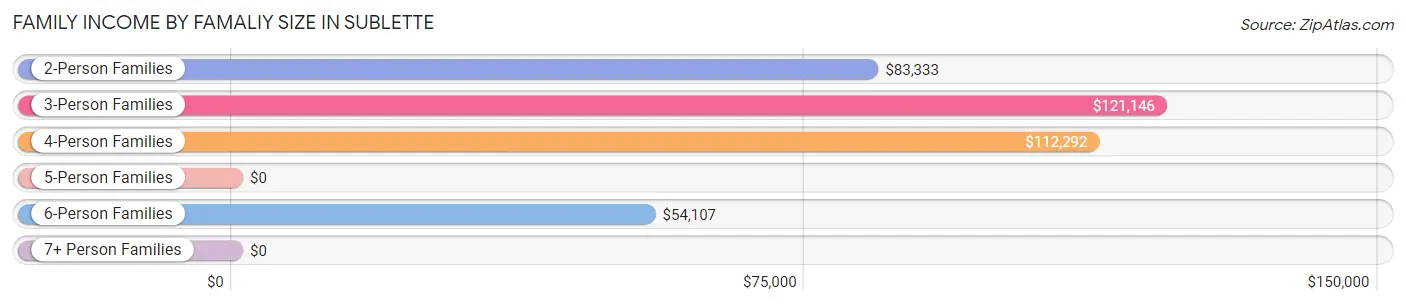
| Income Bracket | # Families | Median Income |
| 2-Person Families | 180 (51.9%) | $83,333 |
| 3-Person Families | 77 (22.2%) | $121,146 |
| 4-Person Families | 73 (21.0%) | $112,292 |
| 5-Person Families | 8 (2.3%) | $0 |
| 6-Person Families | 9 (2.6%) | $54,107 |
| 7+ Person Families | 0 (0.0%) | $0 |
| Total | 347 (100.0%) | $107,734 |
Family Income by Number of Earners in Sublette
The median family income in Sublette is $107,734, with families comprising 2 earners (167) having the highest median family income of $121,726, while families with 1 earner (93) have the lowest median family income of $60,893, accounting for 48.1% and 26.8% of families, respectively.
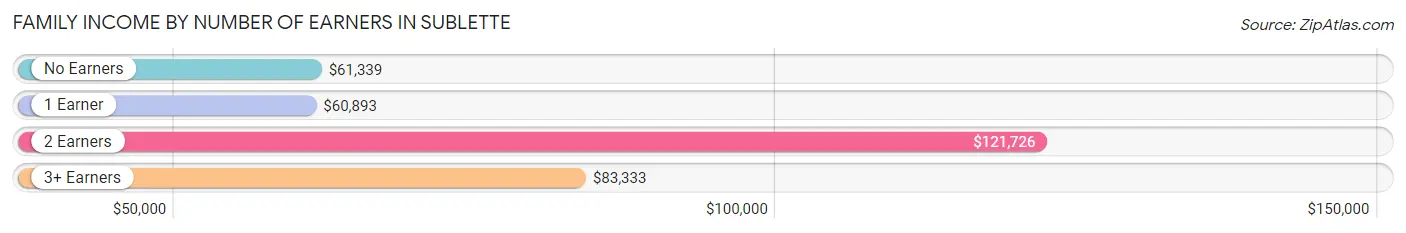
| Number of Earners | # Families | Median Income |
| No Earners | 63 (18.2%) | $61,339 |
| 1 Earner | 93 (26.8%) | $60,893 |
| 2 Earners | 167 (48.1%) | $121,726 |
| 3+ Earners | 24 (6.9%) | $83,333 |
| Total | 347 (100.0%) | $107,734 |
Household Income in Sublette
Household Income Brackets in Sublette
With 136 households falling in the category, the $100,000 to $149,999 income range is the most frequent in Sublette, accounting for 26.3% of all households. In contrast, only 9 households (1.7%) fall into the $15,000 to $24,999 income bracket, making it the least populous group.
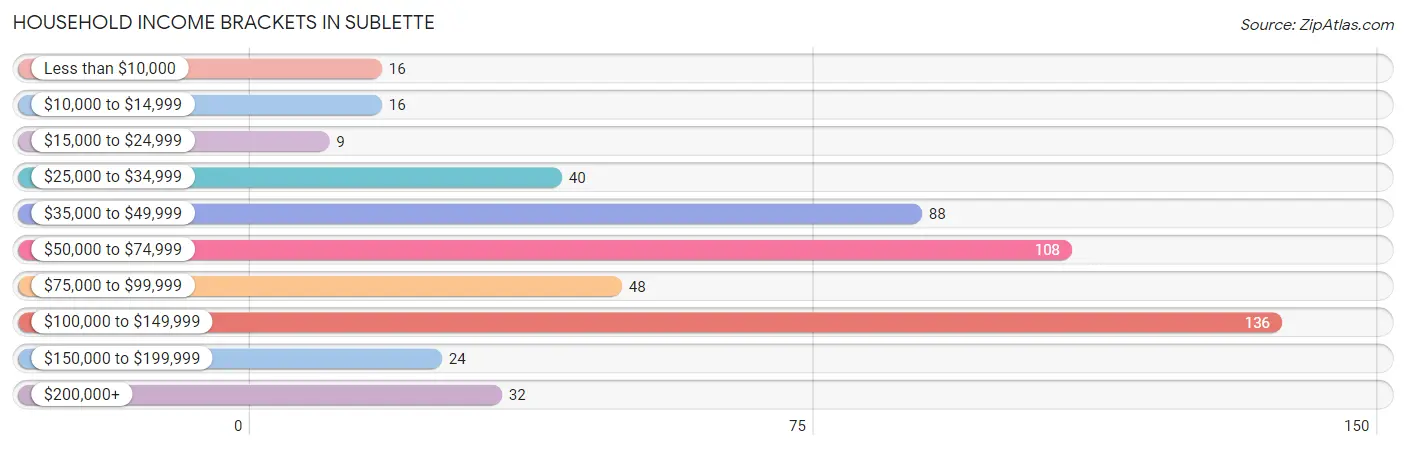
| Income Bracket | # Households | % Households |
| Less than $10,000 | 16 | 3.1% |
| $10,000 to $14,999 | 16 | 3.1% |
| $15,000 to $24,999 | 9 | 1.7% |
| $25,000 to $34,999 | 40 | 7.7% |
| $35,000 to $49,999 | 88 | 17.0% |
| $50,000 to $74,999 | 108 | 20.9% |
| $75,000 to $99,999 | 48 | 9.3% |
| $100,000 to $149,999 | 136 | 26.3% |
| $150,000 to $199,999 | 24 | 4.6% |
| $200,000+ | 32 | 6.2% |
Household Income by Householder Age in Sublette
The median household income in Sublette is $66,354, with the highest median household income of $92,500 found in the 25 to 44 years age bracket for the primary householder. A total of 150 households (29.0%) fall into this category. Meanwhile, the 15 to 24 years age bracket for the primary householder has the lowest median household income of $0, with 20 households (3.9%) in this group.
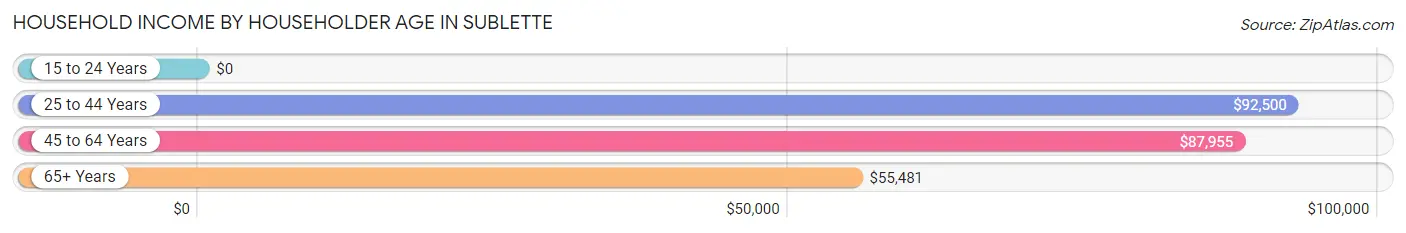
| Income Bracket | # Households | Median Income |
| 15 to 24 Years | 20 (3.9%) | $0 |
| 25 to 44 Years | 150 (29.0%) | $92,500 |
| 45 to 64 Years | 182 (35.2%) | $87,955 |
| 65+ Years | 165 (31.9%) | $55,481 |
| Total | 517 (100.0%) | $66,354 |
Poverty in Sublette
Income Below Poverty by Sex and Age in Sublette
With 13.0% poverty level for males and 13.0% for females among the residents of Sublette, 12 to 14 year old males and 18 to 24 year old females are the most vulnerable to poverty, with 3 males (100.0%) and 42 females (57.5%) in their respective age groups living below the poverty level.
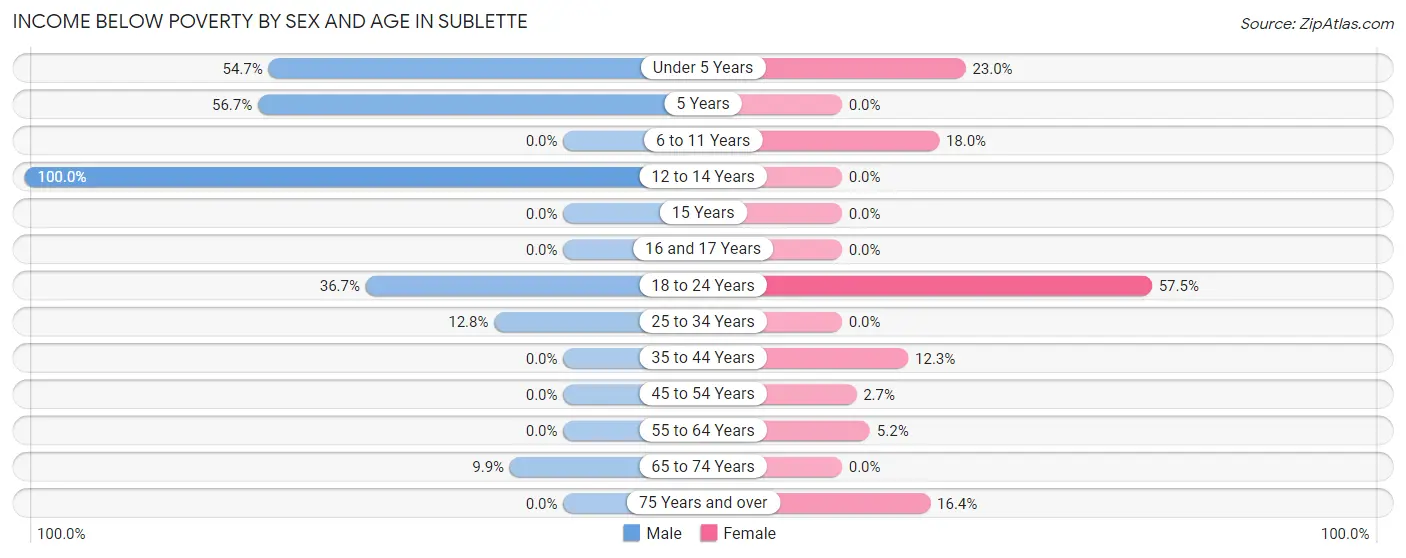
| Age Bracket | Male | Female |
| Under 5 Years | 29 (54.7%) | 14 (23.0%) |
| 5 Years | 17 (56.7%) | 0 (0.0%) |
| 6 to 11 Years | 0 (0.0%) | 11 (18.0%) |
| 12 to 14 Years | 3 (100.0%) | 0 (0.0%) |
| 15 Years | 0 (0.0%) | 0 (0.0%) |
| 16 and 17 Years | 0 (0.0%) | 0 (0.0%) |
| 18 to 24 Years | 11 (36.7%) | 42 (57.5%) |
| 25 to 34 Years | 15 (12.8%) | 0 (0.0%) |
| 35 to 44 Years | 0 (0.0%) | 8 (12.3%) |
| 45 to 54 Years | 0 (0.0%) | 2 (2.7%) |
| 55 to 64 Years | 0 (0.0%) | 6 (5.2%) |
| 65 to 74 Years | 11 (9.9%) | 0 (0.0%) |
| 75 Years and over | 0 (0.0%) | 10 (16.4%) |
| Total | 86 (13.0%) | 93 (13.0%) |
Income Above Poverty by Sex and Age in Sublette
According to the poverty statistics in Sublette, males aged 6 to 11 years and females aged 12 to 14 years are the age groups that are most secure financially, with 100.0% of males and 100.0% of females in these age groups living above the poverty line.
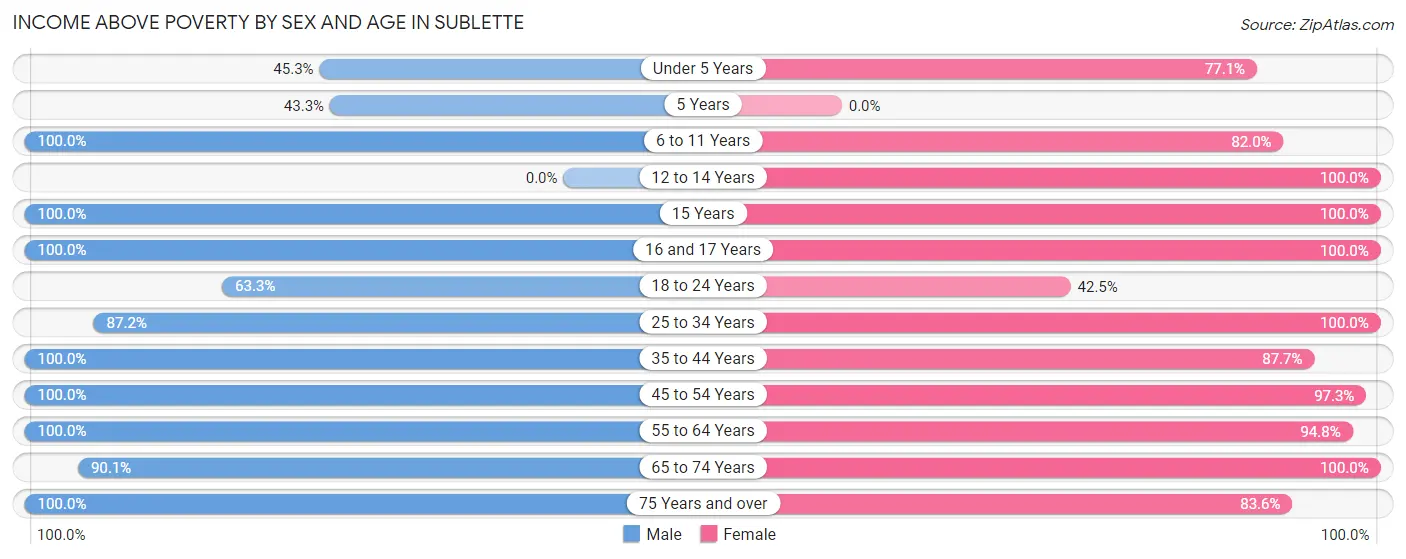
| Age Bracket | Male | Female |
| Under 5 Years | 24 (45.3%) | 47 (77.0%) |
| 5 Years | 13 (43.3%) | 0 (0.0%) |
| 6 to 11 Years | 23 (100.0%) | 50 (82.0%) |
| 12 to 14 Years | 0 (0.0%) | 19 (100.0%) |
| 15 Years | 52 (100.0%) | 11 (100.0%) |
| 16 and 17 Years | 9 (100.0%) | 11 (100.0%) |
| 18 to 24 Years | 19 (63.3%) | 31 (42.5%) |
| 25 to 34 Years | 102 (87.2%) | 101 (100.0%) |
| 35 to 44 Years | 100 (100.0%) | 57 (87.7%) |
| 45 to 54 Years | 61 (100.0%) | 73 (97.3%) |
| 55 to 64 Years | 47 (100.0%) | 109 (94.8%) |
| 65 to 74 Years | 100 (90.1%) | 60 (100.0%) |
| 75 Years and over | 25 (100.0%) | 51 (83.6%) |
| Total | 575 (87.0%) | 620 (87.0%) |
Income Below Poverty Among Married-Couple Families in Sublette
The poverty statistics for married-couple families in Sublette show that 1.3% or 4 of the total 321 families live below the poverty line. Families with 1 or 2 children have the highest poverty rate of 4.1%, comprising of 4 families. On the other hand, families with no children have the lowest poverty rate of 0.0%, which includes 0 families.
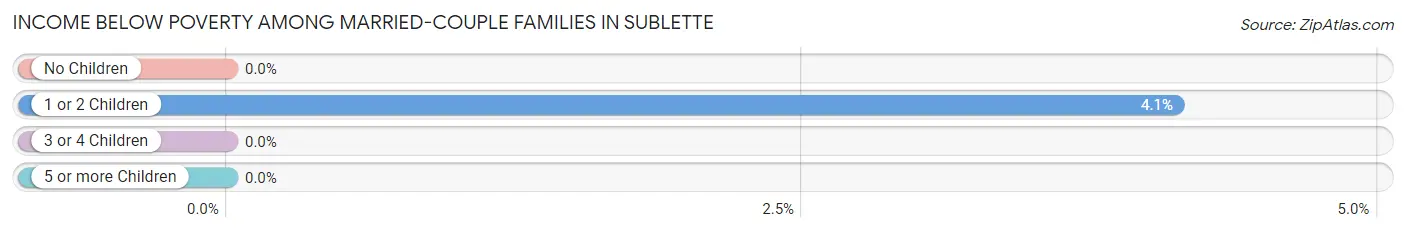
| Children | Above Poverty | Below Poverty |
| No Children | 209 (100.0%) | 0 (0.0%) |
| 1 or 2 Children | 93 (95.9%) | 4 (4.1%) |
| 3 or 4 Children | 15 (100.0%) | 0 (0.0%) |
| 5 or more Children | 0 (0.0%) | 0 (0.0%) |
| Total | 317 (98.8%) | 4 (1.3%) |
Income Below Poverty Among Single-Parent Households in Sublette
According to the poverty data in Sublette, 84.6% or 11 single-father households and 61.5% or 8 single-mother households are living below the poverty line. Among single-father households, those with 3 or 4 children have the highest poverty rate, with 11 households (100.0%) experiencing poverty. Likewise, among single-mother households, those with no children have the highest poverty rate, with 6 households (66.7%) falling below the poverty line.
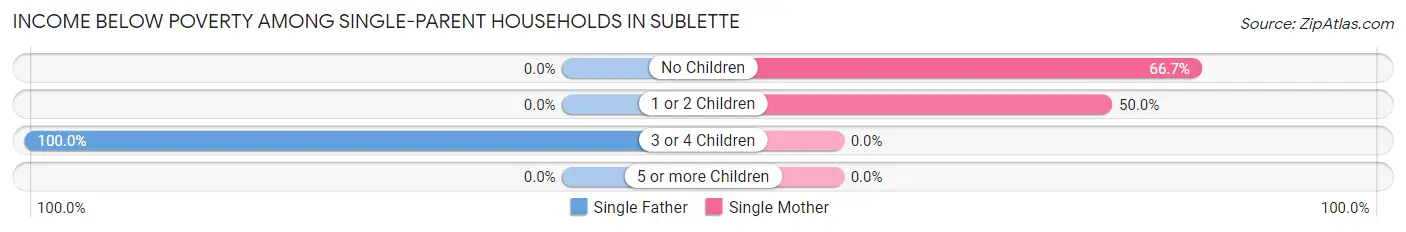
| Children | Single Father | Single Mother |
| No Children | 0 (0.0%) | 6 (66.7%) |
| 1 or 2 Children | 0 (0.0%) | 2 (50.0%) |
| 3 or 4 Children | 11 (100.0%) | 0 (0.0%) |
| 5 or more Children | 0 (0.0%) | 0 (0.0%) |
| Total | 11 (84.6%) | 8 (61.5%) |
Income Below Poverty Among Married-Couple vs Single-Parent Households in Sublette
The poverty data for Sublette shows that 4 of the married-couple family households (1.3%) and 19 of the single-parent households (73.1%) are living below the poverty level. Within the married-couple family households, those with 1 or 2 children have the highest poverty rate, with 4 households (4.1%) falling below the poverty line. Among the single-parent households, those with 3 or 4 children have the highest poverty rate, with 11 household (100.0%) living below poverty.
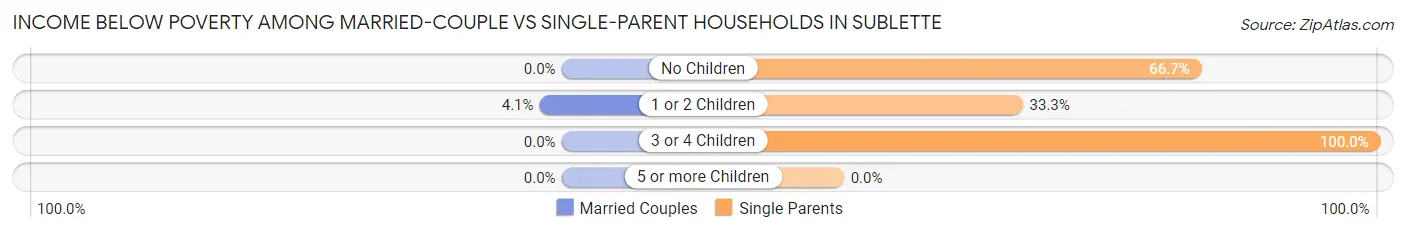
| Children | Married-Couple Families | Single-Parent Households |
| No Children | 0 (0.0%) | 6 (66.7%) |
| 1 or 2 Children | 4 (4.1%) | 2 (33.3%) |
| 3 or 4 Children | 0 (0.0%) | 11 (100.0%) |
| 5 or more Children | 0 (0.0%) | 0 (0.0%) |
| Total | 4 (1.3%) | 19 (73.1%) |
Race in Sublette
The most populous races in Sublette are White / Caucasian (908 | 65.6%), Hispanic or Latino (474 | 34.2%), and Some other Race (261 | 18.8%).
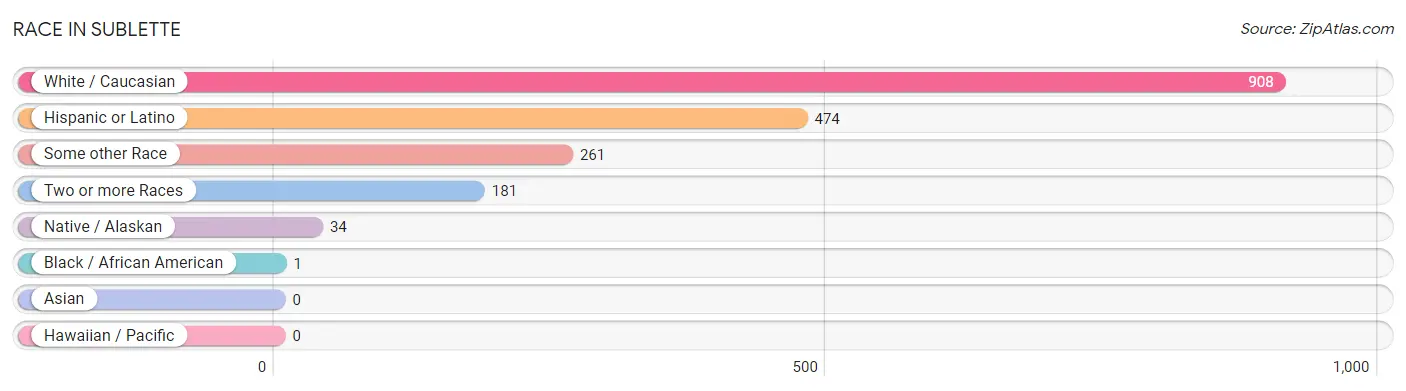
| Race | # Population | % Population |
| Asian | 0 | 0.0% |
| Black / African American | 1 | 0.1% |
| Hawaiian / Pacific | 0 | 0.0% |
| Hispanic or Latino | 474 | 34.2% |
| Native / Alaskan | 34 | 2.5% |
| White / Caucasian | 908 | 65.6% |
| Two or more Races | 181 | 13.1% |
| Some other Race | 261 | 18.8% |
| Total | 1,385 | 100.0% |
Ancestry in Sublette
The most populous ancestries reported in Sublette are Mexican (468 | 33.8%), German (312 | 22.5%), Irish (81 | 5.9%), English (62 | 4.5%), and Pennsylvania German (60 | 4.3%), together accounting for 71.0% of all Sublette residents.
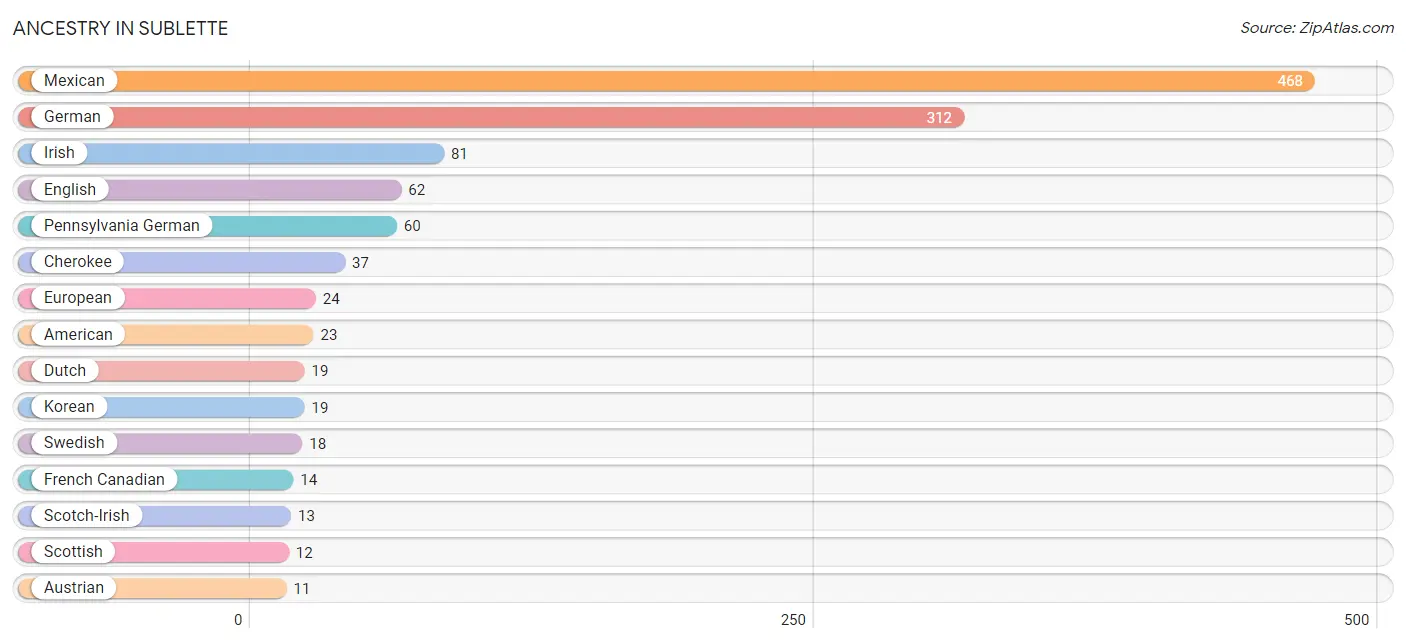
| Ancestry | # Population | % Population |
| American | 23 | 1.7% |
| Austrian | 11 | 0.8% |
| British | 6 | 0.4% |
| Central American | 6 | 0.4% |
| Cherokee | 37 | 2.7% |
| Cheyenne | 7 | 0.5% |
| Choctaw | 6 | 0.4% |
| Czech | 7 | 0.5% |
| Danish | 9 | 0.6% |
| Dutch | 19 | 1.4% |
| English | 62 | 4.5% |
| European | 24 | 1.7% |
| French | 2 | 0.1% |
| French Canadian | 14 | 1.0% |
| German | 312 | 22.5% |
| Honduran | 6 | 0.4% |
| Irish | 81 | 5.9% |
| Italian | 3 | 0.2% |
| Korean | 19 | 1.4% |
| Mexican | 468 | 33.8% |
| Navajo | 8 | 0.6% |
| Norwegian | 2 | 0.1% |
| Pennsylvania German | 60 | 4.3% |
| Russian | 1 | 0.1% |
| Scotch-Irish | 13 | 0.9% |
| Scottish | 12 | 0.9% |
| Sioux | 8 | 0.6% |
| Swedish | 18 | 1.3% |
| Welsh | 6 | 0.4% | View All 29 Rows |
Immigrants in Sublette
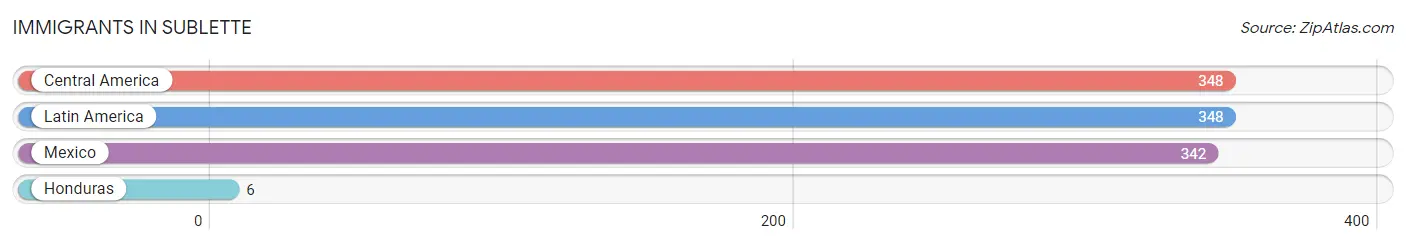
The most numerous immigrant groups reported in Sublette came from Central America (348 | 25.1%), Latin America (348 | 25.1%), Mexico (342 | 24.7%), and Honduras (6 | 0.4%), together accounting for 75.4% of all Sublette residents.
| Immigration Origin | # Population | % Population |
| Central America | 348 | 25.1% |
| Honduras | 6 | 0.4% |
| Latin America | 348 | 25.1% |
| Mexico | 342 | 24.7% | View All 4 Rows |
Sex and Age in Sublette
Sex and Age in Sublette
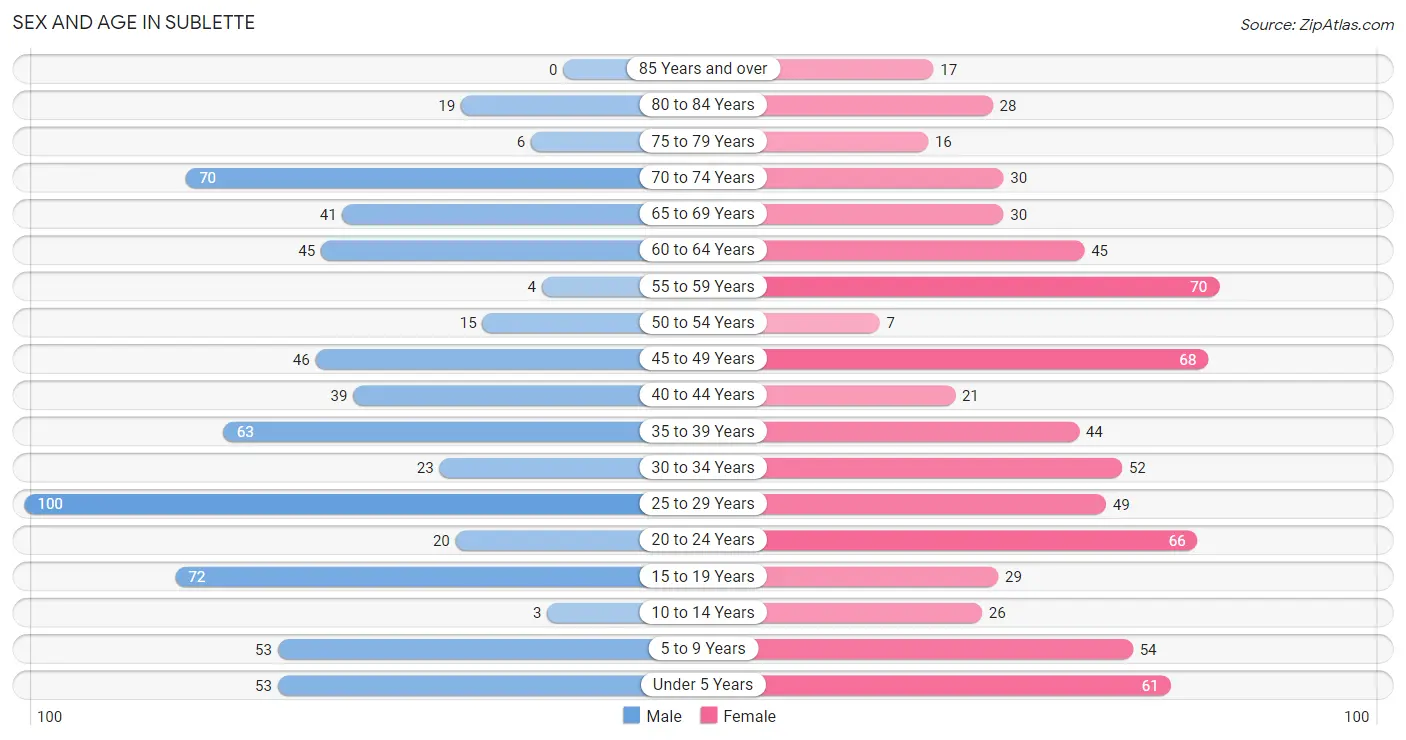
The most populous age groups in Sublette are 25 to 29 Years (100 | 14.9%) for men and 55 to 59 Years (70 | 9.8%) for women.
| Age Bracket | Male | Female |
| Under 5 Years | 53 (7.9%) | 61 (8.6%) |
| 5 to 9 Years | 53 (7.9%) | 54 (7.6%) |
| 10 to 14 Years | 3 (0.4%) | 26 (3.6%) |
| 15 to 19 Years | 72 (10.7%) | 29 (4.1%) |
| 20 to 24 Years | 20 (3.0%) | 66 (9.3%) |
| 25 to 29 Years | 100 (14.9%) | 49 (6.9%) |
| 30 to 34 Years | 23 (3.4%) | 52 (7.3%) |
| 35 to 39 Years | 63 (9.4%) | 44 (6.2%) |
| 40 to 44 Years | 39 (5.8%) | 21 (2.9%) |
| 45 to 49 Years | 46 (6.9%) | 68 (9.5%) |
| 50 to 54 Years | 15 (2.2%) | 7 (1.0%) |
| 55 to 59 Years | 4 (0.6%) | 70 (9.8%) |
| 60 to 64 Years | 45 (6.7%) | 45 (6.3%) |
| 65 to 69 Years | 41 (6.1%) | 30 (4.2%) |
| 70 to 74 Years | 70 (10.4%) | 30 (4.2%) |
| 75 to 79 Years | 6 (0.9%) | 16 (2.2%) |
| 80 to 84 Years | 19 (2.8%) | 28 (3.9%) |
| 85 Years and over | 0 (0.0%) | 17 (2.4%) |
| Total | 672 (100.0%) | 713 (100.0%) |
Families and Households in Sublette
Median Family Size in Sublette
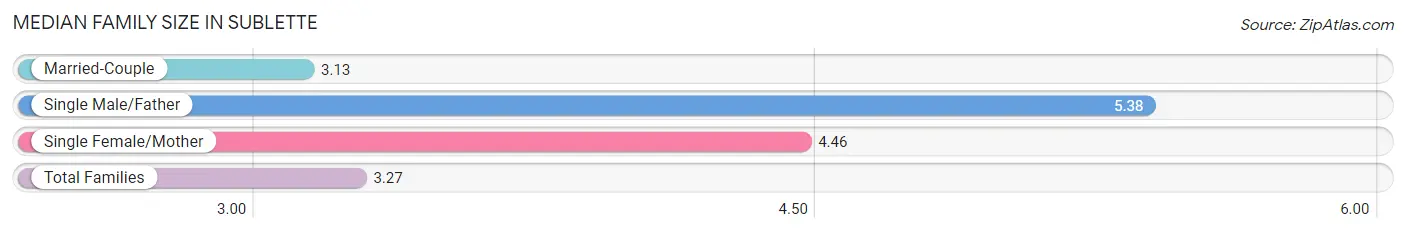
The median family size in Sublette is 3.27 persons per family, with single male/father families (13 | 3.7%) accounting for the largest median family size of 5.38 persons per family. On the other hand, married-couple families (321 | 92.5%) represent the smallest median family size with 3.13 persons per family.
| Family Type | # Families | Family Size |
| Married-Couple | 321 (92.5%) | 3.13 |
| Single Male/Father | 13 (3.7%) | 5.38 |
| Single Female/Mother | 13 (3.7%) | 4.46 |
| Total Families | 347 (100.0%) | 3.27 |
Median Household Size in Sublette
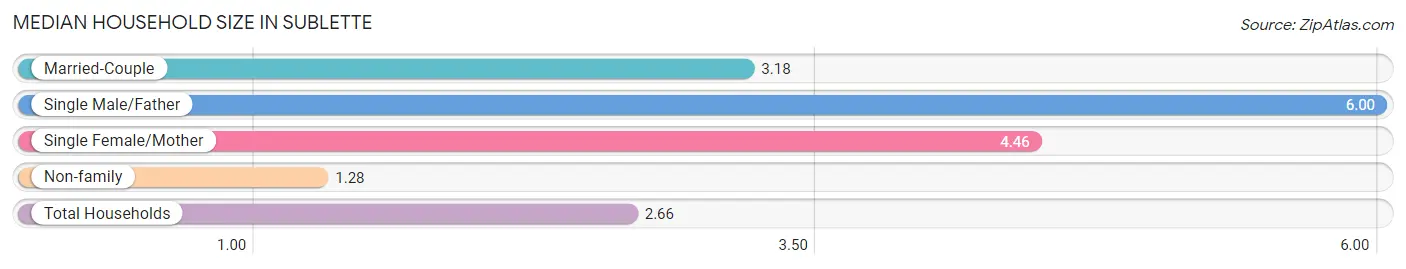
The median household size in Sublette is 2.66 persons per household, with single male/father households (13 | 2.5%) accounting for the largest median household size of 6 persons per household. non-family households (170 | 32.9%) represent the smallest median household size with 1.28 persons per household.
| Household Type | # Households | Household Size |
| Married-Couple | 321 (62.1%) | 3.18 |
| Single Male/Father | 13 (2.5%) | 6.00 |
| Single Female/Mother | 13 (2.5%) | 4.46 |
| Non-family | 170 (32.9%) | 1.28 |
| Total Households | 517 (100.0%) | 2.66 |
Household Size by Marriage Status in Sublette
Out of a total of 517 households in Sublette, 347 (67.1%) are family households, while 170 (32.9%) are nonfamily households. The most numerous type of family households are 2-person households, comprising 169, and the most common type of nonfamily households are 1-person households, comprising 139.
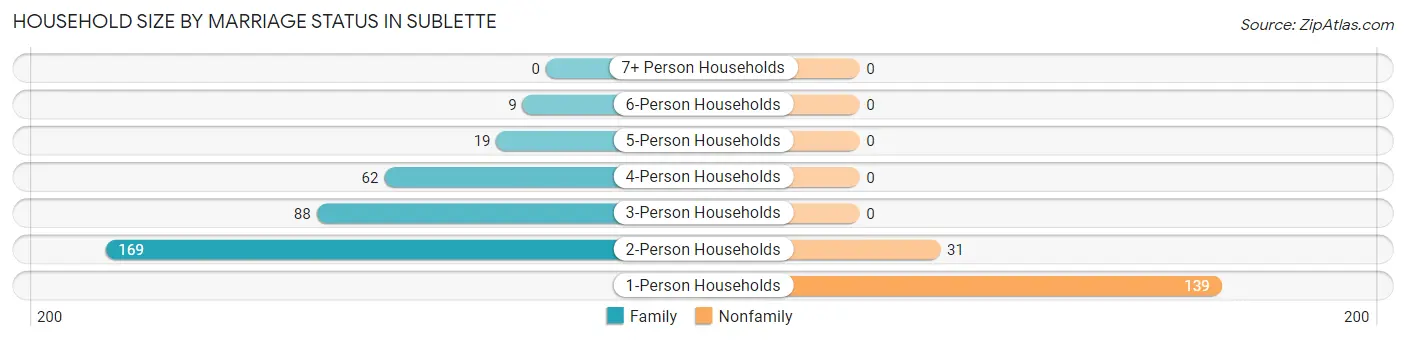
| Household Size | Family Households | Nonfamily Households |
| 1-Person Households | - | 139 (26.9%) |
| 2-Person Households | 169 (32.7%) | 31 (6.0%) |
| 3-Person Households | 88 (17.0%) | 0 (0.0%) |
| 4-Person Households | 62 (12.0%) | 0 (0.0%) |
| 5-Person Households | 19 (3.7%) | 0 (0.0%) |
| 6-Person Households | 9 (1.7%) | 0 (0.0%) |
| 7+ Person Households | 0 (0.0%) | 0 (0.0%) |
| Total | 347 (67.1%) | 170 (32.9%) |
Female Fertility in Sublette
Fertility by Age in Sublette
Average fertility rate in Sublette is 133.0 births per 1,000 women. Women in the age bracket of 20 to 34 years have the highest fertility rate with 263.0 births per 1,000 women. Women in the age bracket of 20 to 34 years acount for 100.0% of all women with births.
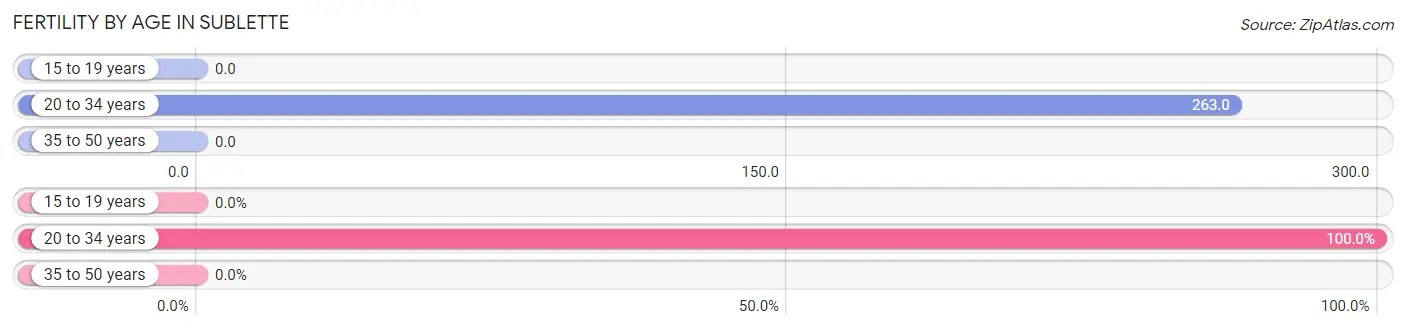
| Age Bracket | Women with Births | Births / 1,000 Women |
| 15 to 19 years | 0 (0.0%) | 0.0 |
| 20 to 34 years | 44 (100.0%) | 263.0 |
| 35 to 50 years | 0 (0.0%) | 0.0 |
| Total | 44 (100.0%) | 133.0 |
Fertility by Age by Marriage Status in Sublette
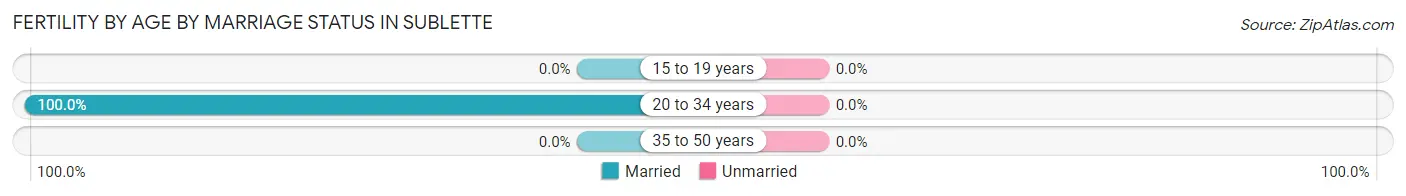
| Age Bracket | Married | Unmarried |
| 15 to 19 years | 0 (0.0%) | 0 (0.0%) |
| 20 to 34 years | 44 (100.0%) | 0 (0.0%) |
| 35 to 50 years | 0 (0.0%) | 0 (0.0%) |
| Total | 44 (100.0%) | 0 (0.0%) |
Fertility by Education in Sublette
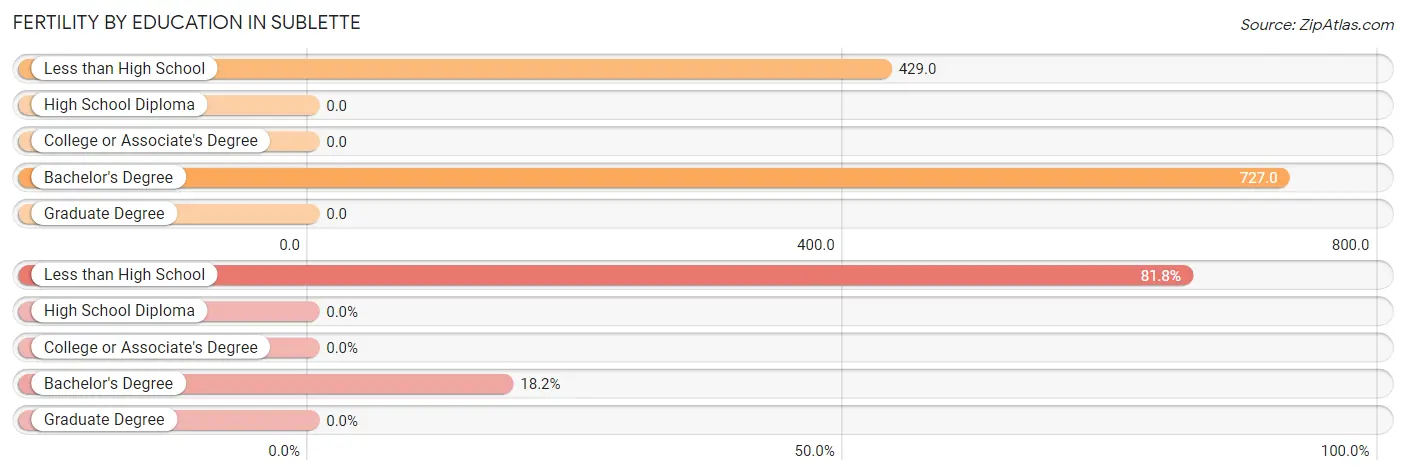
| Educational Attainment | Women with Births | Births / 1,000 Women |
| Less than High School | 36 (81.8%) | 429.0 |
| High School Diploma | 0 (0.0%) | 0.0 |
| College or Associate's Degree | 0 (0.0%) | 0.0 |
| Bachelor's Degree | 8 (18.2%) | 727.0 |
| Graduate Degree | 0 (0.0%) | 0.0 |
| Total | 44 (100.0%) | 133.0 |
Fertility by Education by Marriage Status in Sublette
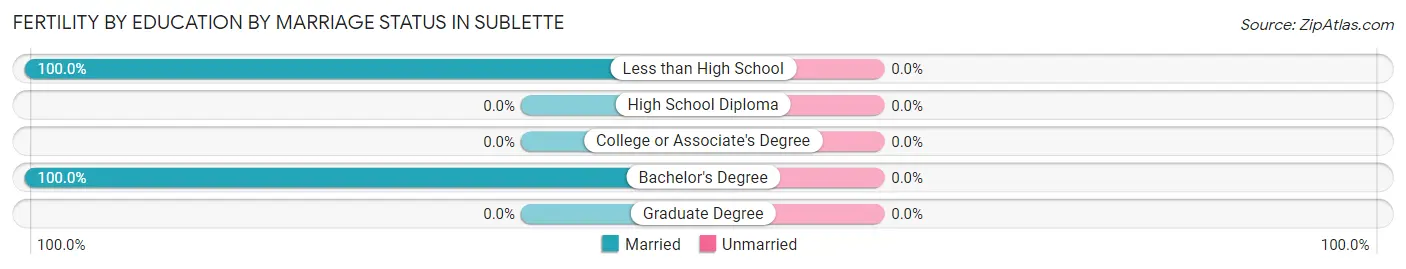
| Educational Attainment | Married | Unmarried |
| Less than High School | 36 (100.0%) | 0 (0.0%) |
| High School Diploma | 0 (0.0%) | 0 (0.0%) |
| College or Associate's Degree | 0 (0.0%) | 0 (0.0%) |
| Bachelor's Degree | 8 (100.0%) | 0 (0.0%) |
| Graduate Degree | 0 (0.0%) | 0 (0.0%) |
| Total | 44 (100.0%) | 0 (0.0%) |
Employment Characteristics in Sublette
Employment by Class of Employer in Sublette
Among the 668 employed individuals in Sublette, private company employees (434 | 65.0%), state government employees (65 | 9.7%), and local government employees (61 | 9.1%) make up the most common classes of employment.
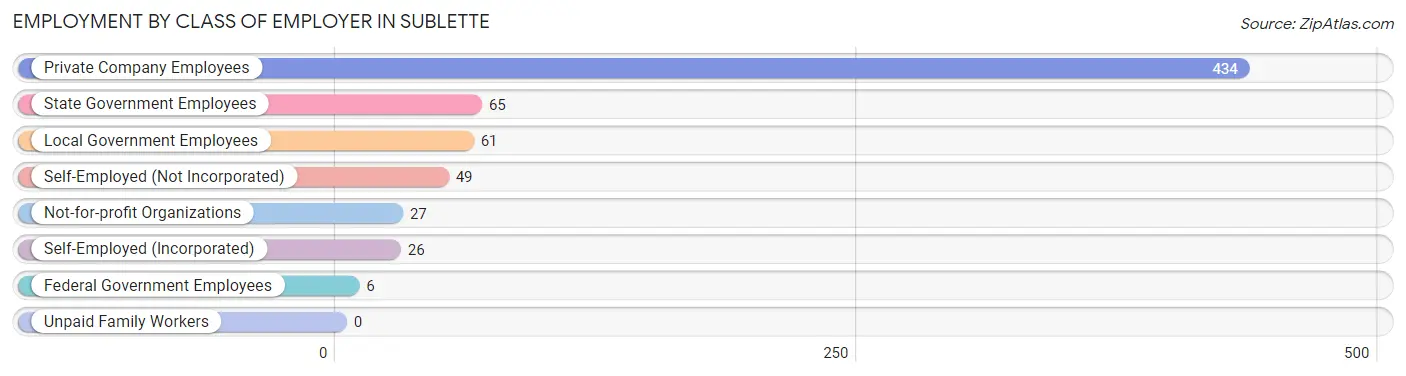
| Employer Class | # Employees | % Employees |
| Private Company Employees | 434 | 65.0% |
| Self-Employed (Incorporated) | 26 | 3.9% |
| Self-Employed (Not Incorporated) | 49 | 7.3% |
| Not-for-profit Organizations | 27 | 4.0% |
| Local Government Employees | 61 | 9.1% |
| State Government Employees | 65 | 9.7% |
| Federal Government Employees | 6 | 0.9% |
| Unpaid Family Workers | 0 | 0.0% |
| Total | 668 | 100.0% |
Employment Status by Age in Sublette
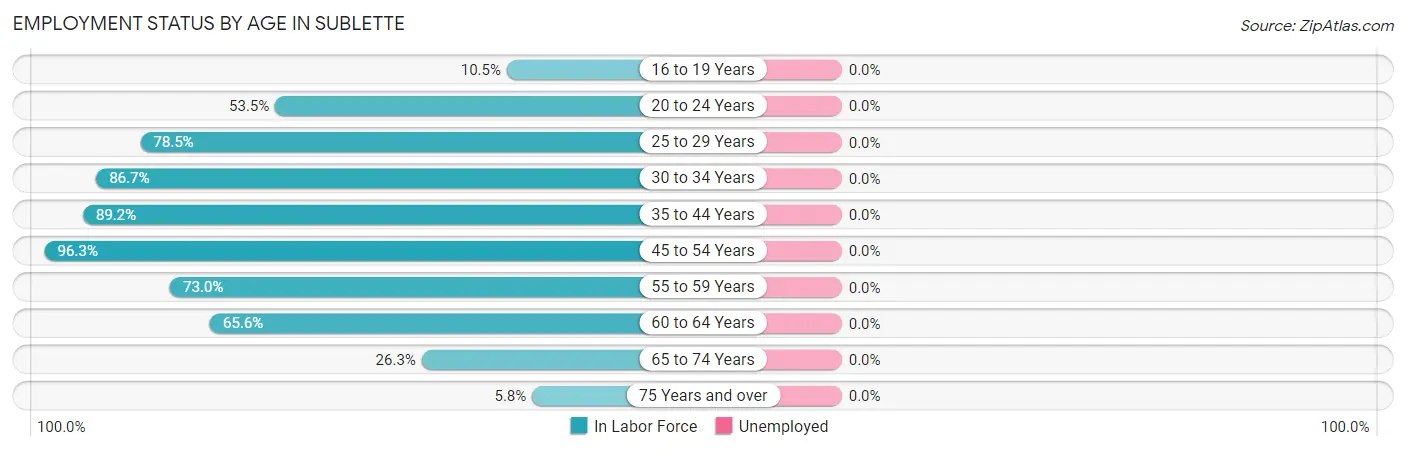
| Age Bracket | In Labor Force | Unemployed |
| 16 to 19 Years | 4 (10.5%) | 0 (0.0%) |
| 20 to 24 Years | 46 (53.5%) | 0 (0.0%) |
| 25 to 29 Years | 117 (78.5%) | 0 (0.0%) |
| 30 to 34 Years | 65 (86.7%) | 0 (0.0%) |
| 35 to 44 Years | 149 (89.2%) | 0 (0.0%) |
| 45 to 54 Years | 131 (96.3%) | 0 (0.0%) |
| 55 to 59 Years | 54 (73.0%) | 0 (0.0%) |
| 60 to 64 Years | 59 (65.6%) | 0 (0.0%) |
| 65 to 74 Years | 45 (26.3%) | 0 (0.0%) |
| 75 Years and over | 5 (5.8%) | 0 (0.0%) |
| Total | 675 (63.0%) | 0 (0.0%) |
Employment Status by Educational Attainment in Sublette
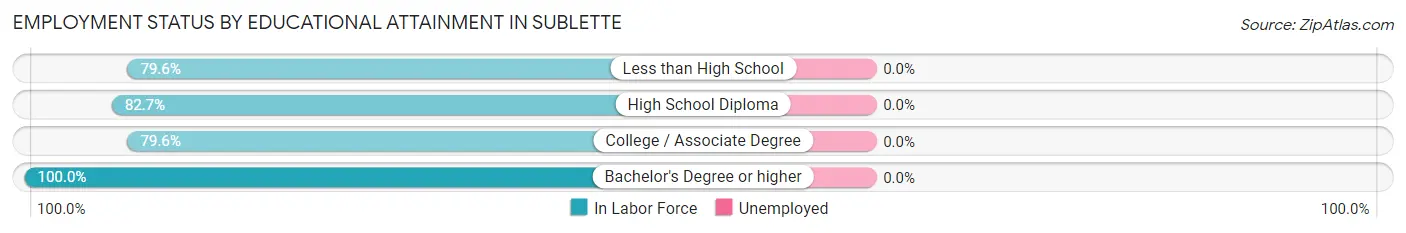
| Educational Attainment | In Labor Force | Unemployed |
| Less than High School | 117 (79.6%) | 0 (0.0%) |
| High School Diploma | 163 (82.7%) | 0 (0.0%) |
| College / Associate Degree | 203 (79.6%) | 0 (0.0%) |
| Bachelor's Degree or higher | 92 (100.0%) | 0 (0.0%) |
| Total | 575 (83.2%) | 0 (0.0%) |
Employment Occupations by Sex in Sublette
Management, Business, Science and Arts Occupations
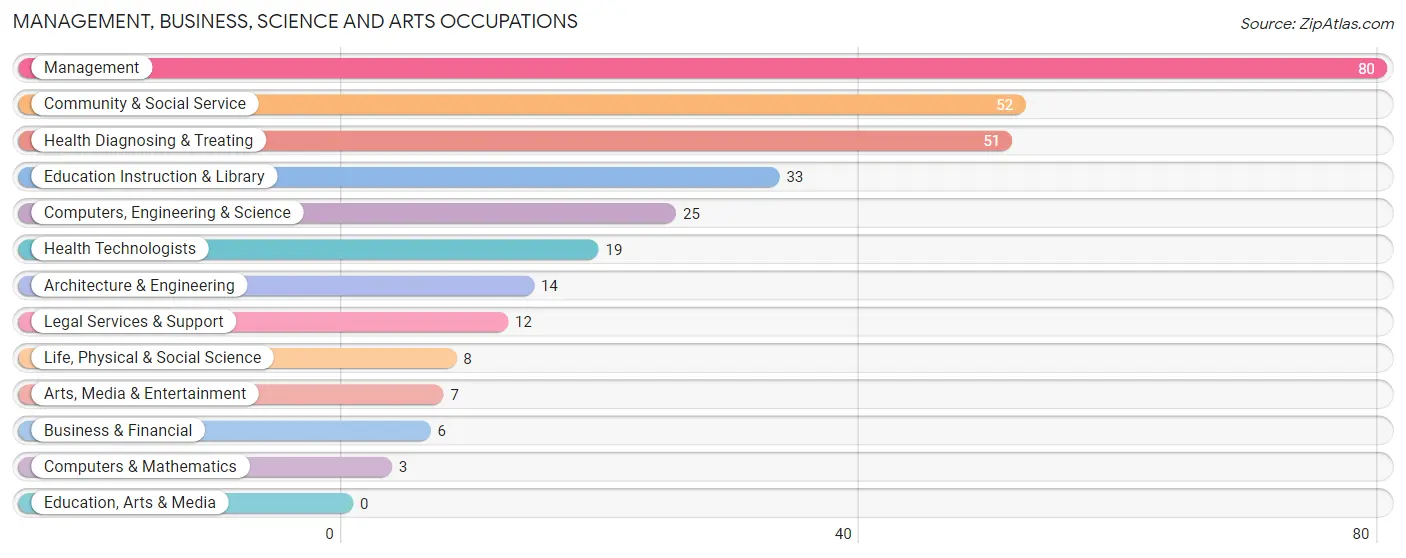
The most common Management, Business, Science and Arts occupations in Sublette are Management (80 | 11.8%), Community & Social Service (52 | 7.7%), Health Diagnosing & Treating (51 | 7.6%), Education Instruction & Library (33 | 4.9%), and Computers, Engineering & Science (25 | 3.7%).
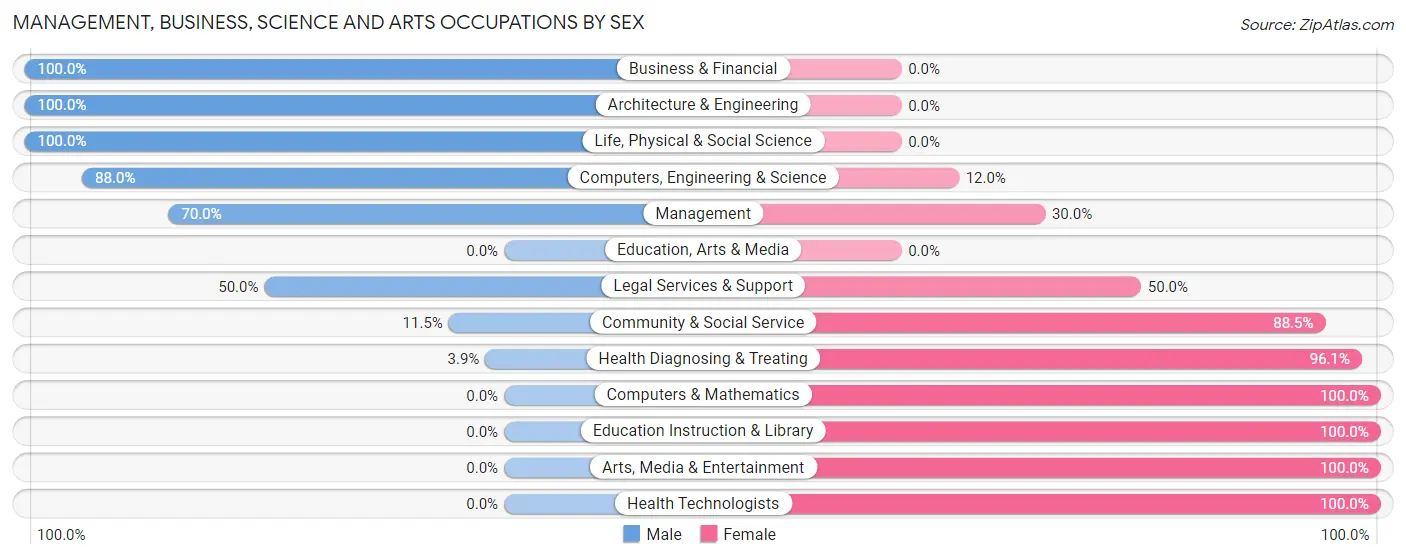
Management, Business, Science and Arts Occupations by Sex
Within the Management, Business, Science and Arts occupations in Sublette, the most male-oriented occupations are Business & Financial (100.0%), Architecture & Engineering (100.0%), and Life, Physical & Social Science (100.0%), while the most female-oriented occupations are Computers & Mathematics (100.0%), Education Instruction & Library (100.0%), and Arts, Media & Entertainment (100.0%).
| Occupation | Male | Female |
| Management | 56 (70.0%) | 24 (30.0%) |
| Business & Financial | 6 (100.0%) | 0 (0.0%) |
| Computers, Engineering & Science | 22 (88.0%) | 3 (12.0%) |
| Computers & Mathematics | 0 (0.0%) | 3 (100.0%) |
| Architecture & Engineering | 14 (100.0%) | 0 (0.0%) |
| Life, Physical & Social Science | 8 (100.0%) | 0 (0.0%) |
| Community & Social Service | 6 (11.5%) | 46 (88.5%) |
| Education, Arts & Media | 0 (0.0%) | 0 (0.0%) |
| Legal Services & Support | 6 (50.0%) | 6 (50.0%) |
| Education Instruction & Library | 0 (0.0%) | 33 (100.0%) |
| Arts, Media & Entertainment | 0 (0.0%) | 7 (100.0%) |
| Health Diagnosing & Treating | 2 (3.9%) | 49 (96.1%) |
| Health Technologists | 0 (0.0%) | 19 (100.0%) |
| Total (Category) | 92 (43.0%) | 122 (57.0%) |
| Total (Overall) | 377 (55.8%) | 298 (44.2%) |
Services Occupations
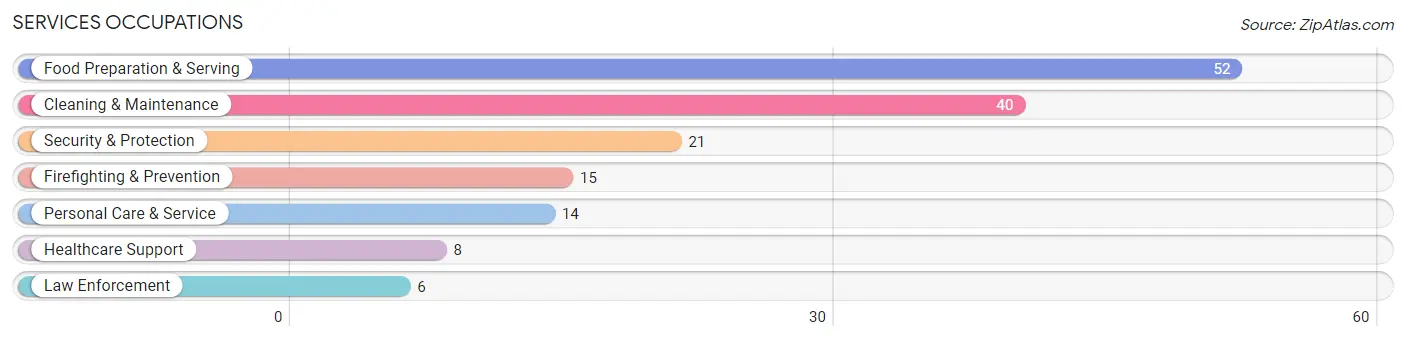
The most common Services occupations in Sublette are Food Preparation & Serving (52 | 7.7%), Cleaning & Maintenance (40 | 5.9%), Security & Protection (21 | 3.1%), Firefighting & Prevention (15 | 2.2%), and Personal Care & Service (14 | 2.1%).
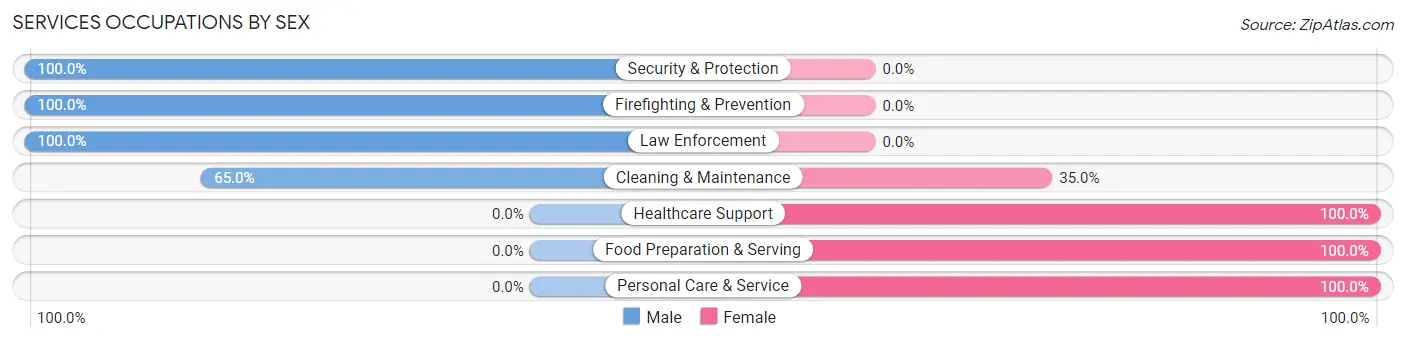
Services Occupations by Sex
Within the Services occupations in Sublette, the most male-oriented occupations are Security & Protection (100.0%), Firefighting & Prevention (100.0%), and Law Enforcement (100.0%), while the most female-oriented occupations are Healthcare Support (100.0%), Food Preparation & Serving (100.0%), and Personal Care & Service (100.0%).
| Occupation | Male | Female |
| Healthcare Support | 0 (0.0%) | 8 (100.0%) |
| Security & Protection | 21 (100.0%) | 0 (0.0%) |
| Firefighting & Prevention | 15 (100.0%) | 0 (0.0%) |
| Law Enforcement | 6 (100.0%) | 0 (0.0%) |
| Food Preparation & Serving | 0 (0.0%) | 52 (100.0%) |
| Cleaning & Maintenance | 26 (65.0%) | 14 (35.0%) |
| Personal Care & Service | 0 (0.0%) | 14 (100.0%) |
| Total (Category) | 47 (34.8%) | 88 (65.2%) |
| Total (Overall) | 377 (55.8%) | 298 (44.2%) |
Sales and Office Occupations
The most common Sales and Office occupations in Sublette are Office & Administration (34 | 5.0%), and Sales & Related (29 | 4.3%).
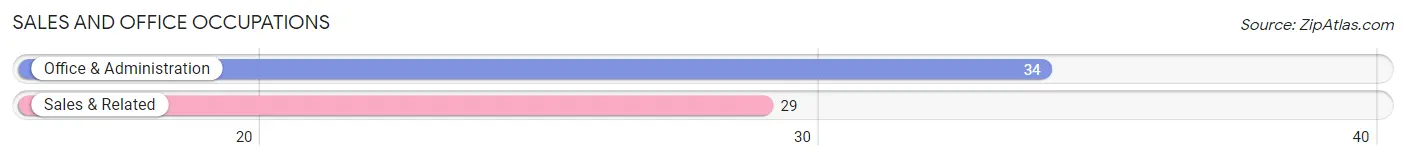
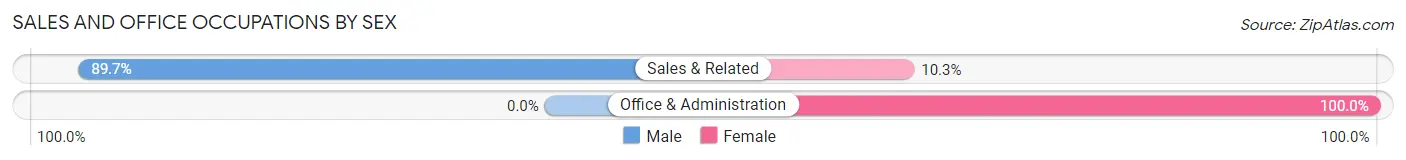
Sales and Office Occupations by Sex
| Occupation | Male | Female |
| Sales & Related | 26 (89.7%) | 3 (10.3%) |
| Office & Administration | 0 (0.0%) | 34 (100.0%) |
| Total (Category) | 26 (41.3%) | 37 (58.7%) |
| Total (Overall) | 377 (55.8%) | 298 (44.2%) |
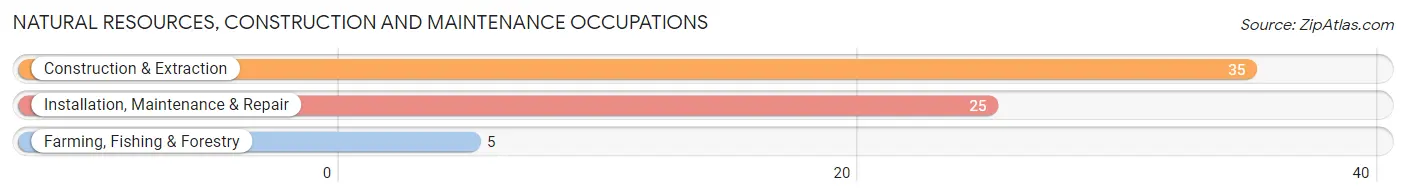
Natural Resources, Construction and Maintenance Occupations
The most common Natural Resources, Construction and Maintenance occupations in Sublette are Construction & Extraction (35 | 5.2%), Installation, Maintenance & Repair (25 | 3.7%), and Farming, Fishing & Forestry (5 | 0.7%).
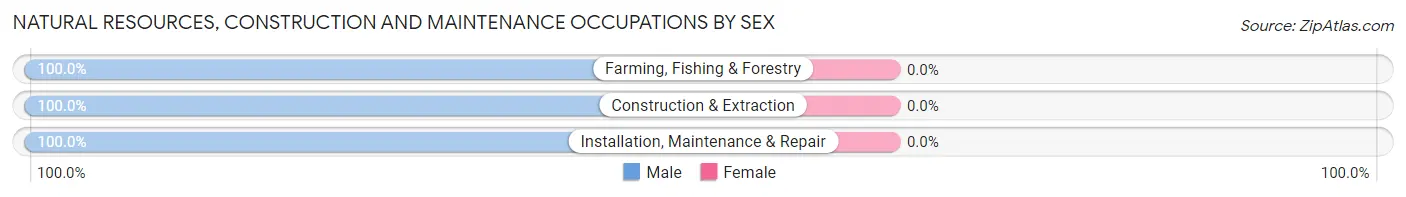
Natural Resources, Construction and Maintenance Occupations by Sex
| Occupation | Male | Female |
| Farming, Fishing & Forestry | 5 (100.0%) | 0 (0.0%) |
| Construction & Extraction | 35 (100.0%) | 0 (0.0%) |
| Installation, Maintenance & Repair | 25 (100.0%) | 0 (0.0%) |
| Total (Category) | 65 (100.0%) | 0 (0.0%) |
| Total (Overall) | 377 (55.8%) | 298 (44.2%) |
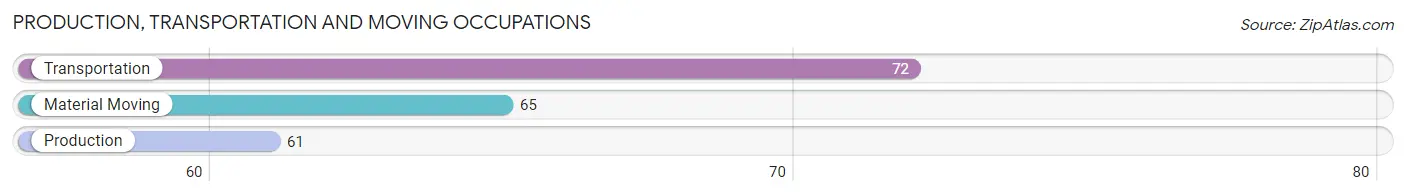
Production, Transportation and Moving Occupations
The most common Production, Transportation and Moving occupations in Sublette are Transportation (72 | 10.7%), Material Moving (65 | 9.6%), and Production (61 | 9.0%).
Production, Transportation and Moving Occupations by Sex
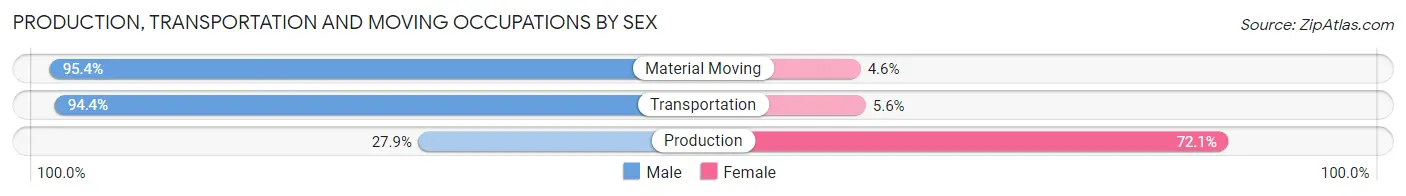
| Occupation | Male | Female |
| Production | 17 (27.9%) | 44 (72.1%) |
| Transportation | 68 (94.4%) | 4 (5.6%) |
| Material Moving | 62 (95.4%) | 3 (4.6%) |
| Total (Category) | 147 (74.2%) | 51 (25.8%) |
| Total (Overall) | 377 (55.8%) | 298 (44.2%) |
Employment Industries by Sex in Sublette
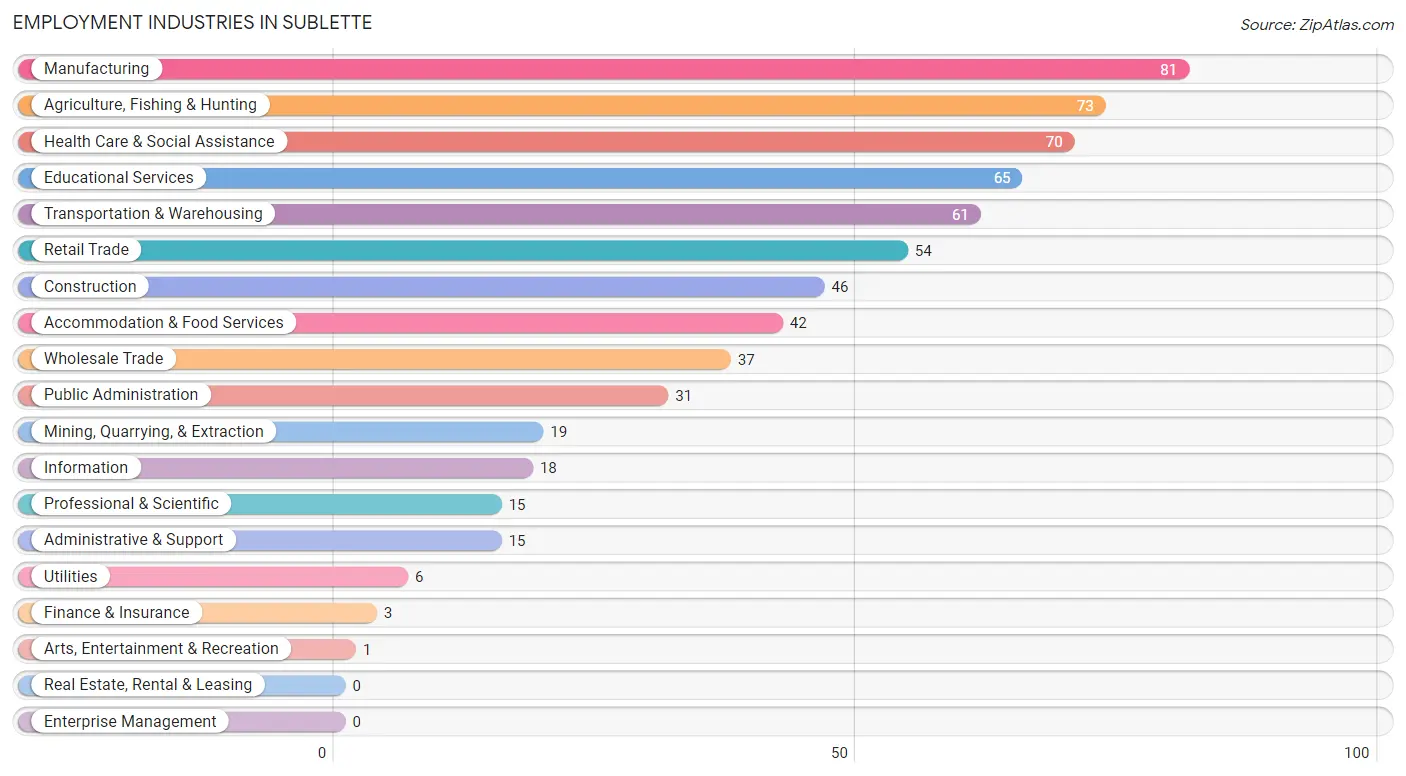
Employment Industries in Sublette
The major employment industries in Sublette include Manufacturing (81 | 12.0%), Agriculture, Fishing & Hunting (73 | 10.8%), Health Care & Social Assistance (70 | 10.4%), Educational Services (65 | 9.6%), and Transportation & Warehousing (61 | 9.0%).
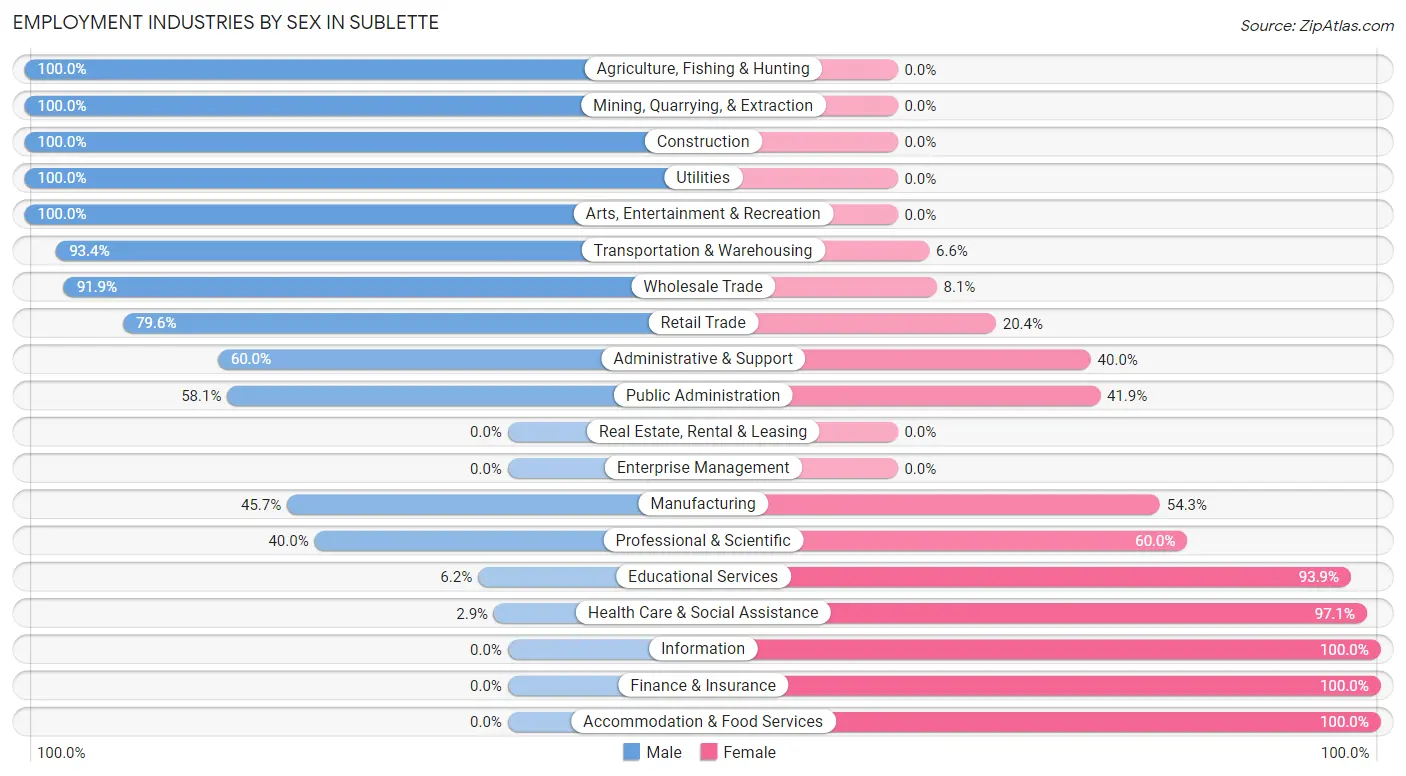
Employment Industries by Sex in Sublette
The Sublette industries that see more men than women are Agriculture, Fishing & Hunting (100.0%), Mining, Quarrying, & Extraction (100.0%), and Construction (100.0%), whereas the industries that tend to have a higher number of women are Information (100.0%), Finance & Insurance (100.0%), and Accommodation & Food Services (100.0%).
| Industry | Male | Female |
| Agriculture, Fishing & Hunting | 73 (100.0%) | 0 (0.0%) |
| Mining, Quarrying, & Extraction | 19 (100.0%) | 0 (0.0%) |
| Construction | 46 (100.0%) | 0 (0.0%) |
| Manufacturing | 37 (45.7%) | 44 (54.3%) |
| Wholesale Trade | 34 (91.9%) | 3 (8.1%) |
| Retail Trade | 43 (79.6%) | 11 (20.4%) |
| Transportation & Warehousing | 57 (93.4%) | 4 (6.6%) |
| Utilities | 6 (100.0%) | 0 (0.0%) |
| Information | 0 (0.0%) | 18 (100.0%) |
| Finance & Insurance | 0 (0.0%) | 3 (100.0%) |
| Real Estate, Rental & Leasing | 0 (0.0%) | 0 (0.0%) |
| Professional & Scientific | 6 (40.0%) | 9 (60.0%) |
| Enterprise Management | 0 (0.0%) | 0 (0.0%) |
| Administrative & Support | 9 (60.0%) | 6 (40.0%) |
| Educational Services | 4 (6.1%) | 61 (93.9%) |
| Health Care & Social Assistance | 2 (2.9%) | 68 (97.1%) |
| Arts, Entertainment & Recreation | 1 (100.0%) | 0 (0.0%) |
| Accommodation & Food Services | 0 (0.0%) | 42 (100.0%) |
| Public Administration | 18 (58.1%) | 13 (41.9%) |
| Total | 377 (55.8%) | 298 (44.2%) |
Education in Sublette
School Enrollment in Sublette
The most common levels of schooling among the 277 students in Sublette are high school (85 | 30.7%), elementary school (57 | 20.6%), and nursery / preschool (51 | 18.4%).
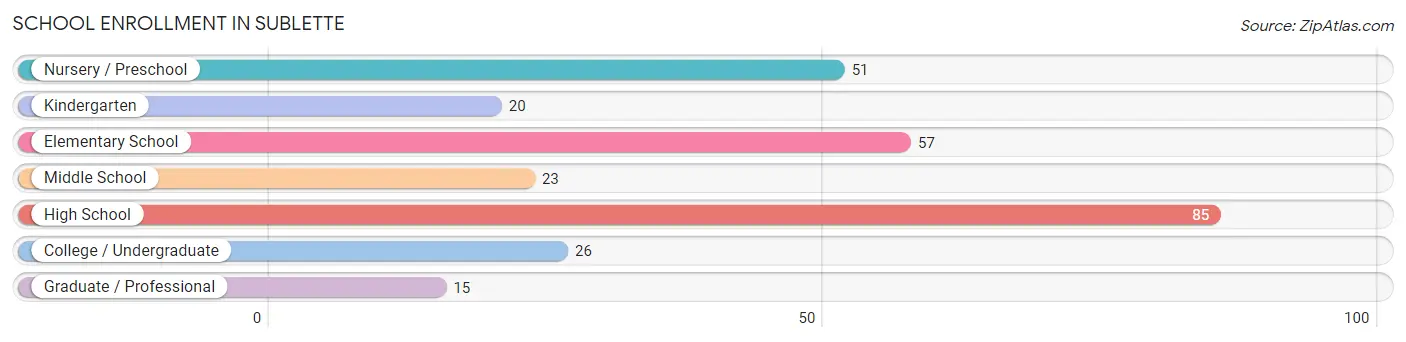
| School Level | # Students | % Students |
| Nursery / Preschool | 51 | 18.4% |
| Kindergarten | 20 | 7.2% |
| Elementary School | 57 | 20.6% |
| Middle School | 23 | 8.3% |
| High School | 85 | 30.7% |
| College / Undergraduate | 26 | 9.4% |
| Graduate / Professional | 15 | 5.4% |
| Total | 277 | 100.0% |
School Enrollment by Age by Funding Source in Sublette
Out of a total of 277 students who are enrolled in schools in Sublette, 13 (4.7%) attend a private institution, while the remaining 264 (95.3%) are enrolled in public schools. The age group of 18 to 19 year olds has the highest likelihood of being enrolled in private schools, with 3 (21.4% in the age bracket) enrolled. Conversely, the age group of 3 to 4 year olds has the lowest likelihood of being enrolled in a private school, with 21 (100.0% in the age bracket) attending a public institution.
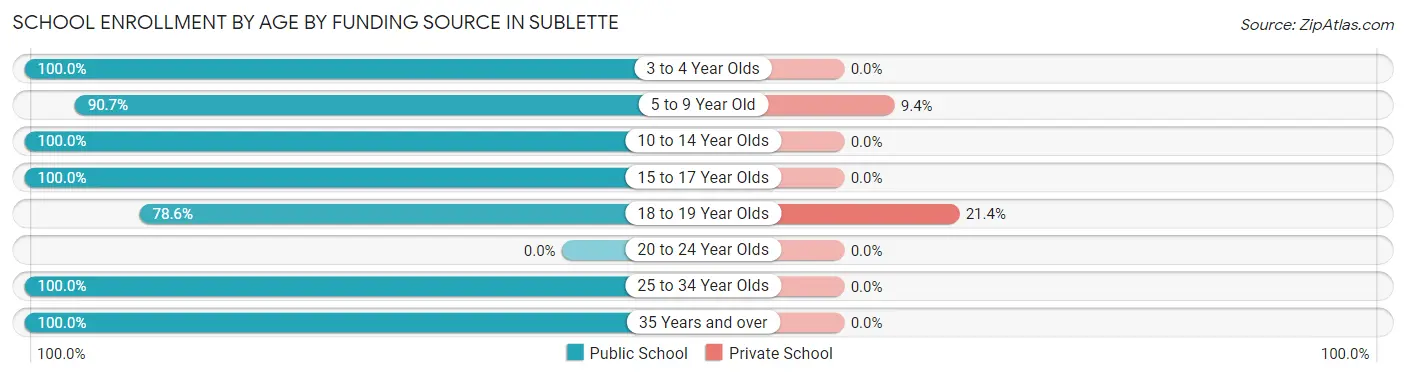
| Age Bracket | Public School | Private School |
| 3 to 4 Year Olds | 21 (100.0%) | 0 (0.0%) |
| 5 to 9 Year Old | 97 (90.6%) | 10 (9.3%) |
| 10 to 14 Year Olds | 26 (100.0%) | 0 (0.0%) |
| 15 to 17 Year Olds | 83 (100.0%) | 0 (0.0%) |
| 18 to 19 Year Olds | 11 (78.6%) | 3 (21.4%) |
| 20 to 24 Year Olds | 0 (0.0%) | 0 (0.0%) |
| 25 to 34 Year Olds | 7 (100.0%) | 0 (0.0%) |
| 35 Years and over | 19 (100.0%) | 0 (0.0%) |
| Total | 264 (95.3%) | 13 (4.7%) |
Educational Attainment by Field of Study in Sublette
Education (68 | 45.3%), arts & humanities (26 | 17.3%), business (14 | 9.3%), physical & health sciences (13 | 8.7%), and bio, nature & agricultural (11 | 7.3%) are the most common fields of study among 150 individuals in Sublette who have obtained a bachelor's degree or higher.
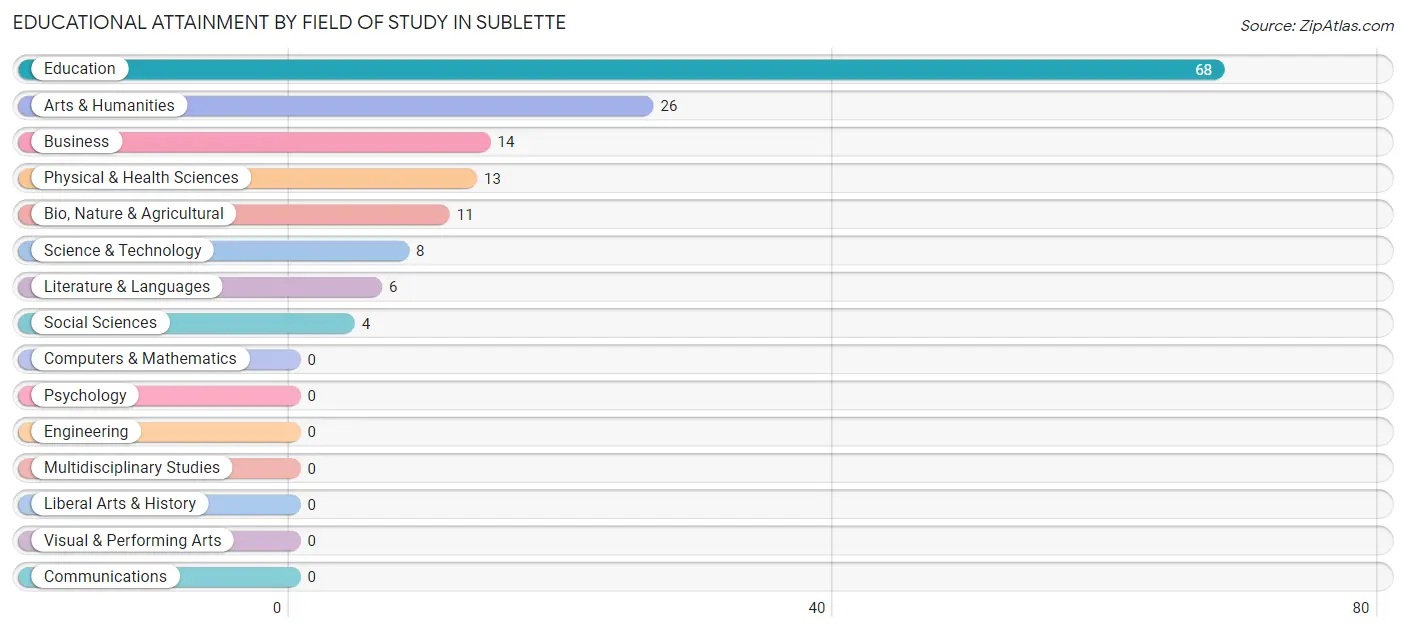
| Field of Study | # Graduates | % Graduates |
| Computers & Mathematics | 0 | 0.0% |
| Bio, Nature & Agricultural | 11 | 7.3% |
| Physical & Health Sciences | 13 | 8.7% |
| Psychology | 0 | 0.0% |
| Social Sciences | 4 | 2.7% |
| Engineering | 0 | 0.0% |
| Multidisciplinary Studies | 0 | 0.0% |
| Science & Technology | 8 | 5.3% |
| Business | 14 | 9.3% |
| Education | 68 | 45.3% |
| Literature & Languages | 6 | 4.0% |
| Liberal Arts & History | 0 | 0.0% |
| Visual & Performing Arts | 0 | 0.0% |
| Communications | 0 | 0.0% |
| Arts & Humanities | 26 | 17.3% |
| Total | 150 | 100.0% |
Transportation & Commute in Sublette
Vehicle Availability by Sex in Sublette
The most prevalent vehicle ownership categories in Sublette are males with 2 vehicles (185, accounting for 49.1%) and females with 2 vehicles (116, making up 63.6%).
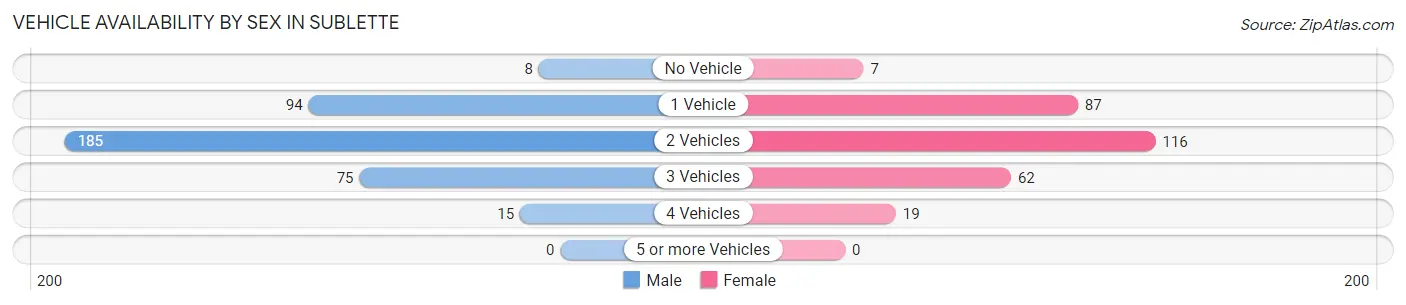
| Vehicles Available | Male | Female |
| No Vehicle | 8 (2.1%) | 7 (2.4%) |
| 1 Vehicle | 94 (24.9%) | 87 (29.9%) |
| 2 Vehicles | 185 (49.1%) | 116 (39.9%) |
| 3 Vehicles | 75 (19.9%) | 62 (21.3%) |
| 4 Vehicles | 15 (4.0%) | 19 (6.5%) |
| 5 or more Vehicles | 0 (0.0%) | 0 (0.0%) |
| Total | 377 (100.0%) | 291 (100.0%) |
Commute Time in Sublette
The most frequently occuring commute durations in Sublette are 5 to 9 minutes (190 commuters, 30.2%), less than 5 minutes (114 commuters, 18.1%), and 15 to 19 minutes (104 commuters, 16.5%).
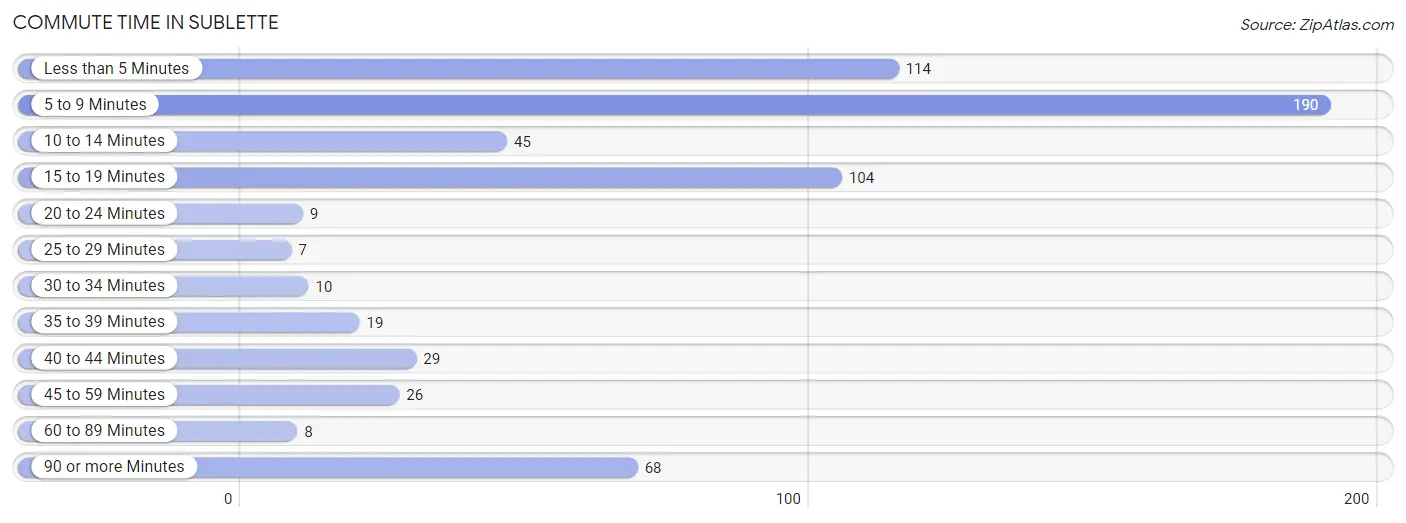
| Commute Time | # Commuters | % Commuters |
| Less than 5 Minutes | 114 | 18.1% |
| 5 to 9 Minutes | 190 | 30.2% |
| 10 to 14 Minutes | 45 | 7.1% |
| 15 to 19 Minutes | 104 | 16.5% |
| 20 to 24 Minutes | 9 | 1.4% |
| 25 to 29 Minutes | 7 | 1.1% |
| 30 to 34 Minutes | 10 | 1.6% |
| 35 to 39 Minutes | 19 | 3.0% |
| 40 to 44 Minutes | 29 | 4.6% |
| 45 to 59 Minutes | 26 | 4.1% |
| 60 to 89 Minutes | 8 | 1.3% |
| 90 or more Minutes | 68 | 10.8% |
Commute Time by Sex in Sublette
The most common commute times in Sublette are 15 to 19 minutes (99 commuters, 26.3%) for males and 5 to 9 minutes (110 commuters, 43.6%) for females.
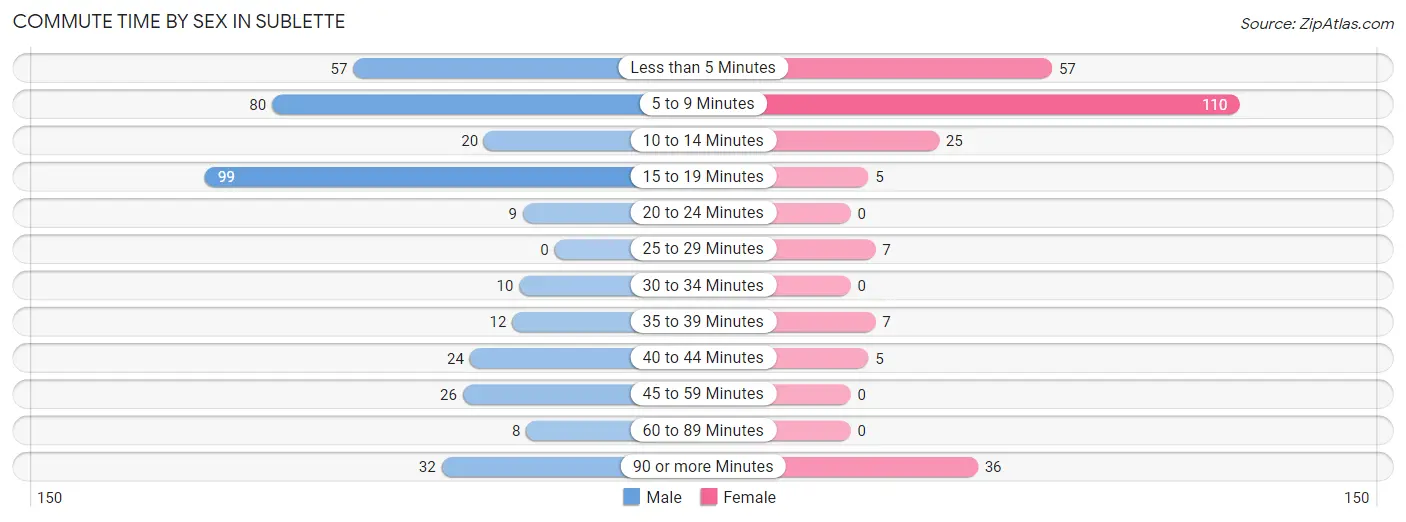
| Commute Time | Male | Female |
| Less than 5 Minutes | 57 (15.1%) | 57 (22.6%) |
| 5 to 9 Minutes | 80 (21.2%) | 110 (43.6%) |
| 10 to 14 Minutes | 20 (5.3%) | 25 (9.9%) |
| 15 to 19 Minutes | 99 (26.3%) | 5 (2.0%) |
| 20 to 24 Minutes | 9 (2.4%) | 0 (0.0%) |
| 25 to 29 Minutes | 0 (0.0%) | 7 (2.8%) |
| 30 to 34 Minutes | 10 (2.6%) | 0 (0.0%) |
| 35 to 39 Minutes | 12 (3.2%) | 7 (2.8%) |
| 40 to 44 Minutes | 24 (6.4%) | 5 (2.0%) |
| 45 to 59 Minutes | 26 (6.9%) | 0 (0.0%) |
| 60 to 89 Minutes | 8 (2.1%) | 0 (0.0%) |
| 90 or more Minutes | 32 (8.5%) | 36 (14.3%) |
Time of Departure to Work by Sex in Sublette
The most frequent times of departure to work in Sublette are 5:30 AM to 5:59 AM (87, 23.1%) for males and 7:00 AM to 7:29 AM (45, 17.9%) for females.
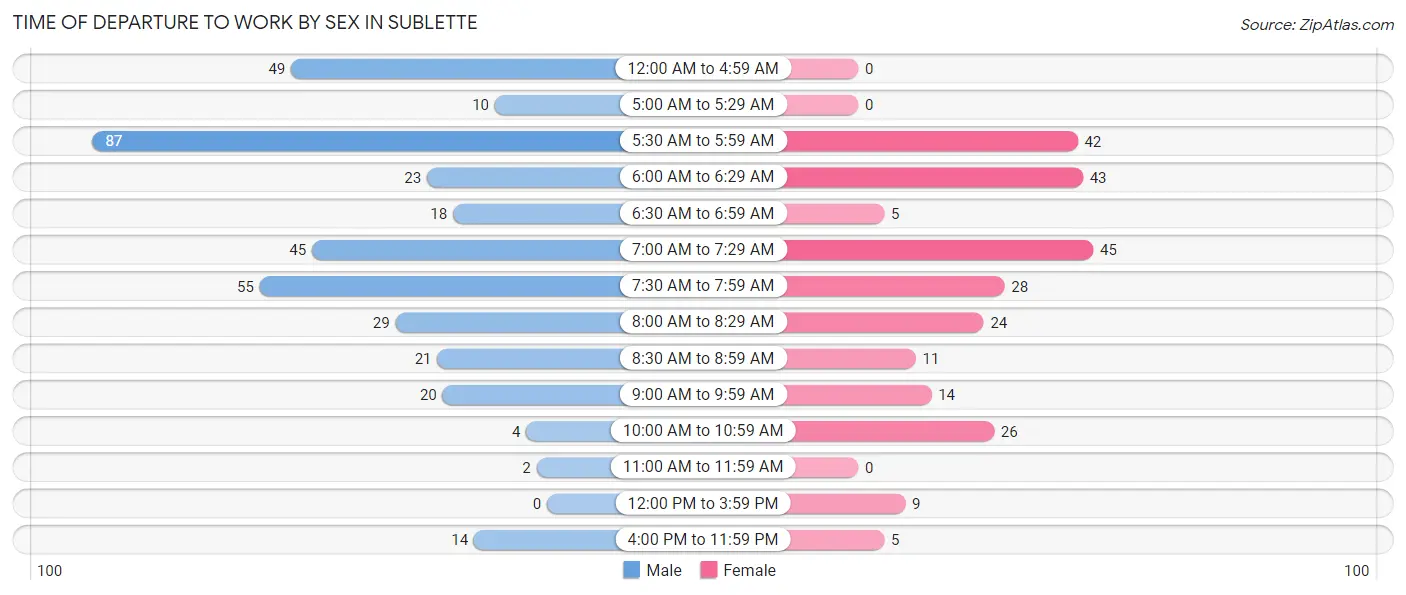
| Time of Departure | Male | Female |
| 12:00 AM to 4:59 AM | 49 (13.0%) | 0 (0.0%) |
| 5:00 AM to 5:29 AM | 10 (2.6%) | 0 (0.0%) |
| 5:30 AM to 5:59 AM | 87 (23.1%) | 42 (16.7%) |
| 6:00 AM to 6:29 AM | 23 (6.1%) | 43 (17.1%) |
| 6:30 AM to 6:59 AM | 18 (4.8%) | 5 (2.0%) |
| 7:00 AM to 7:29 AM | 45 (11.9%) | 45 (17.9%) |
| 7:30 AM to 7:59 AM | 55 (14.6%) | 28 (11.1%) |
| 8:00 AM to 8:29 AM | 29 (7.7%) | 24 (9.5%) |
| 8:30 AM to 8:59 AM | 21 (5.6%) | 11 (4.4%) |
| 9:00 AM to 9:59 AM | 20 (5.3%) | 14 (5.6%) |
| 10:00 AM to 10:59 AM | 4 (1.1%) | 26 (10.3%) |
| 11:00 AM to 11:59 AM | 2 (0.5%) | 0 (0.0%) |
| 12:00 PM to 3:59 PM | 0 (0.0%) | 9 (3.6%) |
| 4:00 PM to 11:59 PM | 14 (3.7%) | 5 (2.0%) |
| Total | 377 (100.0%) | 252 (100.0%) |
Housing Occupancy in Sublette
Occupancy by Ownership in Sublette
Of the total 517 dwellings in Sublette, owner-occupied units account for 439 (84.9%), while renter-occupied units make up 78 (15.1%).
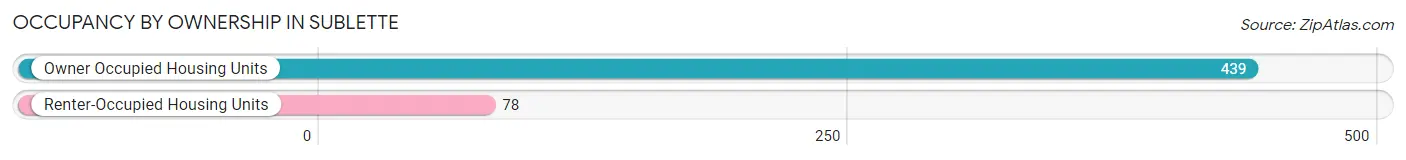
| Occupancy | # Housing Units | % Housing Units |
| Owner Occupied Housing Units | 439 | 84.9% |
| Renter-Occupied Housing Units | 78 | 15.1% |
| Total Occupied Housing Units | 517 | 100.0% |
Occupancy by Household Size in Sublette
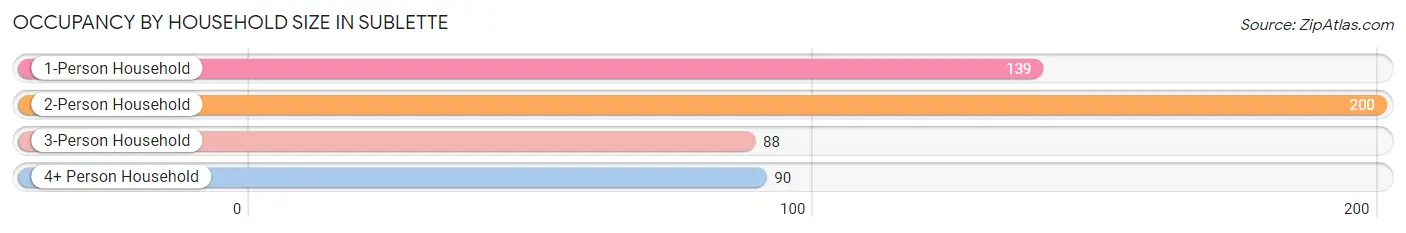
| Household Size | # Housing Units | % Housing Units |
| 1-Person Household | 139 | 26.9% |
| 2-Person Household | 200 | 38.7% |
| 3-Person Household | 88 | 17.0% |
| 4+ Person Household | 90 | 17.4% |
| Total Housing Units | 517 | 100.0% |
Occupancy by Ownership by Household Size in Sublette
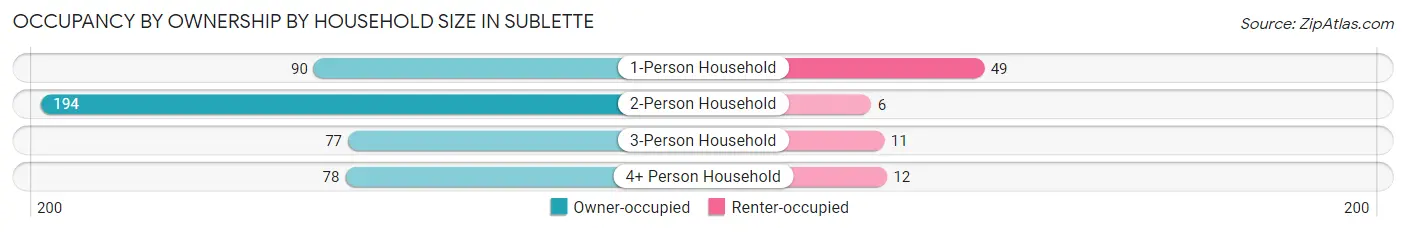
| Household Size | Owner-occupied | Renter-occupied |
| 1-Person Household | 90 (64.7%) | 49 (35.2%) |
| 2-Person Household | 194 (97.0%) | 6 (3.0%) |
| 3-Person Household | 77 (87.5%) | 11 (12.5%) |
| 4+ Person Household | 78 (86.7%) | 12 (13.3%) |
| Total Housing Units | 439 (84.9%) | 78 (15.1%) |
Occupancy by Educational Attainment in Sublette
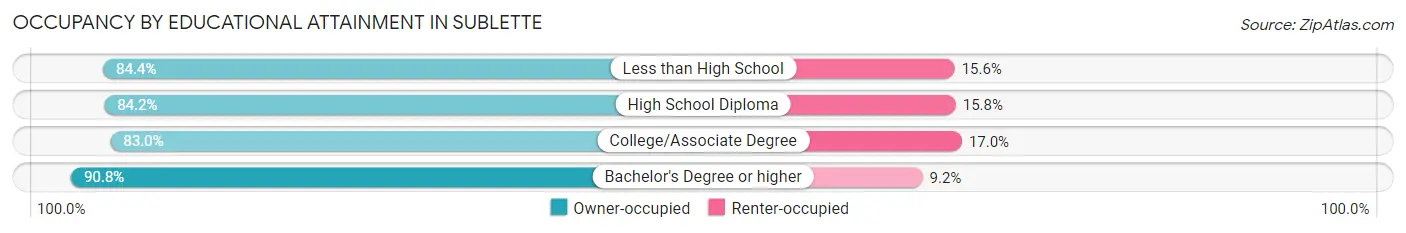
| Household Size | Owner-occupied | Renter-occupied |
| Less than High School | 103 (84.4%) | 19 (15.6%) |
| High School Diploma | 96 (84.2%) | 18 (15.8%) |
| College/Associate Degree | 161 (83.0%) | 33 (17.0%) |
| Bachelor's Degree or higher | 79 (90.8%) | 8 (9.2%) |
Occupancy by Age of Householder in Sublette
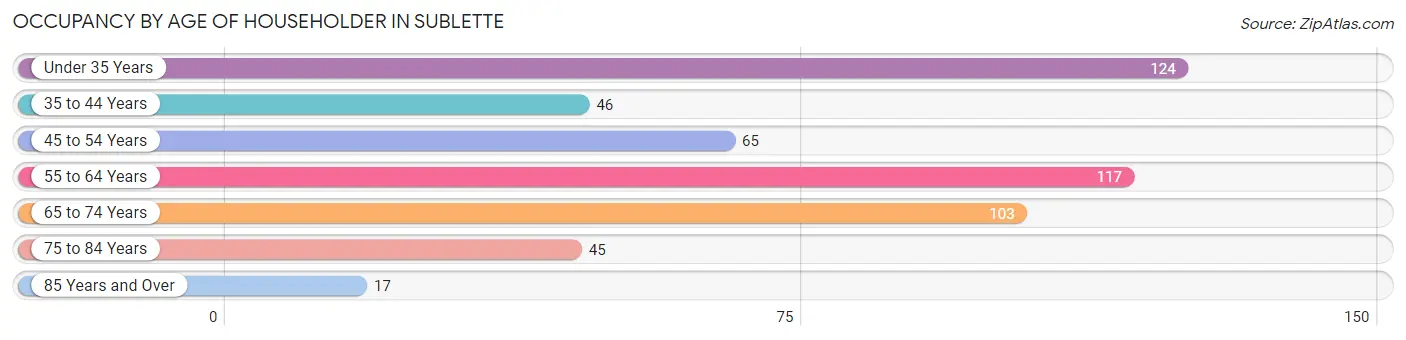
| Age Bracket | # Households | % Households |
| Under 35 Years | 124 | 24.0% |
| 35 to 44 Years | 46 | 8.9% |
| 45 to 54 Years | 65 | 12.6% |
| 55 to 64 Years | 117 | 22.6% |
| 65 to 74 Years | 103 | 19.9% |
| 75 to 84 Years | 45 | 8.7% |
| 85 Years and Over | 17 | 3.3% |
| Total | 517 | 100.0% |
Housing Finances in Sublette
Median Income by Occupancy in Sublette
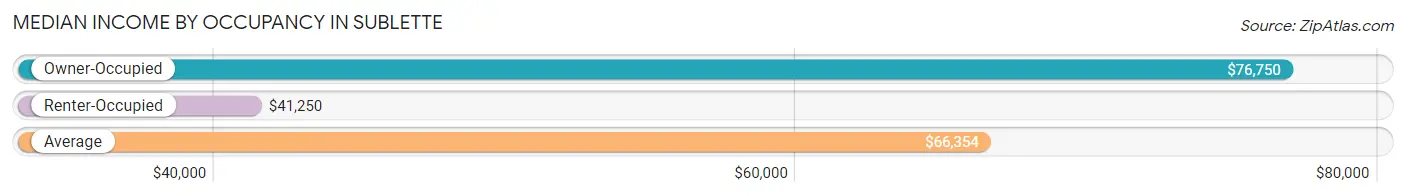
| Occupancy Type | # Households | Median Income |
| Owner-Occupied | 439 (84.9%) | $76,750 |
| Renter-Occupied | 78 (15.1%) | $41,250 |
| Average | 517 (100.0%) | $66,354 |
Occupancy by Householder Income Bracket in Sublette
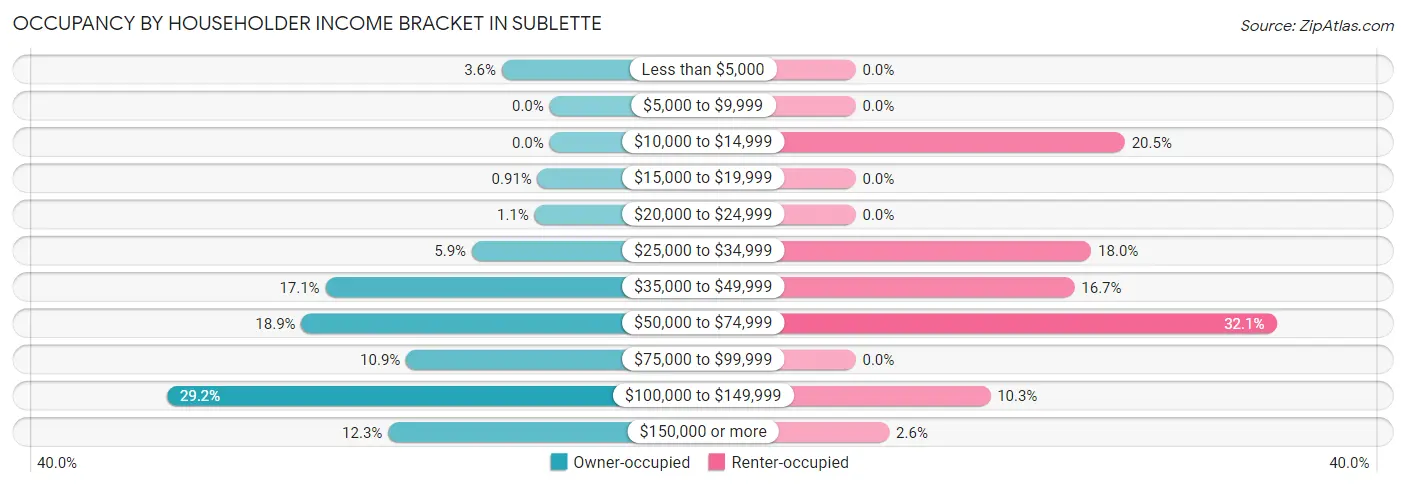
| Income Bracket | Owner-occupied | Renter-occupied |
| Less than $5,000 | 16 (3.6%) | 0 (0.0%) |
| $5,000 to $9,999 | 0 (0.0%) | 0 (0.0%) |
| $10,000 to $14,999 | 0 (0.0%) | 16 (20.5%) |
| $15,000 to $19,999 | 4 (0.9%) | 0 (0.0%) |
| $20,000 to $24,999 | 5 (1.1%) | 0 (0.0%) |
| $25,000 to $34,999 | 26 (5.9%) | 14 (17.9%) |
| $35,000 to $49,999 | 75 (17.1%) | 13 (16.7%) |
| $50,000 to $74,999 | 83 (18.9%) | 25 (32.1%) |
| $75,000 to $99,999 | 48 (10.9%) | 0 (0.0%) |
| $100,000 to $149,999 | 128 (29.2%) | 8 (10.3%) |
| $150,000 or more | 54 (12.3%) | 2 (2.6%) |
| Total | 439 (100.0%) | 78 (100.0%) |
Monthly Housing Cost Tiers in Sublette
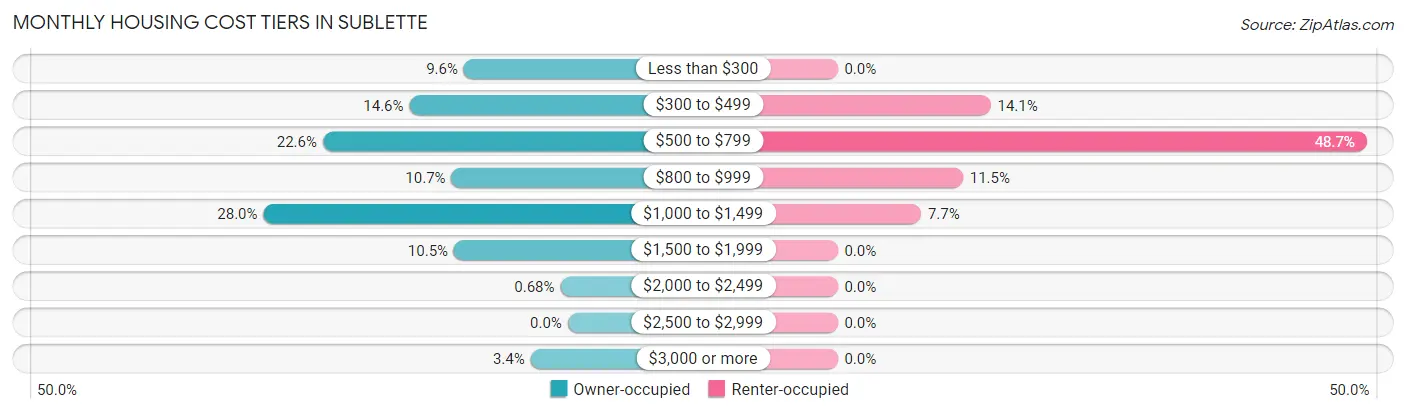
| Monthly Cost | Owner-occupied | Renter-occupied |
| Less than $300 | 42 (9.6%) | 0 (0.0%) |
| $300 to $499 | 64 (14.6%) | 11 (14.1%) |
| $500 to $799 | 99 (22.6%) | 38 (48.7%) |
| $800 to $999 | 47 (10.7%) | 9 (11.5%) |
| $1,000 to $1,499 | 123 (28.0%) | 6 (7.7%) |
| $1,500 to $1,999 | 46 (10.5%) | 0 (0.0%) |
| $2,000 to $2,499 | 3 (0.7%) | 0 (0.0%) |
| $2,500 to $2,999 | 0 (0.0%) | 0 (0.0%) |
| $3,000 or more | 15 (3.4%) | 0 (0.0%) |
| Total | 439 (100.0%) | 78 (100.0%) |
Physical Housing Characteristics in Sublette
Housing Structures in Sublette
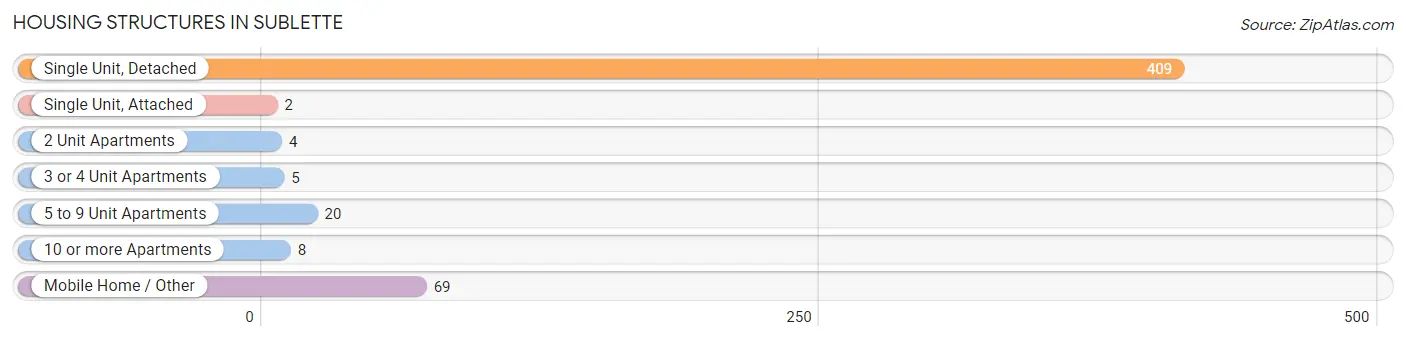
| Structure Type | # Housing Units | % Housing Units |
| Single Unit, Detached | 409 | 79.1% |
| Single Unit, Attached | 2 | 0.4% |
| 2 Unit Apartments | 4 | 0.8% |
| 3 or 4 Unit Apartments | 5 | 1.0% |
| 5 to 9 Unit Apartments | 20 | 3.9% |
| 10 or more Apartments | 8 | 1.5% |
| Mobile Home / Other | 69 | 13.4% |
| Total | 517 | 100.0% |
Housing Structures by Occupancy in Sublette
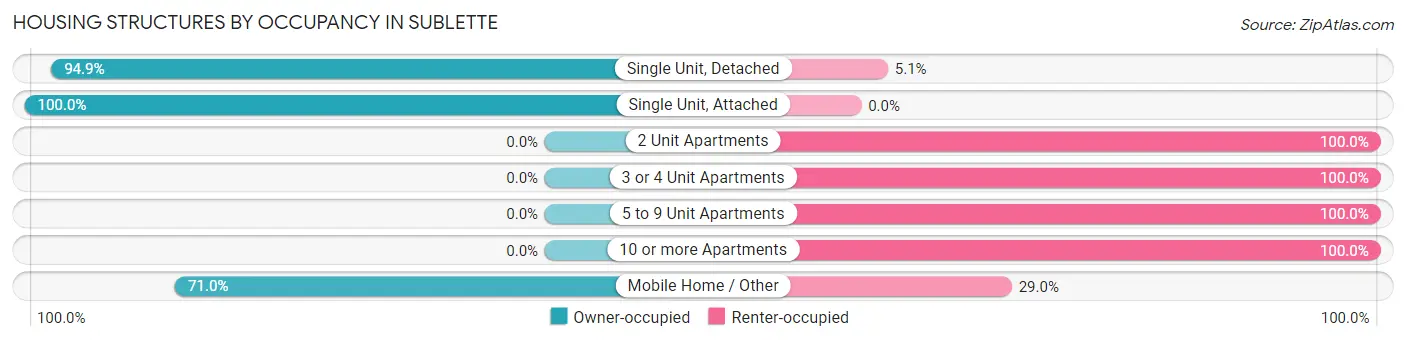
| Structure Type | Owner-occupied | Renter-occupied |
| Single Unit, Detached | 388 (94.9%) | 21 (5.1%) |
| Single Unit, Attached | 2 (100.0%) | 0 (0.0%) |
| 2 Unit Apartments | 0 (0.0%) | 4 (100.0%) |
| 3 or 4 Unit Apartments | 0 (0.0%) | 5 (100.0%) |
| 5 to 9 Unit Apartments | 0 (0.0%) | 20 (100.0%) |
| 10 or more Apartments | 0 (0.0%) | 8 (100.0%) |
| Mobile Home / Other | 49 (71.0%) | 20 (29.0%) |
| Total | 439 (84.9%) | 78 (15.1%) |
Housing Structures by Number of Rooms in Sublette
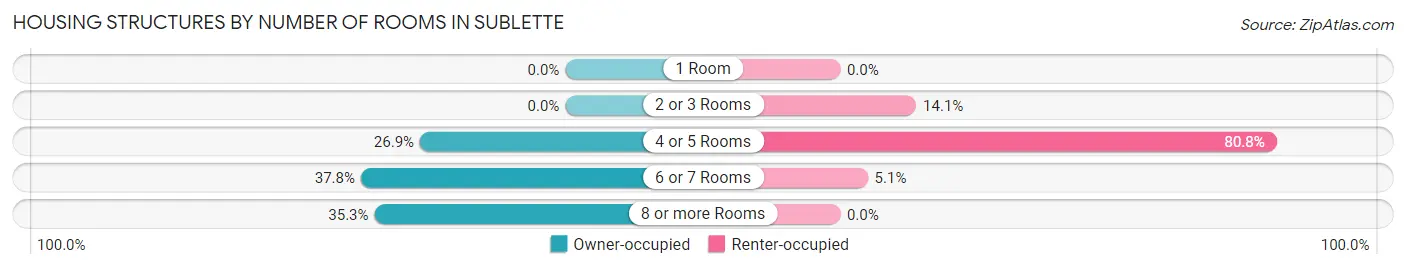
| Number of Rooms | Owner-occupied | Renter-occupied |
| 1 Room | 0 (0.0%) | 0 (0.0%) |
| 2 or 3 Rooms | 0 (0.0%) | 11 (14.1%) |
| 4 or 5 Rooms | 118 (26.9%) | 63 (80.8%) |
| 6 or 7 Rooms | 166 (37.8%) | 4 (5.1%) |
| 8 or more Rooms | 155 (35.3%) | 0 (0.0%) |
| Total | 439 (100.0%) | 78 (100.0%) |
Housing Structure by Heating Type in Sublette
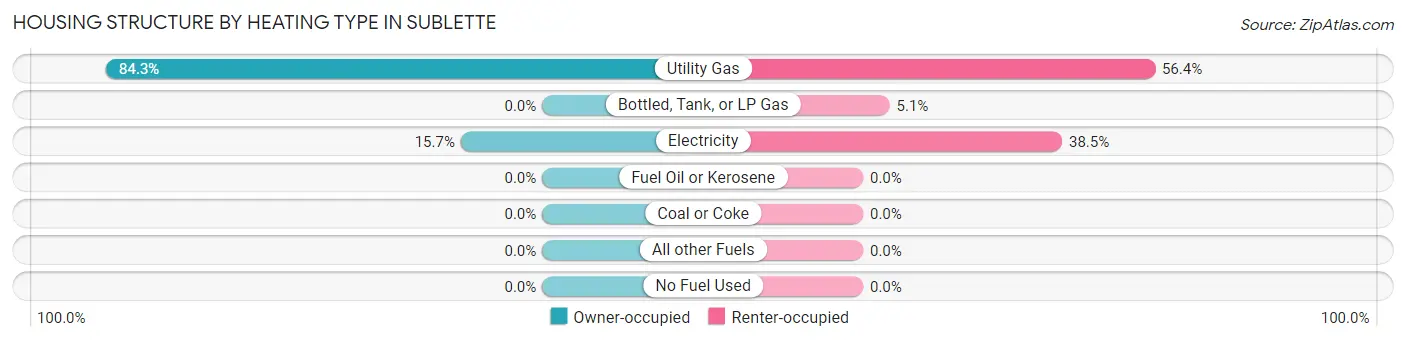
| Heating Type | Owner-occupied | Renter-occupied |
| Utility Gas | 370 (84.3%) | 44 (56.4%) |
| Bottled, Tank, or LP Gas | 0 (0.0%) | 4 (5.1%) |
| Electricity | 69 (15.7%) | 30 (38.5%) |
| Fuel Oil or Kerosene | 0 (0.0%) | 0 (0.0%) |
| Coal or Coke | 0 (0.0%) | 0 (0.0%) |
| All other Fuels | 0 (0.0%) | 0 (0.0%) |
| No Fuel Used | 0 (0.0%) | 0 (0.0%) |
| Total | 439 (100.0%) | 78 (100.0%) |
Household Vehicle Usage in Sublette
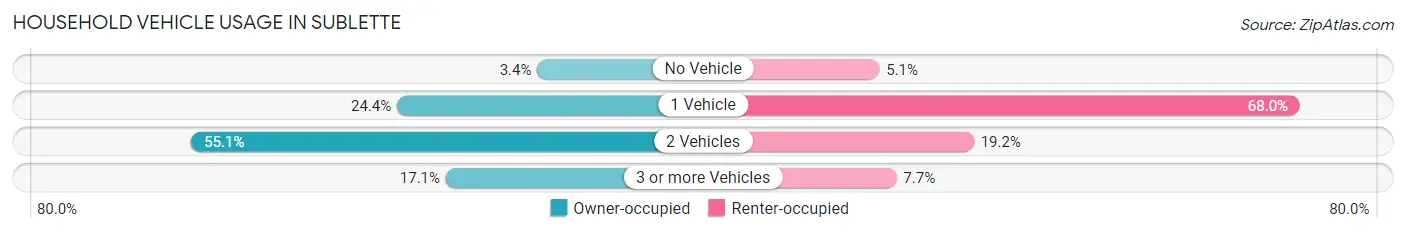
| Vehicles per Household | Owner-occupied | Renter-occupied |
| No Vehicle | 15 (3.4%) | 4 (5.1%) |
| 1 Vehicle | 107 (24.4%) | 53 (67.9%) |
| 2 Vehicles | 242 (55.1%) | 15 (19.2%) |
| 3 or more Vehicles | 75 (17.1%) | 6 (7.7%) |
| Total | 439 (100.0%) | 78 (100.0%) |
Real Estate & Mortgages in Sublette
Real Estate and Mortgage Overview in Sublette
| Characteristic | Without Mortgage | With Mortgage |
| Housing Units | 258 | 181 |
| Median Property Value | $111,200 | $151,700 |
| Median Household Income | $61,167 | $29 |
| Monthly Housing Costs | $561 | $15 |
| Real Estate Taxes | $2,000 | $0 |
Property Value by Mortgage Status in Sublette
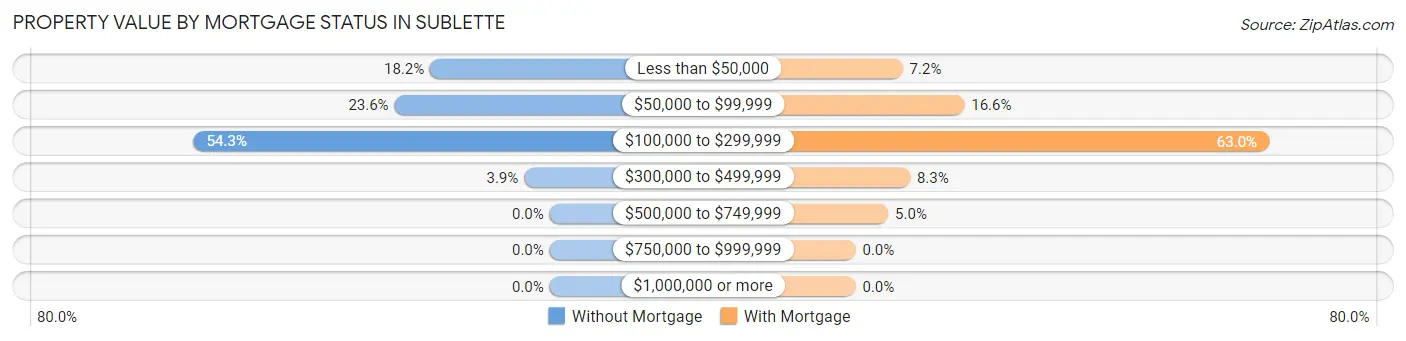
| Property Value | Without Mortgage | With Mortgage |
| Less than $50,000 | 47 (18.2%) | 13 (7.2%) |
| $50,000 to $99,999 | 61 (23.6%) | 30 (16.6%) |
| $100,000 to $299,999 | 140 (54.3%) | 114 (63.0%) |
| $300,000 to $499,999 | 10 (3.9%) | 15 (8.3%) |
| $500,000 to $749,999 | 0 (0.0%) | 9 (5.0%) |
| $750,000 to $999,999 | 0 (0.0%) | 0 (0.0%) |
| $1,000,000 or more | 0 (0.0%) | 0 (0.0%) |
| Total | 258 (100.0%) | 181 (100.0%) |
Household Income by Mortgage Status in Sublette
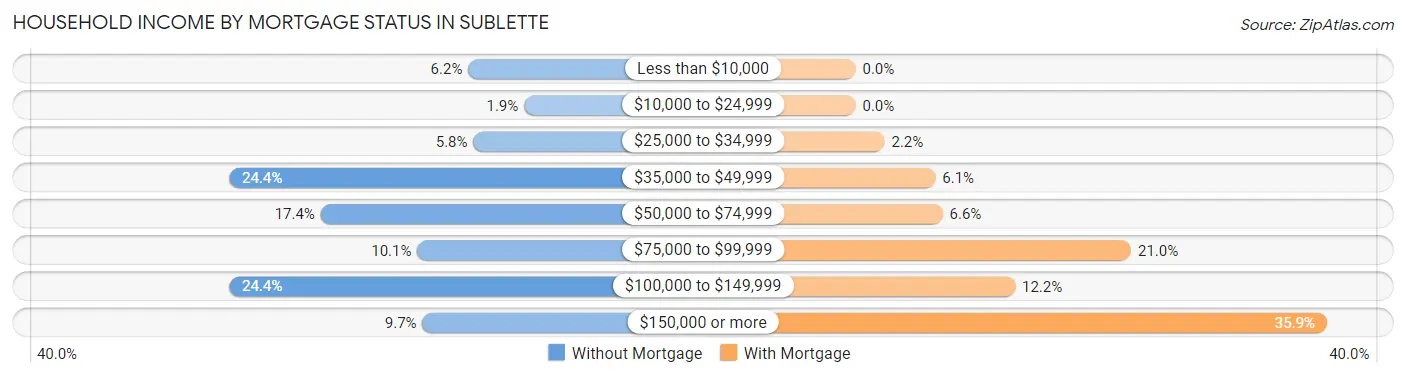
| Household Income | Without Mortgage | With Mortgage |
| Less than $10,000 | 16 (6.2%) | 0 (0.0%) |
| $10,000 to $24,999 | 5 (1.9%) | 0 (0.0%) |
| $25,000 to $34,999 | 15 (5.8%) | 4 (2.2%) |
| $35,000 to $49,999 | 63 (24.4%) | 11 (6.1%) |
| $50,000 to $74,999 | 45 (17.4%) | 12 (6.6%) |
| $75,000 to $99,999 | 26 (10.1%) | 38 (21.0%) |
| $100,000 to $149,999 | 63 (24.4%) | 22 (12.1%) |
| $150,000 or more | 25 (9.7%) | 65 (35.9%) |
| Total | 258 (100.0%) | 181 (100.0%) |
Property Value to Household Income Ratio in Sublette
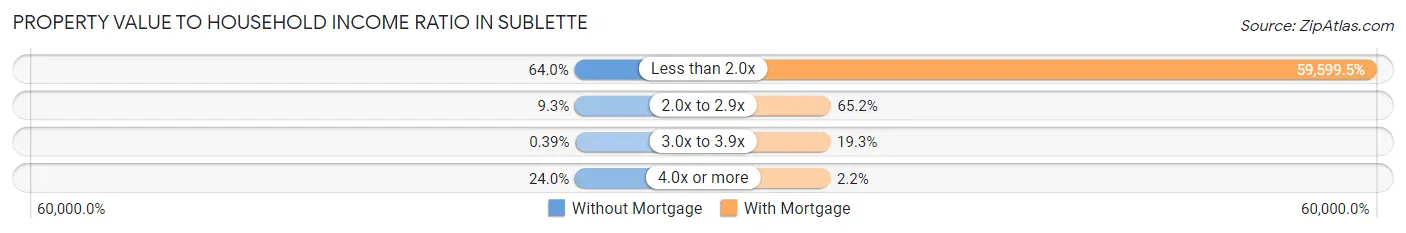
| Value-to-Income Ratio | Without Mortgage | With Mortgage |
| Less than 2.0x | 165 (63.9%) | 107,875 (59,599.5%) |
| 2.0x to 2.9x | 24 (9.3%) | 118 (65.2%) |
| 3.0x to 3.9x | 1 (0.4%) | 35 (19.3%) |
| 4.0x or more | 62 (24.0%) | 4 (2.2%) |
| Total | 258 (100.0%) | 181 (100.0%) |
Real Estate Taxes by Mortgage Status in Sublette
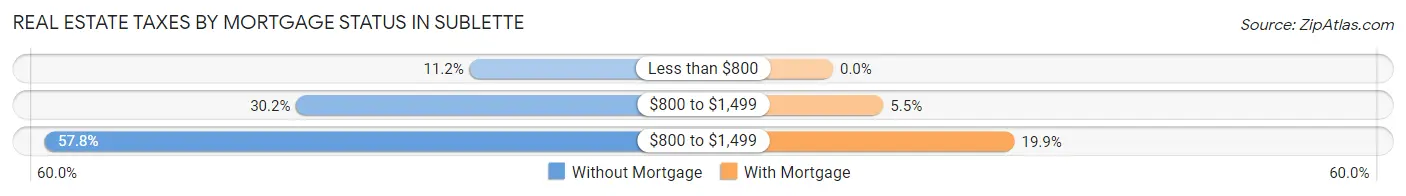
| Property Taxes | Without Mortgage | With Mortgage |
| Less than $800 | 29 (11.2%) | 0 (0.0%) |
| $800 to $1,499 | 78 (30.2%) | 10 (5.5%) |
| $800 to $1,499 | 149 (57.8%) | 36 (19.9%) |
| Total | 258 (100.0%) | 181 (100.0%) |
Health & Disability in Sublette
Health Insurance Coverage by Age in Sublette
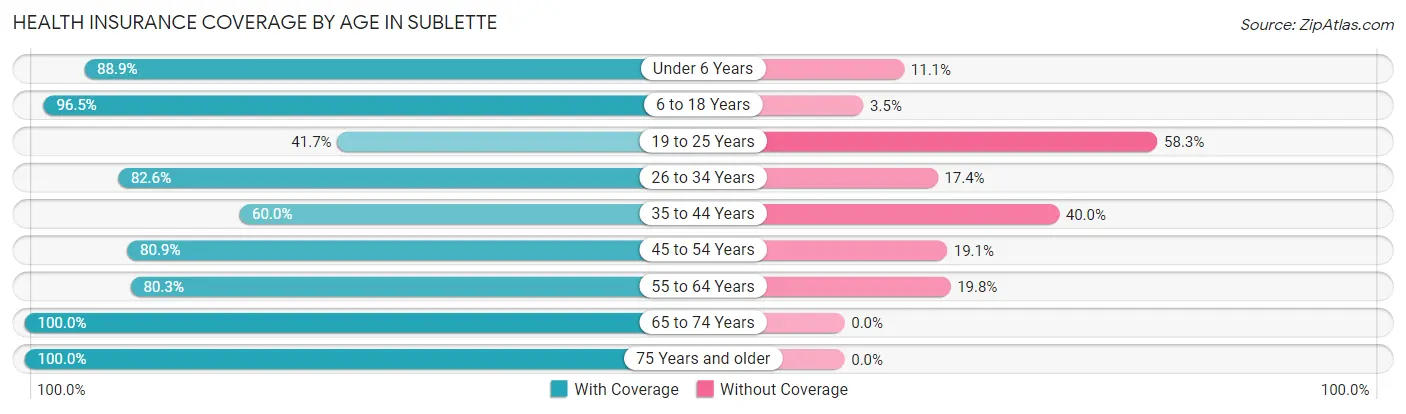
| Age Bracket | With Coverage | Without Coverage |
| Under 6 Years | 128 (88.9%) | 16 (11.1%) |
| 6 to 18 Years | 192 (96.5%) | 7 (3.5%) |
| 19 to 25 Years | 60 (41.7%) | 84 (58.3%) |
| 26 to 34 Years | 138 (82.6%) | 29 (17.4%) |
| 35 to 44 Years | 99 (60.0%) | 66 (40.0%) |
| 45 to 54 Years | 110 (80.9%) | 26 (19.1%) |
| 55 to 64 Years | 130 (80.2%) | 32 (19.8%) |
| 65 to 74 Years | 171 (100.0%) | 0 (0.0%) |
| 75 Years and older | 86 (100.0%) | 0 (0.0%) |
| Total | 1,114 (81.1%) | 260 (18.9%) |
Health Insurance Coverage by Citizenship Status in Sublette
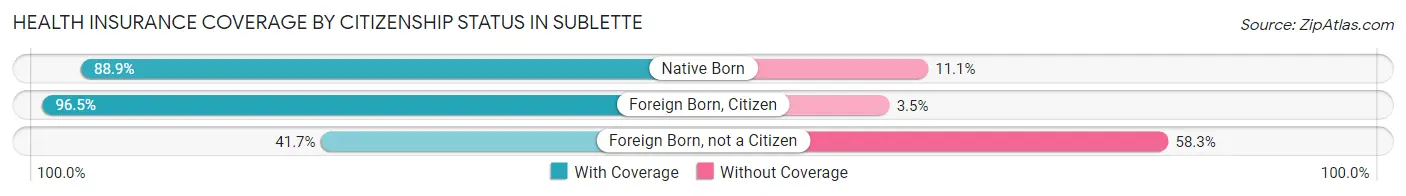
| Citizenship Status | With Coverage | Without Coverage |
| Native Born | 128 (88.9%) | 16 (11.1%) |
| Foreign Born, Citizen | 192 (96.5%) | 7 (3.5%) |
| Foreign Born, not a Citizen | 60 (41.7%) | 84 (58.3%) |
Health Insurance Coverage by Household Income in Sublette
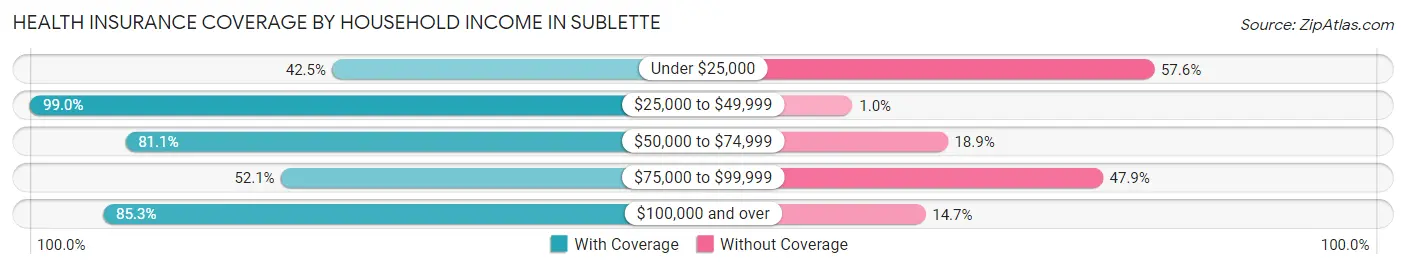
| Household Income | With Coverage | Without Coverage |
| Under $25,000 | 45 (42.4%) | 61 (57.6%) |
| $25,000 to $49,999 | 285 (99.0%) | 3 (1.0%) |
| $50,000 to $74,999 | 228 (81.1%) | 53 (18.9%) |
| $75,000 to $99,999 | 63 (52.1%) | 58 (47.9%) |
| $100,000 and over | 493 (85.3%) | 85 (14.7%) |
Public vs Private Health Insurance Coverage by Age in Sublette
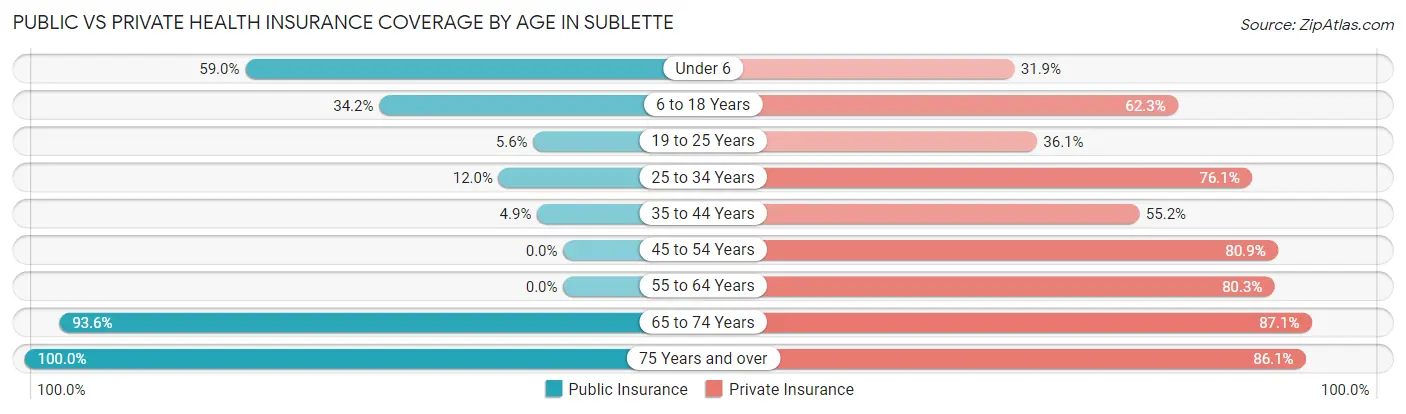
| Age Bracket | Public Insurance | Private Insurance |
| Under 6 | 85 (59.0%) | 46 (31.9%) |
| 6 to 18 Years | 68 (34.2%) | 124 (62.3%) |
| 19 to 25 Years | 8 (5.6%) | 52 (36.1%) |
| 25 to 34 Years | 20 (12.0%) | 127 (76.0%) |
| 35 to 44 Years | 8 (4.9%) | 91 (55.1%) |
| 45 to 54 Years | 0 (0.0%) | 110 (80.9%) |
| 55 to 64 Years | 0 (0.0%) | 130 (80.2%) |
| 65 to 74 Years | 160 (93.6%) | 149 (87.1%) |
| 75 Years and over | 86 (100.0%) | 74 (86.1%) |
| Total | 435 (31.7%) | 903 (65.7%) |
Disability Status by Sex by Age in Sublette
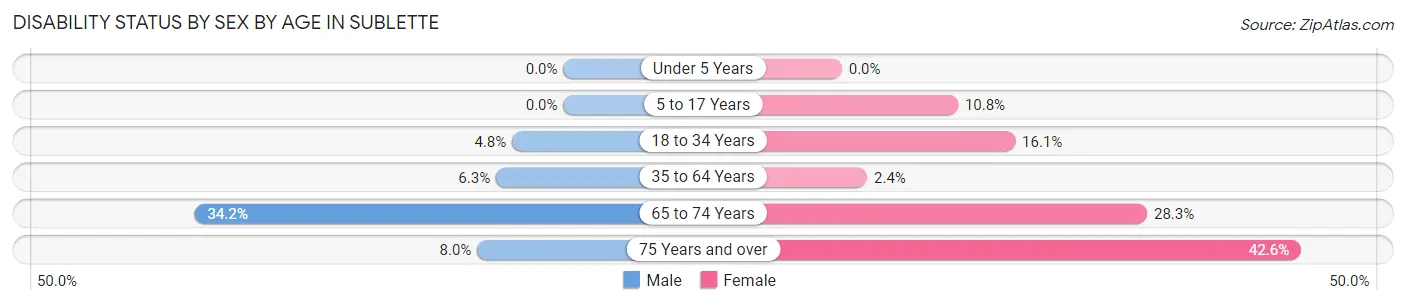
| Age Bracket | Male | Female |
| Under 5 Years | 0 (0.0%) | 0 (0.0%) |
| 5 to 17 Years | 0 (0.0%) | 11 (10.8%) |
| 18 to 34 Years | 7 (4.8%) | 28 (16.1%) |
| 35 to 64 Years | 13 (6.2%) | 6 (2.4%) |
| 65 to 74 Years | 38 (34.2%) | 17 (28.3%) |
| 75 Years and over | 2 (8.0%) | 26 (42.6%) |
Disability Class by Sex by Age in Sublette
Disability Class: Hearing Difficulty
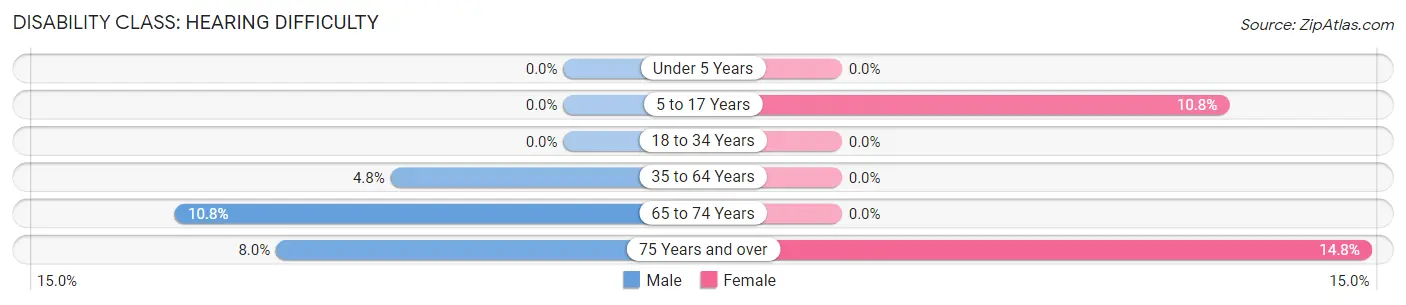
| Age Bracket | Male | Female |
| Under 5 Years | 0 (0.0%) | 0 (0.0%) |
| 5 to 17 Years | 0 (0.0%) | 11 (10.8%) |
| 18 to 34 Years | 0 (0.0%) | 0 (0.0%) |
| 35 to 64 Years | 10 (4.8%) | 0 (0.0%) |
| 65 to 74 Years | 12 (10.8%) | 0 (0.0%) |
| 75 Years and over | 2 (8.0%) | 9 (14.7%) |
Disability Class: Vision Difficulty
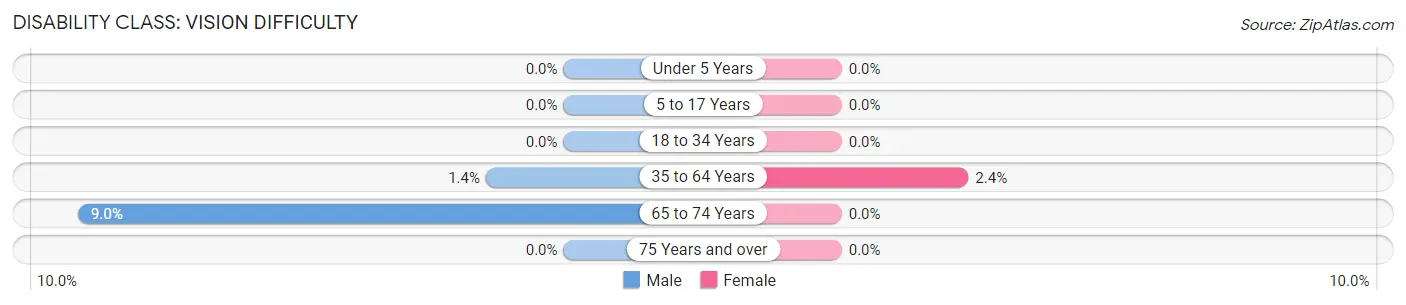
| Age Bracket | Male | Female |
| Under 5 Years | 0 (0.0%) | 0 (0.0%) |
| 5 to 17 Years | 0 (0.0%) | 0 (0.0%) |
| 18 to 34 Years | 0 (0.0%) | 0 (0.0%) |
| 35 to 64 Years | 3 (1.4%) | 6 (2.4%) |
| 65 to 74 Years | 10 (9.0%) | 0 (0.0%) |
| 75 Years and over | 0 (0.0%) | 0 (0.0%) |
Disability Class: Cognitive Difficulty
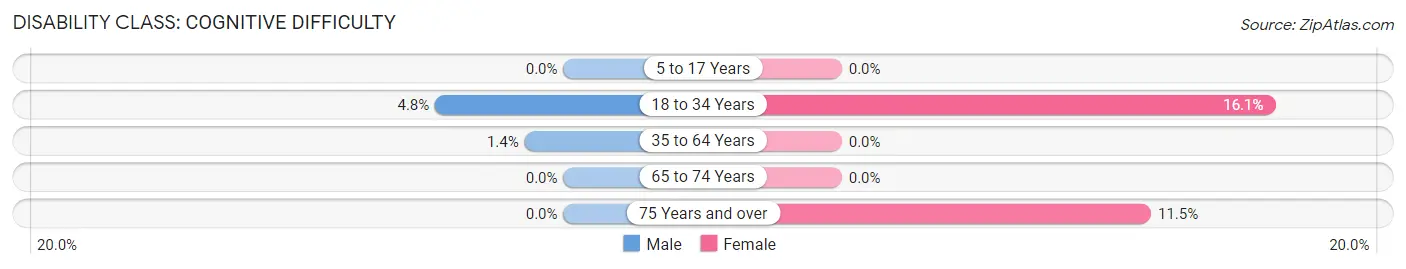
| Age Bracket | Male | Female |
| 5 to 17 Years | 0 (0.0%) | 0 (0.0%) |
| 18 to 34 Years | 7 (4.8%) | 28 (16.1%) |
| 35 to 64 Years | 3 (1.4%) | 0 (0.0%) |
| 65 to 74 Years | 0 (0.0%) | 0 (0.0%) |
| 75 Years and over | 0 (0.0%) | 7 (11.5%) |
Disability Class: Ambulatory Difficulty
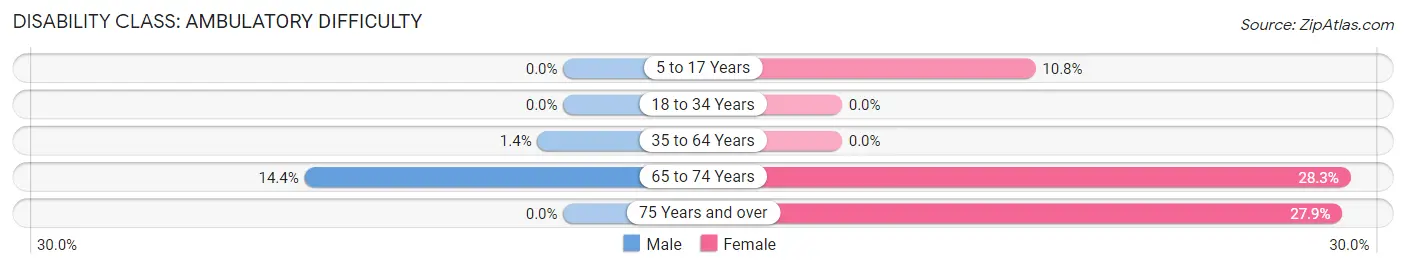
| Age Bracket | Male | Female |
| 5 to 17 Years | 0 (0.0%) | 11 (10.8%) |
| 18 to 34 Years | 0 (0.0%) | 0 (0.0%) |
| 35 to 64 Years | 3 (1.4%) | 0 (0.0%) |
| 65 to 74 Years | 16 (14.4%) | 17 (28.3%) |
| 75 Years and over | 0 (0.0%) | 17 (27.9%) |
Disability Class: Self-Care Difficulty
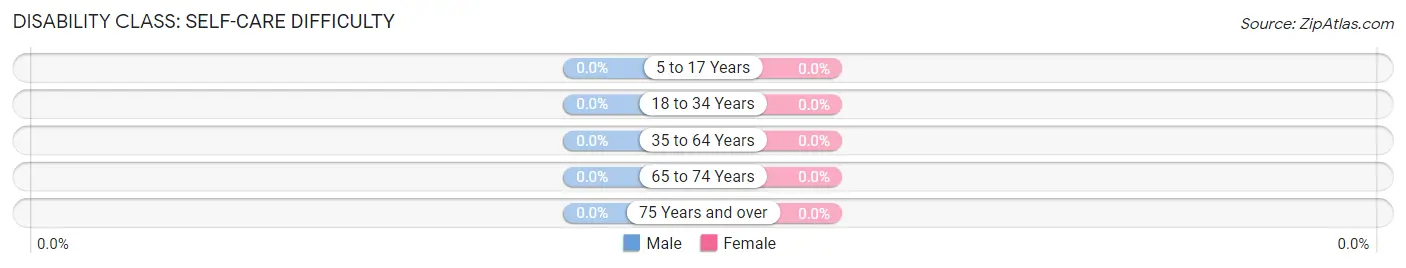
| Age Bracket | Male | Female |
| 5 to 17 Years | 0 (0.0%) | 0 (0.0%) |
| 18 to 34 Years | 0 (0.0%) | 0 (0.0%) |
| 35 to 64 Years | 0 (0.0%) | 0 (0.0%) |
| 65 to 74 Years | 0 (0.0%) | 0 (0.0%) |
| 75 Years and over | 0 (0.0%) | 0 (0.0%) |
Technology Access in Sublette
Computing Device Access in Sublette
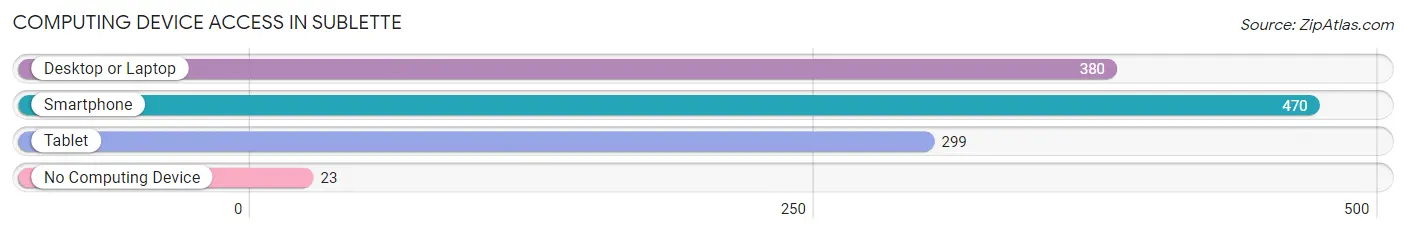
| Device Type | # Households | % Households |
| Desktop or Laptop | 380 | 73.5% |
| Smartphone | 470 | 90.9% |
| Tablet | 299 | 57.8% |
| No Computing Device | 23 | 4.4% |
| Total | 517 | 100.0% |
Internet Access in Sublette
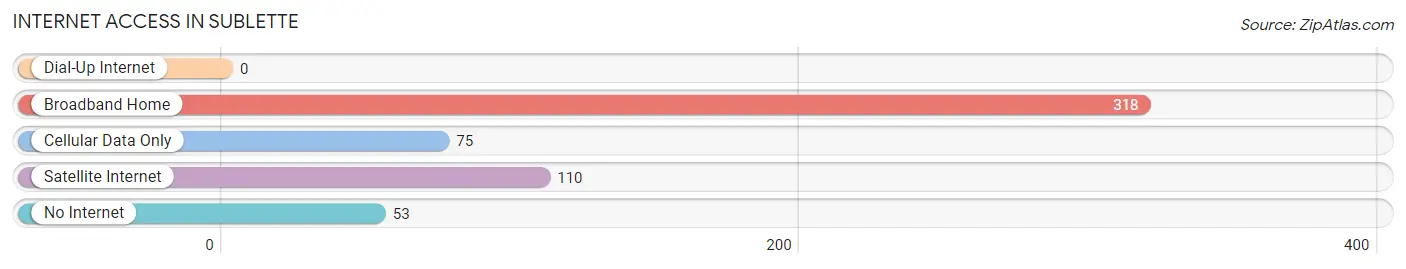
| Internet Type | # Households | % Households |
| Dial-Up Internet | 0 | 0.0% |
| Broadband Home | 318 | 61.5% |
| Cellular Data Only | 75 | 14.5% |
| Satellite Internet | 110 | 21.3% |
| No Internet | 53 | 10.2% |
| Total | 517 | 100.0% |
Sublette Summary
Sublette, Kansas is a small town located in the southwestern corner of the state. It is situated in Haskell County, and is the county seat. The town was founded in 1885 and has a population of 1,717 as of the 2010 census.
Geography
Sublette is located at 37°14'25"N, 100°59'45"W (37.240278, -100.995833). It is situated in the High Plains region of the Great Plains, and is part of the Great Bend-Sublette Micropolitan Statistical Area. The town is located at an elevation of 2,845 feet (867 m).
The town is located in the western part of Haskell County, and is bordered by the towns of Satanta to the north, Copeland to the east, and Satanta to the south. The town is located on the Arkansas River, which flows through the town.
Climate
Sublette has a semi-arid climate, with hot summers and cold winters. The average annual temperature is 54.3°F (12.4°C). The average annual precipitation is 20.2 inches (51.3 cm).
Demographics
As of the 2010 census, there were 1,717 people, 690 households, and 463 families residing in the town. The population density was 1,092.2 people per square mile (421.7/km2). There were 790 housing units at an average density of 498.2 per square mile (192.2/km2). The racial makeup of the town was 87.2% White, 0.2% African American, 0.7% Native American, 0.2% Asian, 0.1% Pacific Islander, 9.7% from other races, and 1.9% from two or more races. Hispanic or Latino of any race were 20.2% of the population.
Economy
Sublette’s economy is largely based on agriculture. The town is home to several grain elevators, and the surrounding area is used for growing wheat, corn, and other crops. The town is also home to several small businesses, including a grocery store, a hardware store, and a few restaurants.
The town is also home to a few manufacturing companies, including a plastics manufacturer and a metal fabrication company. The town is also home to a few oil and gas companies, which are involved in the exploration and production of oil and gas in the area.
Education
Sublette is served by the Sublette Unified School District, which consists of one elementary school, one middle school, and one high school. The town is also home to a branch of the Haskell County Library.
Conclusion
Sublette, Kansas is a small town located in the southwestern corner of the state. It is situated in Haskell County, and is the county seat. The town was founded in 1885 and has a population of 1,717 as of the 2010 census. The town’s economy is largely based on agriculture, and it is also home to several small businesses and manufacturing companies. The town is served by the Sublette Unified School District, and is home to a branch of the Haskell County Library.
Common Questions
What is Per Capita Income in Sublette?
Per Capita income in Sublette is $34,741.
What is the Median Family Income in Sublette?
Median Family Income in Sublette is $107,734.
What is the Median Household income in Sublette?
Median Household Income in Sublette is $66,354.
What is Income or Wage Gap in Sublette?
Income or Wage Gap in Sublette is 42.6%.
Women in Sublette earn 57.4 cents for every dollar earned by a man.
What is Inequality or Gini Index in Sublette?
Inequality or Gini Index in Sublette is 0.39.
What is the Total Population of Sublette?
Total Population of Sublette is 1,385.
What is the Total Male Population of Sublette?
Total Male Population of Sublette is 672.
What is the Total Female Population of Sublette?
Total Female Population of Sublette is 713.
What is the Ratio of Males per 100 Females in Sublette?
There are 94.25 Males per 100 Females in Sublette.
What is the Ratio of Females per 100 Males in Sublette?
There are 106.10 Females per 100 Males in Sublette.
What is the Median Population Age in Sublette?
Median Population Age in Sublette is 37.6 Years.
What is the Average Family Size in Sublette
Average Family Size in Sublette is 3.3 People.
What is the Average Household Size in Sublette
Average Household Size in Sublette is 2.7 People.
How Large is the Labor Force in Sublette?
There are 675 People in the Labor Forcein in Sublette.
What is the Percentage of People in the Labor Force in Sublette?
63.0% of People are in the Labor Force in Sublette.