Westwood, KS Map & Demographics
Westwood Map
Westwood Overview
$56,415
PER CAPITA INCOME
$136,667
AVG FAMILY INCOME
$91,477
AVG HOUSEHOLD INCOME
31.7%
WAGE / INCOME GAP [ % ]
68.3¢/ $1
WAGE / INCOME GAP [ $ ]
0.44
INEQUALITY / GINI INDEX
1,829
TOTAL POPULATION
876
MALE POPULATION
953
FEMALE POPULATION
91.92
MALES / 100 FEMALES
108.79
FEMALES / 100 MALES
36.0
MEDIAN AGE
3.0
AVG FAMILY SIZE
2.3
AVG HOUSEHOLD SIZE
1,084
LABOR FORCE [ PEOPLE ]
74.5%
PERCENT IN LABOR FORCE
0.6%
UNEMPLOYMENT RATE
Westwood Area Codes
Income in Westwood
Income Overview in Westwood
Per Capita Income in Westwood is $56,415, while median incomes of families and households are $136,667 and $91,477 respectively.
| Characteristic | Number | Measure |
| Per Capita Income | 1,829 | $56,415 |
| Median Family Income | 450 | $136,667 |
| Mean Family Income | 450 | $166,082 |
| Median Household Income | 811 | $91,477 |
| Mean Household Income | 811 | $124,298 |
| Income Deficit | 450 | $0 |
| Wage / Income Gap (%) | 1,829 | 31.66% |
| Wage / Income Gap ($) | 1,829 | 68.34¢ per $1 |
| Gini / Inequality Index | 1,829 | 0.44 |
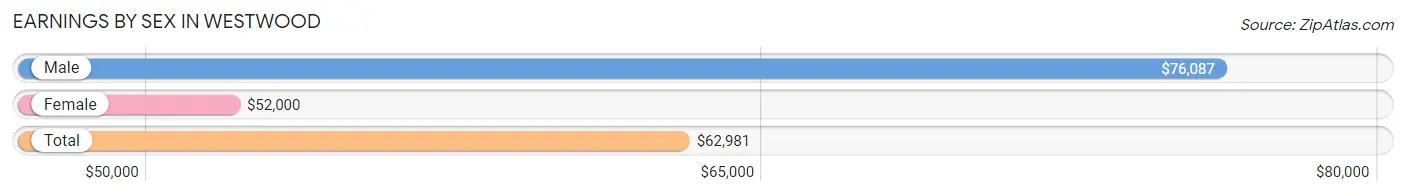
Earnings by Sex in Westwood
Average Earnings in Westwood are $62,981, $76,087 for men and $52,000 for women, a difference of 31.7%.
| Sex | Number | Average Earnings |
| Male | 584 (52.0%) | $76,087 |
| Female | 538 (47.9%) | $52,000 |
| Total | 1,122 (100.0%) | $62,981 |
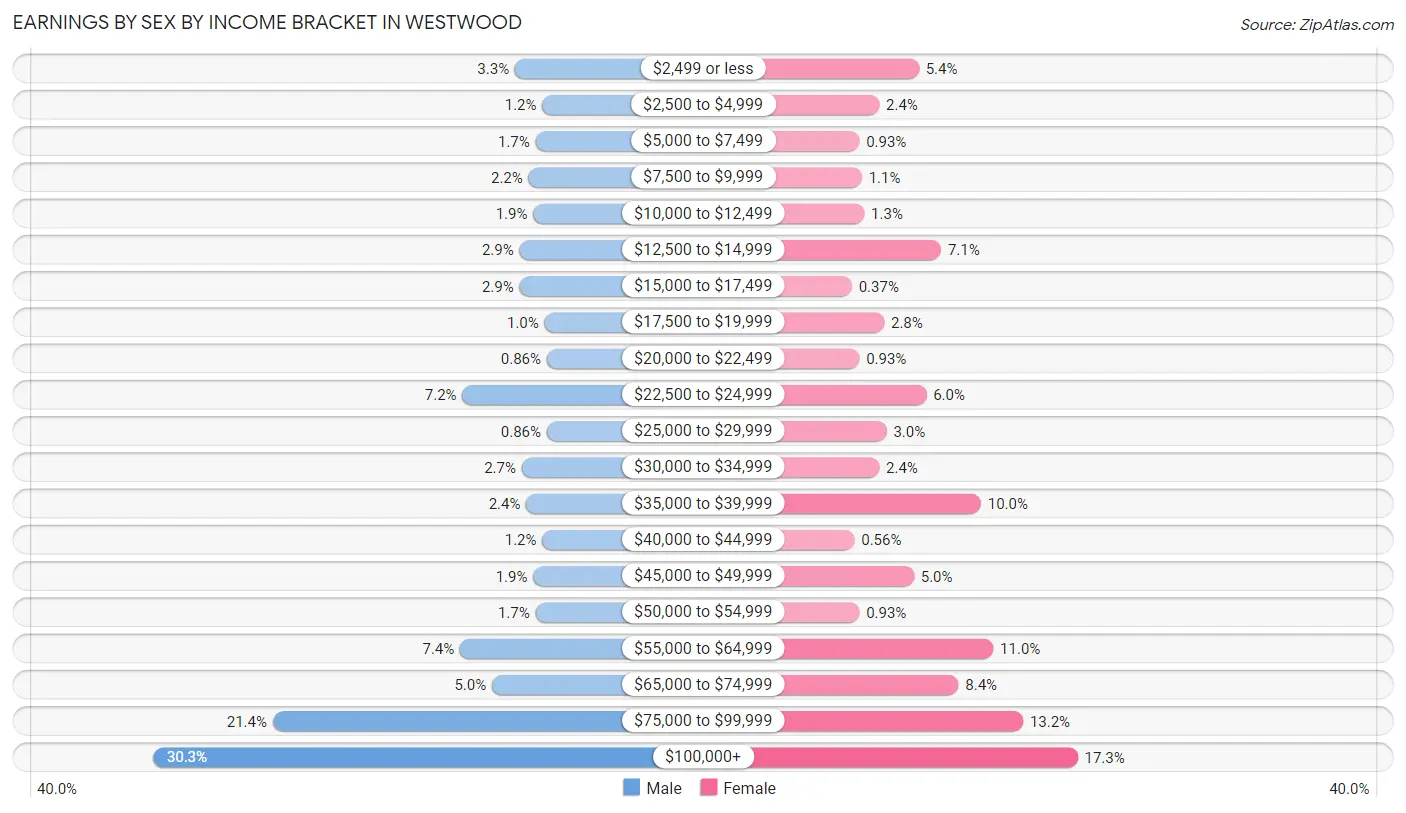
Earnings by Sex by Income Bracket in Westwood
The most common earnings brackets in Westwood are $100,000+ for men (177 | 30.3%) and $100,000+ for women (93 | 17.3%).
| Income | Male | Female |
| $2,499 or less | 19 (3.3%) | 29 (5.4%) |
| $2,500 to $4,999 | 7 (1.2%) | 13 (2.4%) |
| $5,000 to $7,499 | 10 (1.7%) | 5 (0.9%) |
| $7,500 to $9,999 | 13 (2.2%) | 6 (1.1%) |
| $10,000 to $12,499 | 11 (1.9%) | 7 (1.3%) |
| $12,500 to $14,999 | 17 (2.9%) | 38 (7.1%) |
| $15,000 to $17,499 | 17 (2.9%) | 2 (0.4%) |
| $17,500 to $19,999 | 6 (1.0%) | 15 (2.8%) |
| $20,000 to $22,499 | 5 (0.9%) | 5 (0.9%) |
| $22,500 to $24,999 | 42 (7.2%) | 32 (5.9%) |
| $25,000 to $29,999 | 5 (0.9%) | 16 (3.0%) |
| $30,000 to $34,999 | 16 (2.7%) | 13 (2.4%) |
| $35,000 to $39,999 | 14 (2.4%) | 54 (10.0%) |
| $40,000 to $44,999 | 7 (1.2%) | 3 (0.6%) |
| $45,000 to $49,999 | 11 (1.9%) | 27 (5.0%) |
| $50,000 to $54,999 | 10 (1.7%) | 5 (0.9%) |
| $55,000 to $64,999 | 43 (7.4%) | 59 (11.0%) |
| $65,000 to $74,999 | 29 (5.0%) | 45 (8.4%) |
| $75,000 to $99,999 | 125 (21.4%) | 71 (13.2%) |
| $100,000+ | 177 (30.3%) | 93 (17.3%) |
| Total | 584 (100.0%) | 538 (100.0%) |
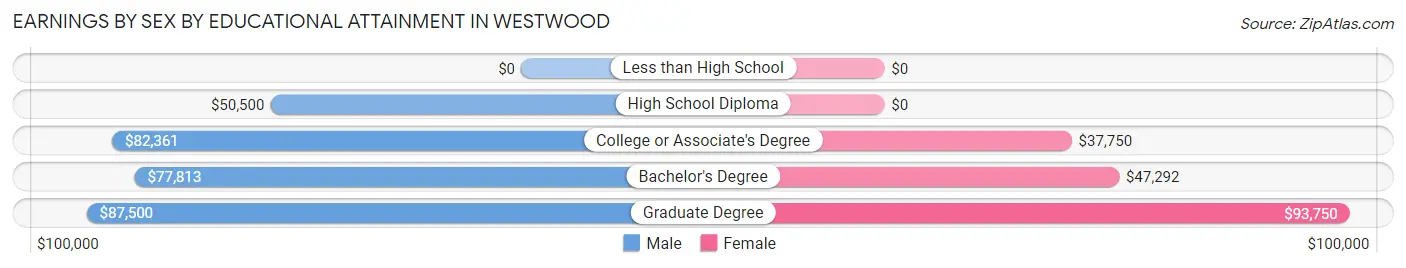
Earnings by Sex by Educational Attainment in Westwood
Average earnings in Westwood are $81,719 for men and $61,548 for women, a difference of 24.7%. Men with an educational attainment of graduate degree enjoy the highest average annual earnings of $87,500, while those with high school diploma education earn the least with $50,500. Women with an educational attainment of graduate degree earn the most with the average annual earnings of $93,750, while those with college or associate's degree education have the smallest earnings of $37,750.
| Educational Attainment | Male Income | Female Income |
| Less than High School | - | - |
| High School Diploma | $50,500 | $0 |
| College or Associate's Degree | $82,361 | $37,750 |
| Bachelor's Degree | $77,813 | $47,292 |
| Graduate Degree | $87,500 | $93,750 |
| Total | $81,719 | $61,548 |
Family Income in Westwood
Family Income Brackets in Westwood
According to the Westwood family income data, there are 113 families falling into the $200,000+ income range, which is the most common income bracket and makes up 25.1% of all families.
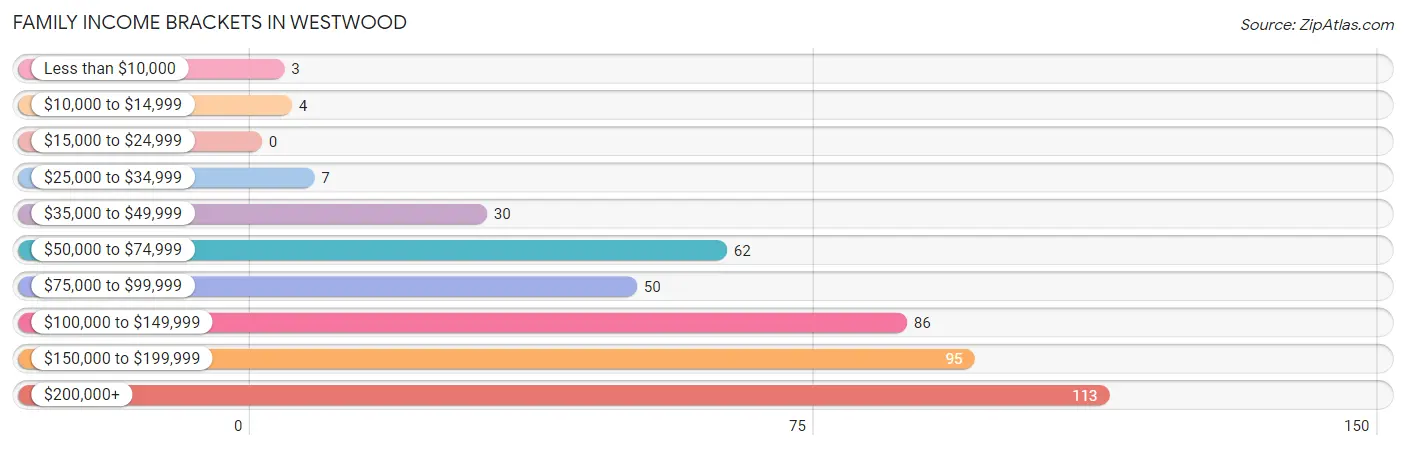
| Income Bracket | # Families | % Families |
| Less than $10,000 | 3 | 0.7% |
| $10,000 to $14,999 | 4 | 0.9% |
| $15,000 to $24,999 | 0 | 0.0% |
| $25,000 to $34,999 | 7 | 1.6% |
| $35,000 to $49,999 | 30 | 6.7% |
| $50,000 to $74,999 | 62 | 13.8% |
| $75,000 to $99,999 | 50 | 11.1% |
| $100,000 to $149,999 | 86 | 19.1% |
| $150,000 to $199,999 | 95 | 21.1% |
| $200,000+ | 113 | 25.1% |
Family Income by Famaliy Size in Westwood
4-person families (95 | 21.1%) account for the highest median family income in Westwood with $162,188 per family, while 2-person families (230 | 51.1%) have the highest median income of $66,389 per family member.
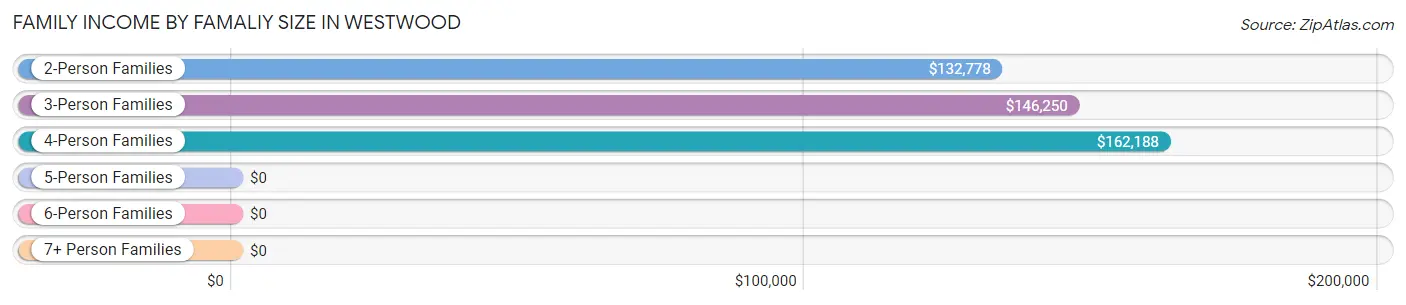
| Income Bracket | # Families | Median Income |
| 2-Person Families | 230 (51.1%) | $132,778 |
| 3-Person Families | 96 (21.3%) | $146,250 |
| 4-Person Families | 95 (21.1%) | $162,188 |
| 5-Person Families | 23 (5.1%) | $0 |
| 6-Person Families | 6 (1.3%) | $0 |
| 7+ Person Families | 0 (0.0%) | $0 |
| Total | 450 (100.0%) | $136,667 |
Family Income by Number of Earners in Westwood
The median family income in Westwood is $136,667, with families comprising 3+ earners (28) having the highest median family income of $205,000, while families with 1 earner (126) have the lowest median family income of $88,611, accounting for 6.2% and 28.0% of families, respectively.
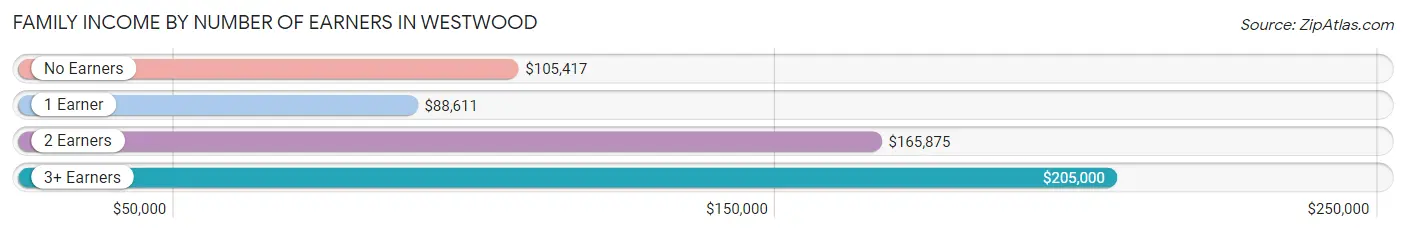
| Number of Earners | # Families | Median Income |
| No Earners | 29 (6.4%) | $105,417 |
| 1 Earner | 126 (28.0%) | $88,611 |
| 2 Earners | 267 (59.3%) | $165,875 |
| 3+ Earners | 28 (6.2%) | $205,000 |
| Total | 450 (100.0%) | $136,667 |
Household Income in Westwood
Household Income Brackets in Westwood
With 141 households falling in the category, the $100,000 to $149,999 income range is the most frequent in Westwood, accounting for 17.4% of all households. In contrast, only 7 households (0.9%) fall into the less than $10,000 income bracket, making it the least populous group.
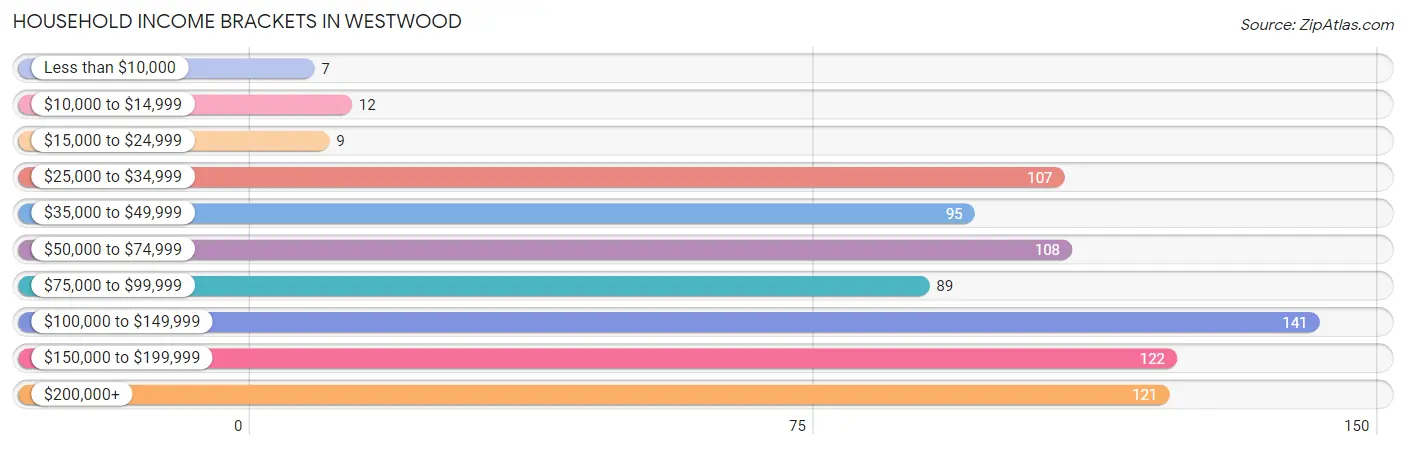
| Income Bracket | # Households | % Households |
| Less than $10,000 | 7 | 0.9% |
| $10,000 to $14,999 | 12 | 1.5% |
| $15,000 to $24,999 | 9 | 1.1% |
| $25,000 to $34,999 | 107 | 13.2% |
| $35,000 to $49,999 | 95 | 11.7% |
| $50,000 to $74,999 | 108 | 13.3% |
| $75,000 to $99,999 | 89 | 11.0% |
| $100,000 to $149,999 | 141 | 17.4% |
| $150,000 to $199,999 | 122 | 15.0% |
| $200,000+ | 121 | 14.9% |
Household Income by Householder Age in Westwood
The median household income in Westwood is $91,477, with the highest median household income of $137,917 found in the 45 to 64 years age bracket for the primary householder. A total of 219 households (27.0%) fall into this category. Meanwhile, the 15 to 24 years age bracket for the primary householder has the lowest median household income of $41,667, with 38 households (4.7%) in this group.
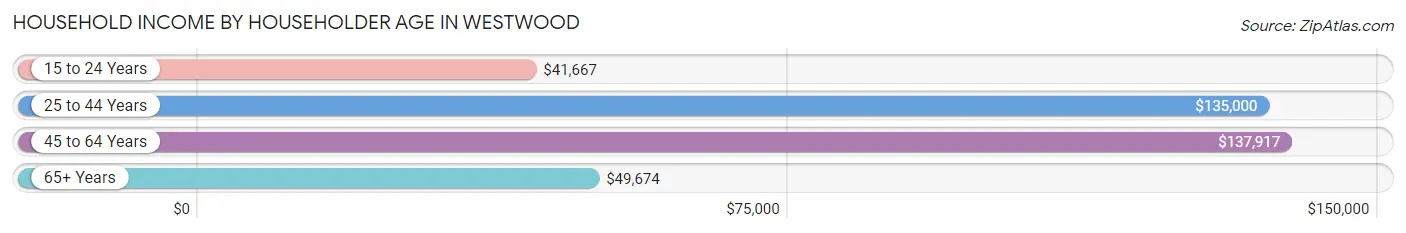
| Income Bracket | # Households | Median Income |
| 15 to 24 Years | 38 (4.7%) | $41,667 |
| 25 to 44 Years | 276 (34.0%) | $135,000 |
| 45 to 64 Years | 219 (27.0%) | $137,917 |
| 65+ Years | 278 (34.3%) | $49,674 |
| Total | 811 (100.0%) | $91,477 |
Poverty in Westwood
Income Below Poverty by Sex and Age in Westwood
With 2.6% poverty level for males and 4.0% for females among the residents of Westwood, 5 year old males and 16 and 17 year old females are the most vulnerable to poverty, with 2 males (25.0%) and 4 females (23.5%) in their respective age groups living below the poverty level.
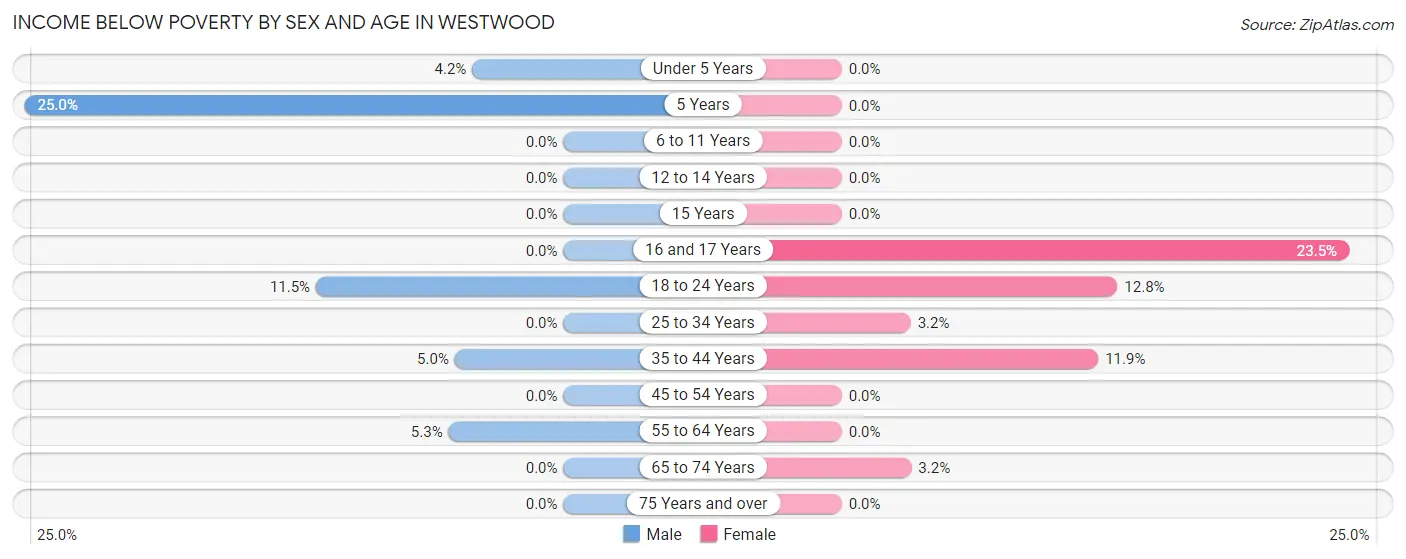
| Age Bracket | Male | Female |
| Under 5 Years | 3 (4.2%) | 0 (0.0%) |
| 5 Years | 2 (25.0%) | 0 (0.0%) |
| 6 to 11 Years | 0 (0.0%) | 0 (0.0%) |
| 12 to 14 Years | 0 (0.0%) | 0 (0.0%) |
| 15 Years | 0 (0.0%) | 0 (0.0%) |
| 16 and 17 Years | 0 (0.0%) | 4 (23.5%) |
| 18 to 24 Years | 7 (11.5%) | 11 (12.8%) |
| 25 to 34 Years | 0 (0.0%) | 4 (3.2%) |
| 35 to 44 Years | 7 (5.0%) | 15 (11.9%) |
| 45 to 54 Years | 0 (0.0%) | 0 (0.0%) |
| 55 to 64 Years | 4 (5.3%) | 0 (0.0%) |
| 65 to 74 Years | 0 (0.0%) | 4 (3.2%) |
| 75 Years and over | 0 (0.0%) | 0 (0.0%) |
| Total | 23 (2.6%) | 38 (4.0%) |
Income Above Poverty by Sex and Age in Westwood
According to the poverty statistics in Westwood, males aged 6 to 11 years and females aged under 5 years are the age groups that are most secure financially, with 100.0% of males and 100.0% of females in these age groups living above the poverty line.
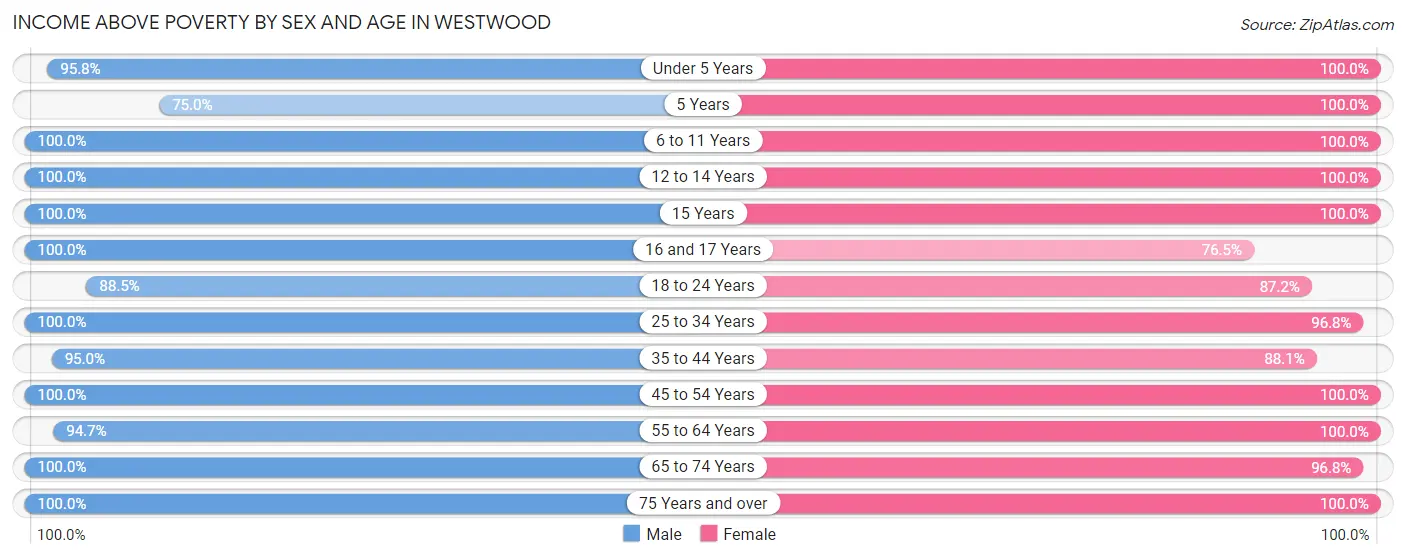
| Age Bracket | Male | Female |
| Under 5 Years | 68 (95.8%) | 31 (100.0%) |
| 5 Years | 6 (75.0%) | 14 (100.0%) |
| 6 to 11 Years | 67 (100.0%) | 89 (100.0%) |
| 12 to 14 Years | 44 (100.0%) | 17 (100.0%) |
| 15 Years | 2 (100.0%) | 22 (100.0%) |
| 16 and 17 Years | 23 (100.0%) | 13 (76.5%) |
| 18 to 24 Years | 54 (88.5%) | 75 (87.2%) |
| 25 to 34 Years | 153 (100.0%) | 121 (96.8%) |
| 35 to 44 Years | 132 (95.0%) | 111 (88.1%) |
| 45 to 54 Years | 90 (100.0%) | 91 (100.0%) |
| 55 to 64 Years | 71 (94.7%) | 83 (100.0%) |
| 65 to 74 Years | 86 (100.0%) | 120 (96.8%) |
| 75 Years and over | 53 (100.0%) | 123 (100.0%) |
| Total | 849 (97.4%) | 910 (96.0%) |
Income Below Poverty Among Married-Couple Families in Westwood
The poverty statistics for married-couple families in Westwood show that 1.8% or 7 of the total 380 families live below the poverty line. Families with 1 or 2 children have the highest poverty rate of 5.3%, comprising of 7 families. On the other hand, families with no children have the lowest poverty rate of 0.0%, which includes 0 families.
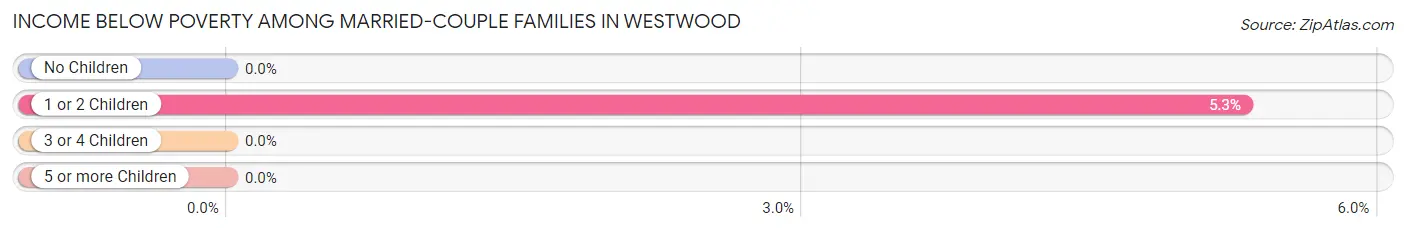
| Children | Above Poverty | Below Poverty |
| No Children | 220 (100.0%) | 0 (0.0%) |
| 1 or 2 Children | 125 (94.7%) | 7 (5.3%) |
| 3 or 4 Children | 28 (100.0%) | 0 (0.0%) |
| 5 or more Children | 0 (0.0%) | 0 (0.0%) |
| Total | 373 (98.2%) | 7 (1.8%) |
Income Below Poverty Among Single-Parent Households in Westwood
| Children | Single Father | Single Mother |
| No Children | 0 (0.0%) | 0 (0.0%) |
| 1 or 2 Children | 0 (0.0%) | 0 (0.0%) |
| 3 or 4 Children | 0 (0.0%) | 0 (0.0%) |
| 5 or more Children | 0 (0.0%) | 0 (0.0%) |
| Total | 0 (0.0%) | 0 (0.0%) |
Income Below Poverty Among Married-Couple vs Single-Parent Households in Westwood
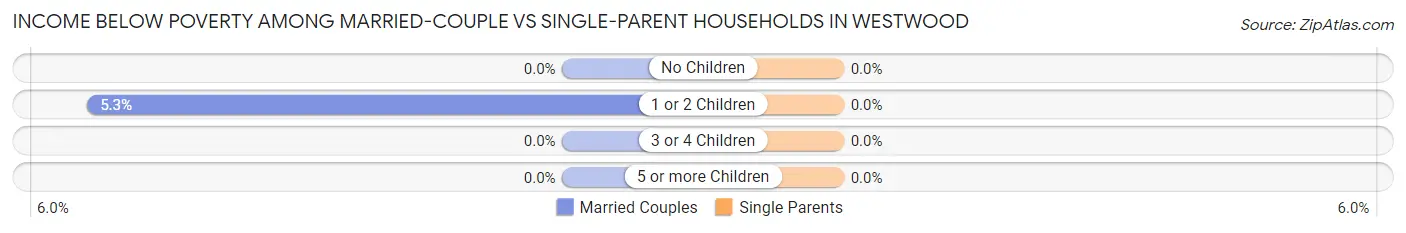
| Children | Married-Couple Families | Single-Parent Households |
| No Children | 0 (0.0%) | 0 (0.0%) |
| 1 or 2 Children | 7 (5.3%) | 0 (0.0%) |
| 3 or 4 Children | 0 (0.0%) | 0 (0.0%) |
| 5 or more Children | 0 (0.0%) | 0 (0.0%) |
| Total | 7 (1.8%) | 0 (0.0%) |
Race in Westwood
The most populous races in Westwood are White / Caucasian (1,665 | 91.0%), Hispanic or Latino (256 | 14.0%), and Two or more Races (71 | 3.9%).
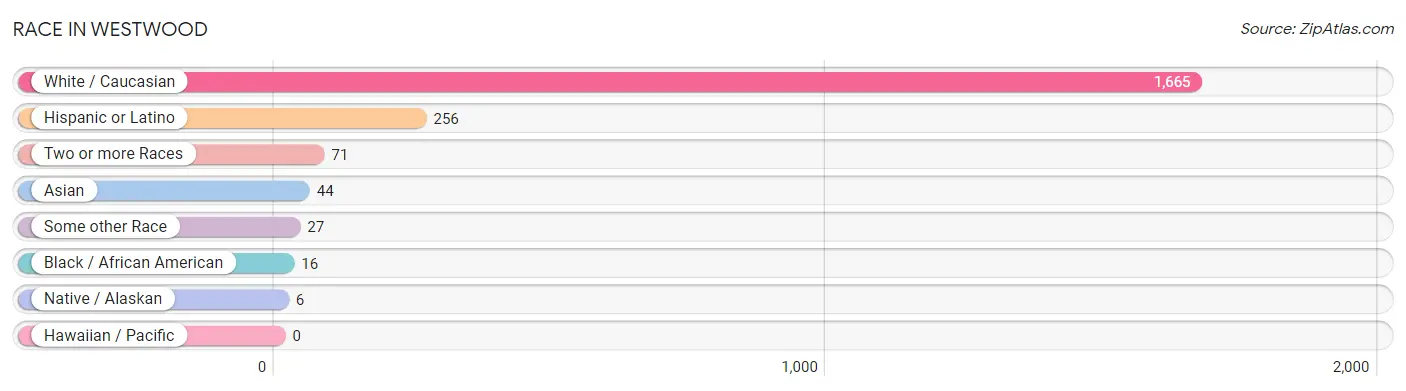
| Race | # Population | % Population |
| Asian | 44 | 2.4% |
| Black / African American | 16 | 0.9% |
| Hawaiian / Pacific | 0 | 0.0% |
| Hispanic or Latino | 256 | 14.0% |
| Native / Alaskan | 6 | 0.3% |
| White / Caucasian | 1,665 | 91.0% |
| Two or more Races | 71 | 3.9% |
| Some other Race | 27 | 1.5% |
| Total | 1,829 | 100.0% |
Ancestry in Westwood
The most populous ancestries reported in Westwood are German (478 | 26.1%), Irish (317 | 17.3%), English (288 | 15.8%), Mexican (222 | 12.1%), and Italian (103 | 5.6%), together accounting for 77.0% of all Westwood residents.
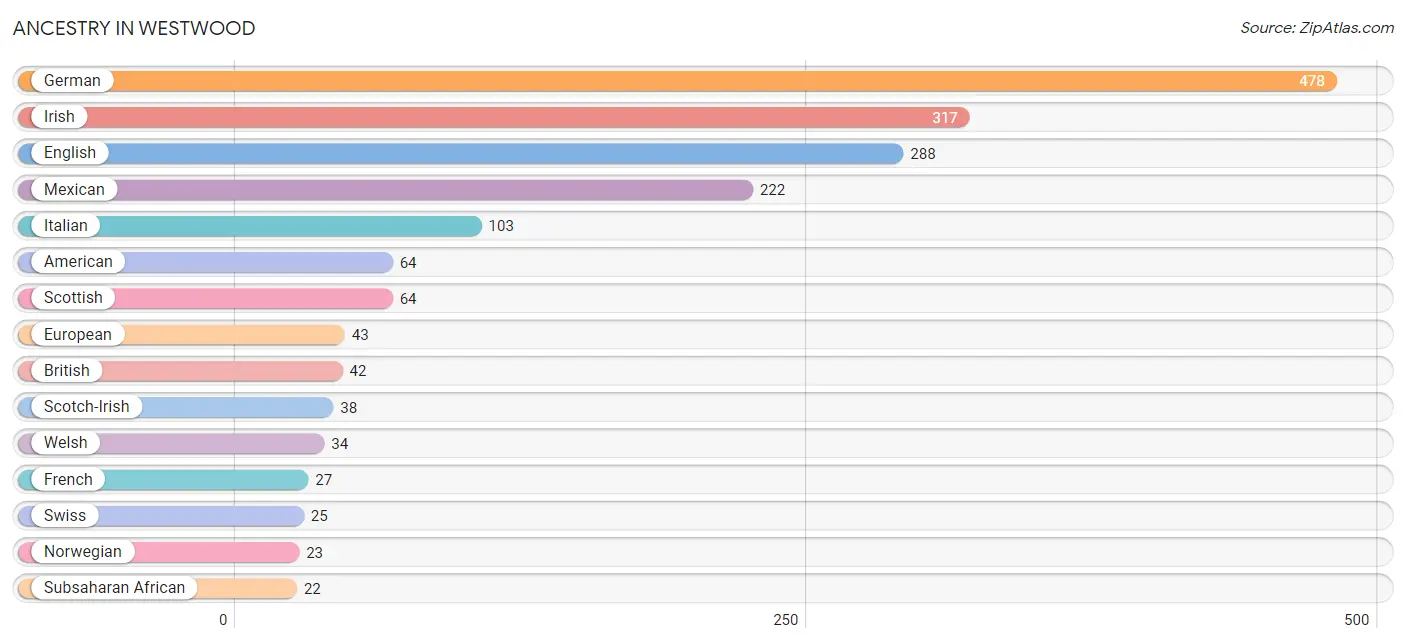
| Ancestry | # Population | % Population |
| African | 6 | 0.3% |
| American | 64 | 3.5% |
| Arab | 5 | 0.3% |
| Belgian | 10 | 0.5% |
| Bhutanese | 3 | 0.2% |
| British | 42 | 2.3% |
| Cherokee | 2 | 0.1% |
| Colombian | 8 | 0.4% |
| Croatian | 8 | 0.4% |
| Cuban | 4 | 0.2% |
| Danish | 14 | 0.8% |
| Dominican | 14 | 0.8% |
| Dutch | 10 | 0.5% |
| Eastern European | 11 | 0.6% |
| Ecuadorian | 8 | 0.4% |
| English | 288 | 15.8% |
| European | 43 | 2.4% |
| French | 27 | 1.5% |
| German | 478 | 26.1% |
| Indian (Asian) | 20 | 1.1% |
| Irish | 317 | 17.3% |
| Italian | 103 | 5.6% |
| Korean | 2 | 0.1% |
| Lithuanian | 4 | 0.2% |
| Luxembourger | 3 | 0.2% |
| Mexican | 222 | 12.1% |
| Northern European | 3 | 0.2% |
| Norwegian | 23 | 1.3% |
| Polish | 19 | 1.0% |
| Scandinavian | 4 | 0.2% |
| Scotch-Irish | 38 | 2.1% |
| Scottish | 64 | 3.5% |
| Slovene | 2 | 0.1% |
| South American | 16 | 0.9% |
| Subsaharan African | 22 | 1.2% |
| Swedish | 21 | 1.1% |
| Swiss | 25 | 1.4% |
| Thai | 12 | 0.7% |
| Ukrainian | 3 | 0.2% |
| Welsh | 34 | 1.9% | View All 40 Rows |
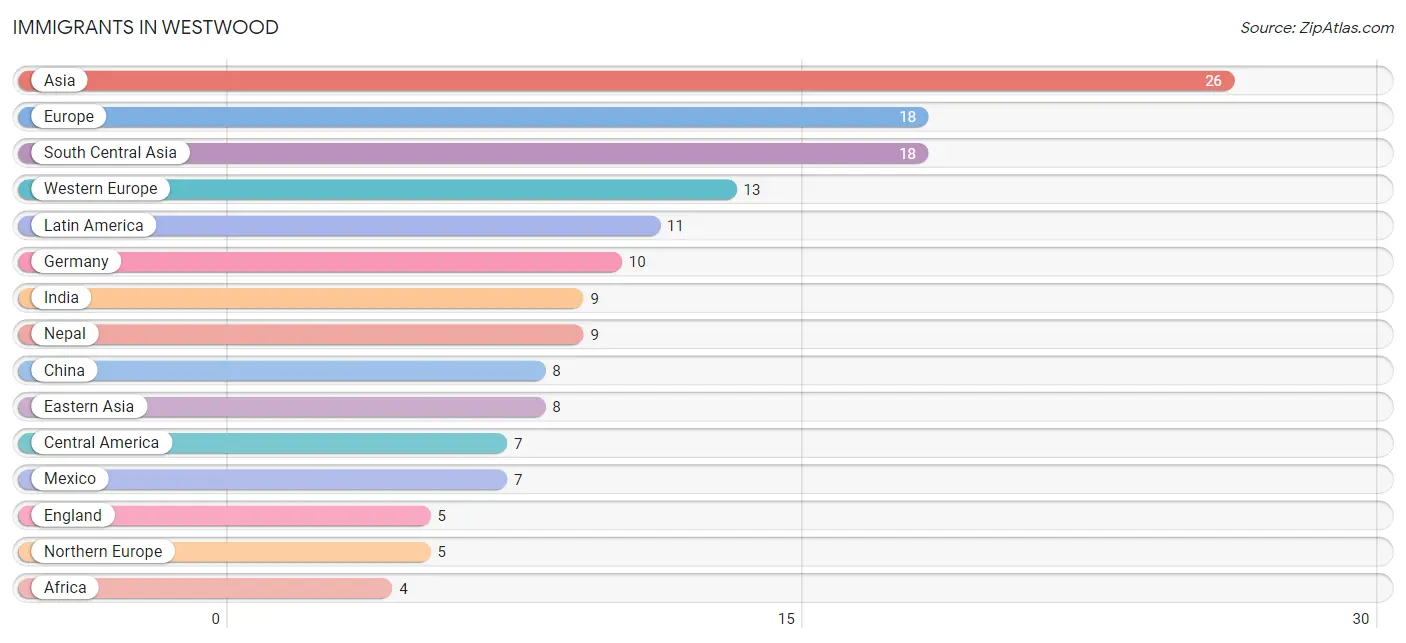
Immigrants in Westwood
The most numerous immigrant groups reported in Westwood came from Asia (26 | 1.4%), Europe (18 | 1.0%), South Central Asia (18 | 1.0%), Western Europe (13 | 0.7%), and Latin America (11 | 0.6%), together accounting for 4.7% of all Westwood residents.
| Immigration Origin | # Population | % Population |
| Africa | 4 | 0.2% |
| Asia | 26 | 1.4% |
| Belgium | 3 | 0.2% |
| Central America | 7 | 0.4% |
| China | 8 | 0.4% |
| Eastern Asia | 8 | 0.4% |
| Ecuador | 4 | 0.2% |
| England | 5 | 0.3% |
| Europe | 18 | 1.0% |
| Germany | 10 | 0.5% |
| India | 9 | 0.5% |
| Latin America | 11 | 0.6% |
| Mexico | 7 | 0.4% |
| Nepal | 9 | 0.5% |
| Northern Europe | 5 | 0.3% |
| South America | 4 | 0.2% |
| South Central Asia | 18 | 1.0% |
| Western Africa | 4 | 0.2% |
| Western Europe | 13 | 0.7% | View All 19 Rows |
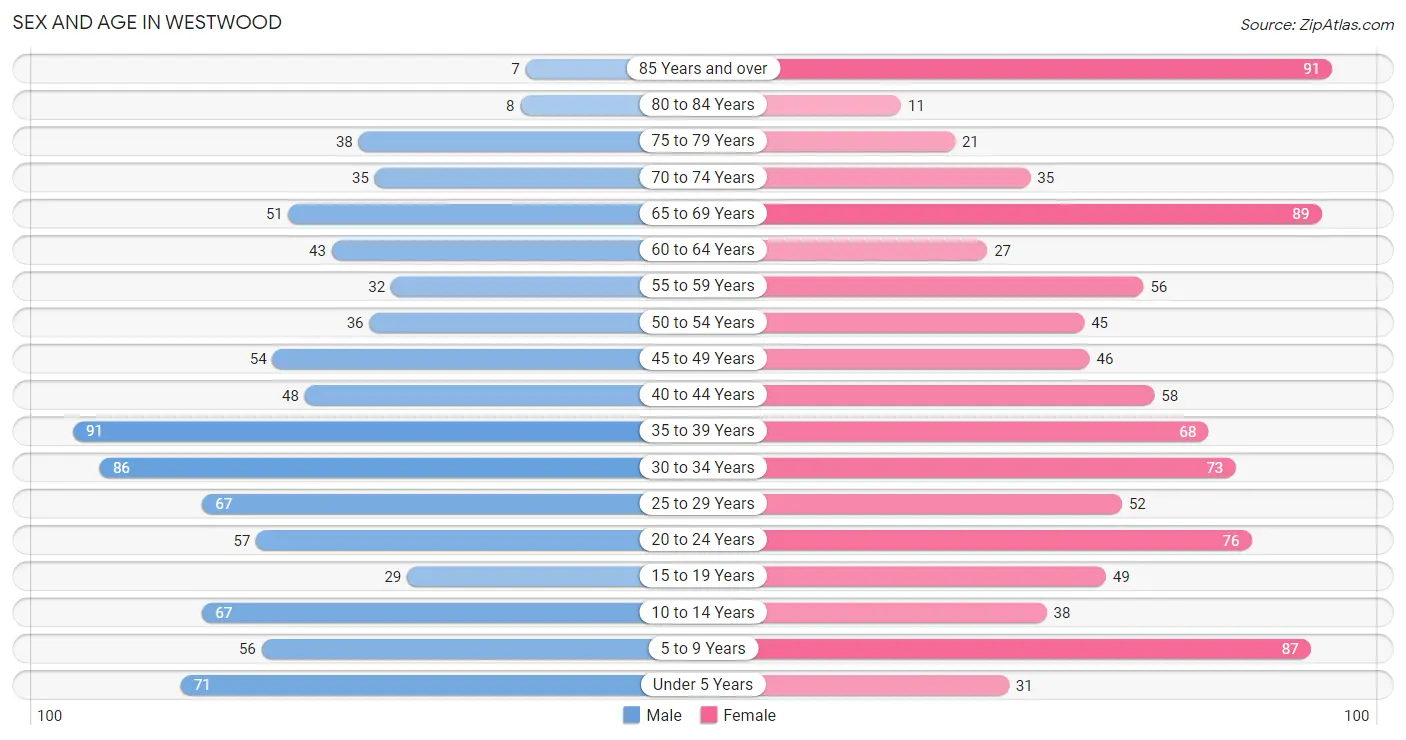
Sex and Age in Westwood
Sex and Age in Westwood
The most populous age groups in Westwood are 35 to 39 Years (91 | 10.4%) for men and 85 Years and over (91 | 9.6%) for women.
| Age Bracket | Male | Female |
| Under 5 Years | 71 (8.1%) | 31 (3.3%) |
| 5 to 9 Years | 56 (6.4%) | 87 (9.1%) |
| 10 to 14 Years | 67 (7.6%) | 38 (4.0%) |
| 15 to 19 Years | 29 (3.3%) | 49 (5.1%) |
| 20 to 24 Years | 57 (6.5%) | 76 (8.0%) |
| 25 to 29 Years | 67 (7.6%) | 52 (5.5%) |
| 30 to 34 Years | 86 (9.8%) | 73 (7.7%) |
| 35 to 39 Years | 91 (10.4%) | 68 (7.1%) |
| 40 to 44 Years | 48 (5.5%) | 58 (6.1%) |
| 45 to 49 Years | 54 (6.2%) | 46 (4.8%) |
| 50 to 54 Years | 36 (4.1%) | 45 (4.7%) |
| 55 to 59 Years | 32 (3.6%) | 56 (5.9%) |
| 60 to 64 Years | 43 (4.9%) | 27 (2.8%) |
| 65 to 69 Years | 51 (5.8%) | 89 (9.3%) |
| 70 to 74 Years | 35 (4.0%) | 35 (3.7%) |
| 75 to 79 Years | 38 (4.3%) | 21 (2.2%) |
| 80 to 84 Years | 8 (0.9%) | 11 (1.1%) |
| 85 Years and over | 7 (0.8%) | 91 (9.6%) |
| Total | 876 (100.0%) | 953 (100.0%) |
Families and Households in Westwood
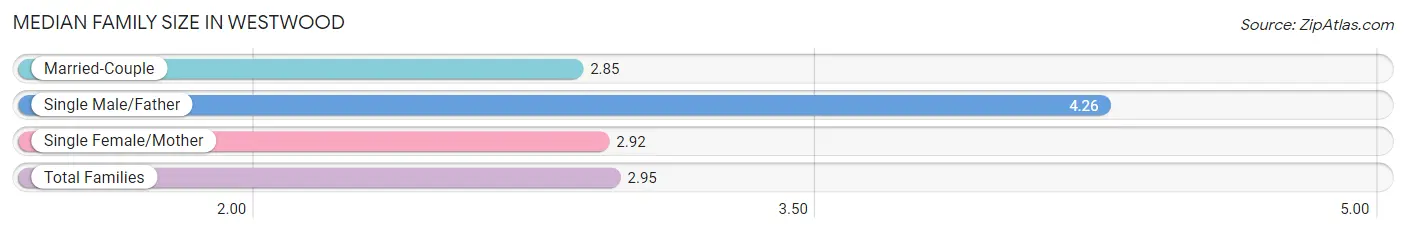
Median Family Size in Westwood
The median family size in Westwood is 2.95 persons per family, with single male/father families (31 | 6.9%) accounting for the largest median family size of 4.26 persons per family. On the other hand, married-couple families (380 | 84.4%) represent the smallest median family size with 2.85 persons per family.
| Family Type | # Families | Family Size |
| Married-Couple | 380 (84.4%) | 2.85 |
| Single Male/Father | 31 (6.9%) | 4.26 |
| Single Female/Mother | 39 (8.7%) | 2.92 |
| Total Families | 450 (100.0%) | 2.95 |
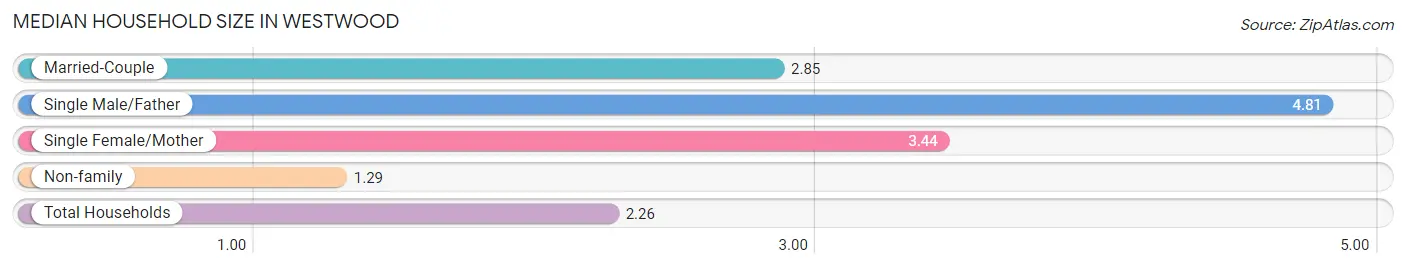
Median Household Size in Westwood
The median household size in Westwood is 2.26 persons per household, with single male/father households (31 | 3.8%) accounting for the largest median household size of 4.81 persons per household. non-family households (361 | 44.5%) represent the smallest median household size with 1.29 persons per household.
| Household Type | # Households | Household Size |
| Married-Couple | 380 (46.9%) | 2.85 |
| Single Male/Father | 31 (3.8%) | 4.81 |
| Single Female/Mother | 39 (4.8%) | 3.44 |
| Non-family | 361 (44.5%) | 1.29 |
| Total Households | 811 (100.0%) | 2.26 |
Household Size by Marriage Status in Westwood
Out of a total of 811 households in Westwood, 450 (55.5%) are family households, while 361 (44.5%) are nonfamily households. The most numerous type of family households are 2-person households, comprising 226, and the most common type of nonfamily households are 1-person households, comprising 297.
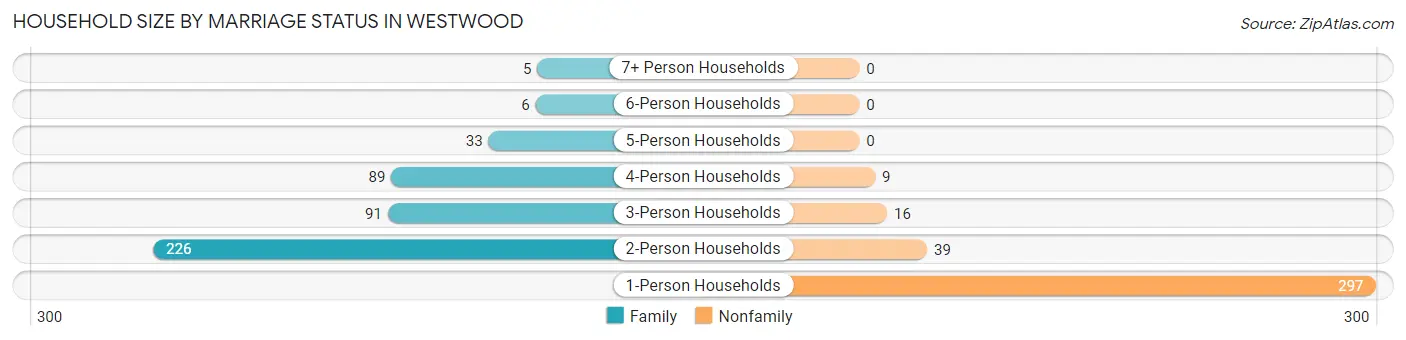
| Household Size | Family Households | Nonfamily Households |
| 1-Person Households | - | 297 (36.6%) |
| 2-Person Households | 226 (27.9%) | 39 (4.8%) |
| 3-Person Households | 91 (11.2%) | 16 (2.0%) |
| 4-Person Households | 89 (11.0%) | 9 (1.1%) |
| 5-Person Households | 33 (4.1%) | 0 (0.0%) |
| 6-Person Households | 6 (0.7%) | 0 (0.0%) |
| 7+ Person Households | 5 (0.6%) | 0 (0.0%) |
| Total | 450 (55.5%) | 361 (44.5%) |
Female Fertility in Westwood
Fertility by Age in Westwood
Average fertility rate in Westwood is 42.0 births per 1,000 women. Women in the age bracket of 20 to 34 years have the highest fertility rate with 50.0 births per 1,000 women. Women in the age bracket of 20 to 34 years acount for 55.6% of all women with births.
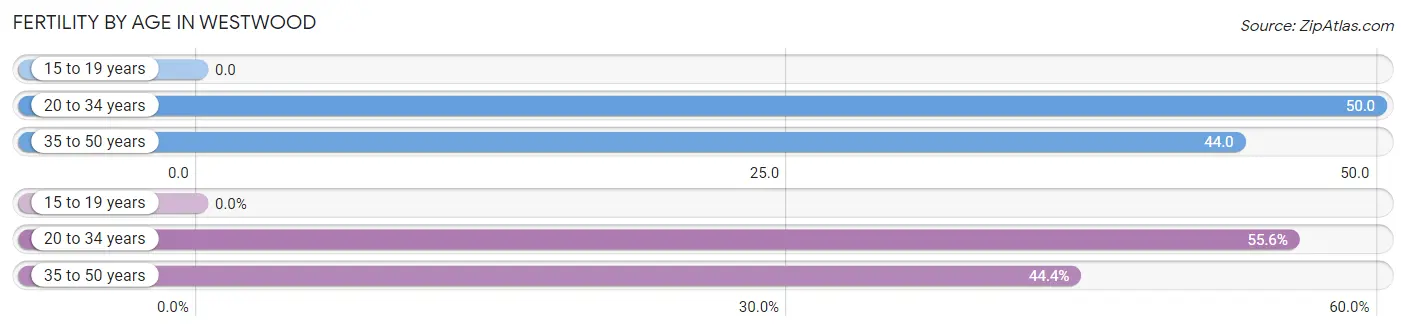
| Age Bracket | Women with Births | Births / 1,000 Women |
| 15 to 19 years | 0 (0.0%) | 0.0 |
| 20 to 34 years | 10 (55.6%) | 50.0 |
| 35 to 50 years | 8 (44.4%) | 44.0 |
| Total | 18 (100.0%) | 42.0 |
Fertility by Age by Marriage Status in Westwood
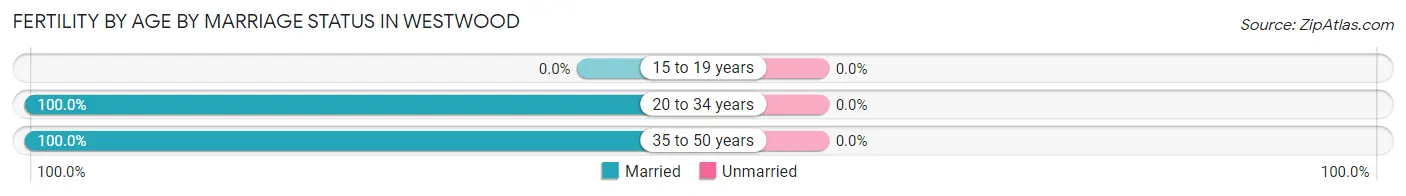
| Age Bracket | Married | Unmarried |
| 15 to 19 years | 0 (0.0%) | 0 (0.0%) |
| 20 to 34 years | 10 (100.0%) | 0 (0.0%) |
| 35 to 50 years | 8 (100.0%) | 0 (0.0%) |
| Total | 18 (100.0%) | 0 (0.0%) |
Fertility by Education in Westwood

| Educational Attainment | Women with Births | Births / 1,000 Women |
| Less than High School | 4 (22.2%) | 66.0 |
| High School Diploma | 0 (0.0%) | 0.0 |
| College or Associate's Degree | 0 (0.0%) | 0.0 |
| Bachelor's Degree | 6 (33.3%) | 42.0 |
| Graduate Degree | 8 (44.4%) | 59.0 |
| Total | 18 (100.0%) | 42.0 |
Fertility by Education by Marriage Status in Westwood
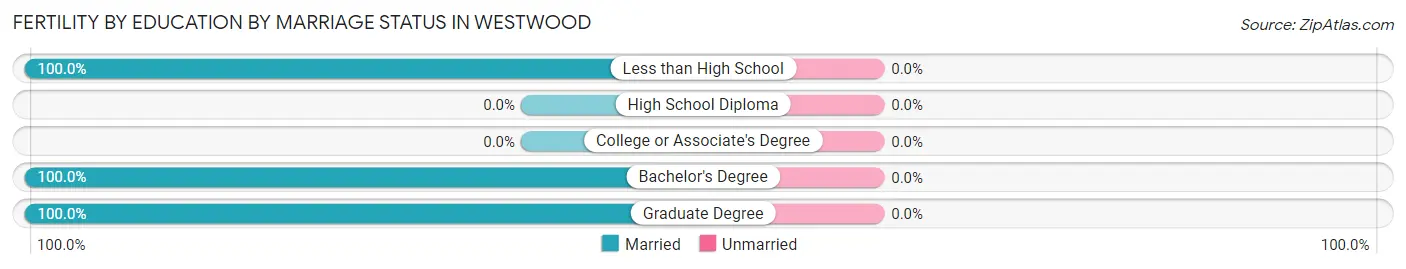
| Educational Attainment | Married | Unmarried |
| Less than High School | 4 (100.0%) | 0 (0.0%) |
| High School Diploma | 0 (0.0%) | 0 (0.0%) |
| College or Associate's Degree | 0 (0.0%) | 0 (0.0%) |
| Bachelor's Degree | 6 (100.0%) | 0 (0.0%) |
| Graduate Degree | 8 (100.0%) | 0 (0.0%) |
| Total | 18 (100.0%) | 0 (0.0%) |
Employment Characteristics in Westwood
Employment by Class of Employer in Westwood
Among the 1,068 employed individuals in Westwood, private company employees (626 | 58.6%), self-employed (not incorporated) (104 | 9.7%), and not-for-profit organizations (100 | 9.4%) make up the most common classes of employment.
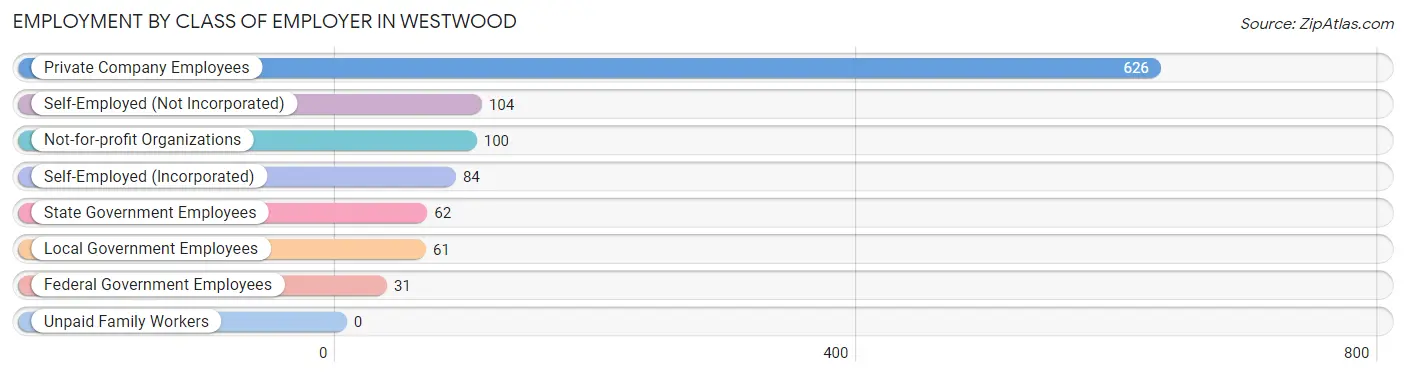
| Employer Class | # Employees | % Employees |
| Private Company Employees | 626 | 58.6% |
| Self-Employed (Incorporated) | 84 | 7.9% |
| Self-Employed (Not Incorporated) | 104 | 9.7% |
| Not-for-profit Organizations | 100 | 9.4% |
| Local Government Employees | 61 | 5.7% |
| State Government Employees | 62 | 5.8% |
| Federal Government Employees | 31 | 2.9% |
| Unpaid Family Workers | 0 | 0.0% |
| Total | 1,068 | 100.0% |
Employment Status by Age in Westwood
According to the labor force statistics for Westwood, out of the total population over 16 years of age (1,455), 74.5% or 1,084 individuals are in the labor force, with 0.6% or 7 of them unemployed. The age group with the highest labor force participation rate is 45 to 54 years, with 98.3% or 178 individuals in the labor force. Within the labor force, the 45 to 54 years age range has the highest percentage of unemployed individuals, with 1.7% or 3 of them being unemployed.
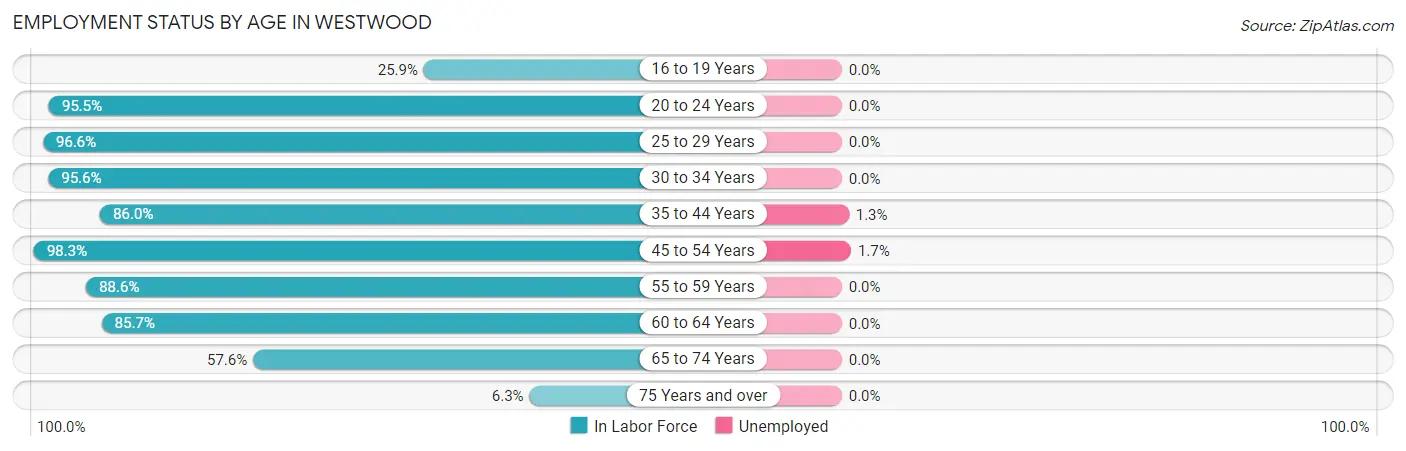
| Age Bracket | In Labor Force | Unemployed |
| 16 to 19 Years | 14 (25.9%) | 0 (0.0%) |
| 20 to 24 Years | 127 (95.5%) | 0 (0.0%) |
| 25 to 29 Years | 115 (96.6%) | 0 (0.0%) |
| 30 to 34 Years | 152 (95.6%) | 0 (0.0%) |
| 35 to 44 Years | 228 (86.0%) | 3 (1.3%) |
| 45 to 54 Years | 178 (98.3%) | 3 (1.7%) |
| 55 to 59 Years | 78 (88.6%) | 0 (0.0%) |
| 60 to 64 Years | 60 (85.7%) | 0 (0.0%) |
| 65 to 74 Years | 121 (57.6%) | 0 (0.0%) |
| 75 Years and over | 11 (6.3%) | 0 (0.0%) |
| Total | 1,084 (74.5%) | 7 (0.6%) |
Employment Status by Educational Attainment in Westwood
According to labor force statistics for Westwood, 92.0% of individuals (811) out of the total population between 25 and 64 years of age (882) are in the labor force, with 0.7% or 6 of them being unemployed. The group with the highest labor force participation rate are those with the educational attainment of bachelor's degree or higher, with 93.8% or 690 individuals in the labor force. Within the labor force, individuals with bachelor's degree or higher education have the highest percentage of unemployment, with 0.9% or 6 of them being unemployed.
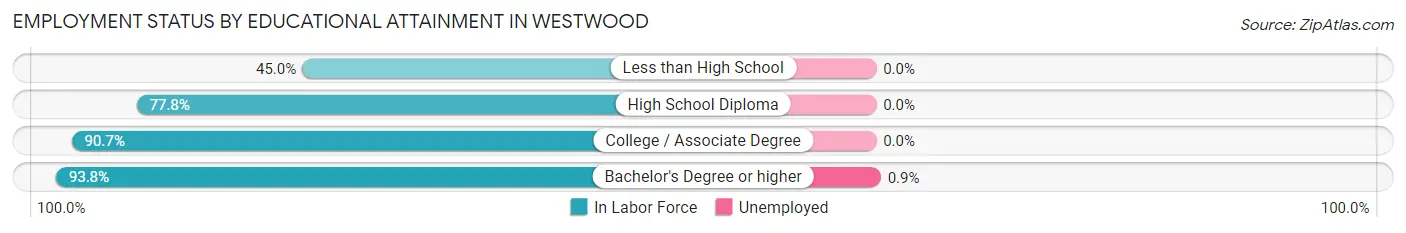
| Educational Attainment | In Labor Force | Unemployed |
| Less than High School | 9 (45.0%) | 0 (0.0%) |
| High School Diploma | 14 (77.8%) | 0 (0.0%) |
| College / Associate Degree | 98 (90.7%) | 0 (0.0%) |
| Bachelor's Degree or higher | 690 (93.8%) | 7 (0.9%) |
| Total | 811 (92.0%) | 6 (0.7%) |
Employment Occupations by Sex in Westwood
Management, Business, Science and Arts Occupations
The most common Management, Business, Science and Arts occupations in Westwood are Community & Social Service (185 | 17.2%), Management (169 | 15.7%), Health Diagnosing & Treating (131 | 12.1%), Business & Financial (117 | 10.8%), and Computers, Engineering & Science (102 | 9.5%).
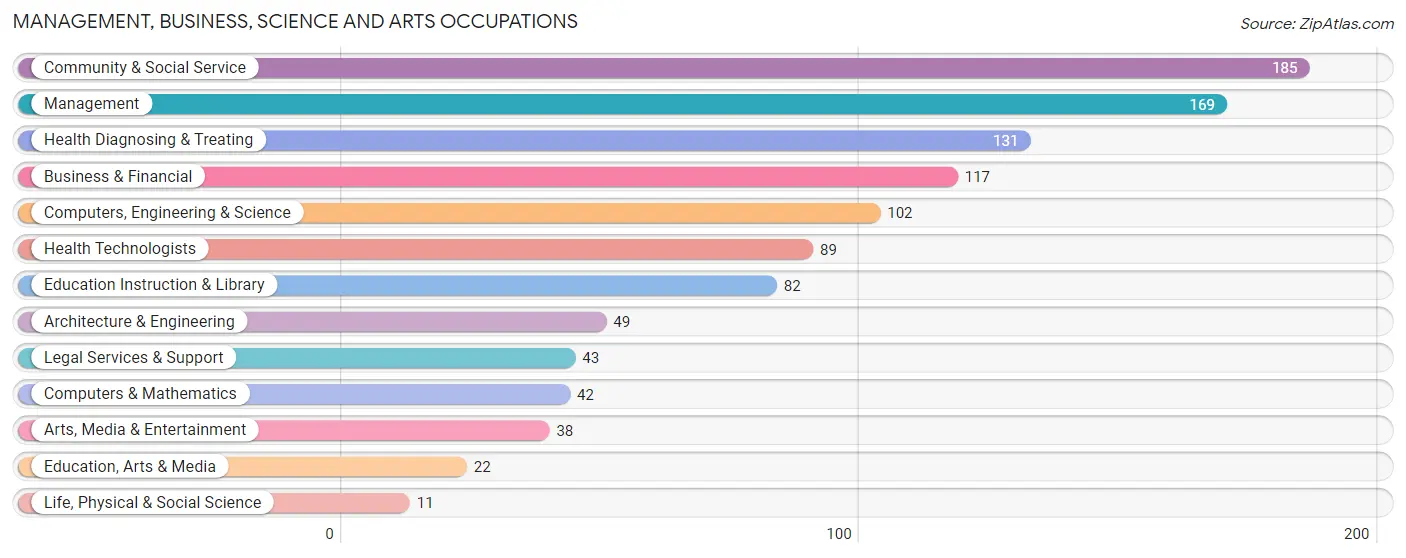
Management, Business, Science and Arts Occupations by Sex
Within the Management, Business, Science and Arts occupations in Westwood, the most male-oriented occupations are Computers & Mathematics (97.6%), Architecture & Engineering (93.9%), and Computers, Engineering & Science (90.2%), while the most female-oriented occupations are Education, Arts & Media (81.8%), Education Instruction & Library (72.0%), and Health Technologists (67.4%).
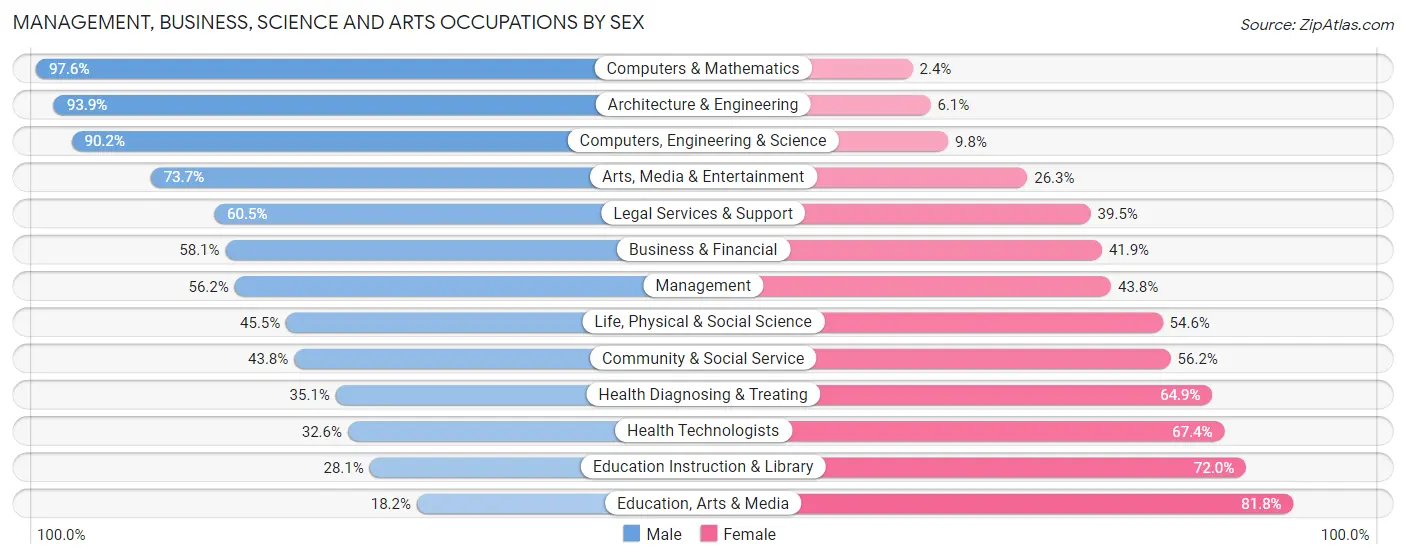
| Occupation | Male | Female |
| Management | 95 (56.2%) | 74 (43.8%) |
| Business & Financial | 68 (58.1%) | 49 (41.9%) |
| Computers, Engineering & Science | 92 (90.2%) | 10 (9.8%) |
| Computers & Mathematics | 41 (97.6%) | 1 (2.4%) |
| Architecture & Engineering | 46 (93.9%) | 3 (6.1%) |
| Life, Physical & Social Science | 5 (45.5%) | 6 (54.5%) |
| Community & Social Service | 81 (43.8%) | 104 (56.2%) |
| Education, Arts & Media | 4 (18.2%) | 18 (81.8%) |
| Legal Services & Support | 26 (60.5%) | 17 (39.5%) |
| Education Instruction & Library | 23 (28.1%) | 59 (72.0%) |
| Arts, Media & Entertainment | 28 (73.7%) | 10 (26.3%) |
| Health Diagnosing & Treating | 46 (35.1%) | 85 (64.9%) |
| Health Technologists | 29 (32.6%) | 60 (67.4%) |
| Total (Category) | 382 (54.3%) | 322 (45.7%) |
| Total (Overall) | 559 (51.9%) | 519 (48.1%) |
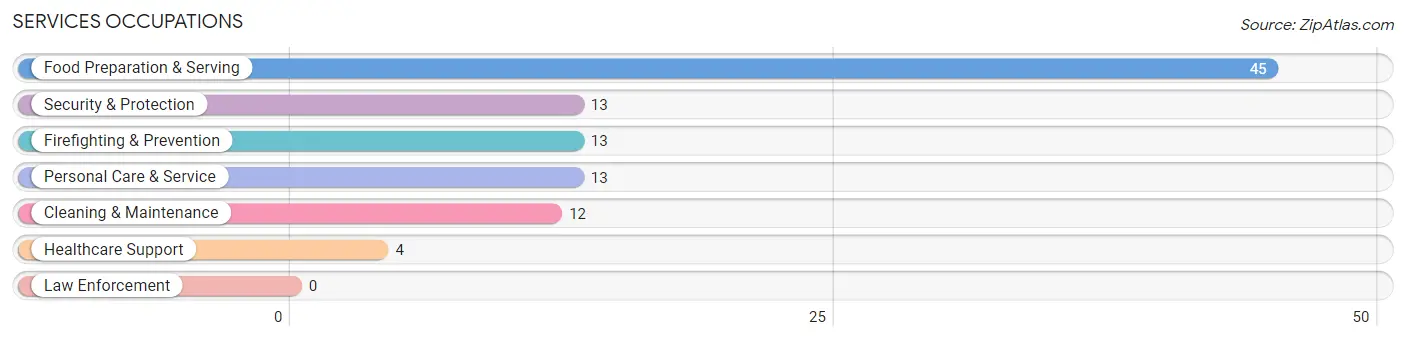
Services Occupations
The most common Services occupations in Westwood are Food Preparation & Serving (45 | 4.2%), Security & Protection (13 | 1.2%), Firefighting & Prevention (13 | 1.2%), Personal Care & Service (13 | 1.2%), and Cleaning & Maintenance (12 | 1.1%).
Services Occupations by Sex
Within the Services occupations in Westwood, the most male-oriented occupations are Cleaning & Maintenance (83.3%), Security & Protection (76.9%), and Firefighting & Prevention (76.9%), while the most female-oriented occupations are Healthcare Support (100.0%), Personal Care & Service (100.0%), and Food Preparation & Serving (77.8%).
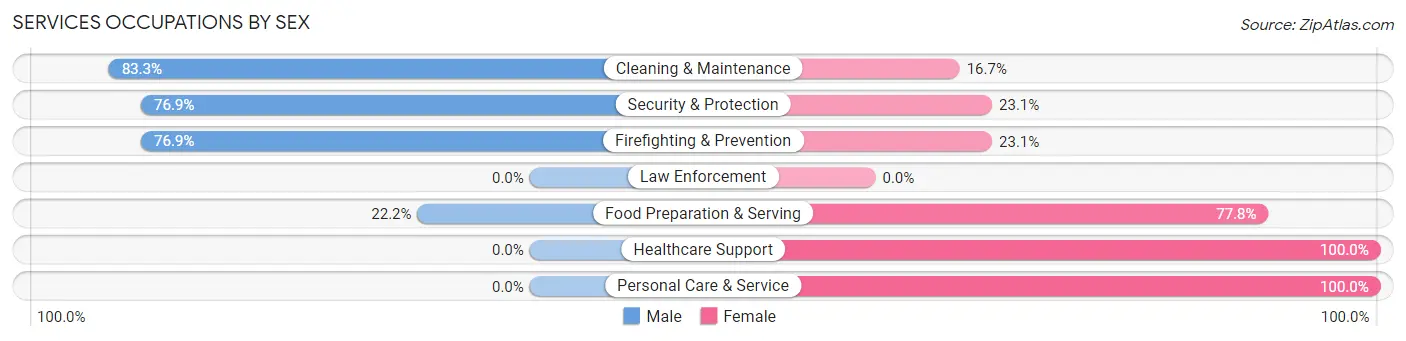
| Occupation | Male | Female |
| Healthcare Support | 0 (0.0%) | 4 (100.0%) |
| Security & Protection | 10 (76.9%) | 3 (23.1%) |
| Firefighting & Prevention | 10 (76.9%) | 3 (23.1%) |
| Law Enforcement | 0 (0.0%) | 0 (0.0%) |
| Food Preparation & Serving | 10 (22.2%) | 35 (77.8%) |
| Cleaning & Maintenance | 10 (83.3%) | 2 (16.7%) |
| Personal Care & Service | 0 (0.0%) | 13 (100.0%) |
| Total (Category) | 30 (34.5%) | 57 (65.5%) |
| Total (Overall) | 559 (51.9%) | 519 (48.1%) |
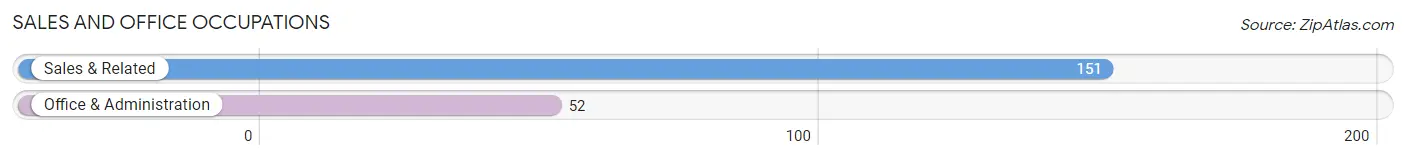
Sales and Office Occupations
The most common Sales and Office occupations in Westwood are Sales & Related (151 | 14.0%), and Office & Administration (52 | 4.8%).
Sales and Office Occupations by Sex
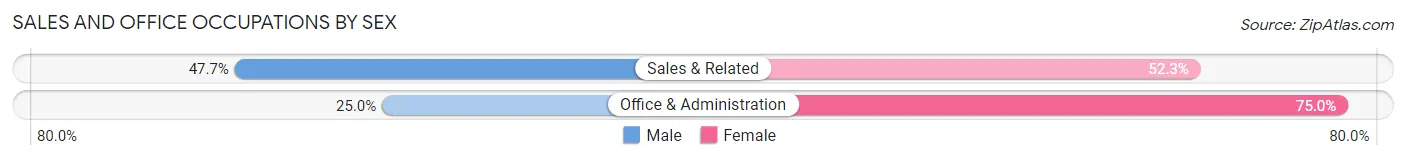
| Occupation | Male | Female |
| Sales & Related | 72 (47.7%) | 79 (52.3%) |
| Office & Administration | 13 (25.0%) | 39 (75.0%) |
| Total (Category) | 85 (41.9%) | 118 (58.1%) |
| Total (Overall) | 559 (51.9%) | 519 (48.1%) |
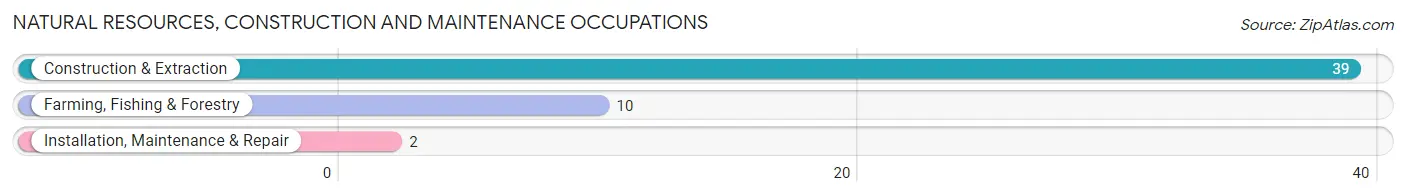
Natural Resources, Construction and Maintenance Occupations
The most common Natural Resources, Construction and Maintenance occupations in Westwood are Construction & Extraction (39 | 3.6%), Farming, Fishing & Forestry (10 | 0.9%), and Installation, Maintenance & Repair (2 | 0.2%).
Natural Resources, Construction and Maintenance Occupations by Sex
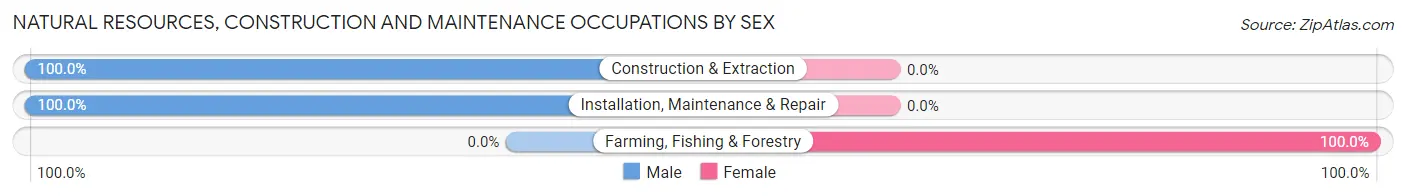
| Occupation | Male | Female |
| Farming, Fishing & Forestry | 0 (0.0%) | 10 (100.0%) |
| Construction & Extraction | 39 (100.0%) | 0 (0.0%) |
| Installation, Maintenance & Repair | 2 (100.0%) | 0 (0.0%) |
| Total (Category) | 41 (80.4%) | 10 (19.6%) |
| Total (Overall) | 559 (51.9%) | 519 (48.1%) |
Production, Transportation and Moving Occupations
The most common Production, Transportation and Moving occupations in Westwood are Production (27 | 2.5%), and Transportation (6 | 0.6%).
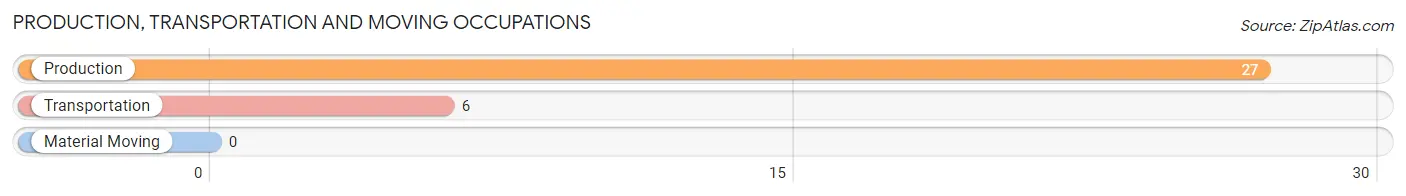
Production, Transportation and Moving Occupations by Sex
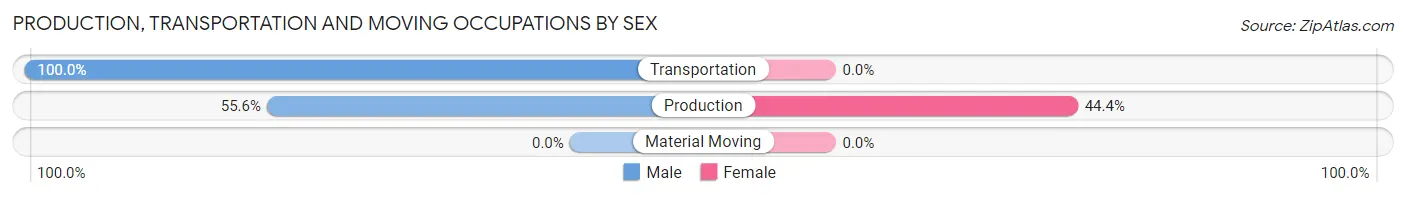
| Occupation | Male | Female |
| Production | 15 (55.6%) | 12 (44.4%) |
| Transportation | 6 (100.0%) | 0 (0.0%) |
| Material Moving | 0 (0.0%) | 0 (0.0%) |
| Total (Category) | 21 (63.6%) | 12 (36.4%) |
| Total (Overall) | 559 (51.9%) | 519 (48.1%) |
Employment Industries by Sex in Westwood
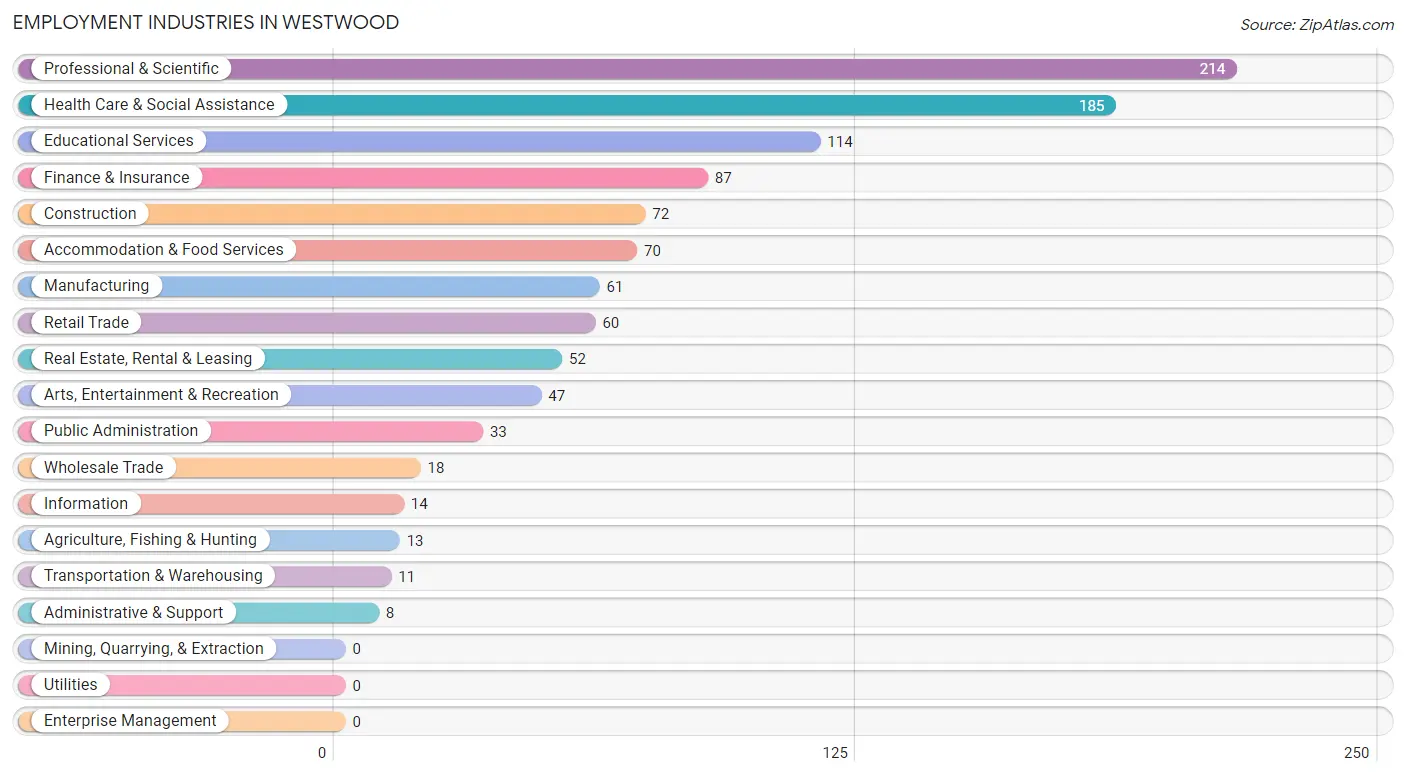
Employment Industries in Westwood
The major employment industries in Westwood include Professional & Scientific (214 | 19.9%), Health Care & Social Assistance (185 | 17.2%), Educational Services (114 | 10.6%), Finance & Insurance (87 | 8.1%), and Construction (72 | 6.7%).
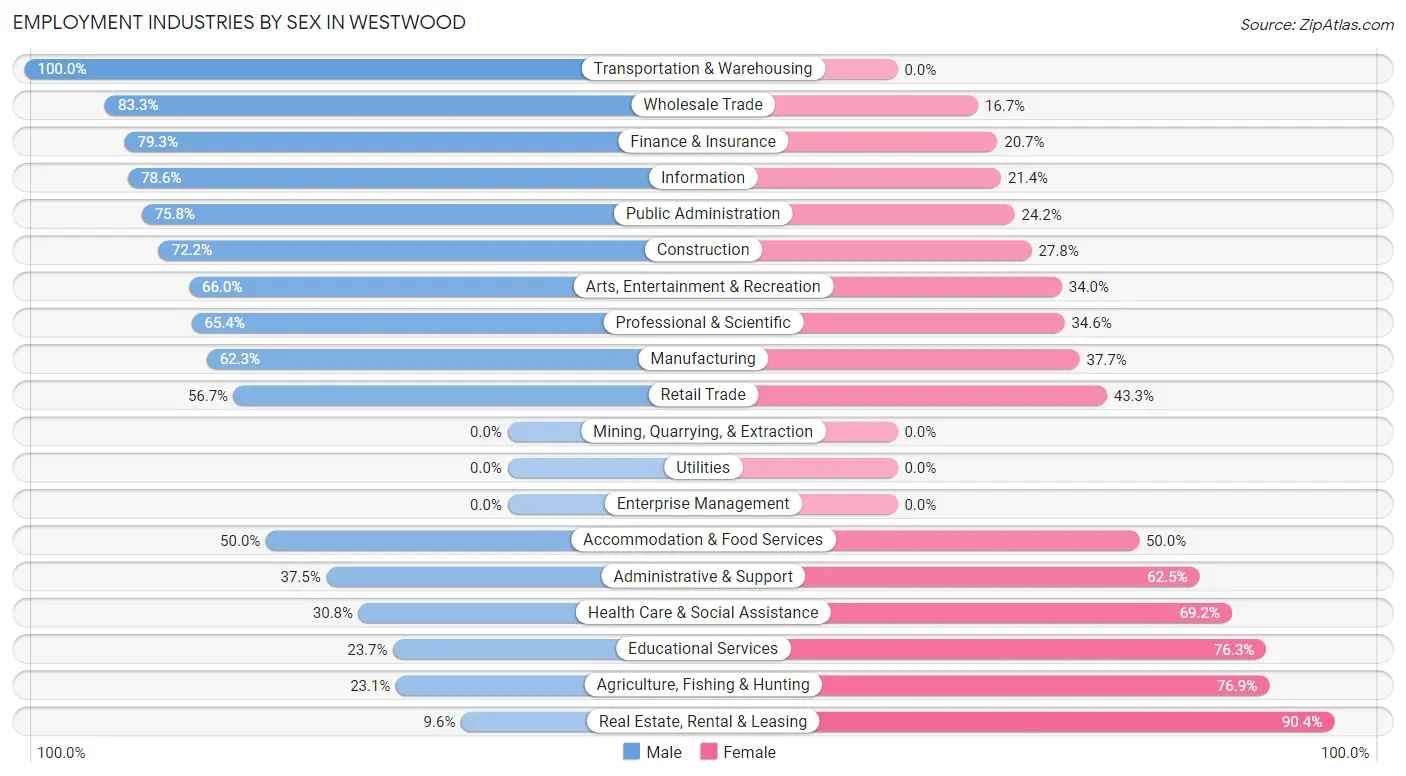
Employment Industries by Sex in Westwood
The Westwood industries that see more men than women are Transportation & Warehousing (100.0%), Wholesale Trade (83.3%), and Finance & Insurance (79.3%), whereas the industries that tend to have a higher number of women are Real Estate, Rental & Leasing (90.4%), Agriculture, Fishing & Hunting (76.9%), and Educational Services (76.3%).
| Industry | Male | Female |
| Agriculture, Fishing & Hunting | 3 (23.1%) | 10 (76.9%) |
| Mining, Quarrying, & Extraction | 0 (0.0%) | 0 (0.0%) |
| Construction | 52 (72.2%) | 20 (27.8%) |
| Manufacturing | 38 (62.3%) | 23 (37.7%) |
| Wholesale Trade | 15 (83.3%) | 3 (16.7%) |
| Retail Trade | 34 (56.7%) | 26 (43.3%) |
| Transportation & Warehousing | 11 (100.0%) | 0 (0.0%) |
| Utilities | 0 (0.0%) | 0 (0.0%) |
| Information | 11 (78.6%) | 3 (21.4%) |
| Finance & Insurance | 69 (79.3%) | 18 (20.7%) |
| Real Estate, Rental & Leasing | 5 (9.6%) | 47 (90.4%) |
| Professional & Scientific | 140 (65.4%) | 74 (34.6%) |
| Enterprise Management | 0 (0.0%) | 0 (0.0%) |
| Administrative & Support | 3 (37.5%) | 5 (62.5%) |
| Educational Services | 27 (23.7%) | 87 (76.3%) |
| Health Care & Social Assistance | 57 (30.8%) | 128 (69.2%) |
| Arts, Entertainment & Recreation | 31 (66.0%) | 16 (34.0%) |
| Accommodation & Food Services | 35 (50.0%) | 35 (50.0%) |
| Public Administration | 25 (75.8%) | 8 (24.2%) |
| Total | 559 (51.9%) | 519 (48.1%) |
Education in Westwood
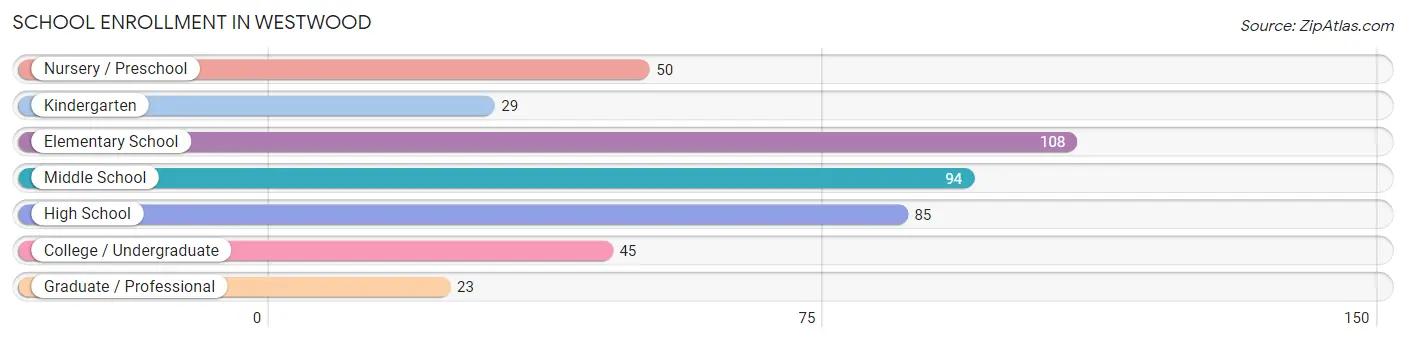
School Enrollment in Westwood
The most common levels of schooling among the 434 students in Westwood are elementary school (108 | 24.9%), middle school (94 | 21.7%), and high school (85 | 19.6%).
| School Level | # Students | % Students |
| Nursery / Preschool | 50 | 11.5% |
| Kindergarten | 29 | 6.7% |
| Elementary School | 108 | 24.9% |
| Middle School | 94 | 21.7% |
| High School | 85 | 19.6% |
| College / Undergraduate | 45 | 10.4% |
| Graduate / Professional | 23 | 5.3% |
| Total | 434 | 100.0% |
School Enrollment by Age by Funding Source in Westwood
Out of a total of 434 students who are enrolled in schools in Westwood, 105 (24.2%) attend a private institution, while the remaining 329 (75.8%) are enrolled in public schools. The age group of 3 to 4 year olds has the highest likelihood of being enrolled in private schools, with 30 (76.9% in the age bracket) enrolled. Conversely, the age group of 15 to 17 year olds has the lowest likelihood of being enrolled in a private school, with 57 (89.1% in the age bracket) attending a public institution.
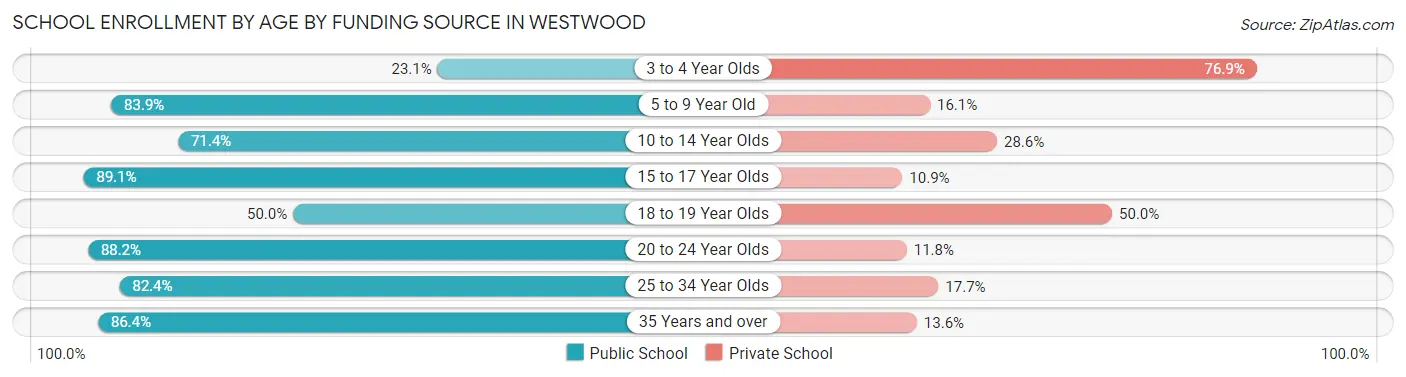
| Age Bracket | Public School | Private School |
| 3 to 4 Year Olds | 9 (23.1%) | 30 (76.9%) |
| 5 to 9 Year Old | 120 (83.9%) | 23 (16.1%) |
| 10 to 14 Year Olds | 75 (71.4%) | 30 (28.6%) |
| 15 to 17 Year Olds | 57 (89.1%) | 7 (10.9%) |
| 18 to 19 Year Olds | 5 (50.0%) | 5 (50.0%) |
| 20 to 24 Year Olds | 30 (88.2%) | 4 (11.8%) |
| 25 to 34 Year Olds | 14 (82.4%) | 3 (17.6%) |
| 35 Years and over | 19 (86.4%) | 3 (13.6%) |
| Total | 329 (75.8%) | 105 (24.2%) |
Educational Attainment by Field of Study in Westwood
Business (175 | 16.8%), science & technology (121 | 11.6%), communications (115 | 11.0%), bio, nature & agricultural (83 | 8.0%), and engineering (77 | 7.4%) are the most common fields of study among 1,042 individuals in Westwood who have obtained a bachelor's degree or higher.
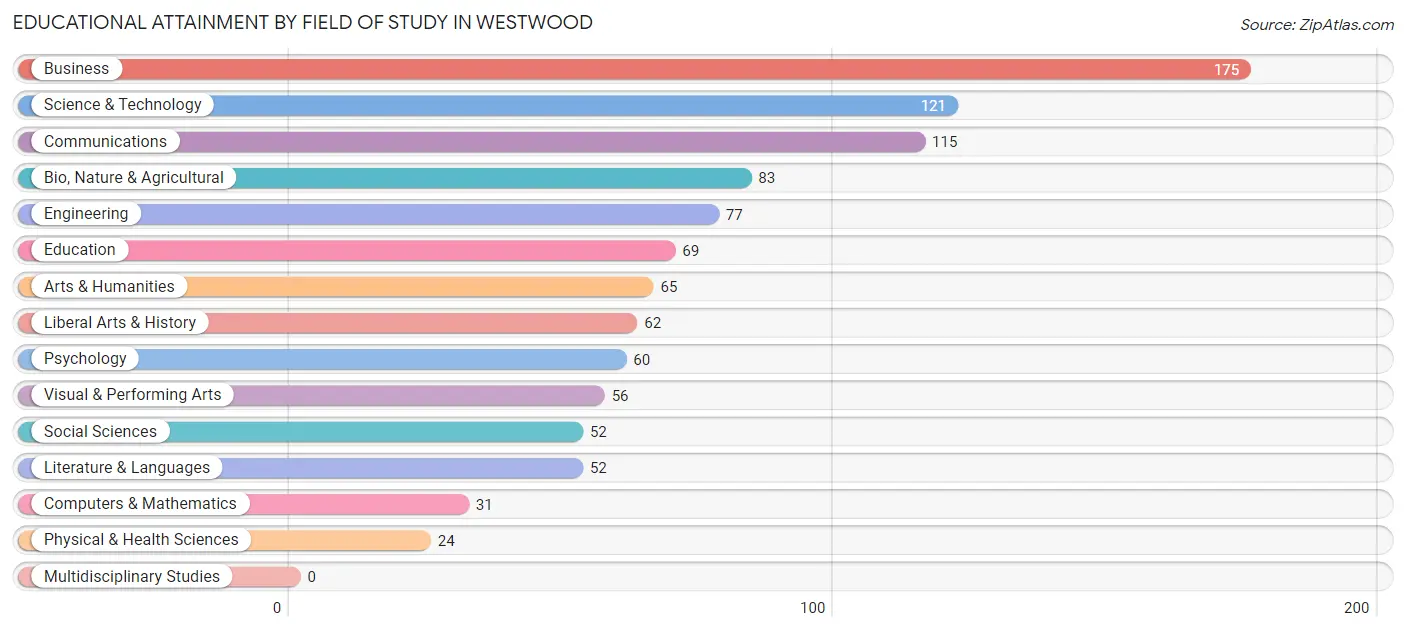
| Field of Study | # Graduates | % Graduates |
| Computers & Mathematics | 31 | 3.0% |
| Bio, Nature & Agricultural | 83 | 8.0% |
| Physical & Health Sciences | 24 | 2.3% |
| Psychology | 60 | 5.8% |
| Social Sciences | 52 | 5.0% |
| Engineering | 77 | 7.4% |
| Multidisciplinary Studies | 0 | 0.0% |
| Science & Technology | 121 | 11.6% |
| Business | 175 | 16.8% |
| Education | 69 | 6.6% |
| Literature & Languages | 52 | 5.0% |
| Liberal Arts & History | 62 | 5.9% |
| Visual & Performing Arts | 56 | 5.4% |
| Communications | 115 | 11.0% |
| Arts & Humanities | 65 | 6.2% |
| Total | 1,042 | 100.0% |
Transportation & Commute in Westwood
Vehicle Availability by Sex in Westwood
The most prevalent vehicle ownership categories in Westwood are males with 2 vehicles (318, accounting for 57.8%) and females with 2 vehicles (320, making up 61.4%).
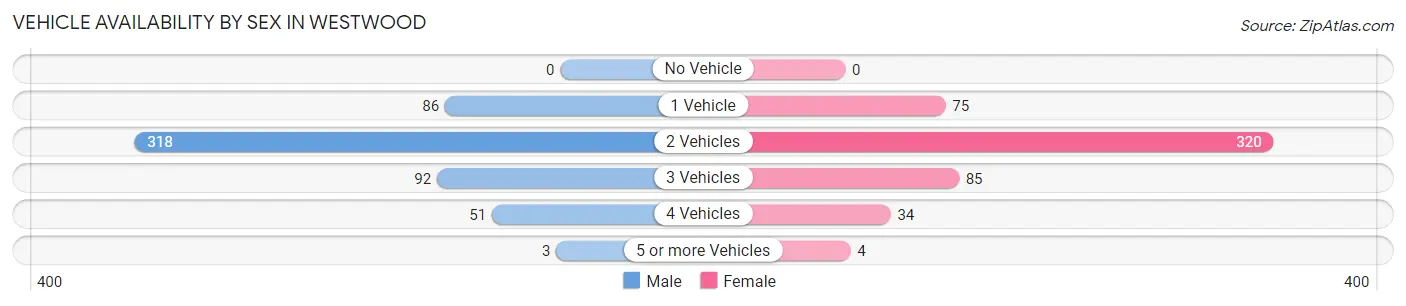
| Vehicles Available | Male | Female |
| No Vehicle | 0 (0.0%) | 0 (0.0%) |
| 1 Vehicle | 86 (15.6%) | 75 (14.5%) |
| 2 Vehicles | 318 (57.8%) | 320 (61.8%) |
| 3 Vehicles | 92 (16.7%) | 85 (16.4%) |
| 4 Vehicles | 51 (9.3%) | 34 (6.6%) |
| 5 or more Vehicles | 3 (0.5%) | 4 (0.8%) |
| Total | 550 (100.0%) | 518 (100.0%) |
Commute Time in Westwood
The most frequently occuring commute durations in Westwood are 15 to 19 minutes (169 commuters, 20.6%), 20 to 24 minutes (156 commuters, 19.1%), and 10 to 14 minutes (137 commuters, 16.7%).
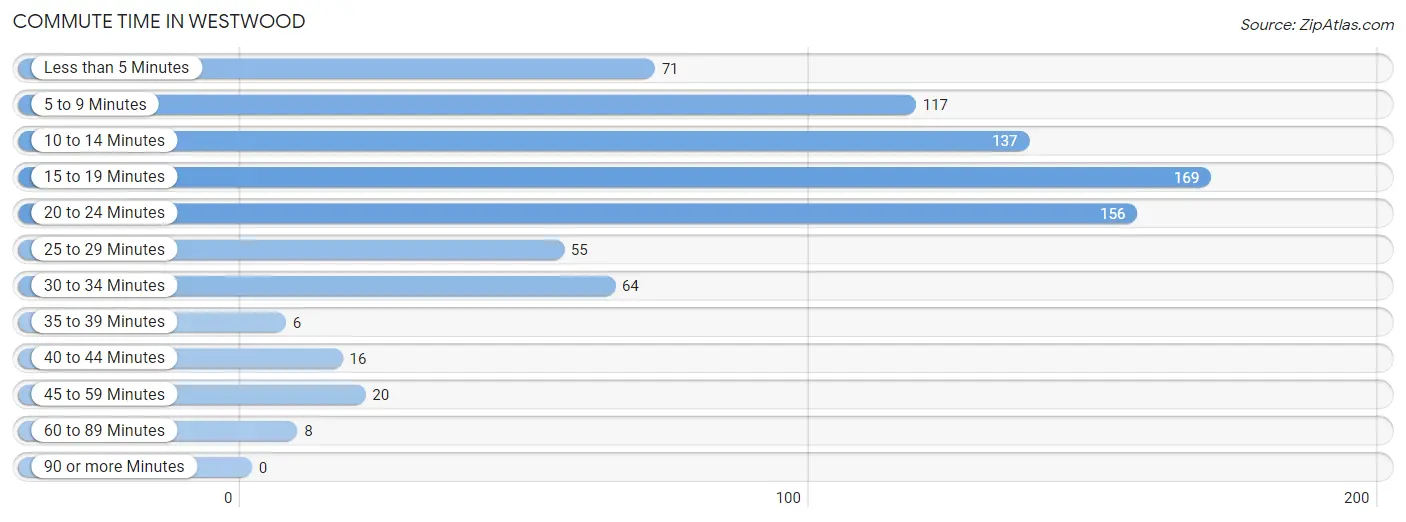
| Commute Time | # Commuters | % Commuters |
| Less than 5 Minutes | 71 | 8.7% |
| 5 to 9 Minutes | 117 | 14.3% |
| 10 to 14 Minutes | 137 | 16.7% |
| 15 to 19 Minutes | 169 | 20.6% |
| 20 to 24 Minutes | 156 | 19.1% |
| 25 to 29 Minutes | 55 | 6.7% |
| 30 to 34 Minutes | 64 | 7.8% |
| 35 to 39 Minutes | 6 | 0.7% |
| 40 to 44 Minutes | 16 | 1.9% |
| 45 to 59 Minutes | 20 | 2.4% |
| 60 to 89 Minutes | 8 | 1.0% |
| 90 or more Minutes | 0 | 0.0% |
Commute Time by Sex in Westwood
The most common commute times in Westwood are 10 to 14 minutes (84 commuters, 19.4%) for males and 15 to 19 minutes (86 commuters, 22.3%) for females.
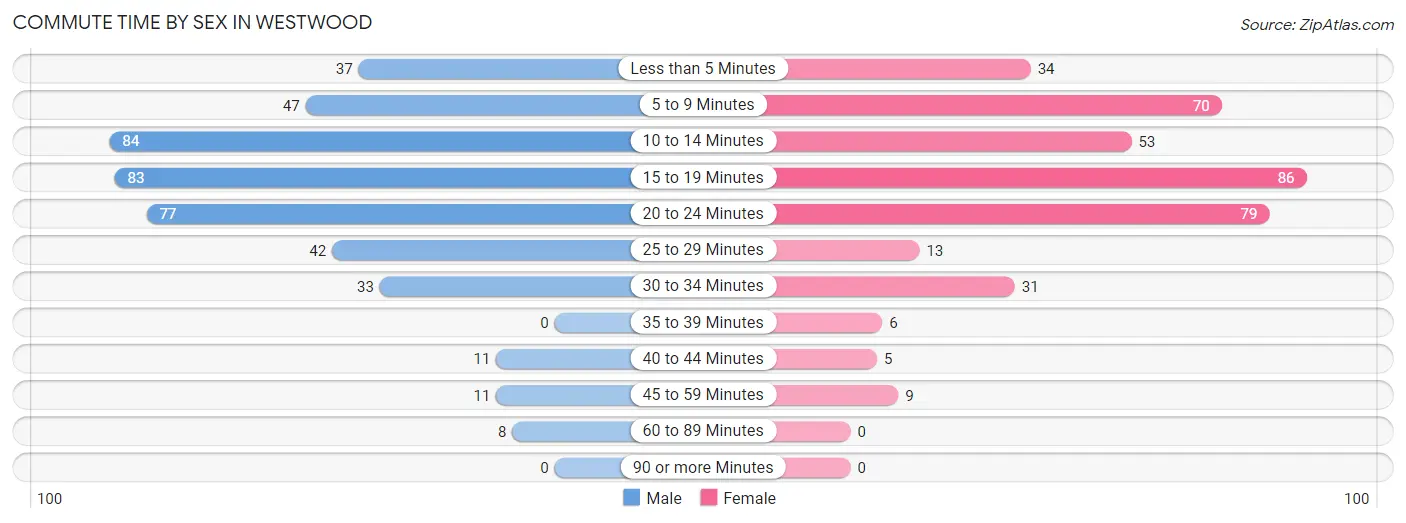
| Commute Time | Male | Female |
| Less than 5 Minutes | 37 (8.6%) | 34 (8.8%) |
| 5 to 9 Minutes | 47 (10.8%) | 70 (18.1%) |
| 10 to 14 Minutes | 84 (19.4%) | 53 (13.7%) |
| 15 to 19 Minutes | 83 (19.2%) | 86 (22.3%) |
| 20 to 24 Minutes | 77 (17.8%) | 79 (20.5%) |
| 25 to 29 Minutes | 42 (9.7%) | 13 (3.4%) |
| 30 to 34 Minutes | 33 (7.6%) | 31 (8.0%) |
| 35 to 39 Minutes | 0 (0.0%) | 6 (1.5%) |
| 40 to 44 Minutes | 11 (2.5%) | 5 (1.3%) |
| 45 to 59 Minutes | 11 (2.5%) | 9 (2.3%) |
| 60 to 89 Minutes | 8 (1.8%) | 0 (0.0%) |
| 90 or more Minutes | 0 (0.0%) | 0 (0.0%) |
Time of Departure to Work by Sex in Westwood
The most frequent times of departure to work in Westwood are 8:00 AM to 8:29 AM (108, 24.9%) for males and 7:30 AM to 7:59 AM (83, 21.5%) for females.
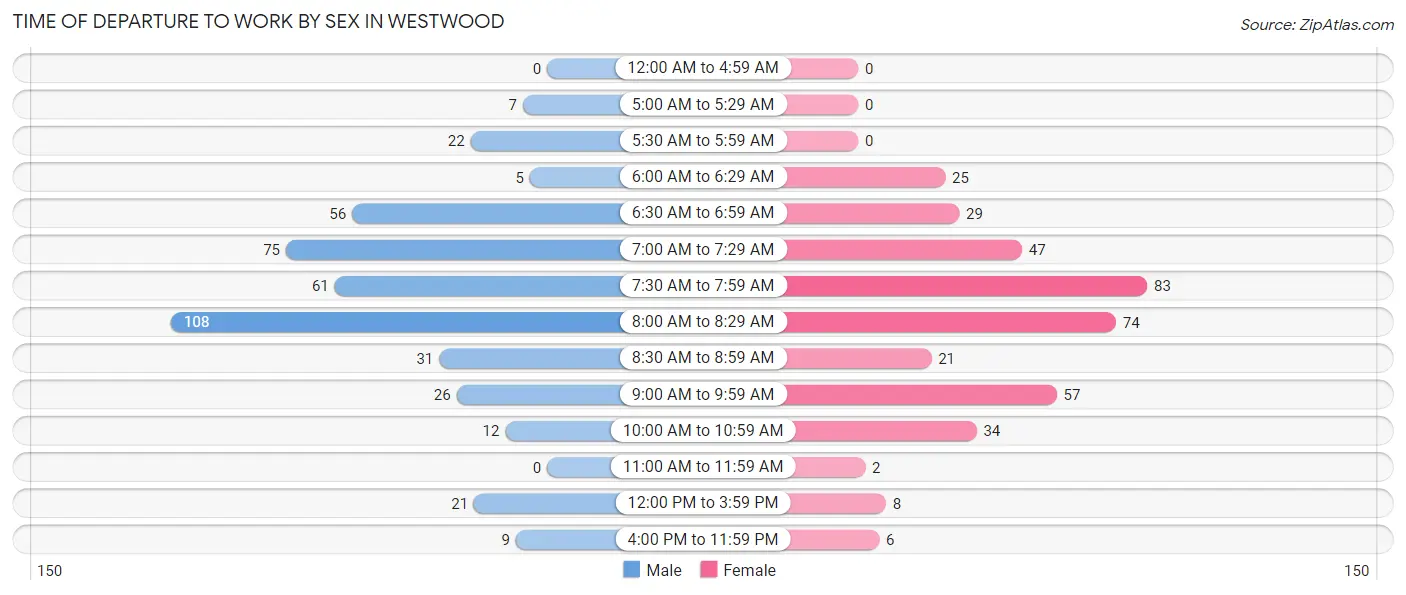
| Time of Departure | Male | Female |
| 12:00 AM to 4:59 AM | 0 (0.0%) | 0 (0.0%) |
| 5:00 AM to 5:29 AM | 7 (1.6%) | 0 (0.0%) |
| 5:30 AM to 5:59 AM | 22 (5.1%) | 0 (0.0%) |
| 6:00 AM to 6:29 AM | 5 (1.1%) | 25 (6.5%) |
| 6:30 AM to 6:59 AM | 56 (12.9%) | 29 (7.5%) |
| 7:00 AM to 7:29 AM | 75 (17.3%) | 47 (12.2%) |
| 7:30 AM to 7:59 AM | 61 (14.1%) | 83 (21.5%) |
| 8:00 AM to 8:29 AM | 108 (24.9%) | 74 (19.2%) |
| 8:30 AM to 8:59 AM | 31 (7.2%) | 21 (5.4%) |
| 9:00 AM to 9:59 AM | 26 (6.0%) | 57 (14.8%) |
| 10:00 AM to 10:59 AM | 12 (2.8%) | 34 (8.8%) |
| 11:00 AM to 11:59 AM | 0 (0.0%) | 2 (0.5%) |
| 12:00 PM to 3:59 PM | 21 (4.9%) | 8 (2.1%) |
| 4:00 PM to 11:59 PM | 9 (2.1%) | 6 (1.5%) |
| Total | 433 (100.0%) | 386 (100.0%) |
Housing Occupancy in Westwood
Occupancy by Ownership in Westwood
Of the total 811 dwellings in Westwood, owner-occupied units account for 645 (79.5%), while renter-occupied units make up 166 (20.5%).
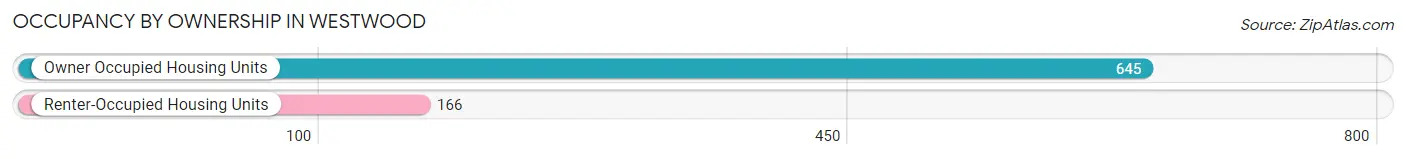
| Occupancy | # Housing Units | % Housing Units |
| Owner Occupied Housing Units | 645 | 79.5% |
| Renter-Occupied Housing Units | 166 | 20.5% |
| Total Occupied Housing Units | 811 | 100.0% |
Occupancy by Household Size in Westwood
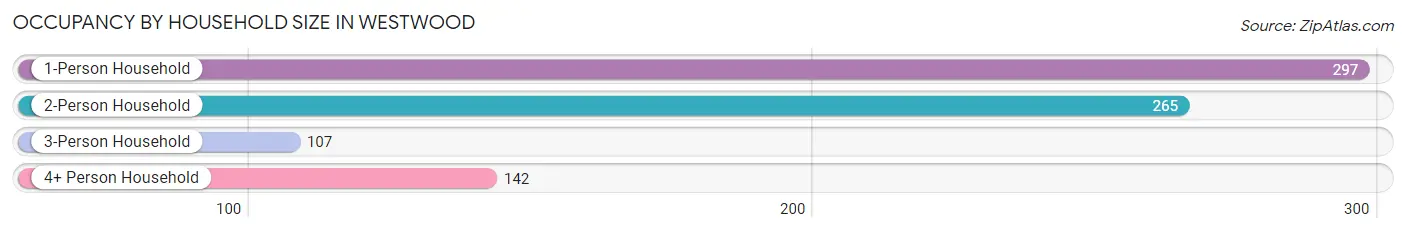
| Household Size | # Housing Units | % Housing Units |
| 1-Person Household | 297 | 36.6% |
| 2-Person Household | 265 | 32.7% |
| 3-Person Household | 107 | 13.2% |
| 4+ Person Household | 142 | 17.5% |
| Total Housing Units | 811 | 100.0% |
Occupancy by Ownership by Household Size in Westwood
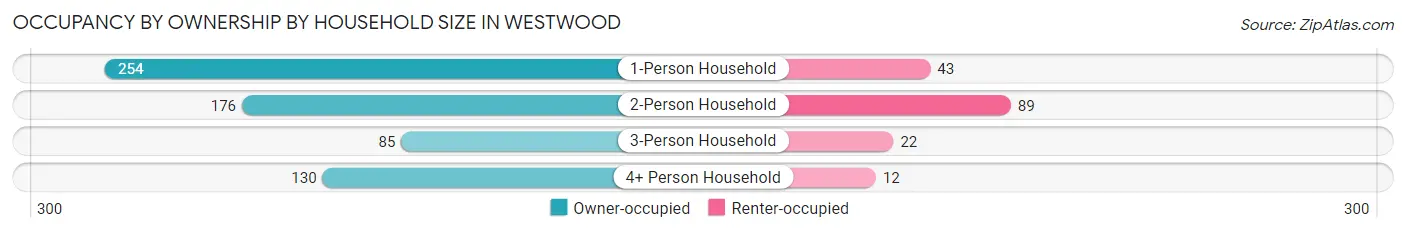
| Household Size | Owner-occupied | Renter-occupied |
| 1-Person Household | 254 (85.5%) | 43 (14.5%) |
| 2-Person Household | 176 (66.4%) | 89 (33.6%) |
| 3-Person Household | 85 (79.4%) | 22 (20.6%) |
| 4+ Person Household | 130 (91.5%) | 12 (8.5%) |
| Total Housing Units | 645 (79.5%) | 166 (20.5%) |
Occupancy by Educational Attainment in Westwood
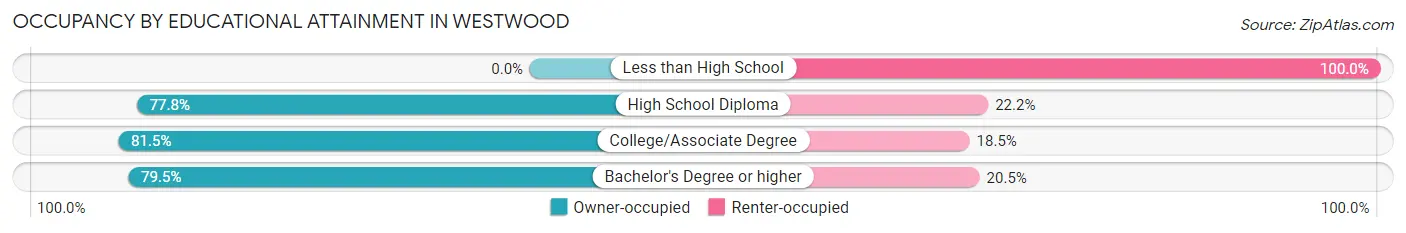
| Household Size | Owner-occupied | Renter-occupied |
| Less than High School | 0 (0.0%) | 4 (100.0%) |
| High School Diploma | 21 (77.8%) | 6 (22.2%) |
| College/Associate Degree | 167 (81.5%) | 38 (18.5%) |
| Bachelor's Degree or higher | 457 (79.5%) | 118 (20.5%) |
Occupancy by Age of Householder in Westwood
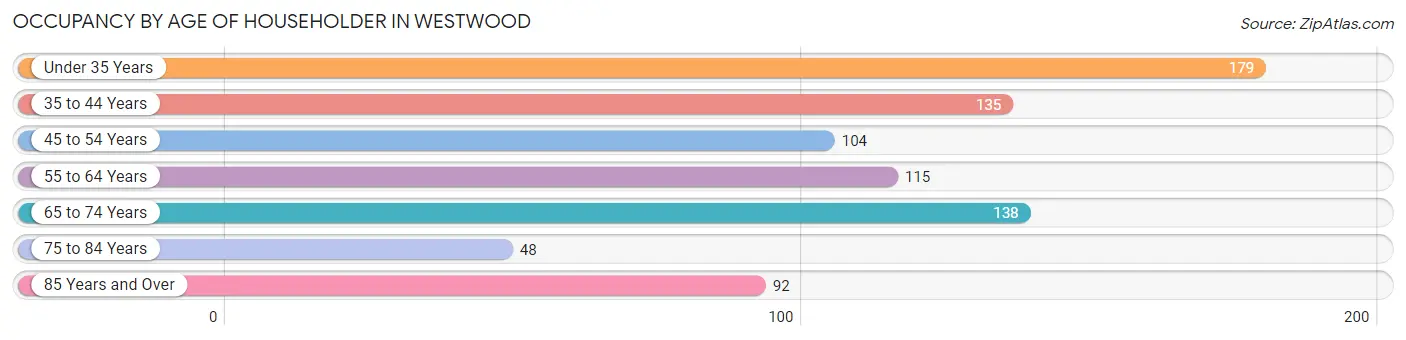
| Age Bracket | # Households | % Households |
| Under 35 Years | 179 | 22.1% |
| 35 to 44 Years | 135 | 16.7% |
| 45 to 54 Years | 104 | 12.8% |
| 55 to 64 Years | 115 | 14.2% |
| 65 to 74 Years | 138 | 17.0% |
| 75 to 84 Years | 48 | 5.9% |
| 85 Years and Over | 92 | 11.3% |
| Total | 811 | 100.0% |
Housing Finances in Westwood
Median Income by Occupancy in Westwood
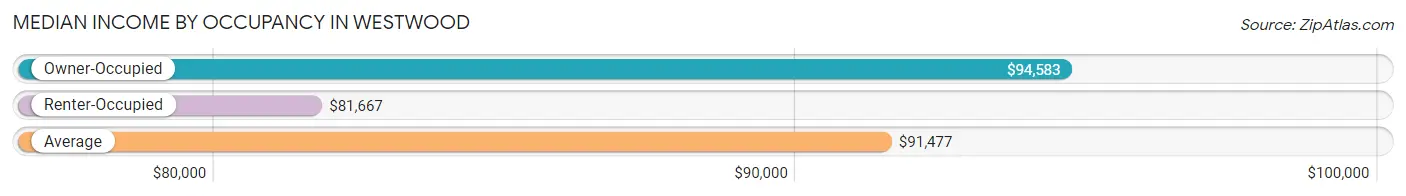
| Occupancy Type | # Households | Median Income |
| Owner-Occupied | 645 (79.5%) | $94,583 |
| Renter-Occupied | 166 (20.5%) | $81,667 |
| Average | 811 (100.0%) | $91,477 |
Occupancy by Householder Income Bracket in Westwood
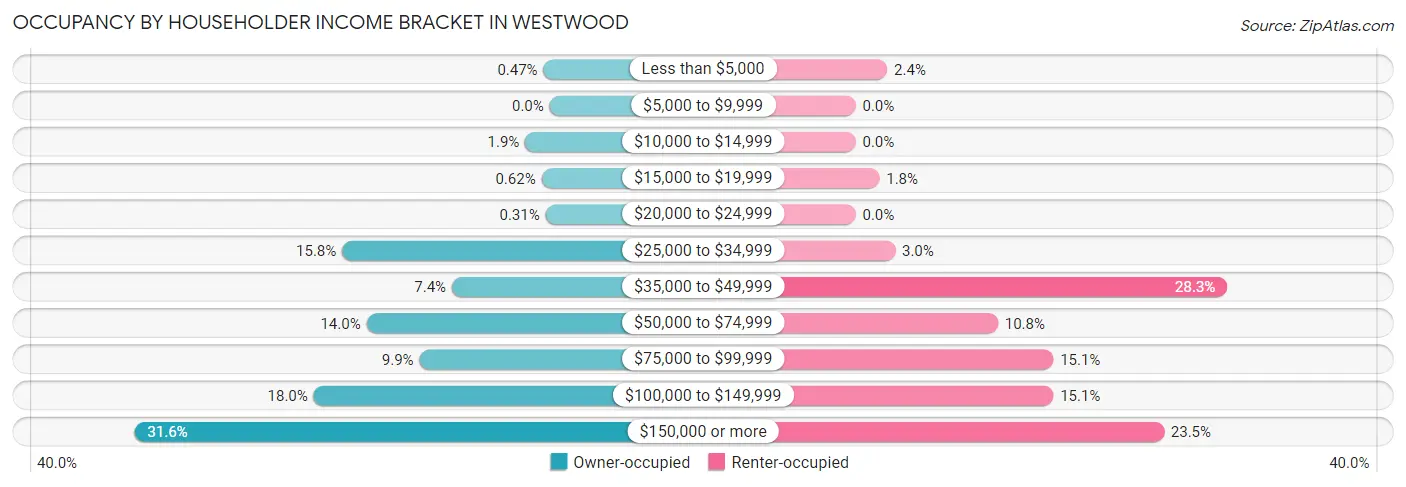
| Income Bracket | Owner-occupied | Renter-occupied |
| Less than $5,000 | 3 (0.5%) | 4 (2.4%) |
| $5,000 to $9,999 | 0 (0.0%) | 0 (0.0%) |
| $10,000 to $14,999 | 12 (1.9%) | 0 (0.0%) |
| $15,000 to $19,999 | 4 (0.6%) | 3 (1.8%) |
| $20,000 to $24,999 | 2 (0.3%) | 0 (0.0%) |
| $25,000 to $34,999 | 102 (15.8%) | 5 (3.0%) |
| $35,000 to $49,999 | 48 (7.4%) | 47 (28.3%) |
| $50,000 to $74,999 | 90 (14.0%) | 18 (10.8%) |
| $75,000 to $99,999 | 64 (9.9%) | 25 (15.1%) |
| $100,000 to $149,999 | 116 (18.0%) | 25 (15.1%) |
| $150,000 or more | 204 (31.6%) | 39 (23.5%) |
| Total | 645 (100.0%) | 166 (100.0%) |
Monthly Housing Cost Tiers in Westwood
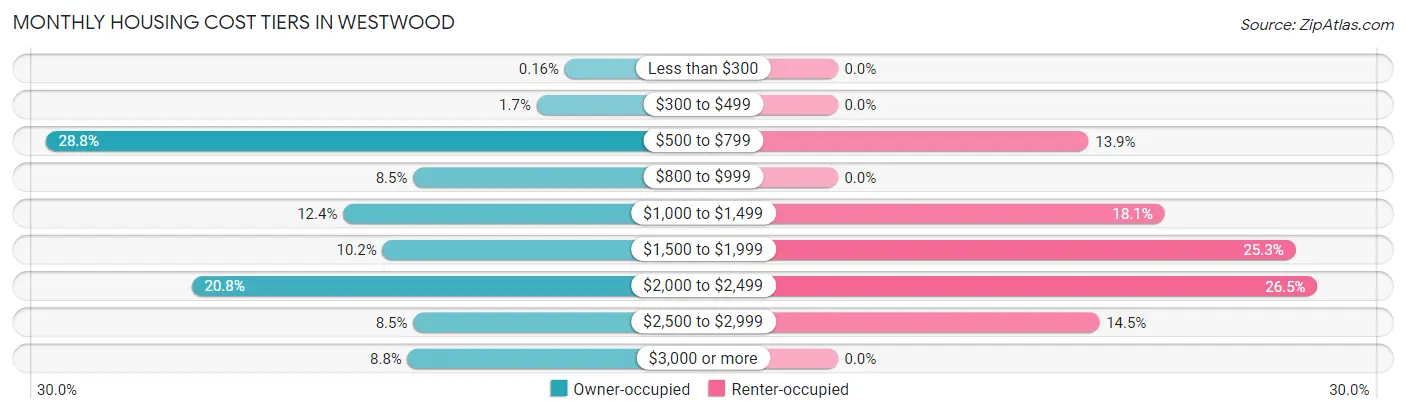
| Monthly Cost | Owner-occupied | Renter-occupied |
| Less than $300 | 1 (0.2%) | 0 (0.0%) |
| $300 to $499 | 11 (1.7%) | 0 (0.0%) |
| $500 to $799 | 186 (28.8%) | 23 (13.9%) |
| $800 to $999 | 55 (8.5%) | 0 (0.0%) |
| $1,000 to $1,499 | 80 (12.4%) | 30 (18.1%) |
| $1,500 to $1,999 | 66 (10.2%) | 42 (25.3%) |
| $2,000 to $2,499 | 134 (20.8%) | 44 (26.5%) |
| $2,500 to $2,999 | 55 (8.5%) | 24 (14.5%) |
| $3,000 or more | 57 (8.8%) | 0 (0.0%) |
| Total | 645 (100.0%) | 166 (100.0%) |
Physical Housing Characteristics in Westwood
Housing Structures in Westwood
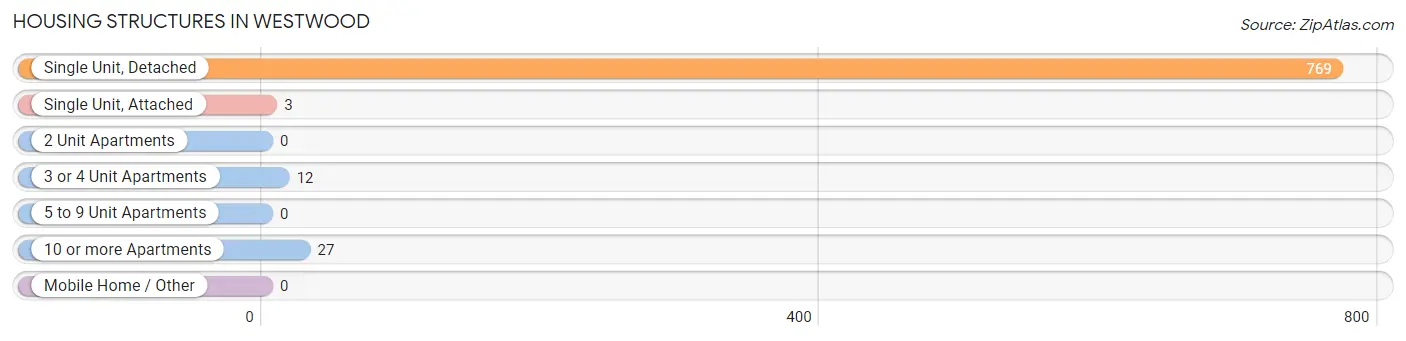
| Structure Type | # Housing Units | % Housing Units |
| Single Unit, Detached | 769 | 94.8% |
| Single Unit, Attached | 3 | 0.4% |
| 2 Unit Apartments | 0 | 0.0% |
| 3 or 4 Unit Apartments | 12 | 1.5% |
| 5 to 9 Unit Apartments | 0 | 0.0% |
| 10 or more Apartments | 27 | 3.3% |
| Mobile Home / Other | 0 | 0.0% |
| Total | 811 | 100.0% |
Housing Structures by Occupancy in Westwood
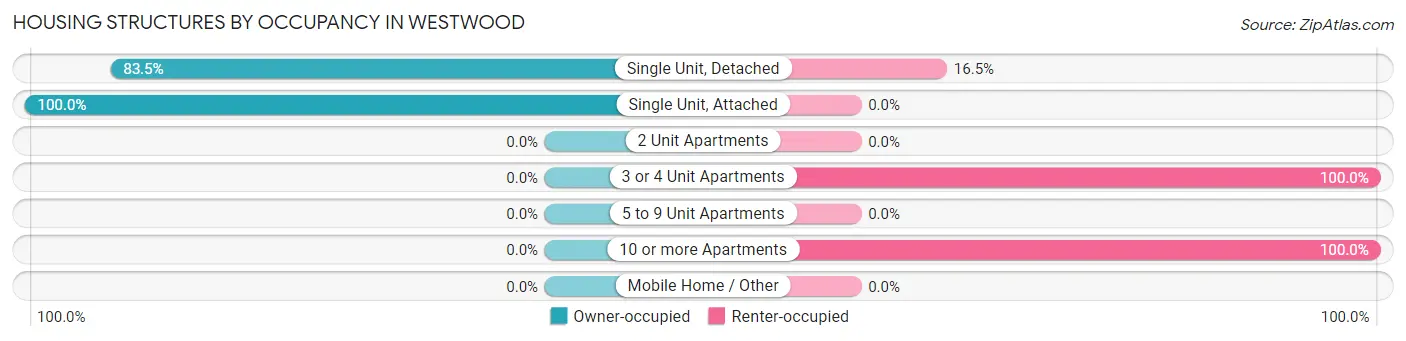
| Structure Type | Owner-occupied | Renter-occupied |
| Single Unit, Detached | 642 (83.5%) | 127 (16.5%) |
| Single Unit, Attached | 3 (100.0%) | 0 (0.0%) |
| 2 Unit Apartments | 0 (0.0%) | 0 (0.0%) |
| 3 or 4 Unit Apartments | 0 (0.0%) | 12 (100.0%) |
| 5 to 9 Unit Apartments | 0 (0.0%) | 0 (0.0%) |
| 10 or more Apartments | 0 (0.0%) | 27 (100.0%) |
| Mobile Home / Other | 0 (0.0%) | 0 (0.0%) |
| Total | 645 (79.5%) | 166 (20.5%) |
Housing Structures by Number of Rooms in Westwood
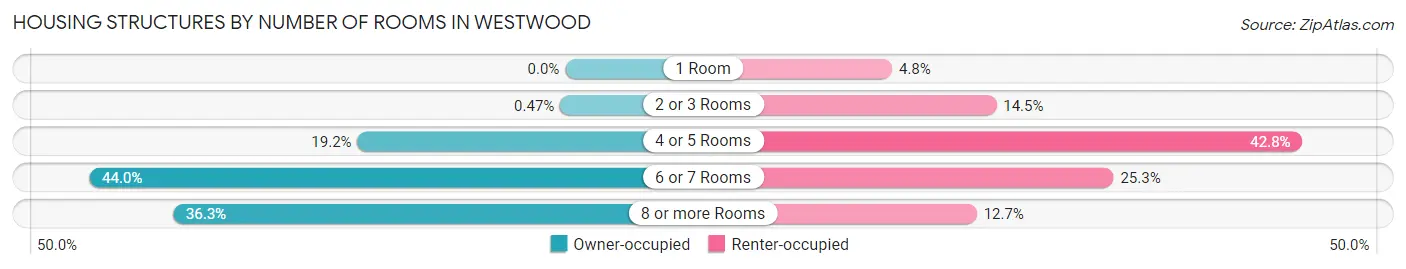
| Number of Rooms | Owner-occupied | Renter-occupied |
| 1 Room | 0 (0.0%) | 8 (4.8%) |
| 2 or 3 Rooms | 3 (0.5%) | 24 (14.5%) |
| 4 or 5 Rooms | 124 (19.2%) | 71 (42.8%) |
| 6 or 7 Rooms | 284 (44.0%) | 42 (25.3%) |
| 8 or more Rooms | 234 (36.3%) | 21 (12.7%) |
| Total | 645 (100.0%) | 166 (100.0%) |
Housing Structure by Heating Type in Westwood
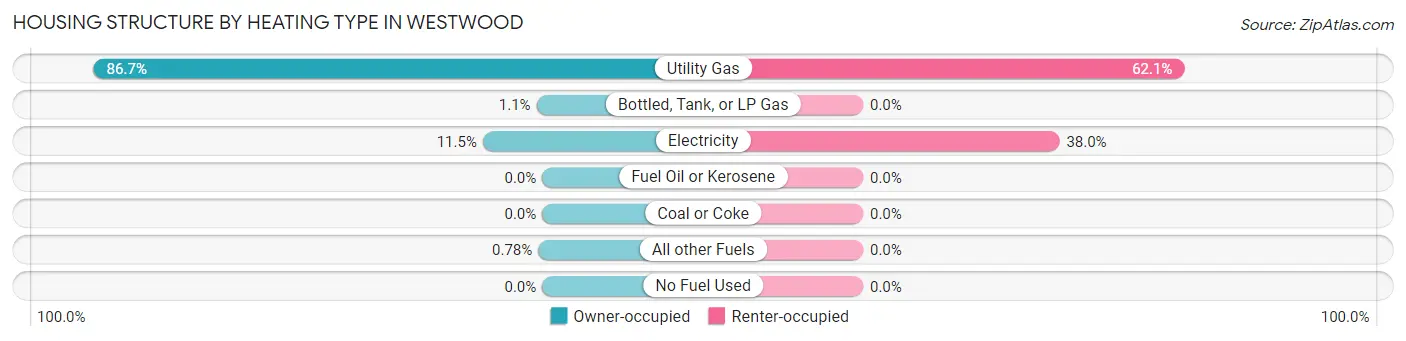
| Heating Type | Owner-occupied | Renter-occupied |
| Utility Gas | 559 (86.7%) | 103 (62.1%) |
| Bottled, Tank, or LP Gas | 7 (1.1%) | 0 (0.0%) |
| Electricity | 74 (11.5%) | 63 (38.0%) |
| Fuel Oil or Kerosene | 0 (0.0%) | 0 (0.0%) |
| Coal or Coke | 0 (0.0%) | 0 (0.0%) |
| All other Fuels | 5 (0.8%) | 0 (0.0%) |
| No Fuel Used | 0 (0.0%) | 0 (0.0%) |
| Total | 645 (100.0%) | 166 (100.0%) |
Household Vehicle Usage in Westwood
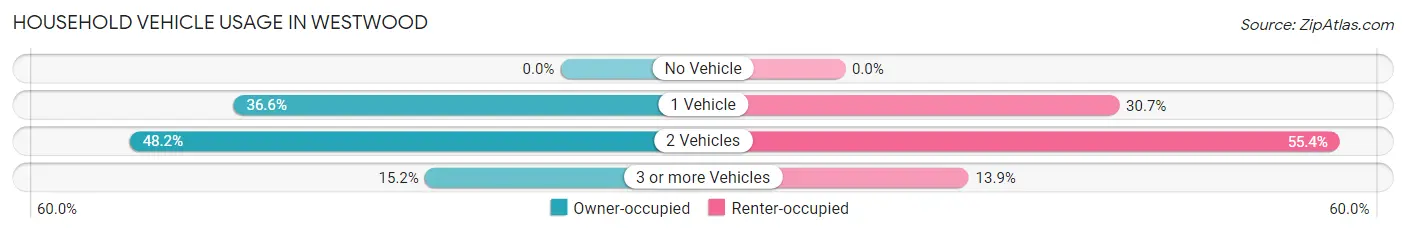
| Vehicles per Household | Owner-occupied | Renter-occupied |
| No Vehicle | 0 (0.0%) | 0 (0.0%) |
| 1 Vehicle | 236 (36.6%) | 51 (30.7%) |
| 2 Vehicles | 311 (48.2%) | 92 (55.4%) |
| 3 or more Vehicles | 98 (15.2%) | 23 (13.9%) |
| Total | 645 (100.0%) | 166 (100.0%) |
Real Estate & Mortgages in Westwood
Real Estate and Mortgage Overview in Westwood
| Characteristic | Without Mortgage | With Mortgage |
| Housing Units | 243 | 402 |
| Median Property Value | $360,200 | $378,700 |
| Median Household Income | $54,107 | $161 |
| Monthly Housing Costs | $742 | $57 |
| Real Estate Taxes | $3,725 | $7 |
Property Value by Mortgage Status in Westwood
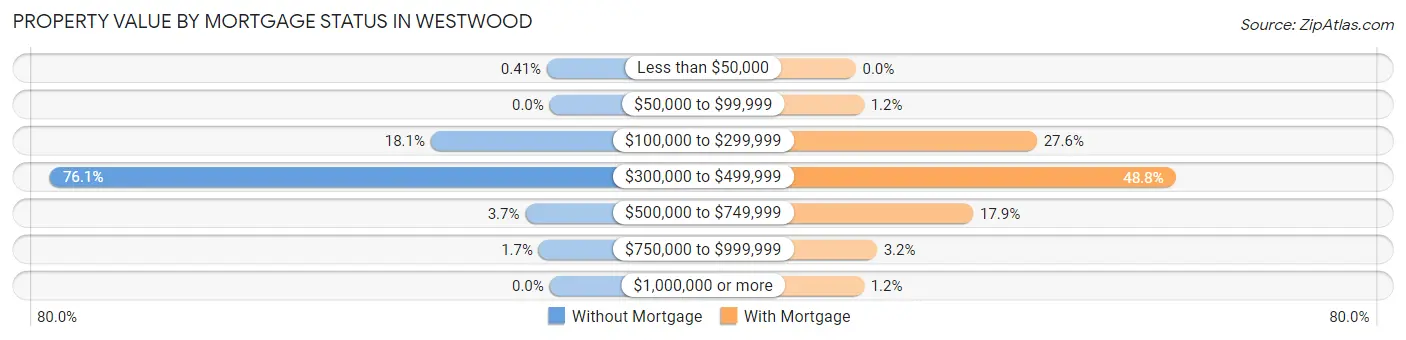
| Property Value | Without Mortgage | With Mortgage |
| Less than $50,000 | 1 (0.4%) | 0 (0.0%) |
| $50,000 to $99,999 | 0 (0.0%) | 5 (1.2%) |
| $100,000 to $299,999 | 44 (18.1%) | 111 (27.6%) |
| $300,000 to $499,999 | 185 (76.1%) | 196 (48.8%) |
| $500,000 to $749,999 | 9 (3.7%) | 72 (17.9%) |
| $750,000 to $999,999 | 4 (1.7%) | 13 (3.2%) |
| $1,000,000 or more | 0 (0.0%) | 5 (1.2%) |
| Total | 243 (100.0%) | 402 (100.0%) |
Household Income by Mortgage Status in Westwood
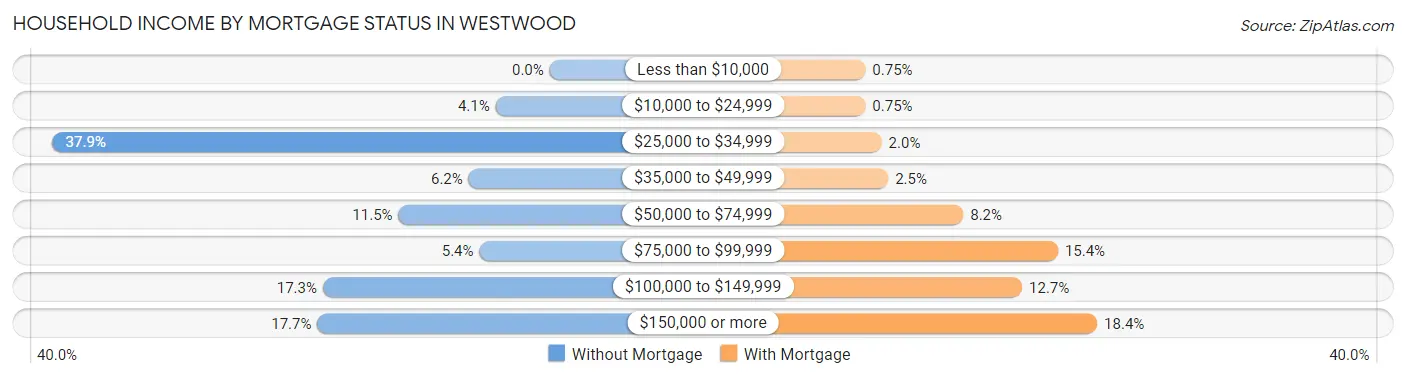
| Household Income | Without Mortgage | With Mortgage |
| Less than $10,000 | 0 (0.0%) | 3 (0.7%) |
| $10,000 to $24,999 | 10 (4.1%) | 3 (0.7%) |
| $25,000 to $34,999 | 92 (37.9%) | 8 (2.0%) |
| $35,000 to $49,999 | 15 (6.2%) | 10 (2.5%) |
| $50,000 to $74,999 | 28 (11.5%) | 33 (8.2%) |
| $75,000 to $99,999 | 13 (5.3%) | 62 (15.4%) |
| $100,000 to $149,999 | 42 (17.3%) | 51 (12.7%) |
| $150,000 or more | 43 (17.7%) | 74 (18.4%) |
| Total | 243 (100.0%) | 402 (100.0%) |
Property Value to Household Income Ratio in Westwood
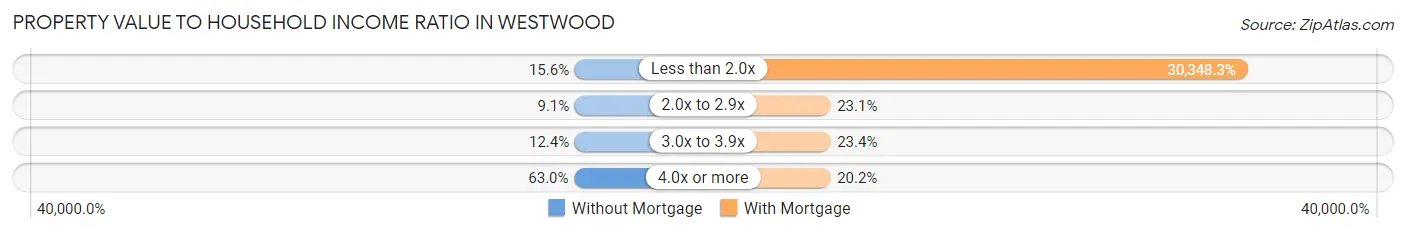
| Value-to-Income Ratio | Without Mortgage | With Mortgage |
| Less than 2.0x | 38 (15.6%) | 122,000 (30,348.3%) |
| 2.0x to 2.9x | 22 (9.0%) | 93 (23.1%) |
| 3.0x to 3.9x | 30 (12.3%) | 94 (23.4%) |
| 4.0x or more | 153 (63.0%) | 81 (20.2%) |
| Total | 243 (100.0%) | 402 (100.0%) |
Real Estate Taxes by Mortgage Status in Westwood
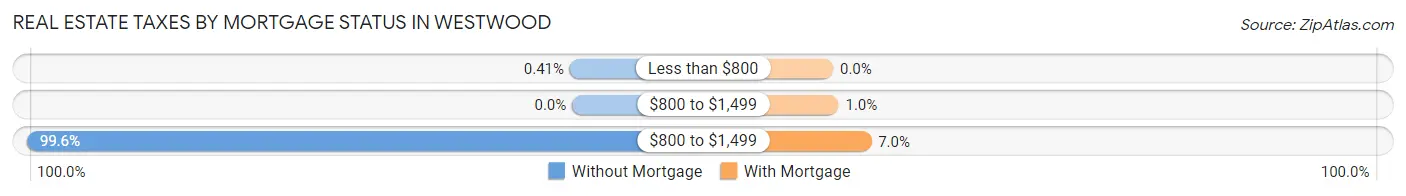
| Property Taxes | Without Mortgage | With Mortgage |
| Less than $800 | 1 (0.4%) | 0 (0.0%) |
| $800 to $1,499 | 0 (0.0%) | 4 (1.0%) |
| $800 to $1,499 | 242 (99.6%) | 28 (7.0%) |
| Total | 243 (100.0%) | 402 (100.0%) |
Health & Disability in Westwood
Health Insurance Coverage by Age in Westwood
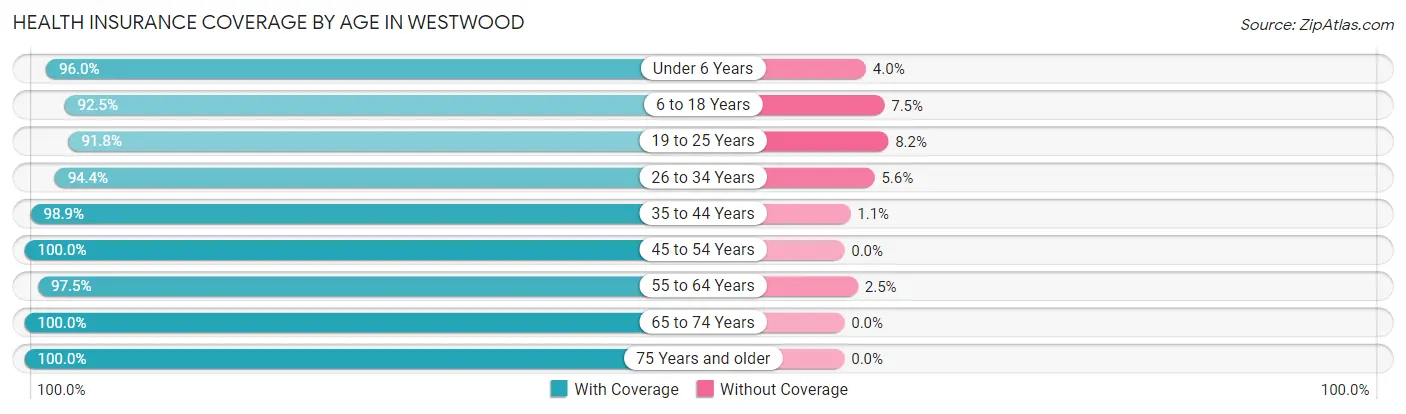
| Age Bracket | With Coverage | Without Coverage |
| Under 6 Years | 119 (96.0%) | 5 (4.0%) |
| 6 to 18 Years | 273 (92.5%) | 22 (7.5%) |
| 19 to 25 Years | 157 (91.8%) | 14 (8.2%) |
| 26 to 34 Years | 235 (94.4%) | 14 (5.6%) |
| 35 to 44 Years | 262 (98.9%) | 3 (1.1%) |
| 45 to 54 Years | 181 (100.0%) | 0 (0.0%) |
| 55 to 64 Years | 154 (97.5%) | 4 (2.5%) |
| 65 to 74 Years | 210 (100.0%) | 0 (0.0%) |
| 75 Years and older | 176 (100.0%) | 0 (0.0%) |
| Total | 1,767 (96.6%) | 62 (3.4%) |
Health Insurance Coverage by Citizenship Status in Westwood
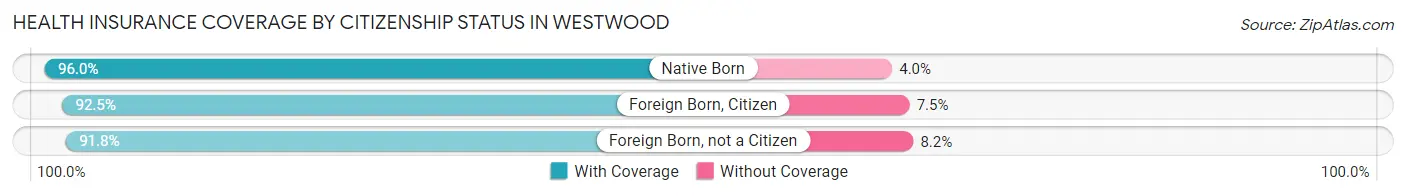
| Citizenship Status | With Coverage | Without Coverage |
| Native Born | 119 (96.0%) | 5 (4.0%) |
| Foreign Born, Citizen | 273 (92.5%) | 22 (7.5%) |
| Foreign Born, not a Citizen | 157 (91.8%) | 14 (8.2%) |
Health Insurance Coverage by Household Income in Westwood
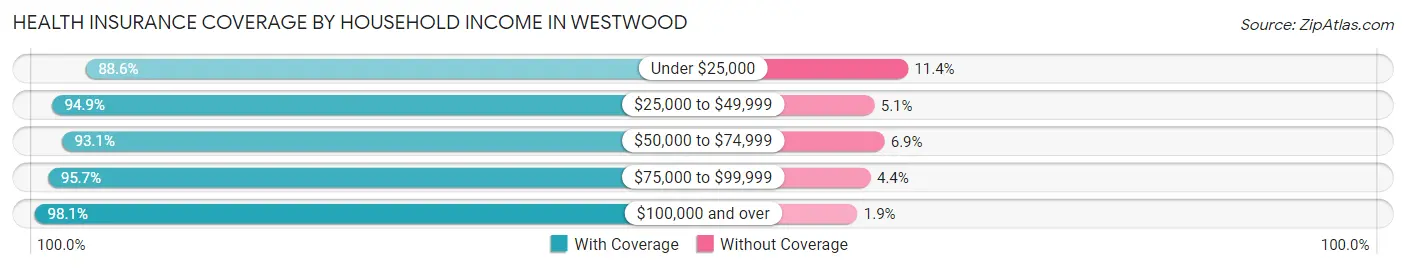
| Household Income | With Coverage | Without Coverage |
| Under $25,000 | 39 (88.6%) | 5 (11.4%) |
| $25,000 to $49,999 | 244 (94.9%) | 13 (5.1%) |
| $50,000 to $74,999 | 188 (93.1%) | 14 (6.9%) |
| $75,000 to $99,999 | 198 (95.7%) | 9 (4.3%) |
| $100,000 and over | 1,098 (98.1%) | 21 (1.9%) |
Public vs Private Health Insurance Coverage by Age in Westwood
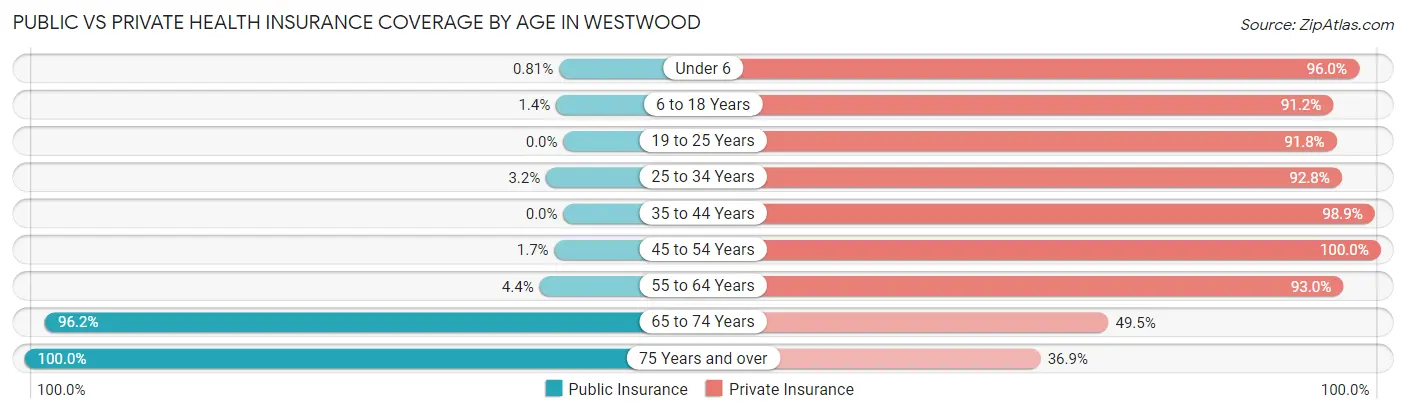
| Age Bracket | Public Insurance | Private Insurance |
| Under 6 | 1 (0.8%) | 119 (96.0%) |
| 6 to 18 Years | 4 (1.4%) | 269 (91.2%) |
| 19 to 25 Years | 0 (0.0%) | 157 (91.8%) |
| 25 to 34 Years | 8 (3.2%) | 231 (92.8%) |
| 35 to 44 Years | 0 (0.0%) | 262 (98.9%) |
| 45 to 54 Years | 3 (1.7%) | 181 (100.0%) |
| 55 to 64 Years | 7 (4.4%) | 147 (93.0%) |
| 65 to 74 Years | 202 (96.2%) | 104 (49.5%) |
| 75 Years and over | 176 (100.0%) | 65 (36.9%) |
| Total | 401 (21.9%) | 1,535 (83.9%) |
Disability Status by Sex by Age in Westwood
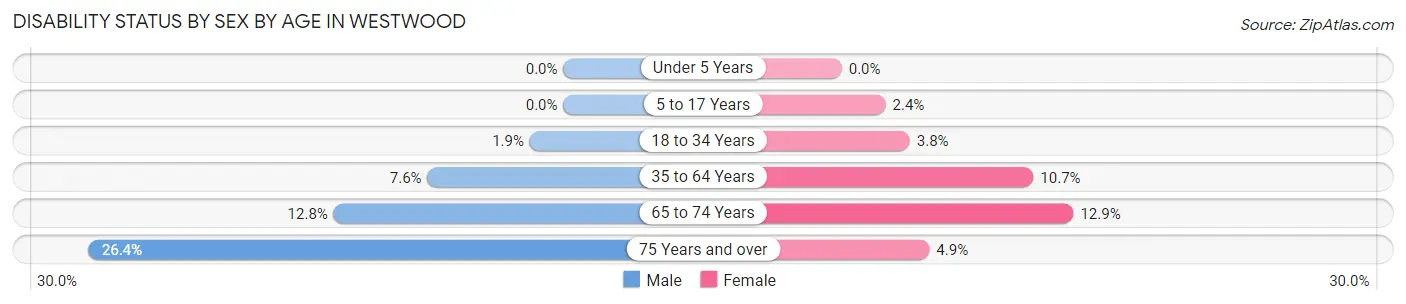
| Age Bracket | Male | Female |
| Under 5 Years | 0 (0.0%) | 0 (0.0%) |
| 5 to 17 Years | 0 (0.0%) | 4 (2.4%) |
| 18 to 34 Years | 4 (1.9%) | 8 (3.8%) |
| 35 to 64 Years | 23 (7.6%) | 32 (10.7%) |
| 65 to 74 Years | 11 (12.8%) | 16 (12.9%) |
| 75 Years and over | 14 (26.4%) | 6 (4.9%) |
Disability Class by Sex by Age in Westwood
Disability Class: Hearing Difficulty
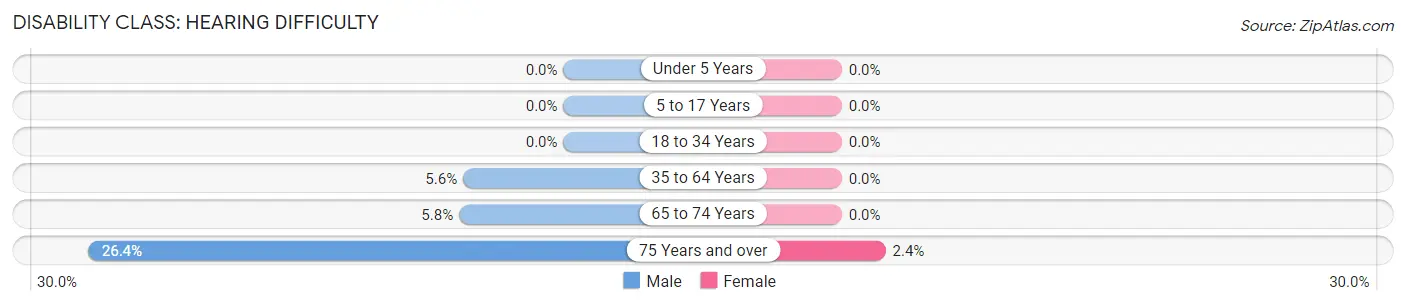
| Age Bracket | Male | Female |
| Under 5 Years | 0 (0.0%) | 0 (0.0%) |
| 5 to 17 Years | 0 (0.0%) | 0 (0.0%) |
| 18 to 34 Years | 0 (0.0%) | 0 (0.0%) |
| 35 to 64 Years | 17 (5.6%) | 0 (0.0%) |
| 65 to 74 Years | 5 (5.8%) | 0 (0.0%) |
| 75 Years and over | 14 (26.4%) | 3 (2.4%) |
Disability Class: Vision Difficulty
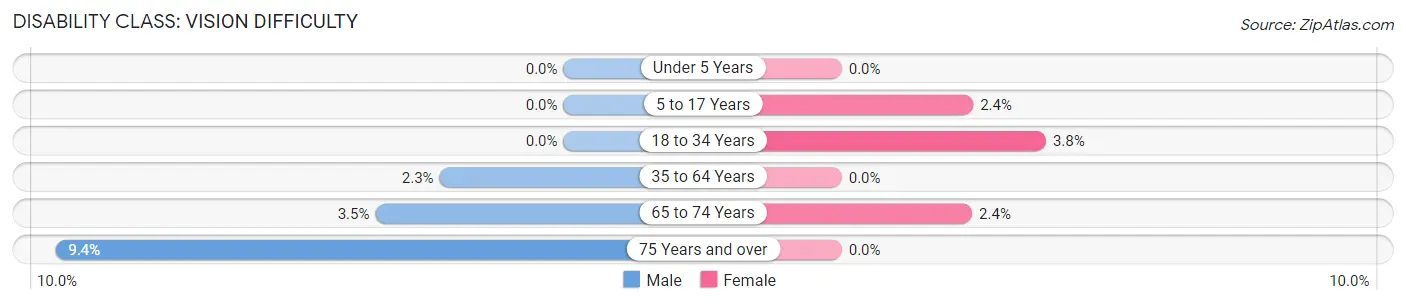
| Age Bracket | Male | Female |
| Under 5 Years | 0 (0.0%) | 0 (0.0%) |
| 5 to 17 Years | 0 (0.0%) | 4 (2.4%) |
| 18 to 34 Years | 0 (0.0%) | 8 (3.8%) |
| 35 to 64 Years | 7 (2.3%) | 0 (0.0%) |
| 65 to 74 Years | 3 (3.5%) | 3 (2.4%) |
| 75 Years and over | 5 (9.4%) | 0 (0.0%) |
Disability Class: Cognitive Difficulty
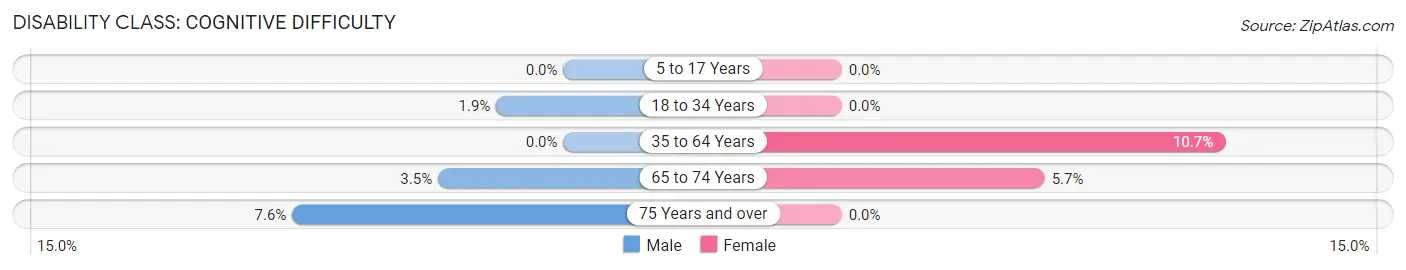
| Age Bracket | Male | Female |
| 5 to 17 Years | 0 (0.0%) | 0 (0.0%) |
| 18 to 34 Years | 4 (1.9%) | 0 (0.0%) |
| 35 to 64 Years | 0 (0.0%) | 32 (10.7%) |
| 65 to 74 Years | 3 (3.5%) | 7 (5.7%) |
| 75 Years and over | 4 (7.5%) | 0 (0.0%) |
Disability Class: Ambulatory Difficulty
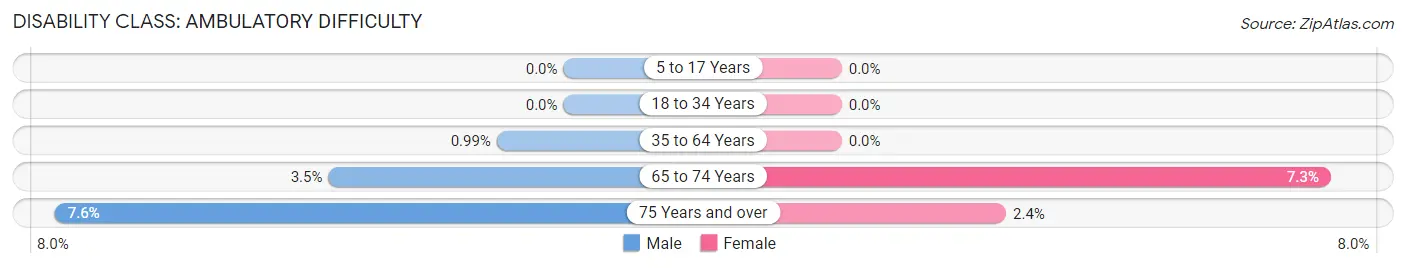
| Age Bracket | Male | Female |
| 5 to 17 Years | 0 (0.0%) | 0 (0.0%) |
| 18 to 34 Years | 0 (0.0%) | 0 (0.0%) |
| 35 to 64 Years | 3 (1.0%) | 0 (0.0%) |
| 65 to 74 Years | 3 (3.5%) | 9 (7.3%) |
| 75 Years and over | 4 (7.5%) | 3 (2.4%) |
Disability Class: Self-Care Difficulty
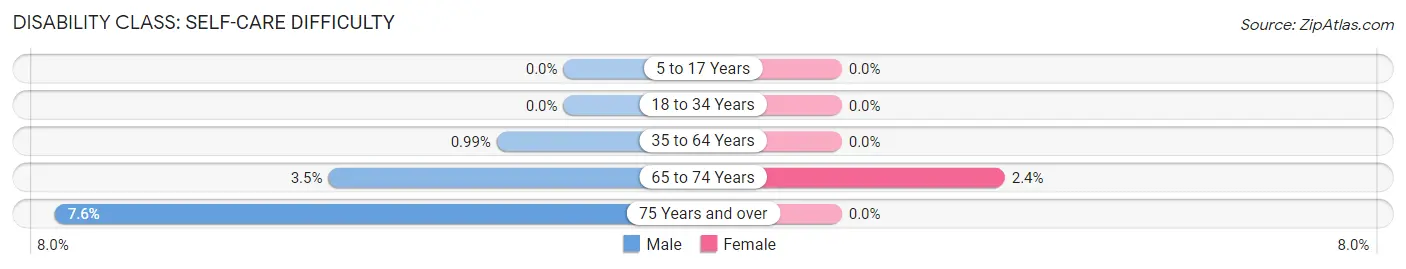
| Age Bracket | Male | Female |
| 5 to 17 Years | 0 (0.0%) | 0 (0.0%) |
| 18 to 34 Years | 0 (0.0%) | 0 (0.0%) |
| 35 to 64 Years | 3 (1.0%) | 0 (0.0%) |
| 65 to 74 Years | 3 (3.5%) | 3 (2.4%) |
| 75 Years and over | 4 (7.5%) | 0 (0.0%) |
Technology Access in Westwood
Computing Device Access in Westwood
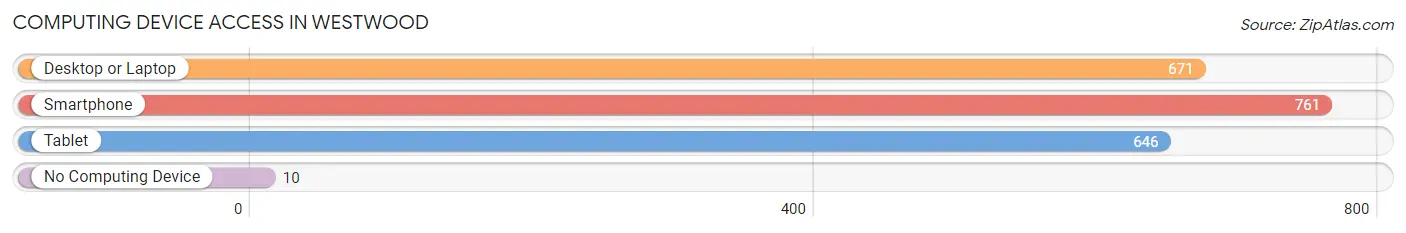
| Device Type | # Households | % Households |
| Desktop or Laptop | 671 | 82.7% |
| Smartphone | 761 | 93.8% |
| Tablet | 646 | 79.6% |
| No Computing Device | 10 | 1.2% |
| Total | 811 | 100.0% |
Internet Access in Westwood
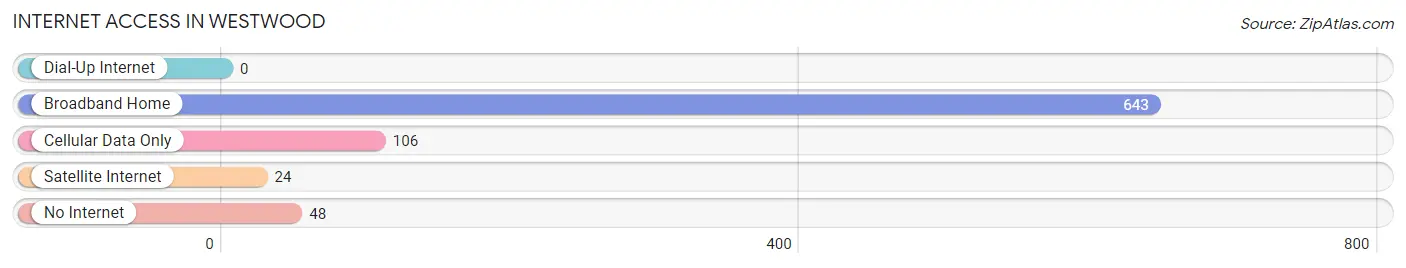
| Internet Type | # Households | % Households |
| Dial-Up Internet | 0 | 0.0% |
| Broadband Home | 643 | 79.3% |
| Cellular Data Only | 106 | 13.1% |
| Satellite Internet | 24 | 3.0% |
| No Internet | 48 | 5.9% |
| Total | 811 | 100.0% |
Westwood Summary
Westwood, Kansas is a small city located in Wyandotte County, Kansas. It is part of the Kansas City metropolitan area and is located just south of the Missouri border. The city has a population of approximately 2,500 people and is home to a variety of businesses, including a large industrial park.
Geography
Westwood is located in the northeast corner of Wyandotte County, Kansas, just south of the Missouri border. The city is situated on the Missouri River, which forms the northern boundary of the city. The city is bordered by the cities of Kansas City, Kansas to the east, Bonner Springs to the south, and Edwardsville to the west. The city is located in the Central Lowland region of the United States, and is characterized by rolling hills and flat plains.
Economy
Westwood is home to a variety of businesses, including a large industrial park. The city is home to several manufacturing companies, including a plastics manufacturer, a metal fabricator, and a food processing plant. The city also has a number of retail stores, restaurants, and other businesses. The city is also home to a number of small businesses, including a number of auto repair shops, a grocery store, and a variety of other businesses.
Demographics
As of the 2010 census, Westwood had a population of 2,500 people. The racial makeup of the city was 87.2% White, 5.2% African American, 0.8% Native American, 0.8% Asian, 0.2% Pacific Islander, and 4.8% from two or more races. Hispanic or Latino of any race were 4.4% of the population.
The median income for a household in Westwood was $45,000, and the median income for a family was $50,000. The per capita income for the city was $20,000. About 11.2% of families and 13.2% of the population were below the poverty line, including 17.2% of those under age 18 and 8.4% of those age 65 or over.
Conclusion
Westwood, Kansas is a small city located in Wyandotte County, Kansas. It is part of the Kansas City metropolitan area and is located just south of the Missouri border. The city has a population of approximately 2,500 people and is home to a variety of businesses, including a large industrial park. The city is situated on the Missouri River and is characterized by rolling hills and flat plains. The city is home to a variety of businesses, including manufacturing companies, retail stores, restaurants, and other businesses. The population of Westwood is predominantly White, with a small percentage of African American, Native American, Asian, and Pacific Islander residents. The median income for a household in Westwood is $45,000, and the median income for a family is $50,000. The per capita income for the city is $20,000.
Common Questions
What is Per Capita Income in Westwood?
Per Capita income in Westwood is $56,415.
What is the Median Family Income in Westwood?
Median Family Income in Westwood is $136,667.
What is the Median Household income in Westwood?
Median Household Income in Westwood is $91,477.
What is Income or Wage Gap in Westwood?
Income or Wage Gap in Westwood is 31.7%.
Women in Westwood earn 68.3 cents for every dollar earned by a man.
What is Inequality or Gini Index in Westwood?
Inequality or Gini Index in Westwood is 0.44.
What is the Total Population of Westwood?
Total Population of Westwood is 1,829.
What is the Total Male Population of Westwood?
Total Male Population of Westwood is 876.
What is the Total Female Population of Westwood?
Total Female Population of Westwood is 953.
What is the Ratio of Males per 100 Females in Westwood?
There are 91.92 Males per 100 Females in Westwood.
What is the Ratio of Females per 100 Males in Westwood?
There are 108.79 Females per 100 Males in Westwood.
What is the Median Population Age in Westwood?
Median Population Age in Westwood is 36.0 Years.
What is the Average Family Size in Westwood
Average Family Size in Westwood is 3.0 People.
What is the Average Household Size in Westwood
Average Household Size in Westwood is 2.3 People.
How Large is the Labor Force in Westwood?
There are 1,084 People in the Labor Forcein in Westwood.
What is the Percentage of People in the Labor Force in Westwood?
74.5% of People are in the Labor Force in Westwood.
What is the Unemployment Rate in Westwood?
Unemployment Rate in Westwood is 0.6%.