Long Island, KS Map & Demographics
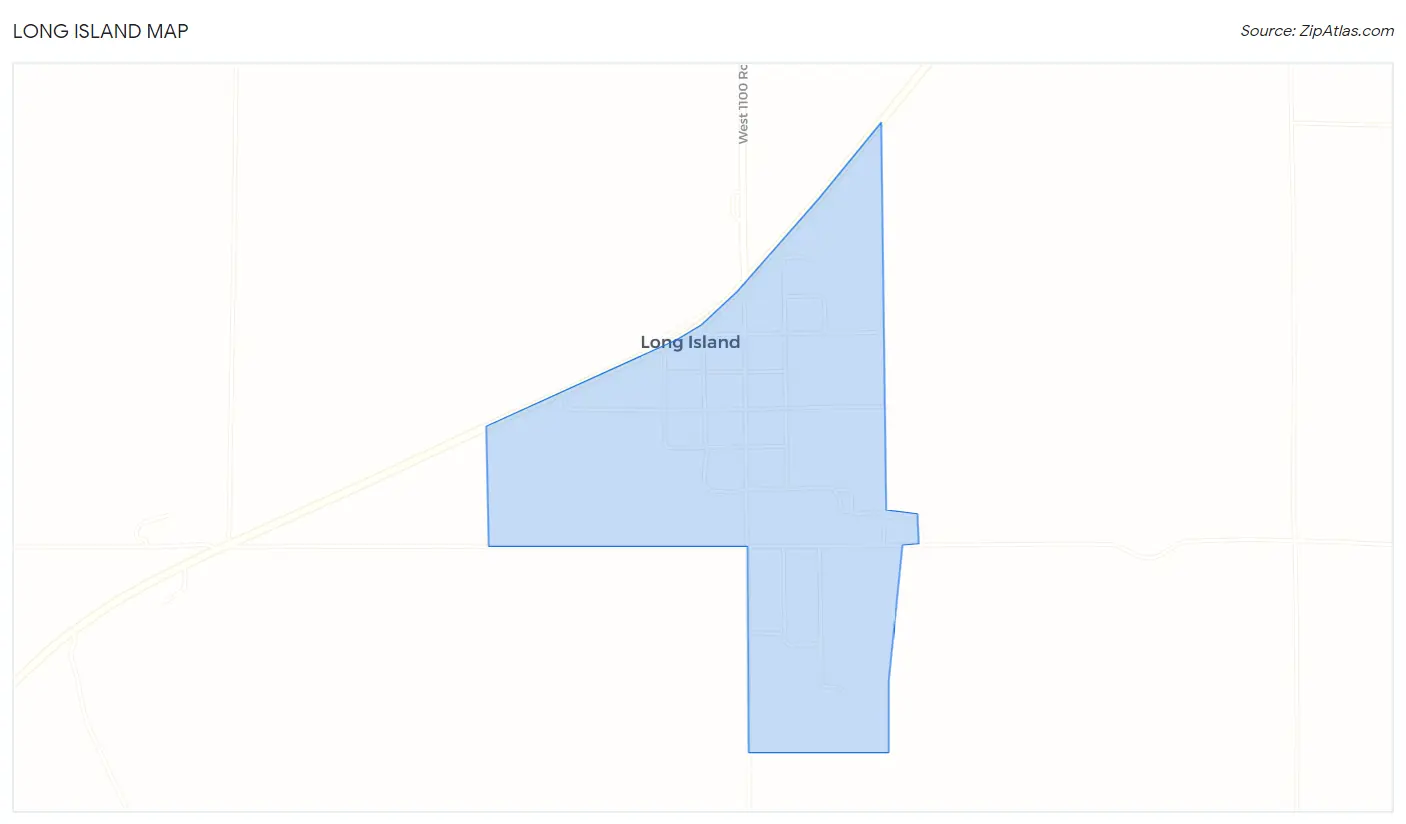
Long Island Map
Long Island Overview
$26,669
PER CAPITA INCOME
$76,250
AVG FAMILY INCOME
$75,625
AVG HOUSEHOLD INCOME
50.3%
WAGE / INCOME GAP [ % ]
49.7¢/ $1
WAGE / INCOME GAP [ $ ]
0.39
INEQUALITY / GINI INDEX
134
TOTAL POPULATION
63
MALE POPULATION
71
FEMALE POPULATION
88.73
MALES / 100 FEMALES
112.70
FEMALES / 100 MALES
24.5
MEDIAN AGE
4.1
AVG FAMILY SIZE
3.8
AVG HOUSEHOLD SIZE
61
LABOR FORCE [ PEOPLE ]
81.3%
PERCENT IN LABOR FORCE
3.3%
UNEMPLOYMENT RATE
Long Island Zip Codes
Long Island Area Codes
Income in Long Island
Income Overview in Long Island
Per Capita Income in Long Island is $26,669, while median incomes of families and households are $76,250 and $75,625 respectively.
| Characteristic | Number | Measure |
| Per Capita Income | 134 | $26,669 |
| Median Family Income | 30 | $76,250 |
| Mean Family Income | 30 | $107,213 |
| Median Household Income | 35 | $75,625 |
| Mean Household Income | 35 | $99,066 |
| Income Deficit | 30 | $0 |
| Wage / Income Gap (%) | 134 | 50.32% |
| Wage / Income Gap ($) | 134 | 49.68¢ per $1 |
| Gini / Inequality Index | 134 | 0.39 |
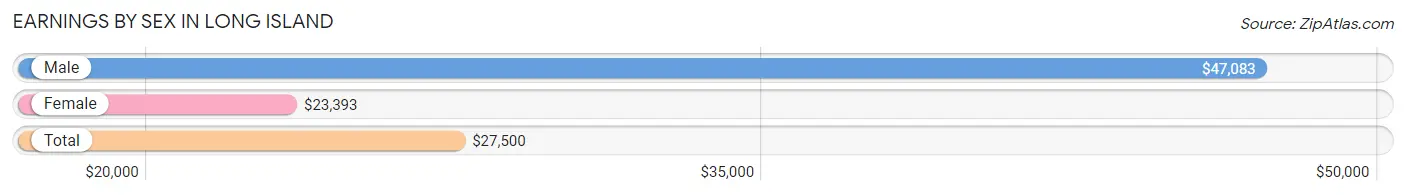
Earnings by Sex in Long Island
Average Earnings in Long Island are $27,500, $47,083 for men and $23,393 for women, a difference of 50.3%.
| Sex | Number | Average Earnings |
| Male | 35 (50.0%) | $47,083 |
| Female | 35 (50.0%) | $23,393 |
| Total | 70 (100.0%) | $27,500 |
Earnings by Sex by Income Bracket in Long Island
The most common earnings brackets in Long Island are $75,000 to $99,999 for men (8 | 22.9%) and $22,500 to $24,999 for women (7 | 20.0%).
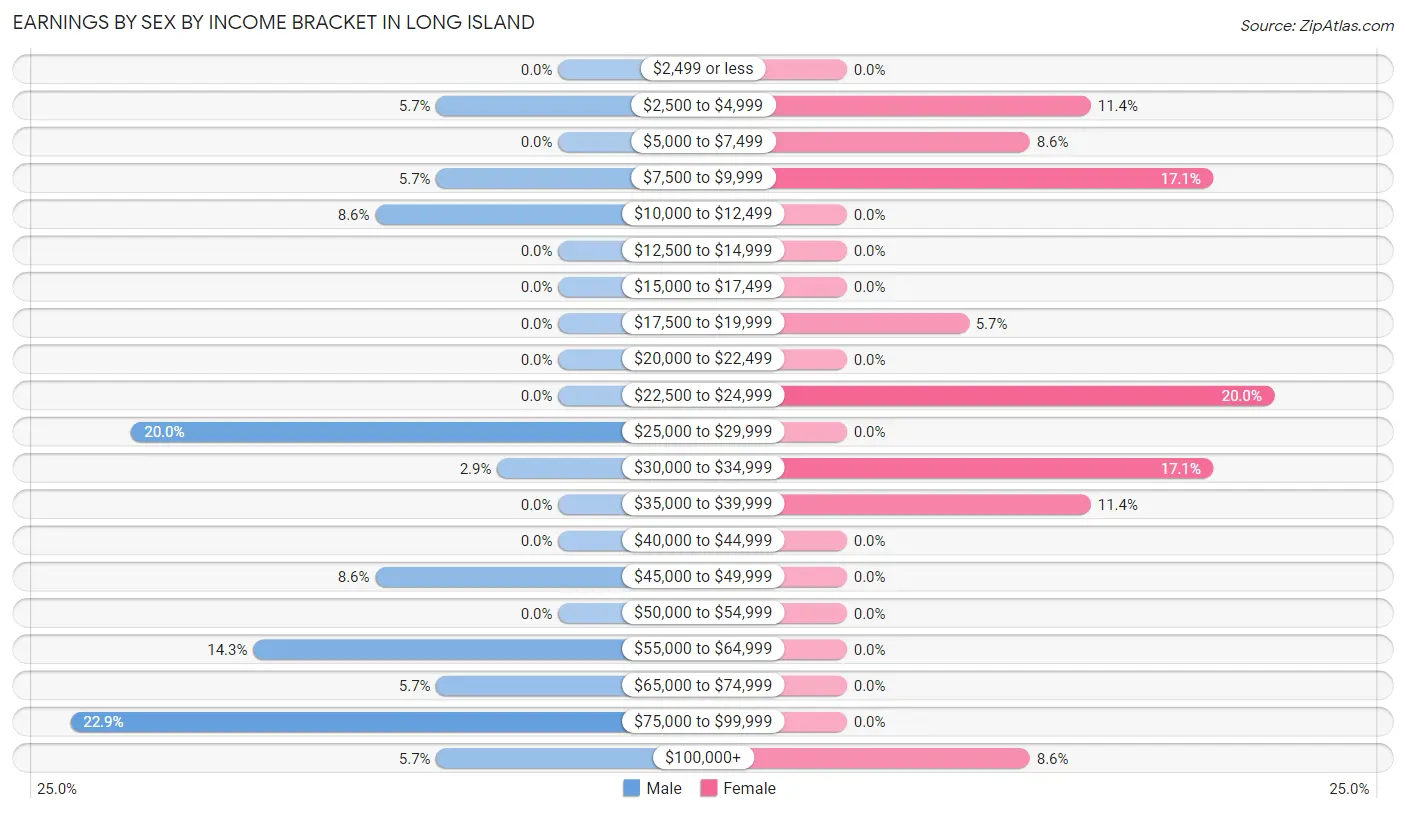
| Income | Male | Female |
| $2,499 or less | 0 (0.0%) | 0 (0.0%) |
| $2,500 to $4,999 | 2 (5.7%) | 4 (11.4%) |
| $5,000 to $7,499 | 0 (0.0%) | 3 (8.6%) |
| $7,500 to $9,999 | 2 (5.7%) | 6 (17.1%) |
| $10,000 to $12,499 | 3 (8.6%) | 0 (0.0%) |
| $12,500 to $14,999 | 0 (0.0%) | 0 (0.0%) |
| $15,000 to $17,499 | 0 (0.0%) | 0 (0.0%) |
| $17,500 to $19,999 | 0 (0.0%) | 2 (5.7%) |
| $20,000 to $22,499 | 0 (0.0%) | 0 (0.0%) |
| $22,500 to $24,999 | 0 (0.0%) | 7 (20.0%) |
| $25,000 to $29,999 | 7 (20.0%) | 0 (0.0%) |
| $30,000 to $34,999 | 1 (2.9%) | 6 (17.1%) |
| $35,000 to $39,999 | 0 (0.0%) | 4 (11.4%) |
| $40,000 to $44,999 | 0 (0.0%) | 0 (0.0%) |
| $45,000 to $49,999 | 3 (8.6%) | 0 (0.0%) |
| $50,000 to $54,999 | 0 (0.0%) | 0 (0.0%) |
| $55,000 to $64,999 | 5 (14.3%) | 0 (0.0%) |
| $65,000 to $74,999 | 2 (5.7%) | 0 (0.0%) |
| $75,000 to $99,999 | 8 (22.9%) | 0 (0.0%) |
| $100,000+ | 2 (5.7%) | 3 (8.6%) |
| Total | 35 (100.0%) | 35 (100.0%) |
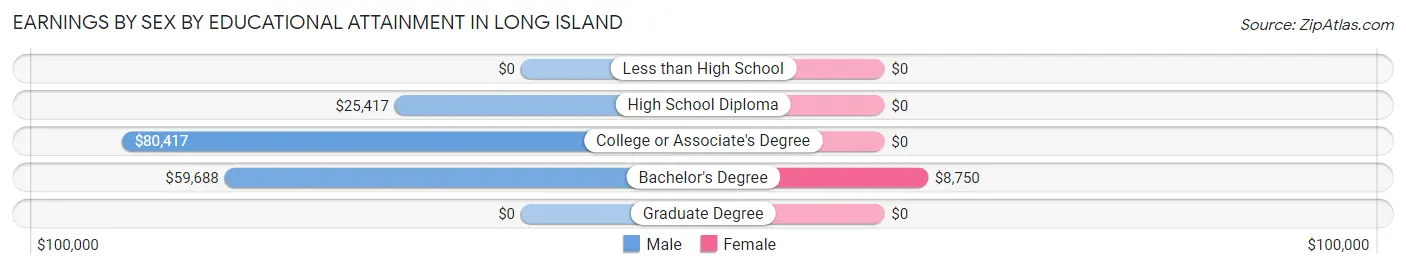
Earnings by Sex by Educational Attainment in Long Island
Average earnings in Long Island are $58,125 for men and $24,167 for women, a difference of 58.4%. Men with an educational attainment of college or associate's degree enjoy the highest average annual earnings of $80,417, while those with high school diploma education earn the least with $25,417. Women with an educational attainment of bachelor's degree earn the most with the average annual earnings of $8,750, while those with bachelor's degree education have the smallest earnings of $8,750.
| Educational Attainment | Male Income | Female Income |
| Less than High School | - | - |
| High School Diploma | $25,417 | $0 |
| College or Associate's Degree | $80,417 | $0 |
| Bachelor's Degree | $59,688 | $8,750 |
| Graduate Degree | - | - |
| Total | $58,125 | $24,167 |
Family Income in Long Island
Family Income Brackets in Long Island
According to the Long Island family income data, there are 13 families falling into the $50,000 to $74,999 income range, which is the most common income bracket and makes up 43.3% of all families.
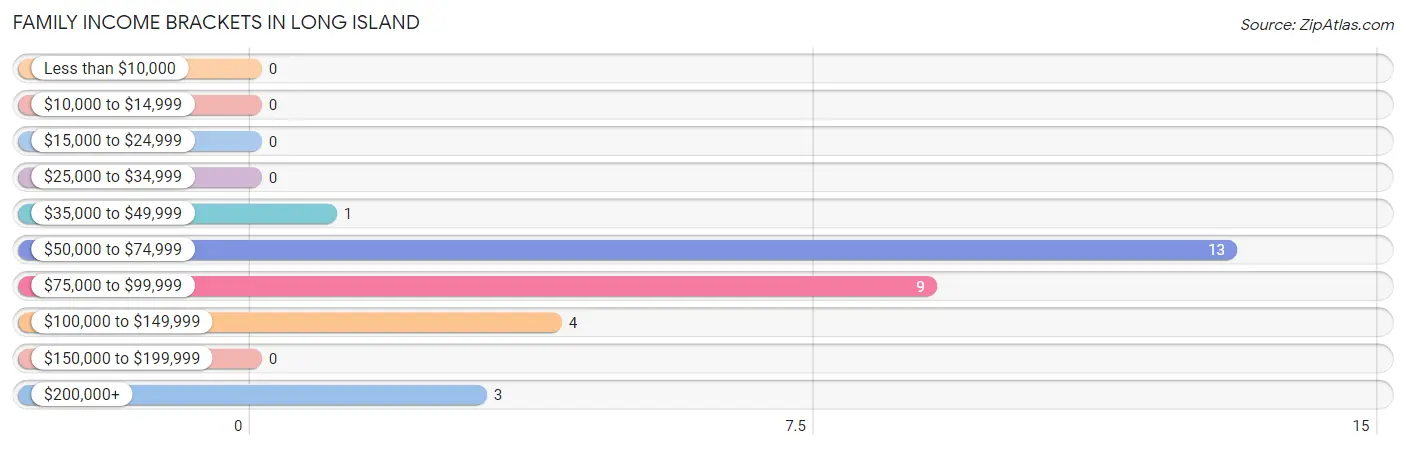
| Income Bracket | # Families | % Families |
| Less than $10,000 | 0 | 0.0% |
| $10,000 to $14,999 | 0 | 0.0% |
| $15,000 to $24,999 | 0 | 0.0% |
| $25,000 to $34,999 | 0 | 0.0% |
| $35,000 to $49,999 | 1 | 3.3% |
| $50,000 to $74,999 | 13 | 43.3% |
| $75,000 to $99,999 | 9 | 30.0% |
| $100,000 to $149,999 | 4 | 13.3% |
| $150,000 to $199,999 | 0 | 0.0% |
| $200,000+ | 3 | 10.0% |
Family Income by Famaliy Size in Long Island
2-person families (12 | 40.0%) account for the highest median family income in Long Island with $67,500 per family, while 2-person families (12 | 40.0%) have the highest median income of $33,750 per family member.
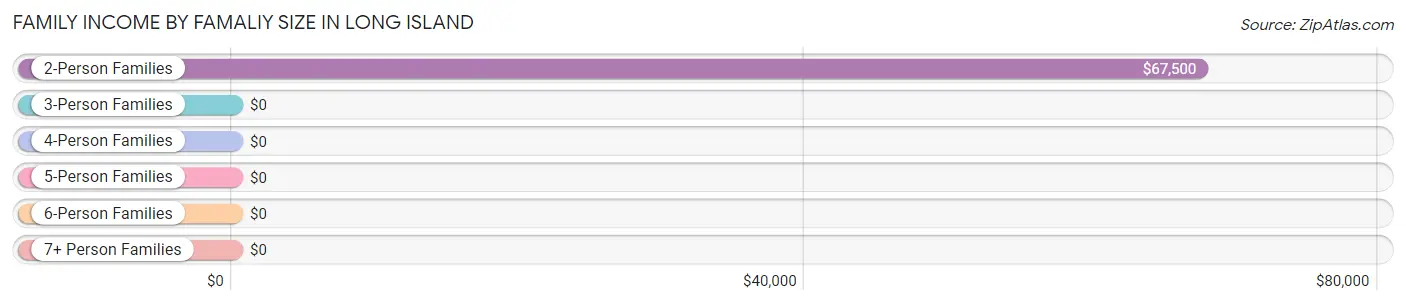
| Income Bracket | # Families | Median Income |
| 2-Person Families | 12 (40.0%) | $67,500 |
| 3-Person Families | 6 (20.0%) | $0 |
| 4-Person Families | 7 (23.3%) | $0 |
| 5-Person Families | 4 (13.3%) | $0 |
| 6-Person Families | 1 (3.3%) | $0 |
| 7+ Person Families | 0 (0.0%) | $0 |
| Total | 30 (100.0%) | $76,250 |
Family Income by Number of Earners in Long Island
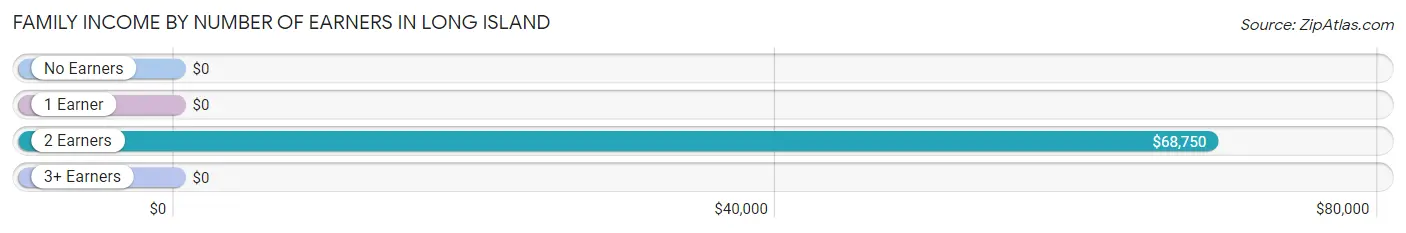
| Number of Earners | # Families | Median Income |
| No Earners | 1 (3.3%) | $0 |
| 1 Earner | 5 (16.7%) | $0 |
| 2 Earners | 20 (66.7%) | $68,750 |
| 3+ Earners | 4 (13.3%) | $0 |
| Total | 30 (100.0%) | $76,250 |
Household Income in Long Island
Household Income Brackets in Long Island
With 12 households falling in the category, the $50,000 to $74,999 income range is the most frequent in Long Island, accounting for 34.3% of all households.
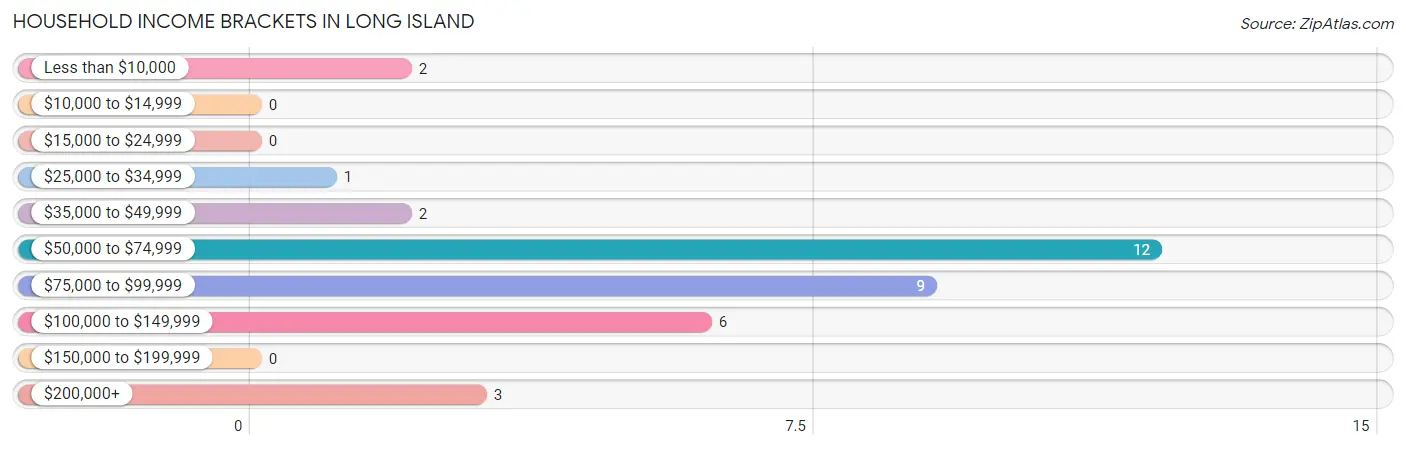
| Income Bracket | # Households | % Households |
| Less than $10,000 | 2 | 5.7% |
| $10,000 to $14,999 | 0 | 0.0% |
| $15,000 to $24,999 | 0 | 0.0% |
| $25,000 to $34,999 | 1 | 2.9% |
| $35,000 to $49,999 | 2 | 5.7% |
| $50,000 to $74,999 | 12 | 34.3% |
| $75,000 to $99,999 | 9 | 25.7% |
| $100,000 to $149,999 | 6 | 17.1% |
| $150,000 to $199,999 | 0 | 0.0% |
| $200,000+ | 3 | 8.6% |
Household Income by Householder Age in Long Island
The median household income in Long Island is $75,625, with the highest median household income of $93,750 found in the 25 to 44 years age bracket for the primary householder. A total of 21 households (60.0%) fall into this category. Meanwhile, the 15 to 24 years age bracket for the primary householder has the lowest median household income of $0, with 1 households (2.9%) in this group.
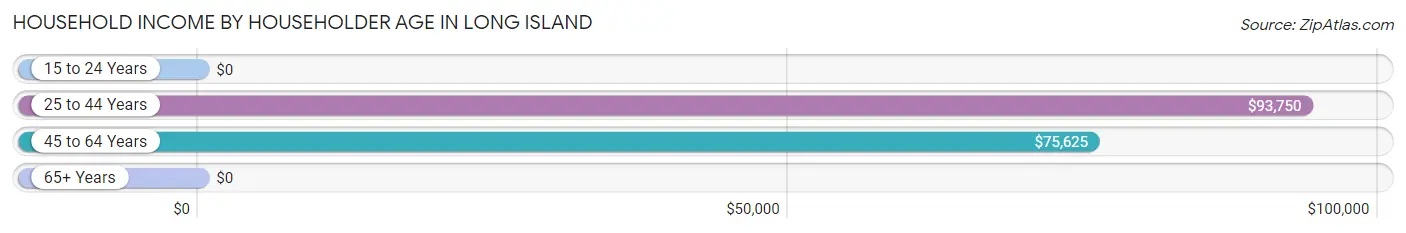
| Income Bracket | # Households | Median Income |
| 15 to 24 Years | 1 (2.9%) | $0 |
| 25 to 44 Years | 21 (60.0%) | $93,750 |
| 45 to 64 Years | 11 (31.4%) | $75,625 |
| 65+ Years | 2 (5.7%) | $0 |
| Total | 35 (100.0%) | $75,625 |
Poverty in Long Island
Income Below Poverty by Sex and Age in Long Island
With 3.2% poverty level for males and 4.2% for females among the residents of Long Island, 35 to 44 year old males and 25 to 34 year old females are the most vulnerable to poverty, with 2 males (13.3%) and 2 females (28.6%) in their respective age groups living below the poverty level.
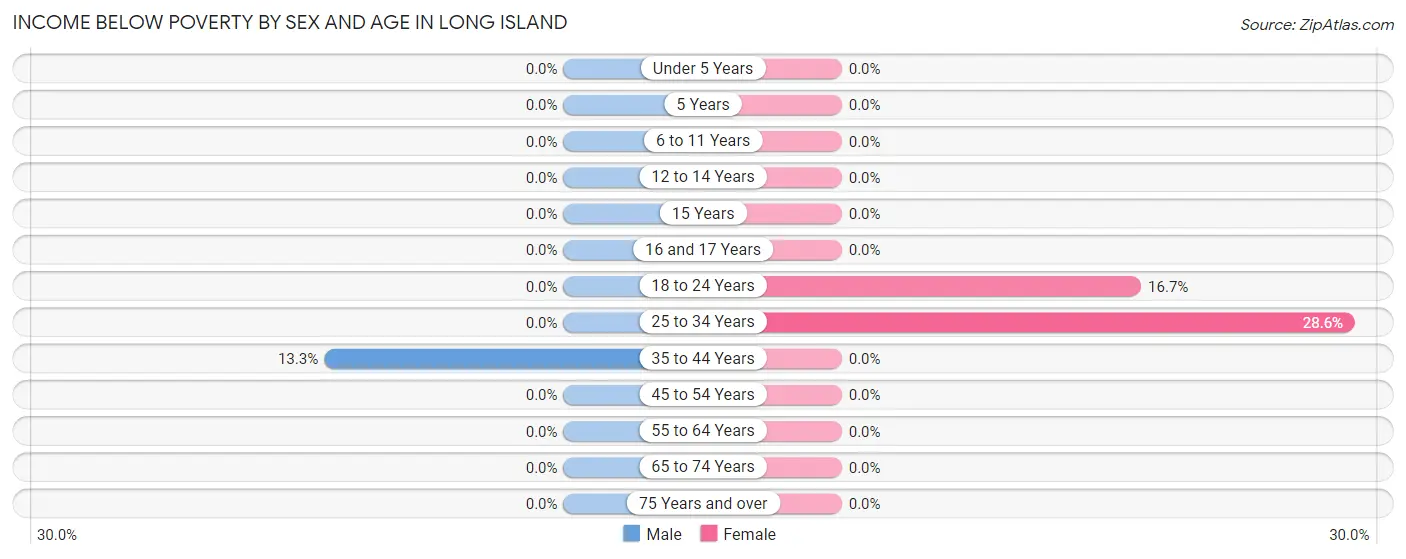
| Age Bracket | Male | Female |
| Under 5 Years | 0 (0.0%) | 0 (0.0%) |
| 5 Years | 0 (0.0%) | 0 (0.0%) |
| 6 to 11 Years | 0 (0.0%) | 0 (0.0%) |
| 12 to 14 Years | 0 (0.0%) | 0 (0.0%) |
| 15 Years | 0 (0.0%) | 0 (0.0%) |
| 16 and 17 Years | 0 (0.0%) | 0 (0.0%) |
| 18 to 24 Years | 0 (0.0%) | 1 (16.7%) |
| 25 to 34 Years | 0 (0.0%) | 2 (28.6%) |
| 35 to 44 Years | 2 (13.3%) | 0 (0.0%) |
| 45 to 54 Years | 0 (0.0%) | 0 (0.0%) |
| 55 to 64 Years | 0 (0.0%) | 0 (0.0%) |
| 65 to 74 Years | 0 (0.0%) | 0 (0.0%) |
| 75 Years and over | 0 (0.0%) | 0 (0.0%) |
| Total | 2 (3.2%) | 3 (4.2%) |
Income Above Poverty by Sex and Age in Long Island
According to the poverty statistics in Long Island, males aged under 5 years and females aged under 5 years are the age groups that are most secure financially, with 100.0% of males and 100.0% of females in these age groups living above the poverty line.
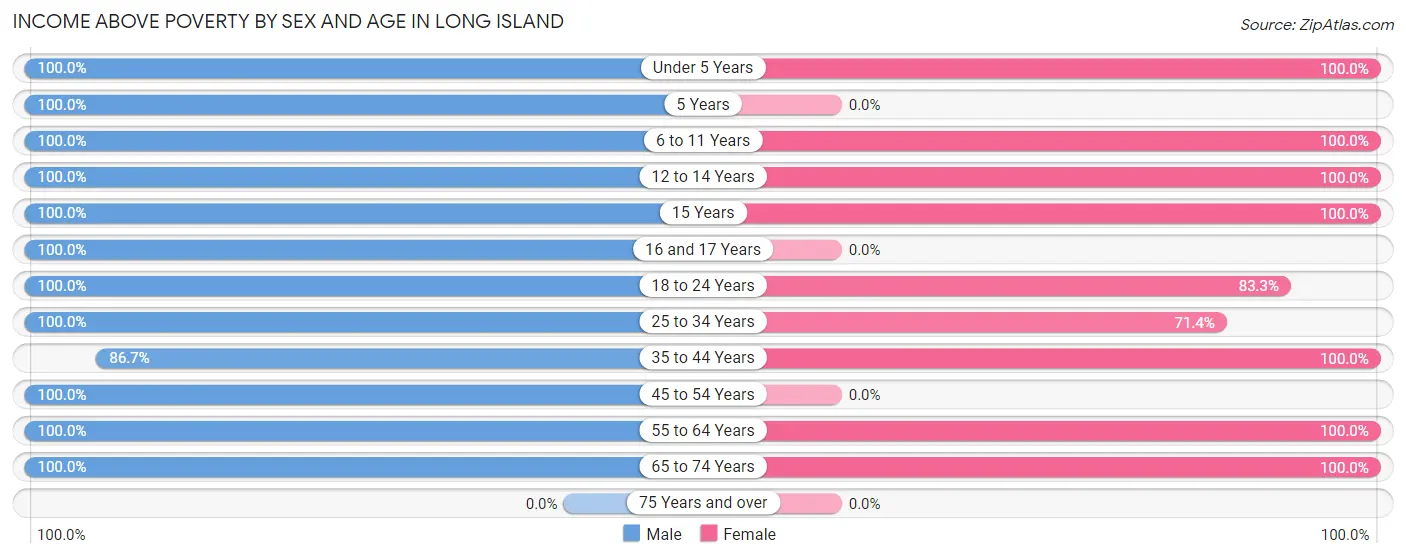
| Age Bracket | Male | Female |
| Under 5 Years | 6 (100.0%) | 14 (100.0%) |
| 5 Years | 9 (100.0%) | 0 (0.0%) |
| 6 to 11 Years | 2 (100.0%) | 10 (100.0%) |
| 12 to 14 Years | 7 (100.0%) | 7 (100.0%) |
| 15 Years | 2 (100.0%) | 2 (100.0%) |
| 16 and 17 Years | 2 (100.0%) | 0 (0.0%) |
| 18 to 24 Years | 1 (100.0%) | 5 (83.3%) |
| 25 to 34 Years | 7 (100.0%) | 5 (71.4%) |
| 35 to 44 Years | 13 (86.7%) | 11 (100.0%) |
| 45 to 54 Years | 2 (100.0%) | 0 (0.0%) |
| 55 to 64 Years | 5 (100.0%) | 11 (100.0%) |
| 65 to 74 Years | 5 (100.0%) | 3 (100.0%) |
| 75 Years and over | 0 (0.0%) | 0 (0.0%) |
| Total | 61 (96.8%) | 68 (95.8%) |
Income Below Poverty Among Married-Couple Families in Long Island
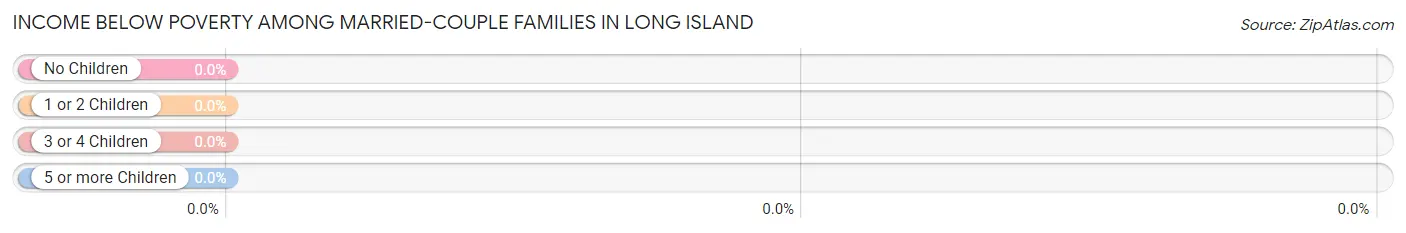
| Children | Above Poverty | Below Poverty |
| No Children | 10 (100.0%) | 0 (0.0%) |
| 1 or 2 Children | 12 (100.0%) | 0 (0.0%) |
| 3 or 4 Children | 3 (100.0%) | 0 (0.0%) |
| 5 or more Children | 0 (0.0%) | 0 (0.0%) |
| Total | 25 (100.0%) | 0 (0.0%) |
Income Below Poverty Among Single-Parent Households in Long Island
| Children | Single Father | Single Mother |
| No Children | 0 (0.0%) | 0 (0.0%) |
| 1 or 2 Children | 0 (0.0%) | 0 (0.0%) |
| 3 or 4 Children | 0 (0.0%) | 0 (0.0%) |
| 5 or more Children | 0 (0.0%) | 0 (0.0%) |
| Total | 0 (0.0%) | 0 (0.0%) |
Income Below Poverty Among Married-Couple vs Single-Parent Households in Long Island
| Children | Married-Couple Families | Single-Parent Households |
| No Children | 0 (0.0%) | 0 (0.0%) |
| 1 or 2 Children | 0 (0.0%) | 0 (0.0%) |
| 3 or 4 Children | 0 (0.0%) | 0 (0.0%) |
| 5 or more Children | 0 (0.0%) | 0 (0.0%) |
| Total | 0 (0.0%) | 0 (0.0%) |
Race in Long Island
The most populous races in Long Island are White / Caucasian (131 | 97.8%), and Two or more Races (3 | 2.2%).
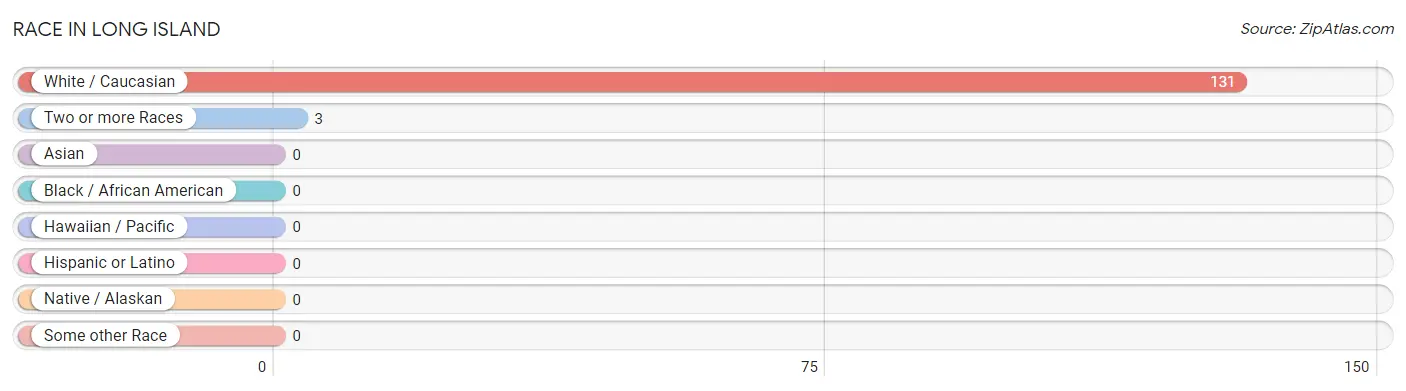
| Race | # Population | % Population |
| Asian | 0 | 0.0% |
| Black / African American | 0 | 0.0% |
| Hawaiian / Pacific | 0 | 0.0% |
| Hispanic or Latino | 0 | 0.0% |
| Native / Alaskan | 0 | 0.0% |
| White / Caucasian | 131 | 97.8% |
| Two or more Races | 3 | 2.2% |
| Some other Race | 0 | 0.0% |
| Total | 134 | 100.0% |
Ancestry in Long Island
The most populous ancestries reported in Long Island are German (61 | 45.5%), Dutch (17 | 12.7%), English (17 | 12.7%), American (14 | 10.4%), and Irish (10 | 7.5%), together accounting for 88.8% of all Long Island residents.
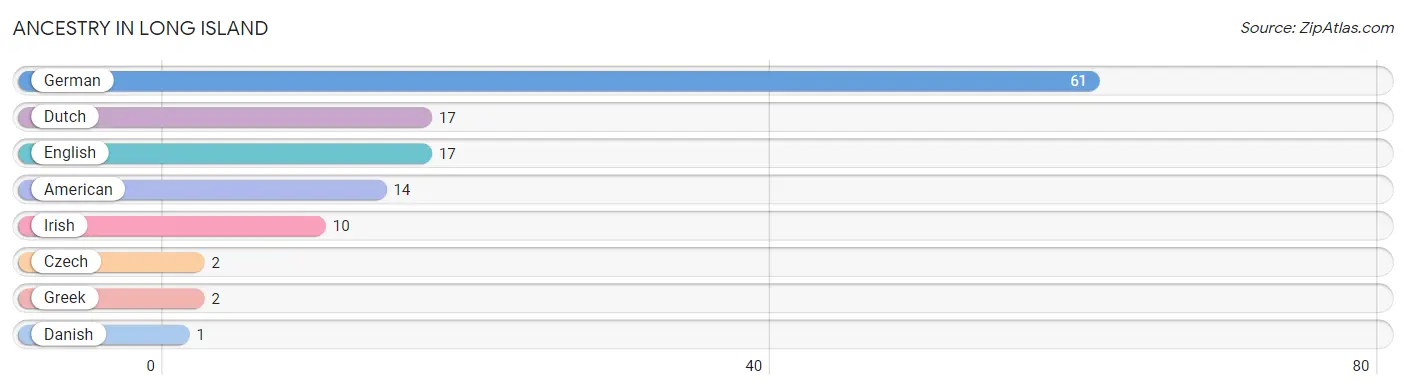
| Ancestry | # Population | % Population |
| American | 14 | 10.4% |
| Czech | 2 | 1.5% |
| Danish | 1 | 0.7% |
| Dutch | 17 | 12.7% |
| English | 17 | 12.7% |
| German | 61 | 45.5% |
| Greek | 2 | 1.5% |
| Irish | 10 | 7.5% | View All 8 Rows |
Immigrants in Long Island

| Immigration Origin | # Population | % Population | View All 0 Rows |
Sex and Age in Long Island
Sex and Age in Long Island
The most populous age groups in Long Island are 40 to 44 Years (10 | 15.9%) for men and Under 5 Years (14 | 19.7%) for women.
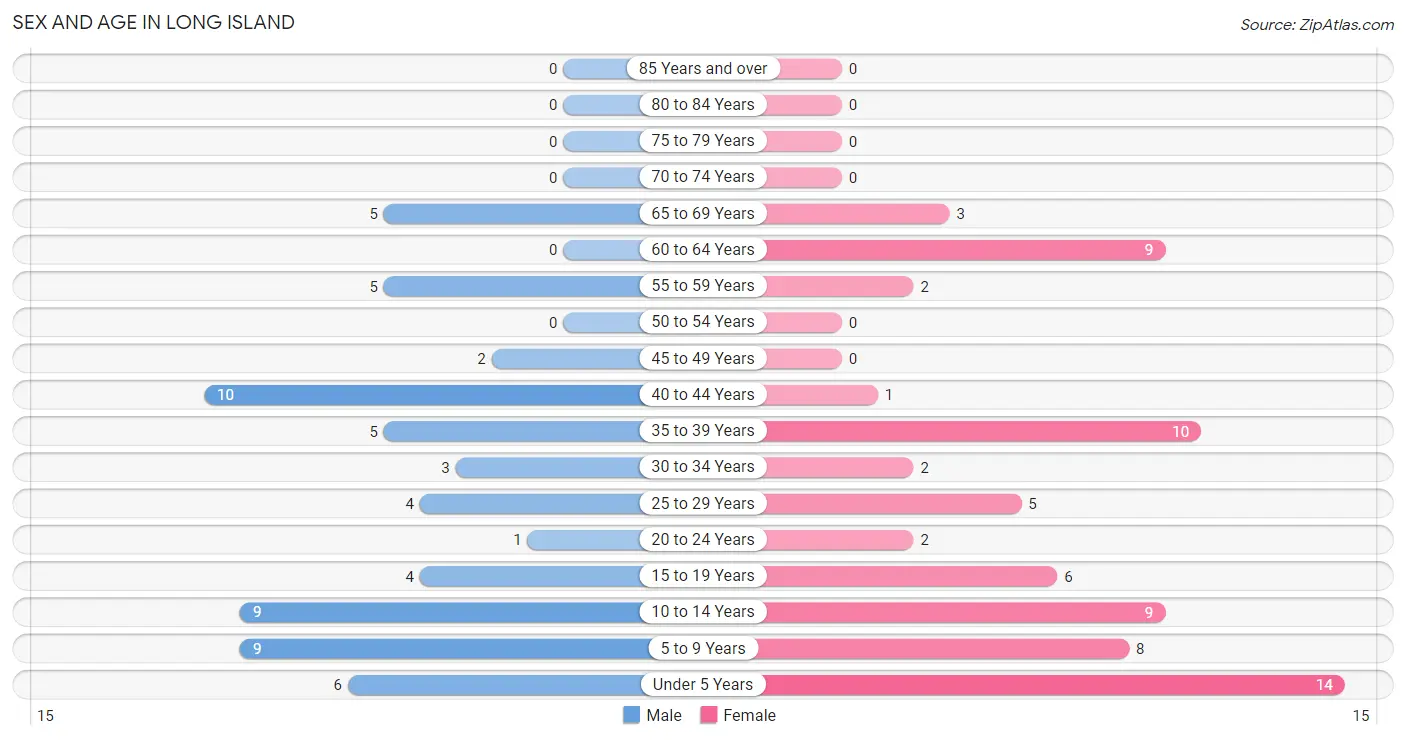
| Age Bracket | Male | Female |
| Under 5 Years | 6 (9.5%) | 14 (19.7%) |
| 5 to 9 Years | 9 (14.3%) | 8 (11.3%) |
| 10 to 14 Years | 9 (14.3%) | 9 (12.7%) |
| 15 to 19 Years | 4 (6.4%) | 6 (8.5%) |
| 20 to 24 Years | 1 (1.6%) | 2 (2.8%) |
| 25 to 29 Years | 4 (6.4%) | 5 (7.0%) |
| 30 to 34 Years | 3 (4.8%) | 2 (2.8%) |
| 35 to 39 Years | 5 (7.9%) | 10 (14.1%) |
| 40 to 44 Years | 10 (15.9%) | 1 (1.4%) |
| 45 to 49 Years | 2 (3.2%) | 0 (0.0%) |
| 50 to 54 Years | 0 (0.0%) | 0 (0.0%) |
| 55 to 59 Years | 5 (7.9%) | 2 (2.8%) |
| 60 to 64 Years | 0 (0.0%) | 9 (12.7%) |
| 65 to 69 Years | 5 (7.9%) | 3 (4.2%) |
| 70 to 74 Years | 0 (0.0%) | 0 (0.0%) |
| 75 to 79 Years | 0 (0.0%) | 0 (0.0%) |
| 80 to 84 Years | 0 (0.0%) | 0 (0.0%) |
| 85 Years and over | 0 (0.0%) | 0 (0.0%) |
| Total | 63 (100.0%) | 71 (100.0%) |
Families and Households in Long Island
Median Family Size in Long Island
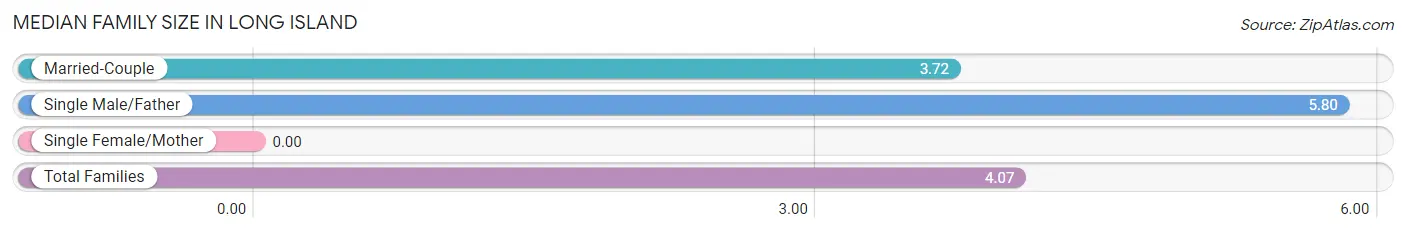
| Family Type | # Families | Family Size |
| Married-Couple | 25 (83.3%) | 3.72 |
| Single Male/Father | 5 (16.7%) | 5.80 |
| Single Female/Mother | 0 (0.0%) | - |
| Total Families | 30 (100.0%) | 4.07 |
Median Household Size in Long Island
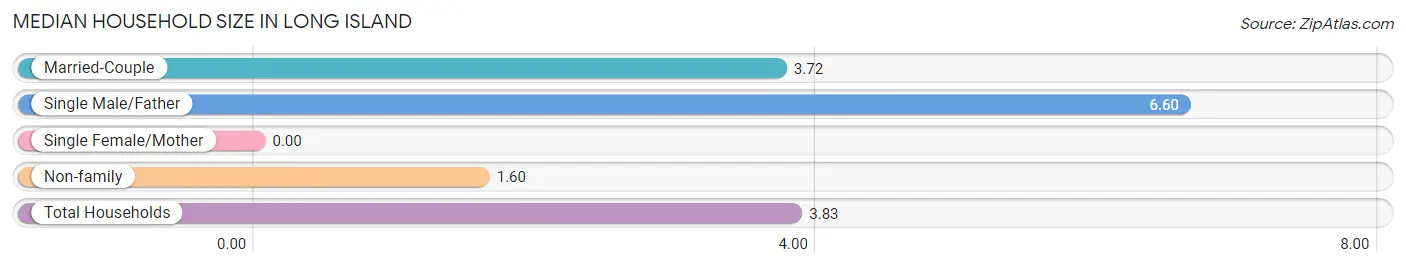
| Household Type | # Households | Household Size |
| Married-Couple | 25 (71.4%) | 3.72 |
| Single Male/Father | 5 (14.3%) | 6.60 |
| Single Female/Mother | 0 (0.0%) | - |
| Non-family | 5 (14.3%) | 1.60 |
| Total Households | 35 (100.0%) | 3.83 |
Household Size by Marriage Status in Long Island
Out of a total of 35 households in Long Island, 30 (85.7%) are family households, while 5 (14.3%) are nonfamily households. The most numerous type of family households are 2-person households, comprising 10, and the most common type of nonfamily households are 2-person households, comprising 4.
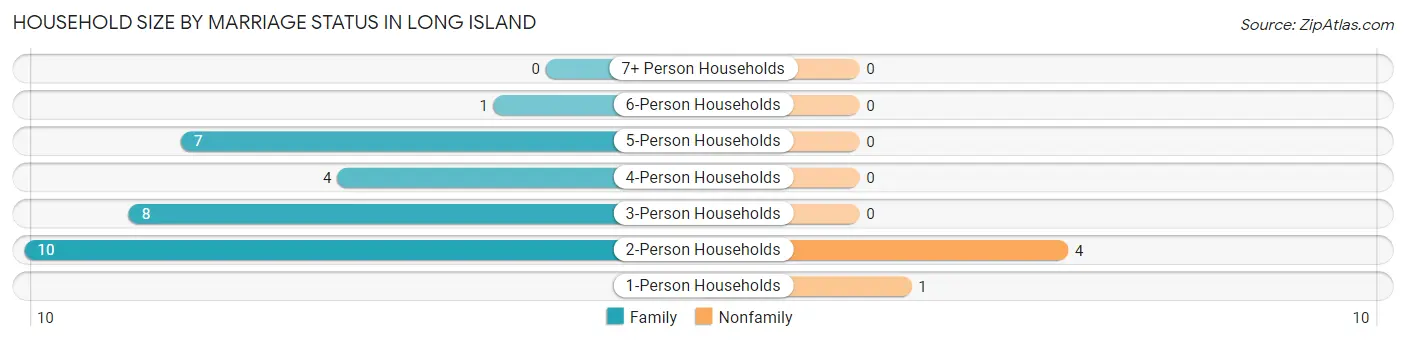
| Household Size | Family Households | Nonfamily Households |
| 1-Person Households | - | 1 (2.9%) |
| 2-Person Households | 10 (28.6%) | 4 (11.4%) |
| 3-Person Households | 8 (22.9%) | 0 (0.0%) |
| 4-Person Households | 4 (11.4%) | 0 (0.0%) |
| 5-Person Households | 7 (20.0%) | 0 (0.0%) |
| 6-Person Households | 1 (2.9%) | 0 (0.0%) |
| 7+ Person Households | 0 (0.0%) | 0 (0.0%) |
| Total | 30 (85.7%) | 5 (14.3%) |
Female Fertility in Long Island
Fertility by Age in Long Island
| Age Bracket | Women with Births | Births / 1,000 Women |
| 15 to 19 years | 0 (0.0%) | 0.0 |
| 20 to 34 years | 0 (0.0%) | 0.0 |
| 35 to 50 years | 0 (0.0%) | 0.0 |
| Total | 0 (0.0%) | 0.0 |
Fertility by Age by Marriage Status in Long Island
| Age Bracket | Married | Unmarried |
| 15 to 19 years | 0 (0.0%) | 0 (0.0%) |
| 20 to 34 years | 0 (0.0%) | 0 (0.0%) |
| 35 to 50 years | 0 (0.0%) | 0 (0.0%) |
| Total | 0 (0.0%) | 0 (0.0%) |
Fertility by Education in Long Island
| Educational Attainment | Women with Births | Births / 1,000 Women |
| Less than High School | 0 (0.0%) | 0.0 |
| High School Diploma | 0 (0.0%) | 0.0 |
| College or Associate's Degree | 0 (0.0%) | 0.0 |
| Bachelor's Degree | 0 (0.0%) | 0.0 |
| Graduate Degree | 0 (0.0%) | 0.0 |
| Total | 0 (0.0%) | 0.0 |
Fertility by Education by Marriage Status in Long Island
| Educational Attainment | Married | Unmarried |
| Less than High School | 0 (0.0%) | 0 (0.0%) |
| High School Diploma | 0 (0.0%) | 0 (0.0%) |
| College or Associate's Degree | 0 (0.0%) | 0 (0.0%) |
| Bachelor's Degree | 0 (0.0%) | 0 (0.0%) |
| Graduate Degree | 0 (0.0%) | 0 (0.0%) |
| Total | 0 (0.0%) | 0 (0.0%) |
Employment Characteristics in Long Island
Employment by Class of Employer in Long Island
Among the 56 employed individuals in Long Island, private company employees (23 | 41.1%), self-employed (not incorporated) (9 | 16.1%), and not-for-profit organizations (9 | 16.1%) make up the most common classes of employment.
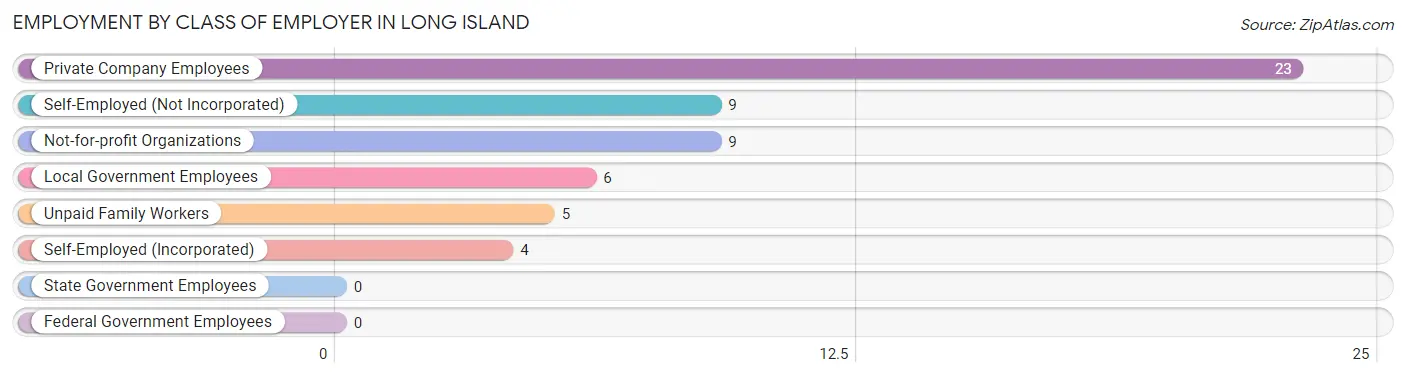
| Employer Class | # Employees | % Employees |
| Private Company Employees | 23 | 41.1% |
| Self-Employed (Incorporated) | 4 | 7.1% |
| Self-Employed (Not Incorporated) | 9 | 16.1% |
| Not-for-profit Organizations | 9 | 16.1% |
| Local Government Employees | 6 | 10.7% |
| State Government Employees | 0 | 0.0% |
| Federal Government Employees | 0 | 0.0% |
| Unpaid Family Workers | 5 | 8.9% |
| Total | 56 | 100.0% |
Employment Status by Age in Long Island
According to the labor force statistics for Long Island, out of the total population over 16 years of age (75), 81.3% or 61 individuals are in the labor force, with 3.3% or 2 of them unemployed. The age group with the highest labor force participation rate is 25 to 29 years, with 100.0% or 9 individuals in the labor force. Within the labor force, the 35 to 44 years age range has the highest percentage of unemployed individuals, with 7.7% or 2 of them being unemployed.
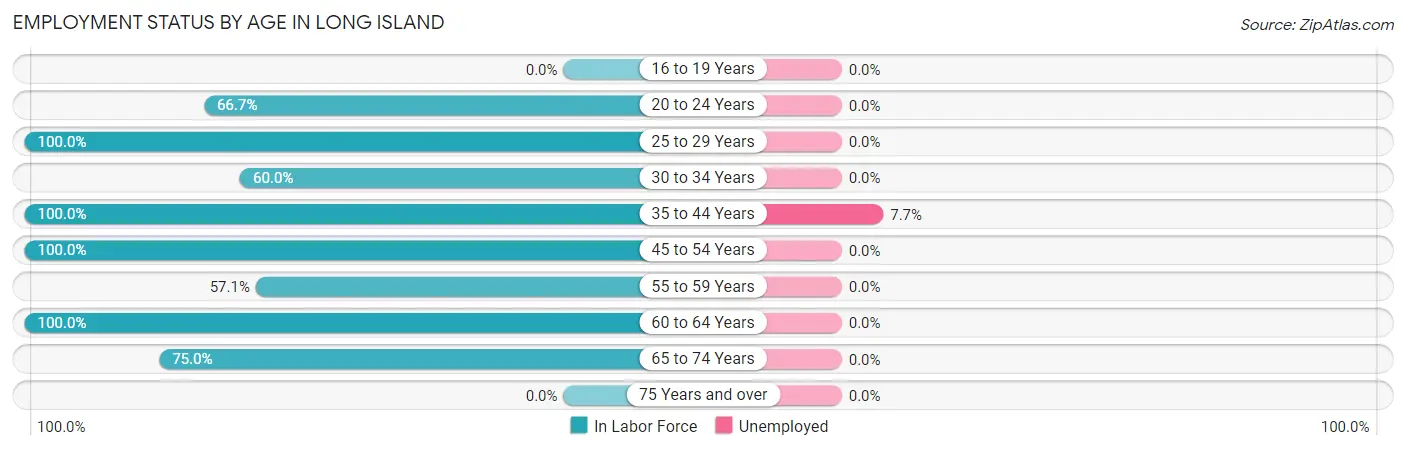
| Age Bracket | In Labor Force | Unemployed |
| 16 to 19 Years | 0 (0.0%) | 0 (0.0%) |
| 20 to 24 Years | 2 (66.7%) | 0 (0.0%) |
| 25 to 29 Years | 9 (100.0%) | 0 (0.0%) |
| 30 to 34 Years | 3 (60.0%) | 0 (0.0%) |
| 35 to 44 Years | 26 (100.0%) | 2 (7.7%) |
| 45 to 54 Years | 2 (100.0%) | 0 (0.0%) |
| 55 to 59 Years | 4 (57.1%) | 0 (0.0%) |
| 60 to 64 Years | 9 (100.0%) | 0 (0.0%) |
| 65 to 74 Years | 6 (75.0%) | 0 (0.0%) |
| 75 Years and over | 0 (0.0%) | 0 (0.0%) |
| Total | 61 (81.3%) | 2 (3.3%) |
Employment Status by Educational Attainment in Long Island
According to labor force statistics for Long Island, 91.4% of individuals (53) out of the total population between 25 and 64 years of age (58) are in the labor force, with 3.8% or 2 of them being unemployed. The group with the highest labor force participation rate are those with the educational attainment of less than high school, with 100.0% or 6 individuals in the labor force. Within the labor force, individuals with high school diploma education have the highest percentage of unemployment, with 25.0% or 2 of them being unemployed.
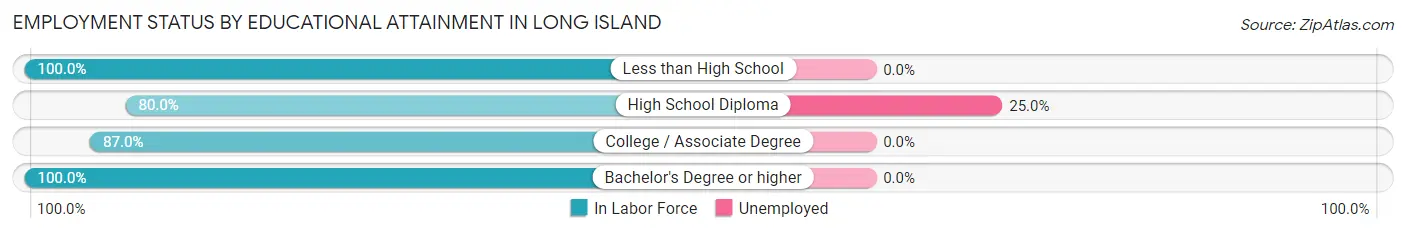
| Educational Attainment | In Labor Force | Unemployed |
| Less than High School | 6 (100.0%) | 0 (0.0%) |
| High School Diploma | 8 (80.0%) | 2 (25.0%) |
| College / Associate Degree | 20 (87.0%) | 0 (0.0%) |
| Bachelor's Degree or higher | 19 (100.0%) | 0 (0.0%) |
| Total | 53 (91.4%) | 2 (3.8%) |
Employment Occupations by Sex in Long Island
Management, Business, Science and Arts Occupations
The most common Management, Business, Science and Arts occupations in Long Island are Management (11 | 18.6%), Business & Financial (8 | 13.6%), Community & Social Service (5 | 8.5%), Education Instruction & Library (5 | 8.5%), and Health Diagnosing & Treating (3 | 5.1%).
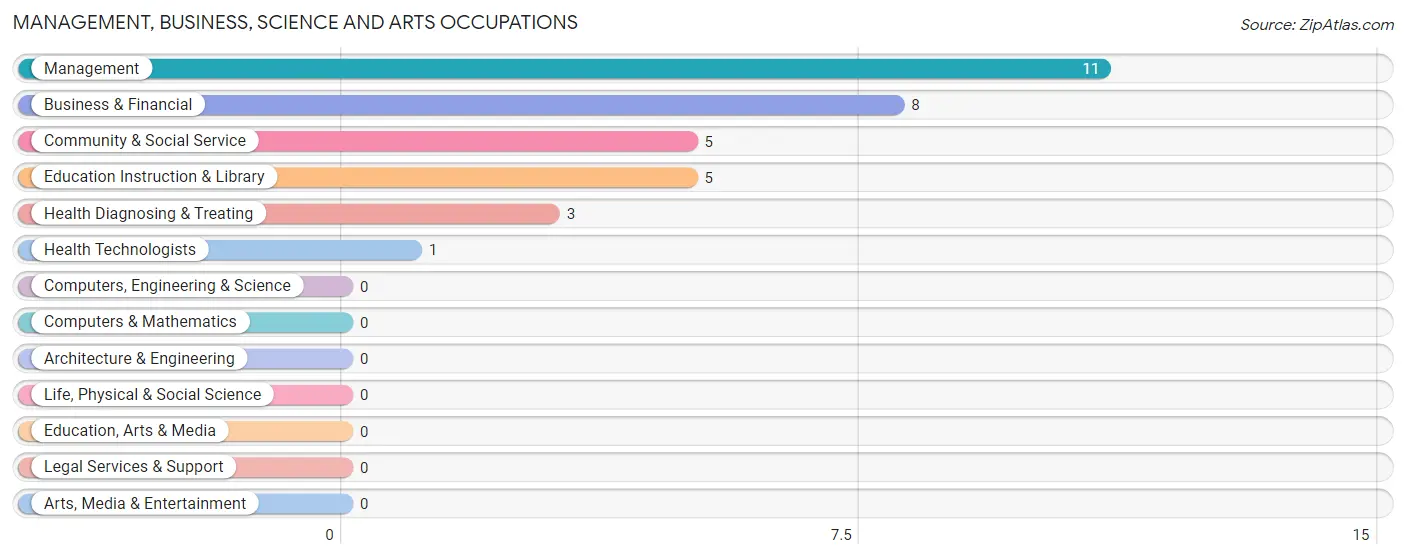
Management, Business, Science and Arts Occupations by Sex
Within the Management, Business, Science and Arts occupations in Long Island, the most male-oriented occupations are Health Diagnosing & Treating (100.0%), Health Technologists (100.0%), and Management (90.9%), while the most female-oriented occupations are Community & Social Service (100.0%), Education Instruction & Library (100.0%), and Business & Financial (25.0%).
| Occupation | Male | Female |
| Management | 10 (90.9%) | 1 (9.1%) |
| Business & Financial | 6 (75.0%) | 2 (25.0%) |
| Computers, Engineering & Science | 0 (0.0%) | 0 (0.0%) |
| Computers & Mathematics | 0 (0.0%) | 0 (0.0%) |
| Architecture & Engineering | 0 (0.0%) | 0 (0.0%) |
| Life, Physical & Social Science | 0 (0.0%) | 0 (0.0%) |
| Community & Social Service | 0 (0.0%) | 5 (100.0%) |
| Education, Arts & Media | 0 (0.0%) | 0 (0.0%) |
| Legal Services & Support | 0 (0.0%) | 0 (0.0%) |
| Education Instruction & Library | 0 (0.0%) | 5 (100.0%) |
| Arts, Media & Entertainment | 0 (0.0%) | 0 (0.0%) |
| Health Diagnosing & Treating | 3 (100.0%) | 0 (0.0%) |
| Health Technologists | 1 (100.0%) | 0 (0.0%) |
| Total (Category) | 19 (70.4%) | 8 (29.6%) |
| Total (Overall) | 30 (50.8%) | 29 (49.1%) |
Services Occupations
The most common Services occupations in Long Island are Food Preparation & Serving (1 | 1.7%), and Cleaning & Maintenance (1 | 1.7%).
Services Occupations by Sex
| Occupation | Male | Female |
| Healthcare Support | 0 (0.0%) | 0 (0.0%) |
| Security & Protection | 0 (0.0%) | 0 (0.0%) |
| Firefighting & Prevention | 0 (0.0%) | 0 (0.0%) |
| Law Enforcement | 0 (0.0%) | 0 (0.0%) |
| Food Preparation & Serving | 0 (0.0%) | 1 (100.0%) |
| Cleaning & Maintenance | 0 (0.0%) | 1 (100.0%) |
| Personal Care & Service | 0 (0.0%) | 0 (0.0%) |
| Total (Category) | 0 (0.0%) | 2 (100.0%) |
| Total (Overall) | 30 (50.8%) | 29 (49.1%) |
Sales and Office Occupations
The most common Sales and Office occupations in Long Island are , and Office & Administration (10 | 17.0%).
Sales and Office Occupations by Sex
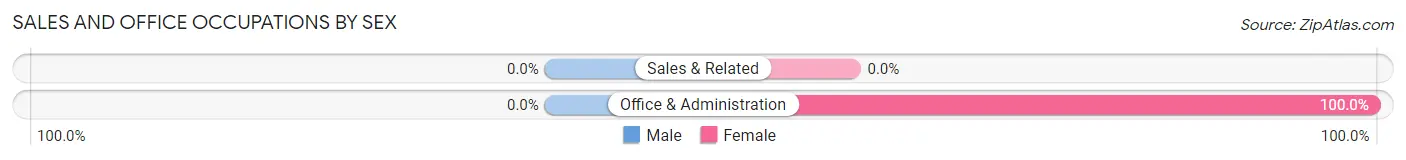
| Occupation | Male | Female |
| Sales & Related | 0 (0.0%) | 0 (0.0%) |
| Office & Administration | 0 (0.0%) | 10 (100.0%) |
| Total (Category) | 0 (0.0%) | 10 (100.0%) |
| Total (Overall) | 30 (50.8%) | 29 (49.1%) |
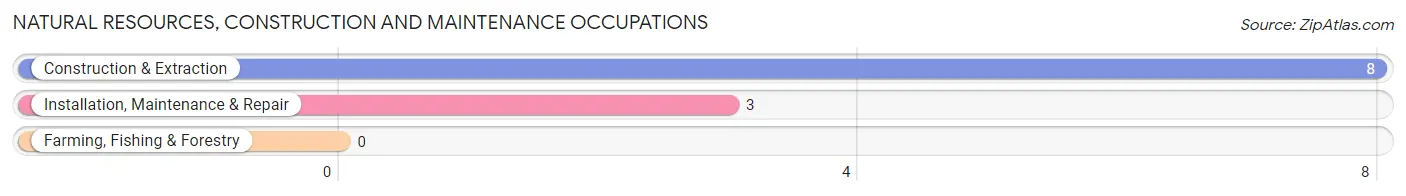
Natural Resources, Construction and Maintenance Occupations
The most common Natural Resources, Construction and Maintenance occupations in Long Island are Construction & Extraction (8 | 13.6%), and Installation, Maintenance & Repair (3 | 5.1%).
Natural Resources, Construction and Maintenance Occupations by Sex
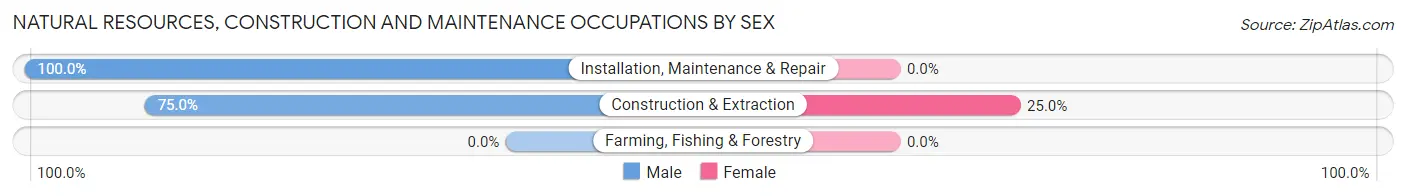
| Occupation | Male | Female |
| Farming, Fishing & Forestry | 0 (0.0%) | 0 (0.0%) |
| Construction & Extraction | 6 (75.0%) | 2 (25.0%) |
| Installation, Maintenance & Repair | 3 (100.0%) | 0 (0.0%) |
| Total (Category) | 9 (81.8%) | 2 (18.2%) |
| Total (Overall) | 30 (50.8%) | 29 (49.1%) |
Production, Transportation and Moving Occupations
The most common Production, Transportation and Moving occupations in Long Island are Transportation (7 | 11.9%), and Material Moving (2 | 3.4%).
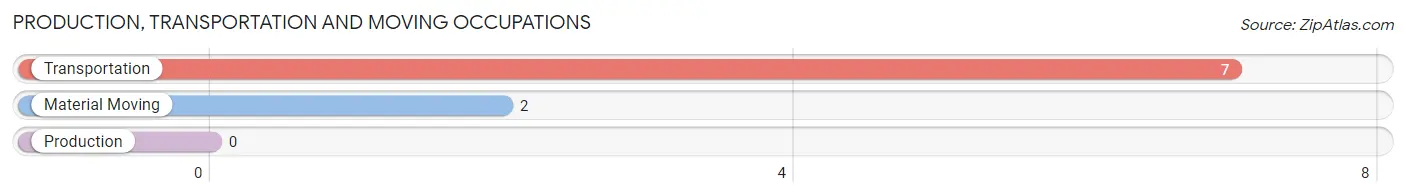
Production, Transportation and Moving Occupations by Sex
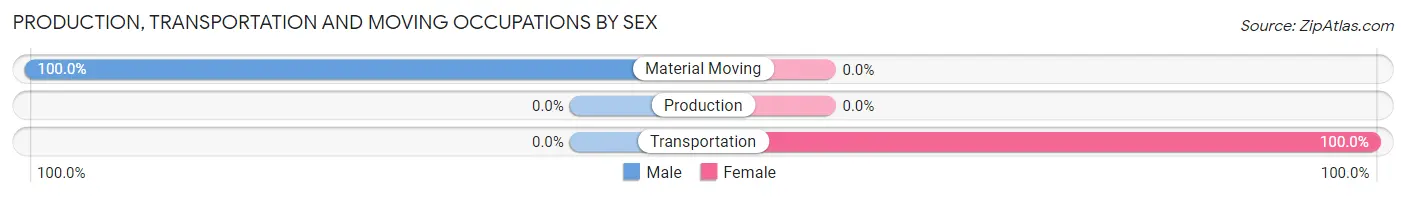
| Occupation | Male | Female |
| Production | 0 (0.0%) | 0 (0.0%) |
| Transportation | 0 (0.0%) | 7 (100.0%) |
| Material Moving | 2 (100.0%) | 0 (0.0%) |
| Total (Category) | 2 (22.2%) | 7 (77.8%) |
| Total (Overall) | 30 (50.8%) | 29 (49.1%) |
Employment Industries by Sex in Long Island
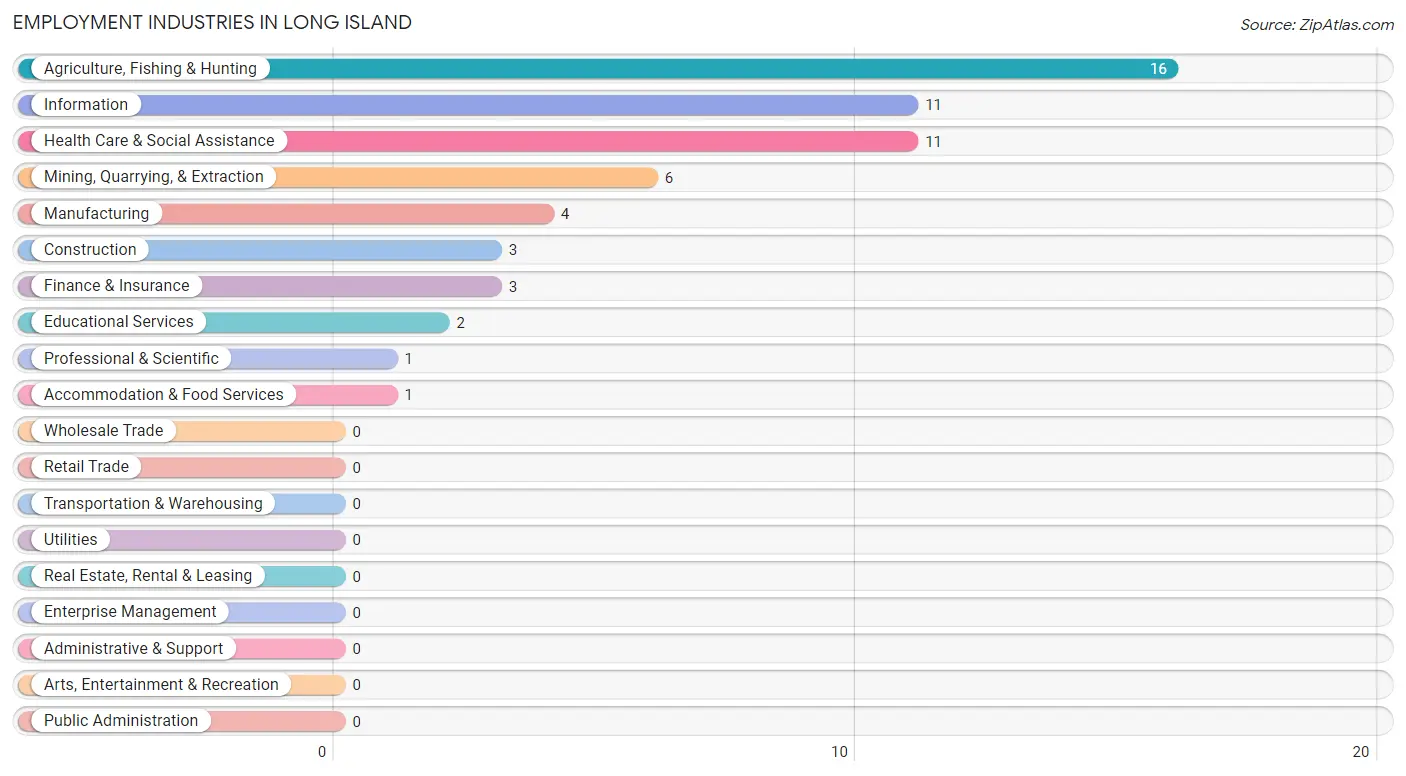
Employment Industries in Long Island
The major employment industries in Long Island include Agriculture, Fishing & Hunting (16 | 27.1%), Information (11 | 18.6%), Health Care & Social Assistance (11 | 18.6%), Mining, Quarrying, & Extraction (6 | 10.2%), and Manufacturing (4 | 6.8%).
Employment Industries by Sex in Long Island
The Long Island industries that see more men than women are Mining, Quarrying, & Extraction (100.0%), Construction (100.0%), and Agriculture, Fishing & Hunting (62.5%), whereas the industries that tend to have a higher number of women are Finance & Insurance (100.0%), Professional & Scientific (100.0%), and Educational Services (100.0%).
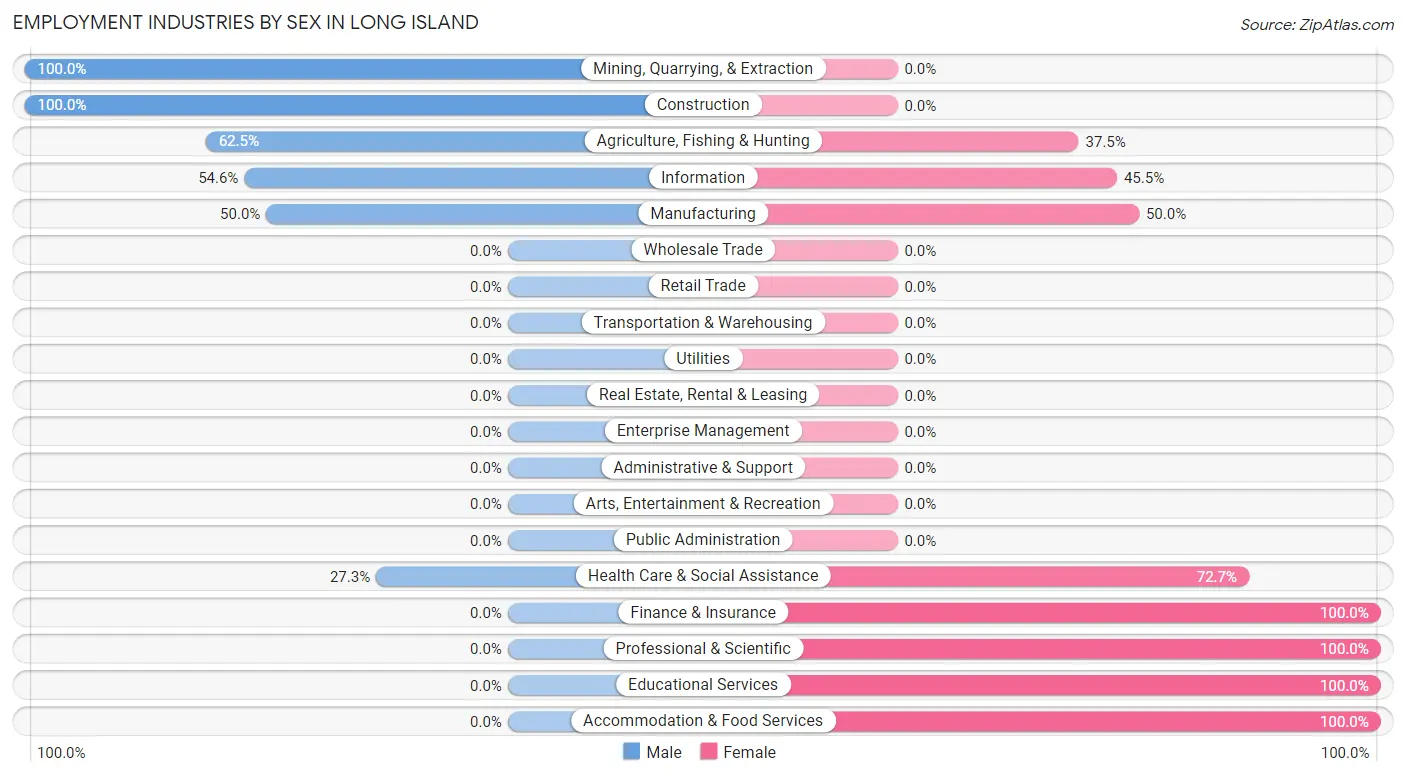
| Industry | Male | Female |
| Agriculture, Fishing & Hunting | 10 (62.5%) | 6 (37.5%) |
| Mining, Quarrying, & Extraction | 6 (100.0%) | 0 (0.0%) |
| Construction | 3 (100.0%) | 0 (0.0%) |
| Manufacturing | 2 (50.0%) | 2 (50.0%) |
| Wholesale Trade | 0 (0.0%) | 0 (0.0%) |
| Retail Trade | 0 (0.0%) | 0 (0.0%) |
| Transportation & Warehousing | 0 (0.0%) | 0 (0.0%) |
| Utilities | 0 (0.0%) | 0 (0.0%) |
| Information | 6 (54.5%) | 5 (45.5%) |
| Finance & Insurance | 0 (0.0%) | 3 (100.0%) |
| Real Estate, Rental & Leasing | 0 (0.0%) | 0 (0.0%) |
| Professional & Scientific | 0 (0.0%) | 1 (100.0%) |
| Enterprise Management | 0 (0.0%) | 0 (0.0%) |
| Administrative & Support | 0 (0.0%) | 0 (0.0%) |
| Educational Services | 0 (0.0%) | 2 (100.0%) |
| Health Care & Social Assistance | 3 (27.3%) | 8 (72.7%) |
| Arts, Entertainment & Recreation | 0 (0.0%) | 0 (0.0%) |
| Accommodation & Food Services | 0 (0.0%) | 1 (100.0%) |
| Public Administration | 0 (0.0%) | 0 (0.0%) |
| Total | 30 (50.8%) | 29 (49.1%) |
Education in Long Island
School Enrollment in Long Island
The most common levels of schooling among the 45 students in Long Island are middle school (16 | 35.6%), high school (12 | 26.7%), and elementary school (8 | 17.8%).
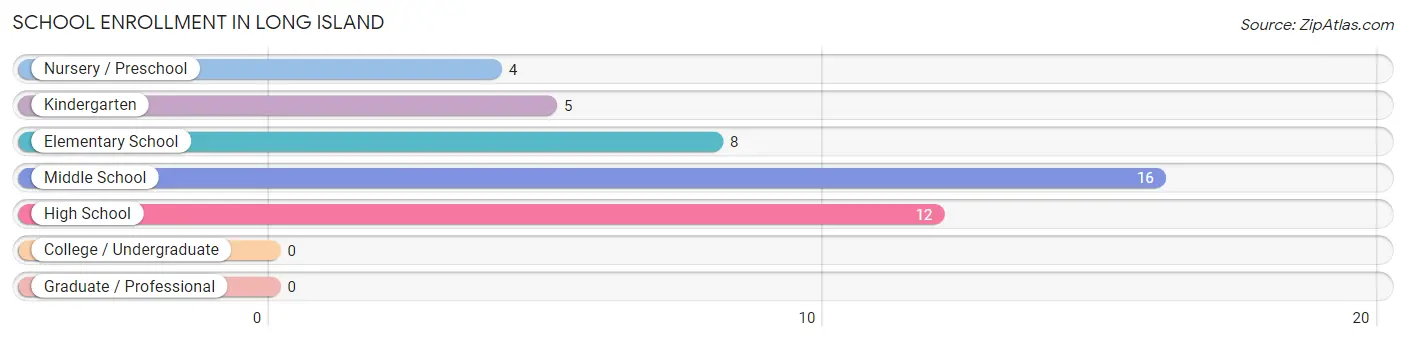
| School Level | # Students | % Students |
| Nursery / Preschool | 4 | 8.9% |
| Kindergarten | 5 | 11.1% |
| Elementary School | 8 | 17.8% |
| Middle School | 16 | 35.6% |
| High School | 12 | 26.7% |
| College / Undergraduate | 0 | 0.0% |
| Graduate / Professional | 0 | 0.0% |
| Total | 45 | 100.0% |
School Enrollment by Age by Funding Source in Long Island
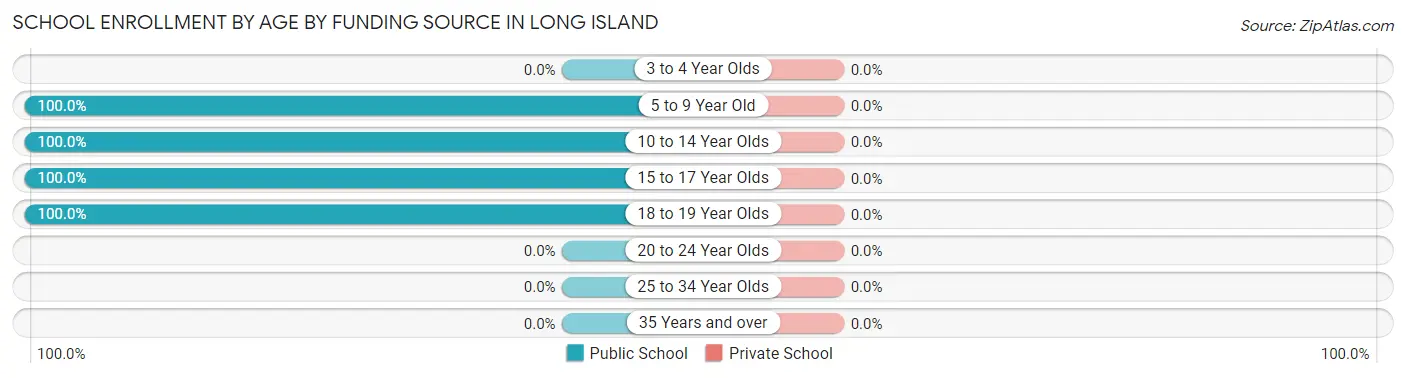
| Age Bracket | Public School | Private School |
| 3 to 4 Year Olds | 0 (0.0%) | 0 (0.0%) |
| 5 to 9 Year Old | 17 (100.0%) | 0 (0.0%) |
| 10 to 14 Year Olds | 18 (100.0%) | 0 (0.0%) |
| 15 to 17 Year Olds | 6 (100.0%) | 0 (0.0%) |
| 18 to 19 Year Olds | 4 (100.0%) | 0 (0.0%) |
| 20 to 24 Year Olds | 0 (0.0%) | 0 (0.0%) |
| 25 to 34 Year Olds | 0 (0.0%) | 0 (0.0%) |
| 35 Years and over | 0 (0.0%) | 0 (0.0%) |
| Total | 45 (100.0%) | 0 (0.0%) |
Educational Attainment by Field of Study in Long Island
Bio, nature & agricultural (7 | 36.8%), business (6 | 31.6%), education (5 | 26.3%), and liberal arts & history (1 | 5.3%) are the most common fields of study among 19 individuals in Long Island who have obtained a bachelor's degree or higher.
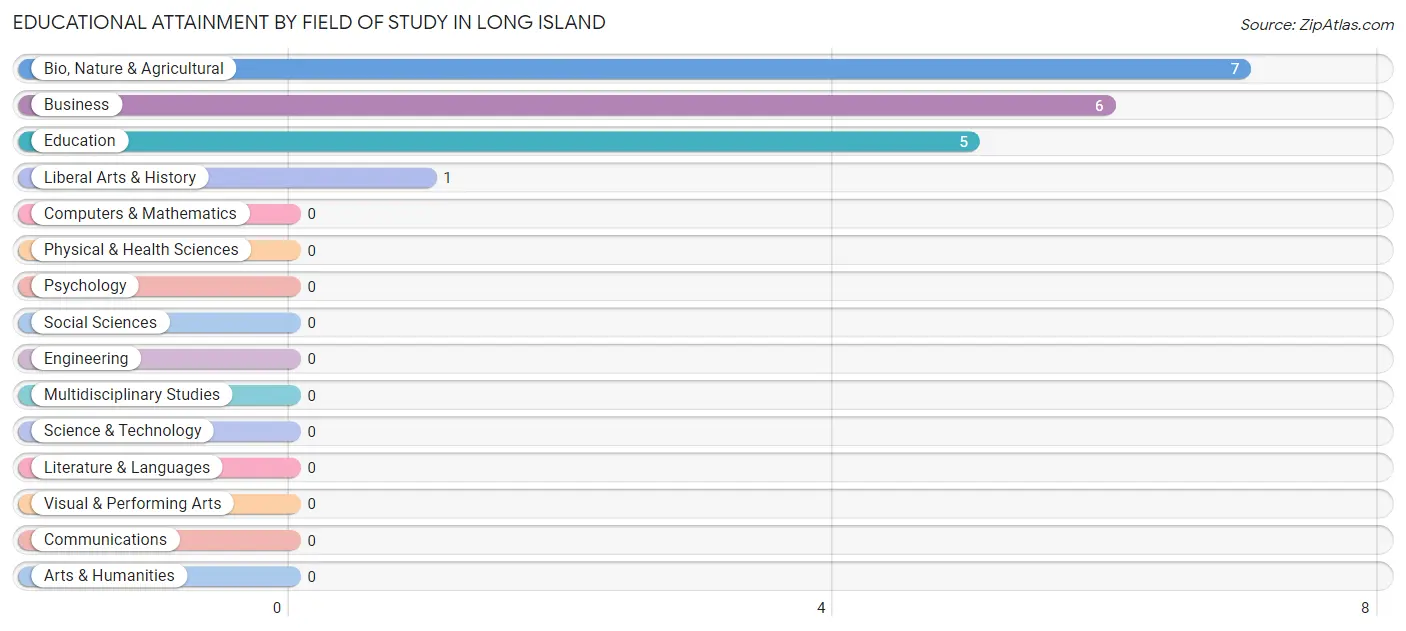
| Field of Study | # Graduates | % Graduates |
| Computers & Mathematics | 0 | 0.0% |
| Bio, Nature & Agricultural | 7 | 36.8% |
| Physical & Health Sciences | 0 | 0.0% |
| Psychology | 0 | 0.0% |
| Social Sciences | 0 | 0.0% |
| Engineering | 0 | 0.0% |
| Multidisciplinary Studies | 0 | 0.0% |
| Science & Technology | 0 | 0.0% |
| Business | 6 | 31.6% |
| Education | 5 | 26.3% |
| Literature & Languages | 0 | 0.0% |
| Liberal Arts & History | 1 | 5.3% |
| Visual & Performing Arts | 0 | 0.0% |
| Communications | 0 | 0.0% |
| Arts & Humanities | 0 | 0.0% |
| Total | 19 | 100.0% |
Transportation & Commute in Long Island
Vehicle Availability by Sex in Long Island
The most prevalent vehicle ownership categories in Long Island are males with 2 vehicles (17, accounting for 63.0%) and females with 2 vehicles (17, making up 58.6%).
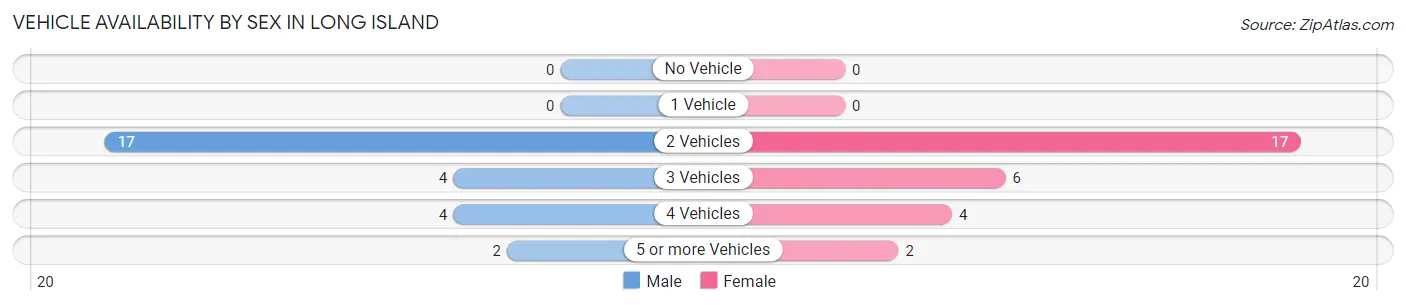
| Vehicles Available | Male | Female |
| No Vehicle | 0 (0.0%) | 0 (0.0%) |
| 1 Vehicle | 0 (0.0%) | 0 (0.0%) |
| 2 Vehicles | 17 (63.0%) | 17 (58.6%) |
| 3 Vehicles | 4 (14.8%) | 6 (20.7%) |
| 4 Vehicles | 4 (14.8%) | 4 (13.8%) |
| 5 or more Vehicles | 2 (7.4%) | 2 (6.9%) |
| Total | 27 (100.0%) | 29 (100.0%) |
Commute Time in Long Island
The most frequently occuring commute durations in Long Island are 10 to 14 minutes (14 commuters, 27.5%), 25 to 29 minutes (12 commuters, 23.5%), and 5 to 9 minutes (8 commuters, 15.7%).
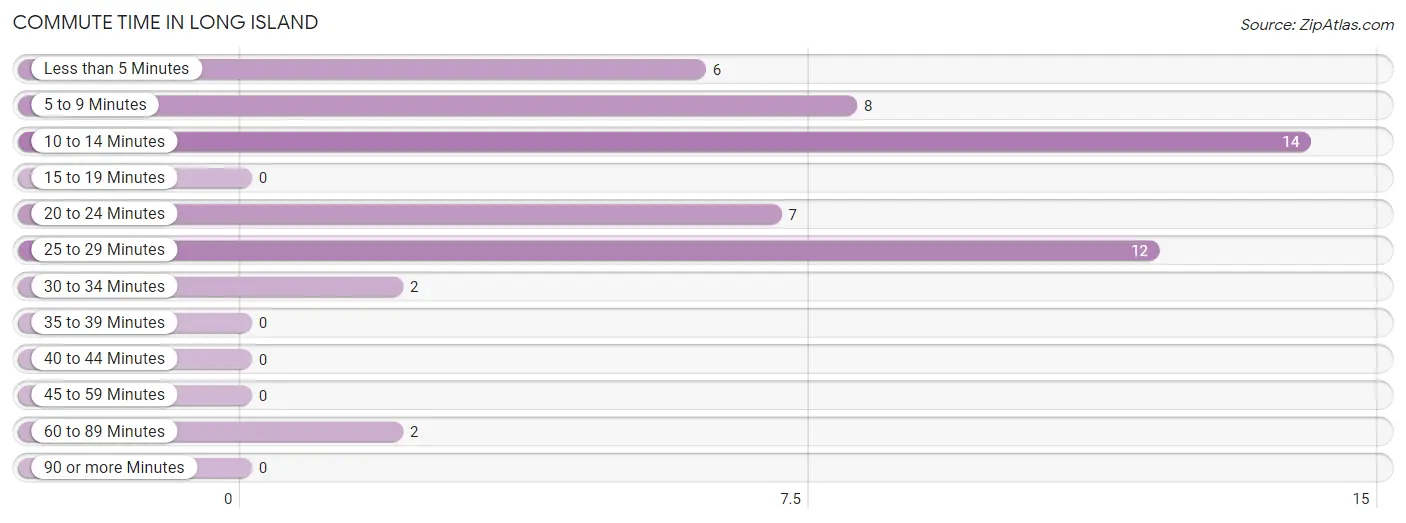
| Commute Time | # Commuters | % Commuters |
| Less than 5 Minutes | 6 | 11.8% |
| 5 to 9 Minutes | 8 | 15.7% |
| 10 to 14 Minutes | 14 | 27.5% |
| 15 to 19 Minutes | 0 | 0.0% |
| 20 to 24 Minutes | 7 | 13.7% |
| 25 to 29 Minutes | 12 | 23.5% |
| 30 to 34 Minutes | 2 | 3.9% |
| 35 to 39 Minutes | 0 | 0.0% |
| 40 to 44 Minutes | 0 | 0.0% |
| 45 to 59 Minutes | 0 | 0.0% |
| 60 to 89 Minutes | 2 | 3.9% |
| 90 or more Minutes | 0 | 0.0% |
Commute Time by Sex in Long Island
The most common commute times in Long Island are 10 to 14 minutes (13 commuters, 48.1%) for males and 5 to 9 minutes (6 commuters, 25.0%) for females.
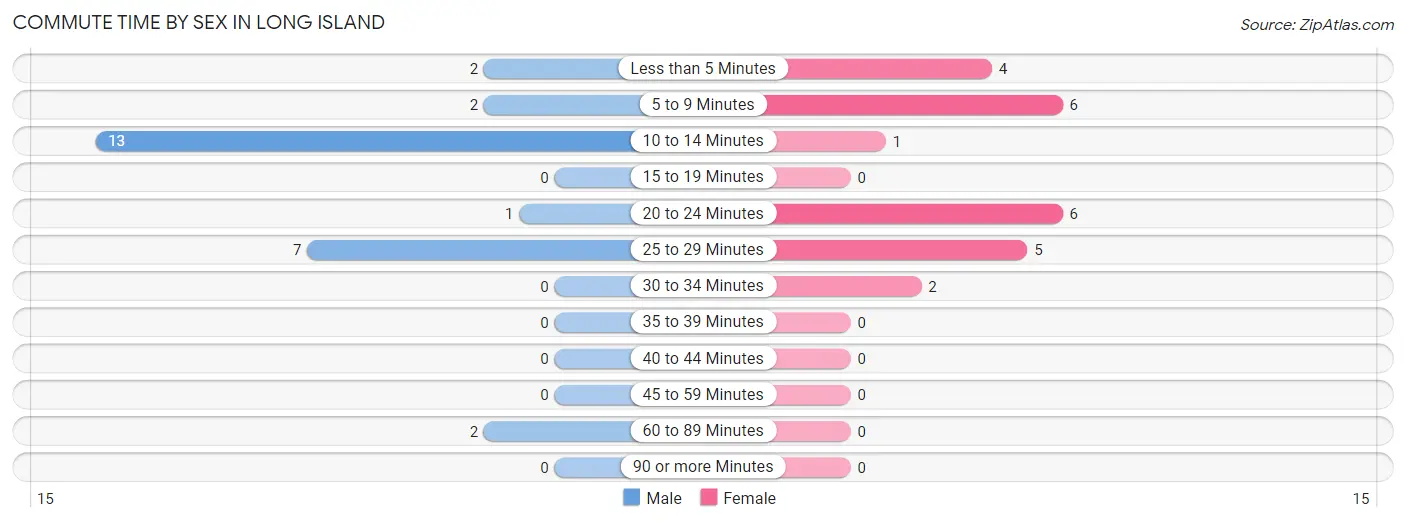
| Commute Time | Male | Female |
| Less than 5 Minutes | 2 (7.4%) | 4 (16.7%) |
| 5 to 9 Minutes | 2 (7.4%) | 6 (25.0%) |
| 10 to 14 Minutes | 13 (48.1%) | 1 (4.2%) |
| 15 to 19 Minutes | 0 (0.0%) | 0 (0.0%) |
| 20 to 24 Minutes | 1 (3.7%) | 6 (25.0%) |
| 25 to 29 Minutes | 7 (25.9%) | 5 (20.8%) |
| 30 to 34 Minutes | 0 (0.0%) | 2 (8.3%) |
| 35 to 39 Minutes | 0 (0.0%) | 0 (0.0%) |
| 40 to 44 Minutes | 0 (0.0%) | 0 (0.0%) |
| 45 to 59 Minutes | 0 (0.0%) | 0 (0.0%) |
| 60 to 89 Minutes | 2 (7.4%) | 0 (0.0%) |
| 90 or more Minutes | 0 (0.0%) | 0 (0.0%) |
Time of Departure to Work by Sex in Long Island
The most frequent times of departure to work in Long Island are 7:00 AM to 7:29 AM (9, 33.3%) for males and 10:00 AM to 10:59 AM (7, 29.2%) for females.
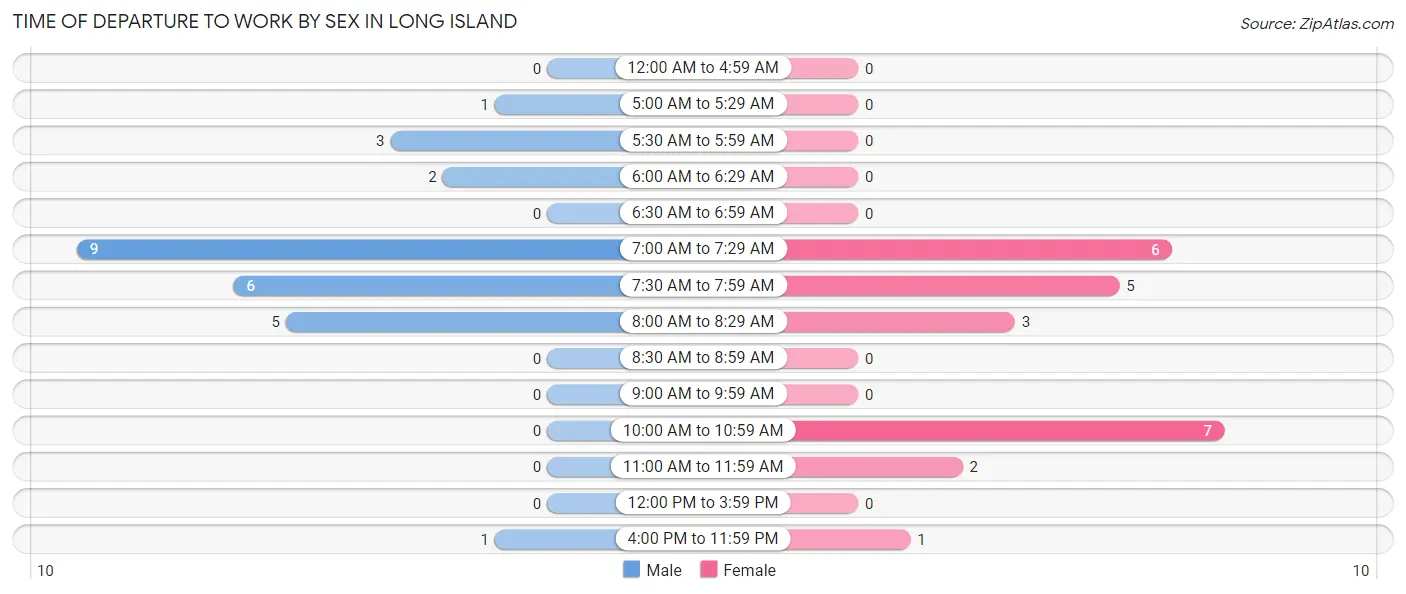
| Time of Departure | Male | Female |
| 12:00 AM to 4:59 AM | 0 (0.0%) | 0 (0.0%) |
| 5:00 AM to 5:29 AM | 1 (3.7%) | 0 (0.0%) |
| 5:30 AM to 5:59 AM | 3 (11.1%) | 0 (0.0%) |
| 6:00 AM to 6:29 AM | 2 (7.4%) | 0 (0.0%) |
| 6:30 AM to 6:59 AM | 0 (0.0%) | 0 (0.0%) |
| 7:00 AM to 7:29 AM | 9 (33.3%) | 6 (25.0%) |
| 7:30 AM to 7:59 AM | 6 (22.2%) | 5 (20.8%) |
| 8:00 AM to 8:29 AM | 5 (18.5%) | 3 (12.5%) |
| 8:30 AM to 8:59 AM | 0 (0.0%) | 0 (0.0%) |
| 9:00 AM to 9:59 AM | 0 (0.0%) | 0 (0.0%) |
| 10:00 AM to 10:59 AM | 0 (0.0%) | 7 (29.2%) |
| 11:00 AM to 11:59 AM | 0 (0.0%) | 2 (8.3%) |
| 12:00 PM to 3:59 PM | 0 (0.0%) | 0 (0.0%) |
| 4:00 PM to 11:59 PM | 1 (3.7%) | 1 (4.2%) |
| Total | 27 (100.0%) | 24 (100.0%) |
Housing Occupancy in Long Island
Occupancy by Ownership in Long Island
Of the total 35 dwellings in Long Island, owner-occupied units account for 31 (88.6%), while renter-occupied units make up 4 (11.4%).
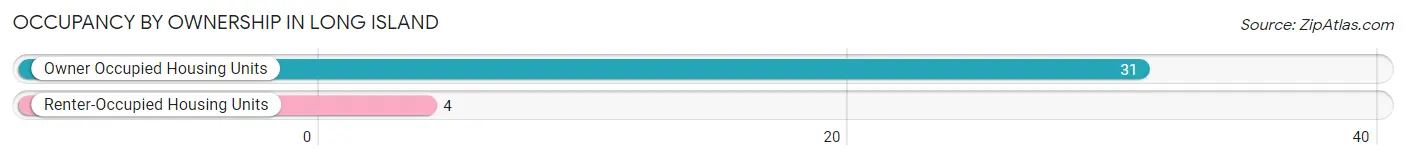
| Occupancy | # Housing Units | % Housing Units |
| Owner Occupied Housing Units | 31 | 88.6% |
| Renter-Occupied Housing Units | 4 | 11.4% |
| Total Occupied Housing Units | 35 | 100.0% |
Occupancy by Household Size in Long Island
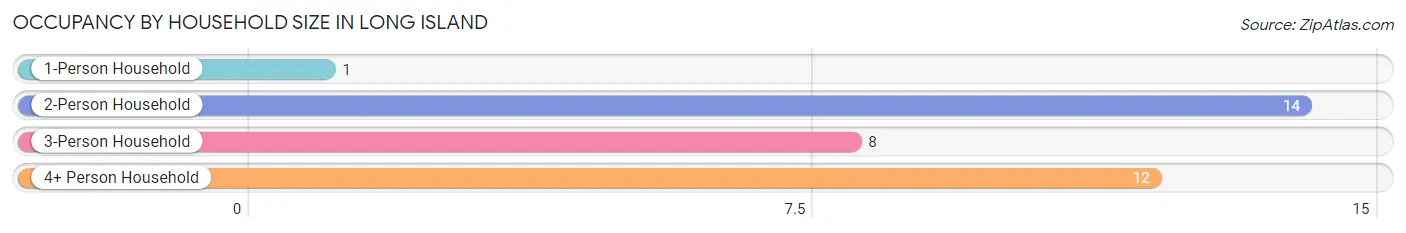
| Household Size | # Housing Units | % Housing Units |
| 1-Person Household | 1 | 2.9% |
| 2-Person Household | 14 | 40.0% |
| 3-Person Household | 8 | 22.9% |
| 4+ Person Household | 12 | 34.3% |
| Total Housing Units | 35 | 100.0% |
Occupancy by Ownership by Household Size in Long Island
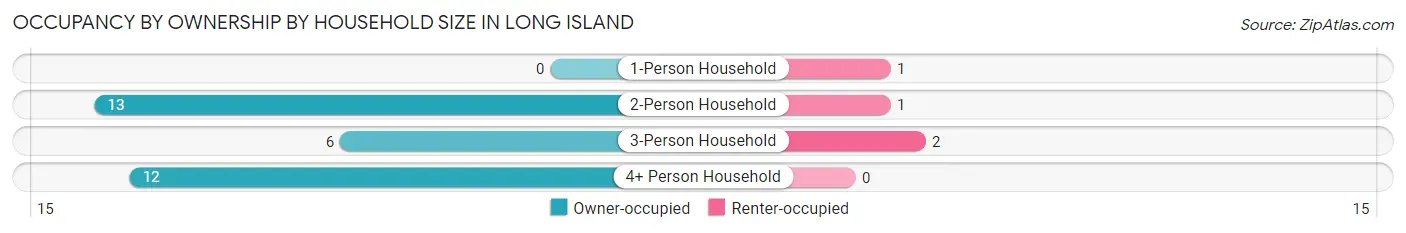
| Household Size | Owner-occupied | Renter-occupied |
| 1-Person Household | 0 (0.0%) | 1 (100.0%) |
| 2-Person Household | 13 (92.9%) | 1 (7.1%) |
| 3-Person Household | 6 (75.0%) | 2 (25.0%) |
| 4+ Person Household | 12 (100.0%) | 0 (0.0%) |
| Total Housing Units | 31 (88.6%) | 4 (11.4%) |
Occupancy by Educational Attainment in Long Island
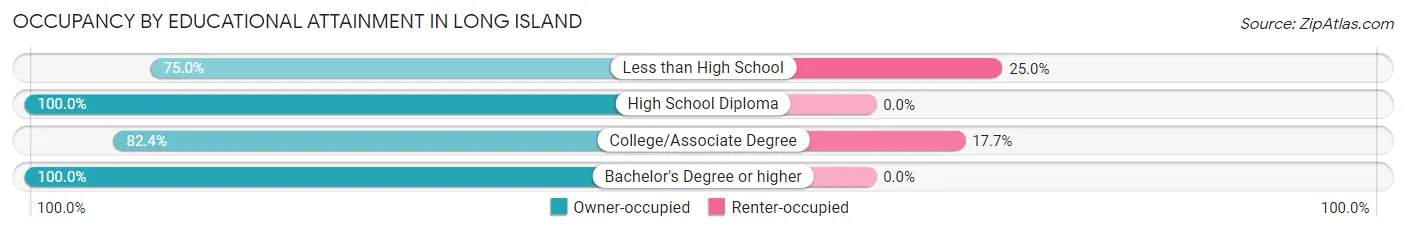
| Household Size | Owner-occupied | Renter-occupied |
| Less than High School | 3 (75.0%) | 1 (25.0%) |
| High School Diploma | 4 (100.0%) | 0 (0.0%) |
| College/Associate Degree | 14 (82.4%) | 3 (17.6%) |
| Bachelor's Degree or higher | 10 (100.0%) | 0 (0.0%) |
Occupancy by Age of Householder in Long Island
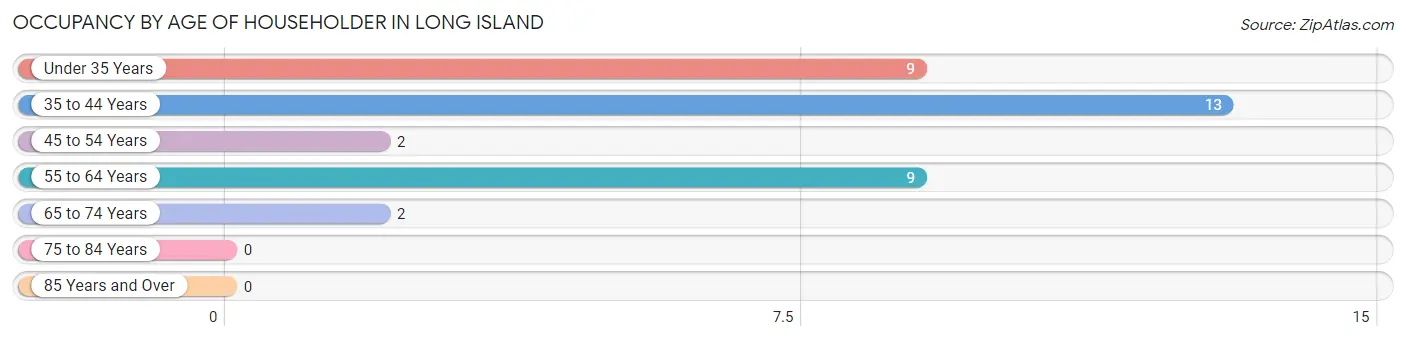
| Age Bracket | # Households | % Households |
| Under 35 Years | 9 | 25.7% |
| 35 to 44 Years | 13 | 37.1% |
| 45 to 54 Years | 2 | 5.7% |
| 55 to 64 Years | 9 | 25.7% |
| 65 to 74 Years | 2 | 5.7% |
| 75 to 84 Years | 0 | 0.0% |
| 85 Years and Over | 0 | 0.0% |
| Total | 35 | 100.0% |
Housing Finances in Long Island
Median Income by Occupancy in Long Island
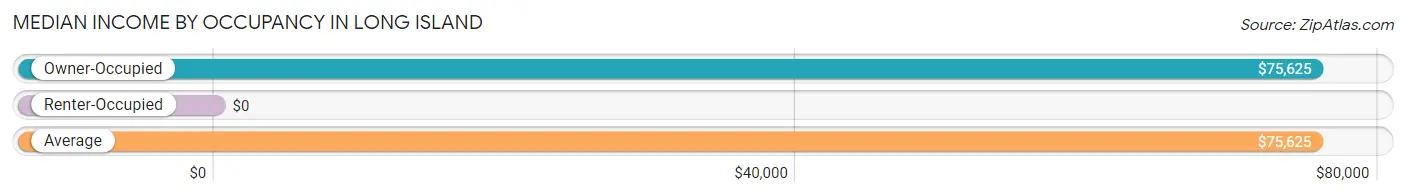
| Occupancy Type | # Households | Median Income |
| Owner-Occupied | 31 (88.6%) | $75,625 |
| Renter-Occupied | 4 (11.4%) | $0 |
| Average | 35 (100.0%) | $75,625 |
Occupancy by Householder Income Bracket in Long Island
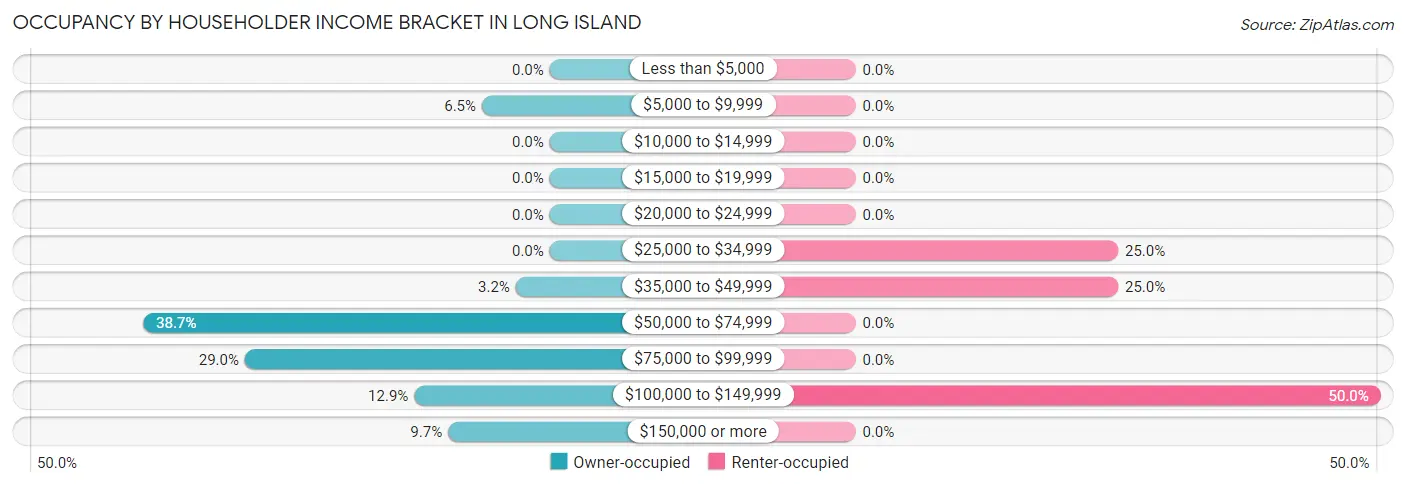
| Income Bracket | Owner-occupied | Renter-occupied |
| Less than $5,000 | 0 (0.0%) | 0 (0.0%) |
| $5,000 to $9,999 | 2 (6.5%) | 0 (0.0%) |
| $10,000 to $14,999 | 0 (0.0%) | 0 (0.0%) |
| $15,000 to $19,999 | 0 (0.0%) | 0 (0.0%) |
| $20,000 to $24,999 | 0 (0.0%) | 0 (0.0%) |
| $25,000 to $34,999 | 0 (0.0%) | 1 (25.0%) |
| $35,000 to $49,999 | 1 (3.2%) | 1 (25.0%) |
| $50,000 to $74,999 | 12 (38.7%) | 0 (0.0%) |
| $75,000 to $99,999 | 9 (29.0%) | 0 (0.0%) |
| $100,000 to $149,999 | 4 (12.9%) | 2 (50.0%) |
| $150,000 or more | 3 (9.7%) | 0 (0.0%) |
| Total | 31 (100.0%) | 4 (100.0%) |
Monthly Housing Cost Tiers in Long Island
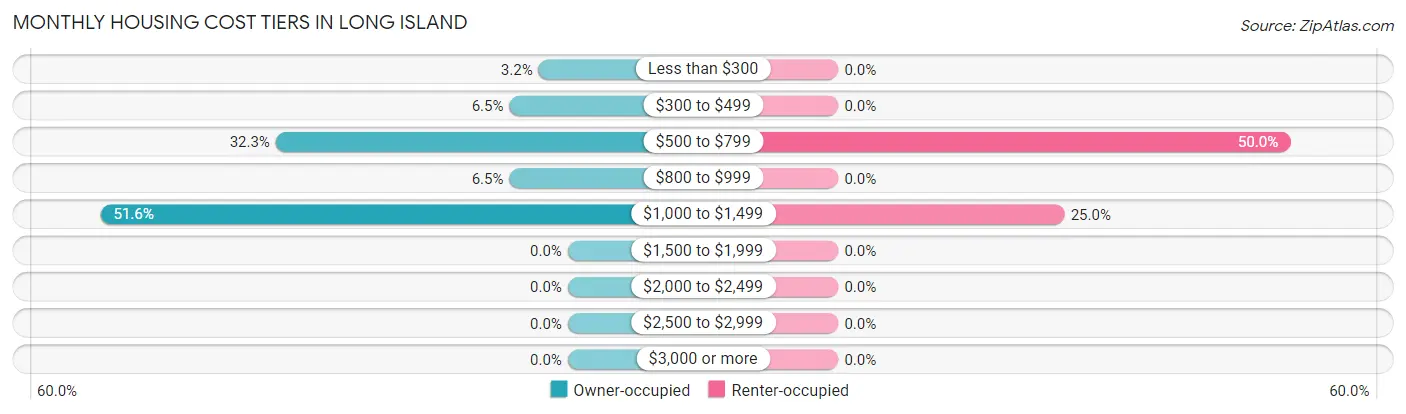
| Monthly Cost | Owner-occupied | Renter-occupied |
| Less than $300 | 1 (3.2%) | 0 (0.0%) |
| $300 to $499 | 2 (6.5%) | 0 (0.0%) |
| $500 to $799 | 10 (32.3%) | 2 (50.0%) |
| $800 to $999 | 2 (6.5%) | 0 (0.0%) |
| $1,000 to $1,499 | 16 (51.6%) | 1 (25.0%) |
| $1,500 to $1,999 | 0 (0.0%) | 0 (0.0%) |
| $2,000 to $2,499 | 0 (0.0%) | 0 (0.0%) |
| $2,500 to $2,999 | 0 (0.0%) | 0 (0.0%) |
| $3,000 or more | 0 (0.0%) | 0 (0.0%) |
| Total | 31 (100.0%) | 4 (100.0%) |
Physical Housing Characteristics in Long Island
Housing Structures in Long Island
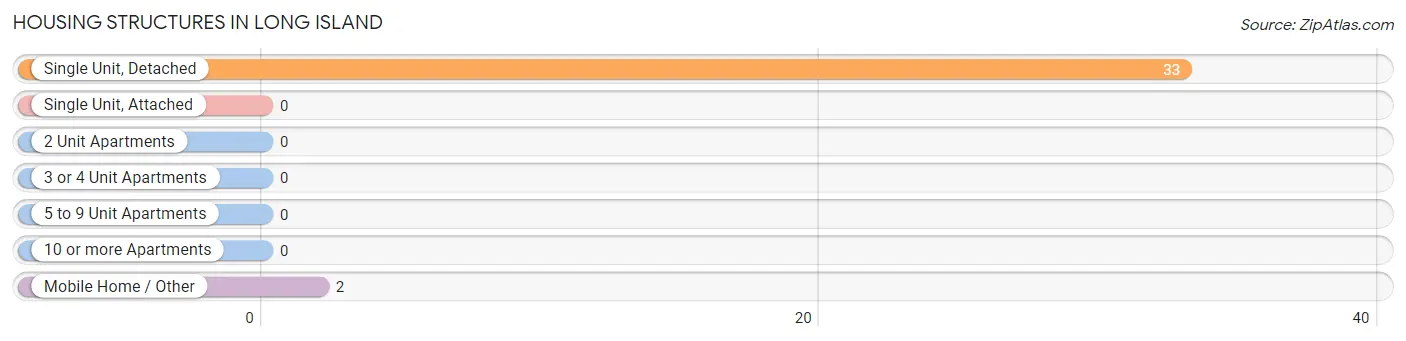
| Structure Type | # Housing Units | % Housing Units |
| Single Unit, Detached | 33 | 94.3% |
| Single Unit, Attached | 0 | 0.0% |
| 2 Unit Apartments | 0 | 0.0% |
| 3 or 4 Unit Apartments | 0 | 0.0% |
| 5 to 9 Unit Apartments | 0 | 0.0% |
| 10 or more Apartments | 0 | 0.0% |
| Mobile Home / Other | 2 | 5.7% |
| Total | 35 | 100.0% |
Housing Structures by Occupancy in Long Island
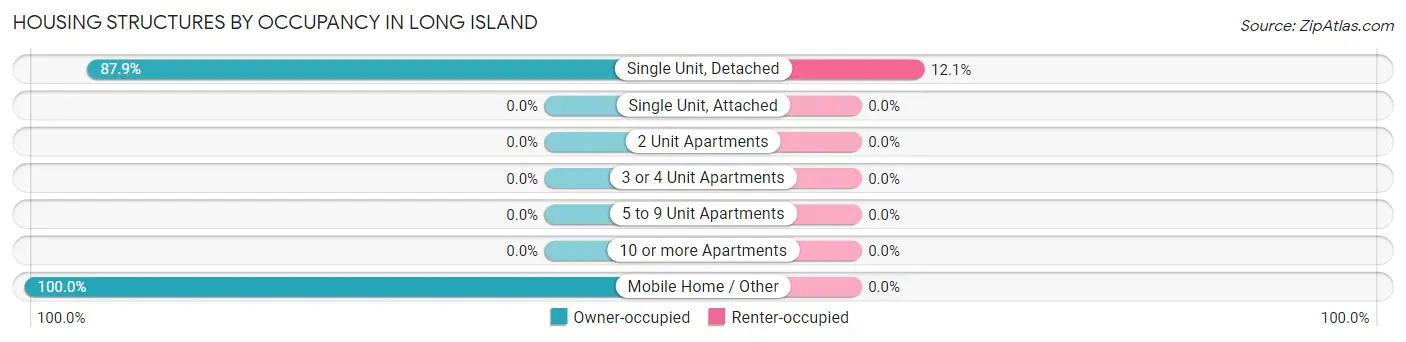
| Structure Type | Owner-occupied | Renter-occupied |
| Single Unit, Detached | 29 (87.9%) | 4 (12.1%) |
| Single Unit, Attached | 0 (0.0%) | 0 (0.0%) |
| 2 Unit Apartments | 0 (0.0%) | 0 (0.0%) |
| 3 or 4 Unit Apartments | 0 (0.0%) | 0 (0.0%) |
| 5 to 9 Unit Apartments | 0 (0.0%) | 0 (0.0%) |
| 10 or more Apartments | 0 (0.0%) | 0 (0.0%) |
| Mobile Home / Other | 2 (100.0%) | 0 (0.0%) |
| Total | 31 (88.6%) | 4 (11.4%) |
Housing Structures by Number of Rooms in Long Island
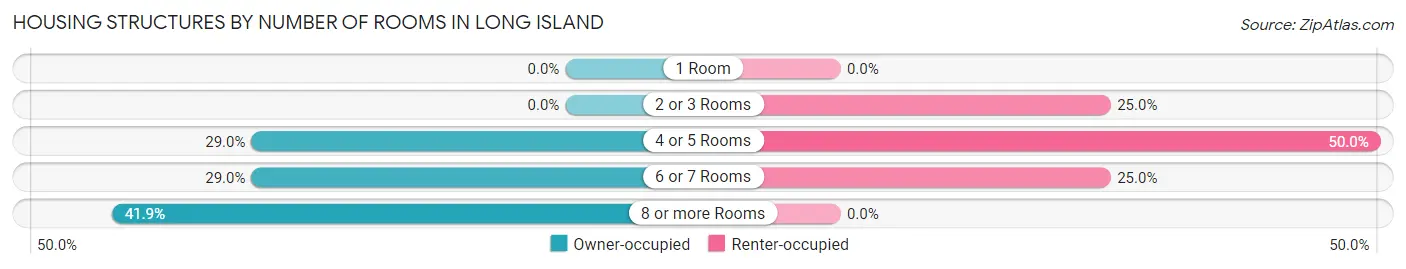
| Number of Rooms | Owner-occupied | Renter-occupied |
| 1 Room | 0 (0.0%) | 0 (0.0%) |
| 2 or 3 Rooms | 0 (0.0%) | 1 (25.0%) |
| 4 or 5 Rooms | 9 (29.0%) | 2 (50.0%) |
| 6 or 7 Rooms | 9 (29.0%) | 1 (25.0%) |
| 8 or more Rooms | 13 (41.9%) | 0 (0.0%) |
| Total | 31 (100.0%) | 4 (100.0%) |
Housing Structure by Heating Type in Long Island
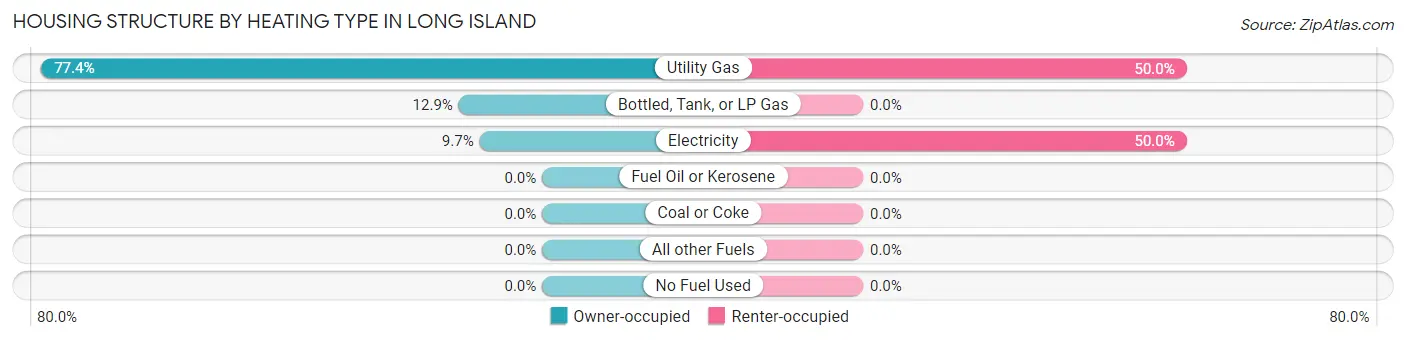
| Heating Type | Owner-occupied | Renter-occupied |
| Utility Gas | 24 (77.4%) | 2 (50.0%) |
| Bottled, Tank, or LP Gas | 4 (12.9%) | 0 (0.0%) |
| Electricity | 3 (9.7%) | 2 (50.0%) |
| Fuel Oil or Kerosene | 0 (0.0%) | 0 (0.0%) |
| Coal or Coke | 0 (0.0%) | 0 (0.0%) |
| All other Fuels | 0 (0.0%) | 0 (0.0%) |
| No Fuel Used | 0 (0.0%) | 0 (0.0%) |
| Total | 31 (100.0%) | 4 (100.0%) |
Household Vehicle Usage in Long Island
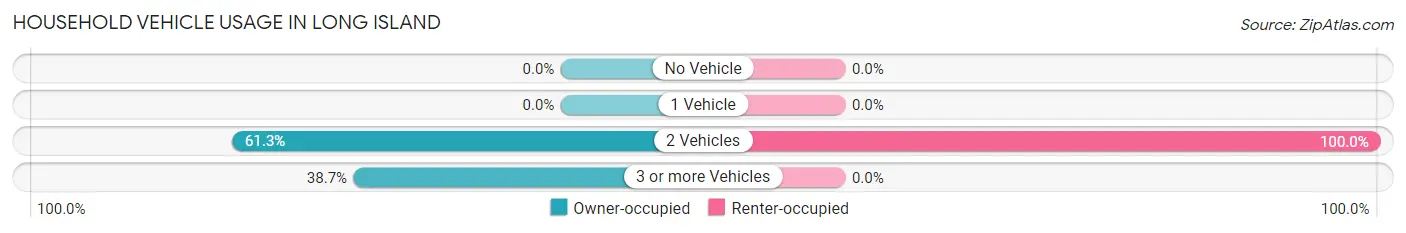
| Vehicles per Household | Owner-occupied | Renter-occupied |
| No Vehicle | 0 (0.0%) | 0 (0.0%) |
| 1 Vehicle | 0 (0.0%) | 0 (0.0%) |
| 2 Vehicles | 19 (61.3%) | 4 (100.0%) |
| 3 or more Vehicles | 12 (38.7%) | 0 (0.0%) |
| Total | 31 (100.0%) | 4 (100.0%) |
Real Estate & Mortgages in Long Island
Real Estate and Mortgage Overview in Long Island
| Characteristic | Without Mortgage | With Mortgage |
| Housing Units | 9 | 22 |
| Median Property Value | $128,100 | $103,600 |
| Median Household Income | $97,813 | $2 |
| Monthly Housing Costs | $538 | $0 |
| Real Estate Taxes | $1,563 | $0 |
Property Value by Mortgage Status in Long Island
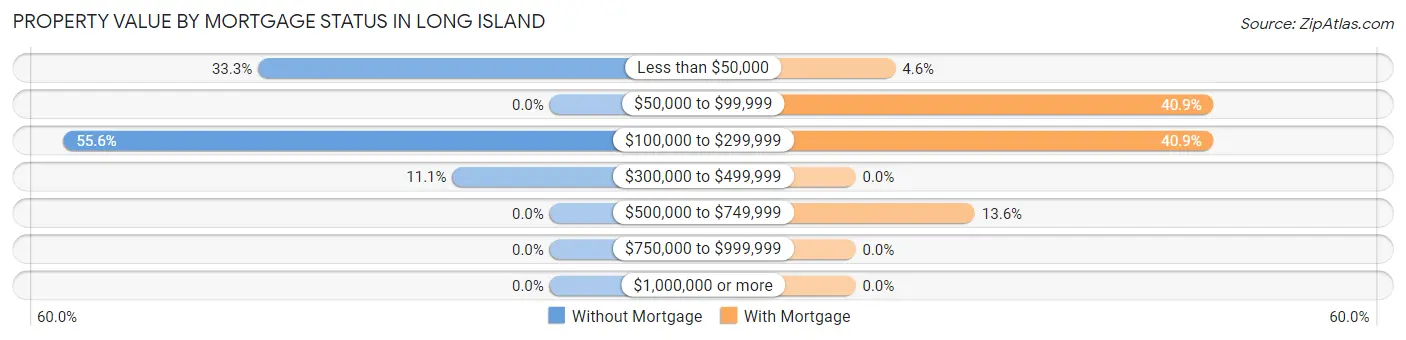
| Property Value | Without Mortgage | With Mortgage |
| Less than $50,000 | 3 (33.3%) | 1 (4.5%) |
| $50,000 to $99,999 | 0 (0.0%) | 9 (40.9%) |
| $100,000 to $299,999 | 5 (55.6%) | 9 (40.9%) |
| $300,000 to $499,999 | 1 (11.1%) | 0 (0.0%) |
| $500,000 to $749,999 | 0 (0.0%) | 3 (13.6%) |
| $750,000 to $999,999 | 0 (0.0%) | 0 (0.0%) |
| $1,000,000 or more | 0 (0.0%) | 0 (0.0%) |
| Total | 9 (100.0%) | 22 (100.0%) |
Household Income by Mortgage Status in Long Island
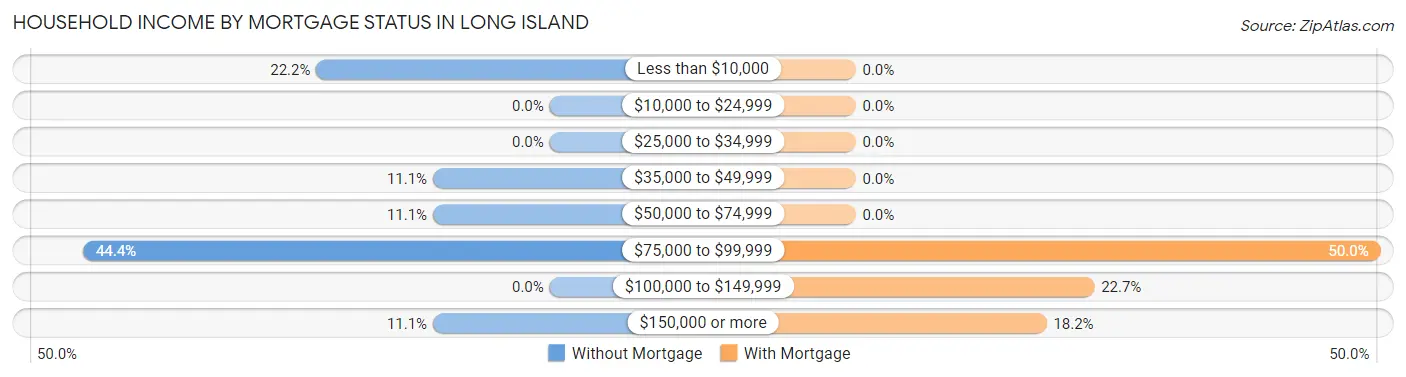
| Household Income | Without Mortgage | With Mortgage |
| Less than $10,000 | 2 (22.2%) | 0 (0.0%) |
| $10,000 to $24,999 | 0 (0.0%) | 0 (0.0%) |
| $25,000 to $34,999 | 0 (0.0%) | 0 (0.0%) |
| $35,000 to $49,999 | 1 (11.1%) | 0 (0.0%) |
| $50,000 to $74,999 | 1 (11.1%) | 0 (0.0%) |
| $75,000 to $99,999 | 4 (44.4%) | 11 (50.0%) |
| $100,000 to $149,999 | 0 (0.0%) | 5 (22.7%) |
| $150,000 or more | 1 (11.1%) | 4 (18.2%) |
| Total | 9 (100.0%) | 22 (100.0%) |
Property Value to Household Income Ratio in Long Island
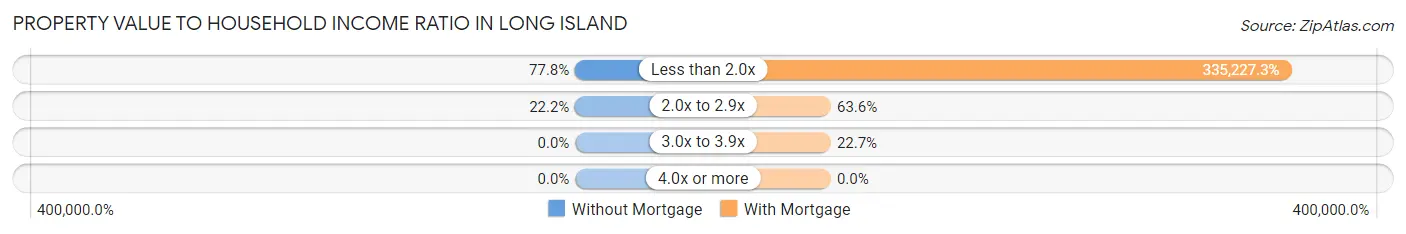
| Value-to-Income Ratio | Without Mortgage | With Mortgage |
| Less than 2.0x | 7 (77.8%) | 73,750 (335,227.3%) |
| 2.0x to 2.9x | 2 (22.2%) | 14 (63.6%) |
| 3.0x to 3.9x | 0 (0.0%) | 5 (22.7%) |
| 4.0x or more | 0 (0.0%) | 0 (0.0%) |
| Total | 9 (100.0%) | 22 (100.0%) |
Real Estate Taxes by Mortgage Status in Long Island
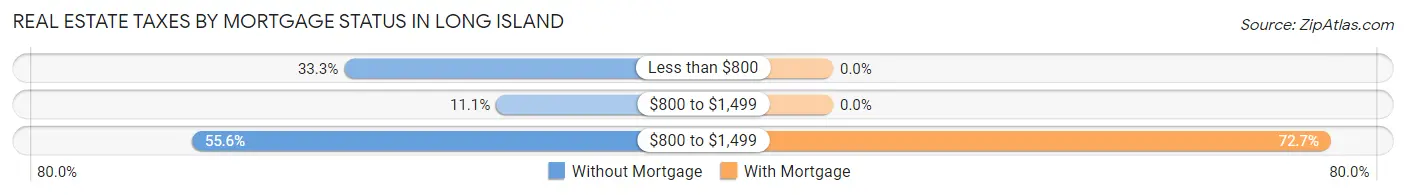
| Property Taxes | Without Mortgage | With Mortgage |
| Less than $800 | 3 (33.3%) | 0 (0.0%) |
| $800 to $1,499 | 1 (11.1%) | 0 (0.0%) |
| $800 to $1,499 | 5 (55.6%) | 16 (72.7%) |
| Total | 9 (100.0%) | 22 (100.0%) |
Health & Disability in Long Island
Health Insurance Coverage by Age in Long Island
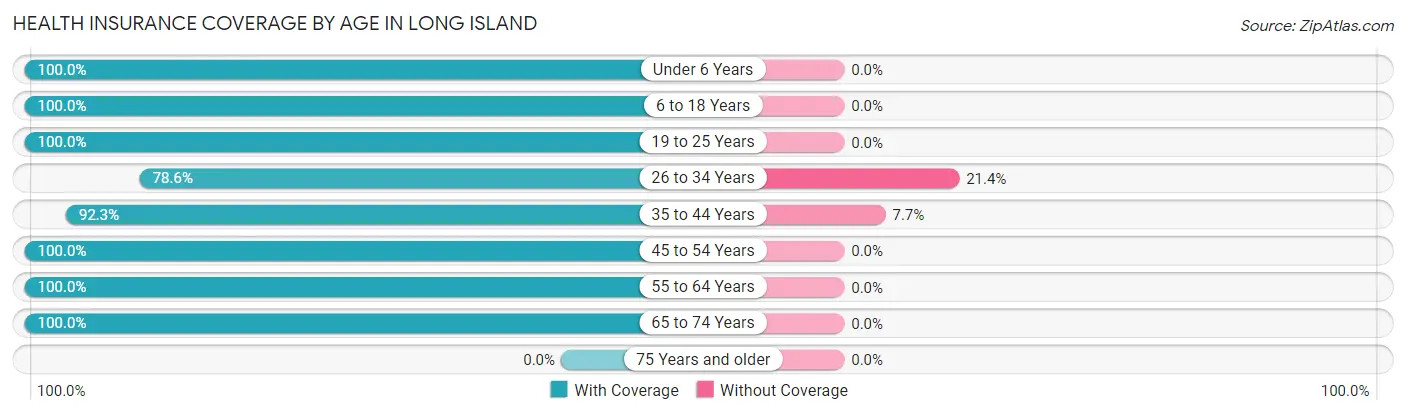
| Age Bracket | With Coverage | Without Coverage |
| Under 6 Years | 29 (100.0%) | 0 (0.0%) |
| 6 to 18 Years | 36 (100.0%) | 0 (0.0%) |
| 19 to 25 Years | 3 (100.0%) | 0 (0.0%) |
| 26 to 34 Years | 11 (78.6%) | 3 (21.4%) |
| 35 to 44 Years | 24 (92.3%) | 2 (7.7%) |
| 45 to 54 Years | 2 (100.0%) | 0 (0.0%) |
| 55 to 64 Years | 16 (100.0%) | 0 (0.0%) |
| 65 to 74 Years | 8 (100.0%) | 0 (0.0%) |
| 75 Years and older | 0 (0.0%) | 0 (0.0%) |
| Total | 129 (96.3%) | 5 (3.7%) |
Health Insurance Coverage by Citizenship Status in Long Island
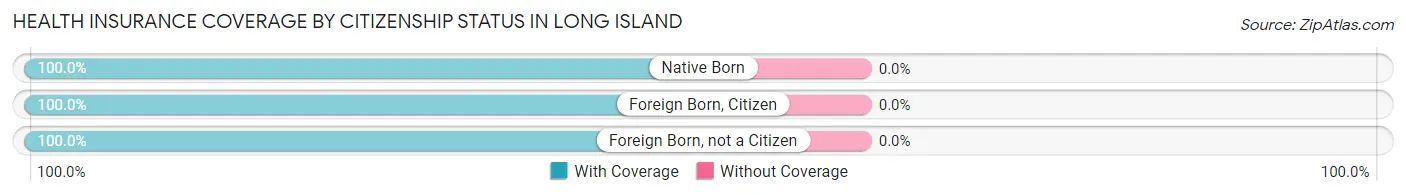
| Citizenship Status | With Coverage | Without Coverage |
| Native Born | 29 (100.0%) | 0 (0.0%) |
| Foreign Born, Citizen | 36 (100.0%) | 0 (0.0%) |
| Foreign Born, not a Citizen | 3 (100.0%) | 0 (0.0%) |
Health Insurance Coverage by Household Income in Long Island
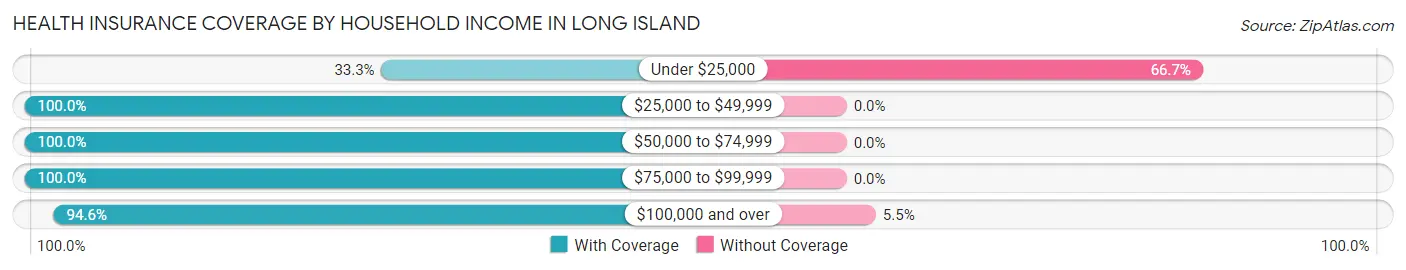
| Household Income | With Coverage | Without Coverage |
| Under $25,000 | 1 (33.3%) | 2 (66.7%) |
| $25,000 to $49,999 | 6 (100.0%) | 0 (0.0%) |
| $50,000 to $74,999 | 33 (100.0%) | 0 (0.0%) |
| $75,000 to $99,999 | 37 (100.0%) | 0 (0.0%) |
| $100,000 and over | 52 (94.6%) | 3 (5.4%) |
Public vs Private Health Insurance Coverage by Age in Long Island
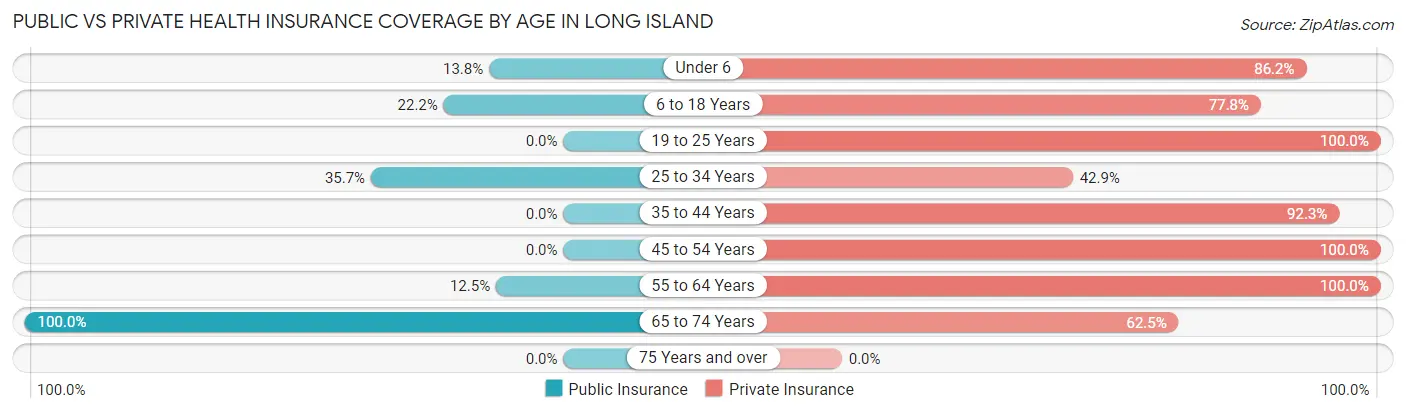
| Age Bracket | Public Insurance | Private Insurance |
| Under 6 | 4 (13.8%) | 25 (86.2%) |
| 6 to 18 Years | 8 (22.2%) | 28 (77.8%) |
| 19 to 25 Years | 0 (0.0%) | 3 (100.0%) |
| 25 to 34 Years | 5 (35.7%) | 6 (42.9%) |
| 35 to 44 Years | 0 (0.0%) | 24 (92.3%) |
| 45 to 54 Years | 0 (0.0%) | 2 (100.0%) |
| 55 to 64 Years | 2 (12.5%) | 16 (100.0%) |
| 65 to 74 Years | 8 (100.0%) | 5 (62.5%) |
| 75 Years and over | 0 (0.0%) | 0 (0.0%) |
| Total | 27 (20.2%) | 109 (81.3%) |
Disability Status by Sex by Age in Long Island
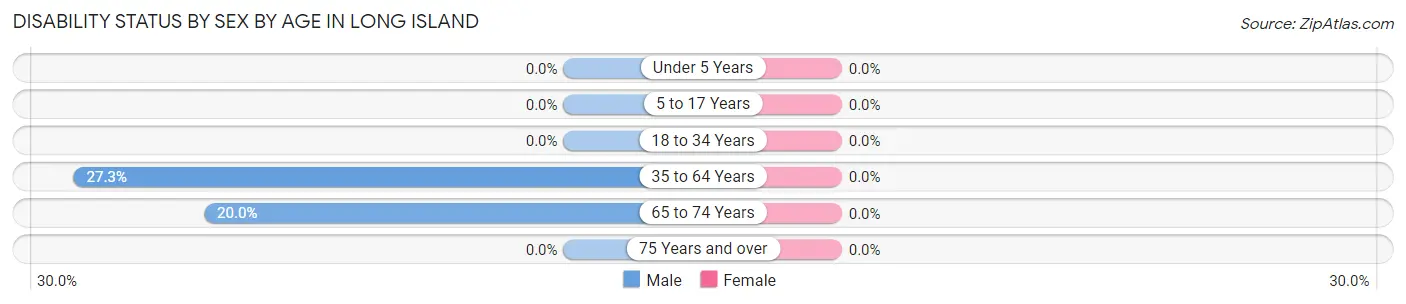
| Age Bracket | Male | Female |
| Under 5 Years | 0 (0.0%) | 0 (0.0%) |
| 5 to 17 Years | 0 (0.0%) | 0 (0.0%) |
| 18 to 34 Years | 0 (0.0%) | 0 (0.0%) |
| 35 to 64 Years | 6 (27.3%) | 0 (0.0%) |
| 65 to 74 Years | 1 (20.0%) | 0 (0.0%) |
| 75 Years and over | 0 (0.0%) | 0 (0.0%) |
Disability Class by Sex by Age in Long Island
Disability Class: Hearing Difficulty
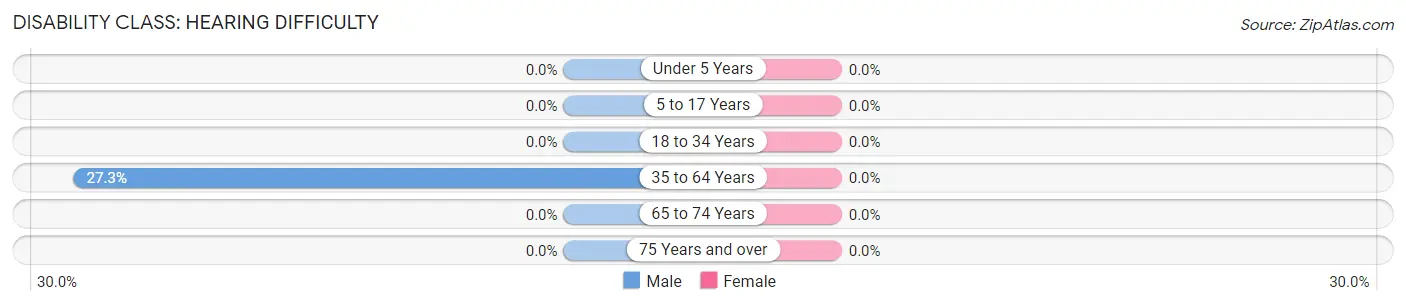
| Age Bracket | Male | Female |
| Under 5 Years | 0 (0.0%) | 0 (0.0%) |
| 5 to 17 Years | 0 (0.0%) | 0 (0.0%) |
| 18 to 34 Years | 0 (0.0%) | 0 (0.0%) |
| 35 to 64 Years | 6 (27.3%) | 0 (0.0%) |
| 65 to 74 Years | 0 (0.0%) | 0 (0.0%) |
| 75 Years and over | 0 (0.0%) | 0 (0.0%) |
Disability Class: Vision Difficulty
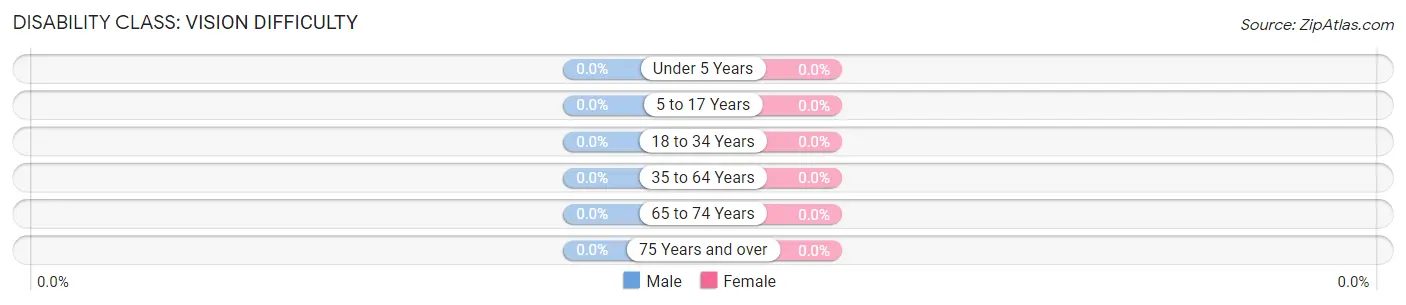
| Age Bracket | Male | Female |
| Under 5 Years | 0 (0.0%) | 0 (0.0%) |
| 5 to 17 Years | 0 (0.0%) | 0 (0.0%) |
| 18 to 34 Years | 0 (0.0%) | 0 (0.0%) |
| 35 to 64 Years | 0 (0.0%) | 0 (0.0%) |
| 65 to 74 Years | 0 (0.0%) | 0 (0.0%) |
| 75 Years and over | 0 (0.0%) | 0 (0.0%) |
Disability Class: Cognitive Difficulty

| Age Bracket | Male | Female |
| 5 to 17 Years | 0 (0.0%) | 0 (0.0%) |
| 18 to 34 Years | 0 (0.0%) | 0 (0.0%) |
| 35 to 64 Years | 0 (0.0%) | 0 (0.0%) |
| 65 to 74 Years | 0 (0.0%) | 0 (0.0%) |
| 75 Years and over | 0 (0.0%) | 0 (0.0%) |
Disability Class: Ambulatory Difficulty
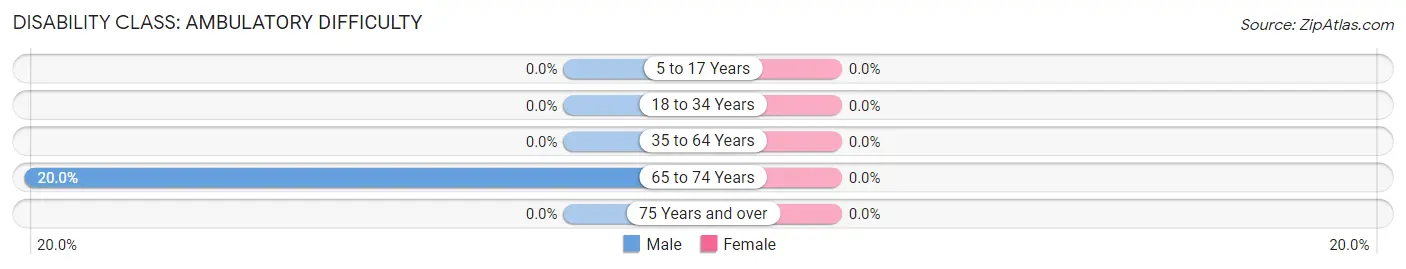
| Age Bracket | Male | Female |
| 5 to 17 Years | 0 (0.0%) | 0 (0.0%) |
| 18 to 34 Years | 0 (0.0%) | 0 (0.0%) |
| 35 to 64 Years | 0 (0.0%) | 0 (0.0%) |
| 65 to 74 Years | 1 (20.0%) | 0 (0.0%) |
| 75 Years and over | 0 (0.0%) | 0 (0.0%) |
Disability Class: Self-Care Difficulty
| Age Bracket | Male | Female |
| 5 to 17 Years | 0 (0.0%) | 0 (0.0%) |
| 18 to 34 Years | 0 (0.0%) | 0 (0.0%) |
| 35 to 64 Years | 0 (0.0%) | 0 (0.0%) |
| 65 to 74 Years | 0 (0.0%) | 0 (0.0%) |
| 75 Years and over | 0 (0.0%) | 0 (0.0%) |
Technology Access in Long Island
Computing Device Access in Long Island
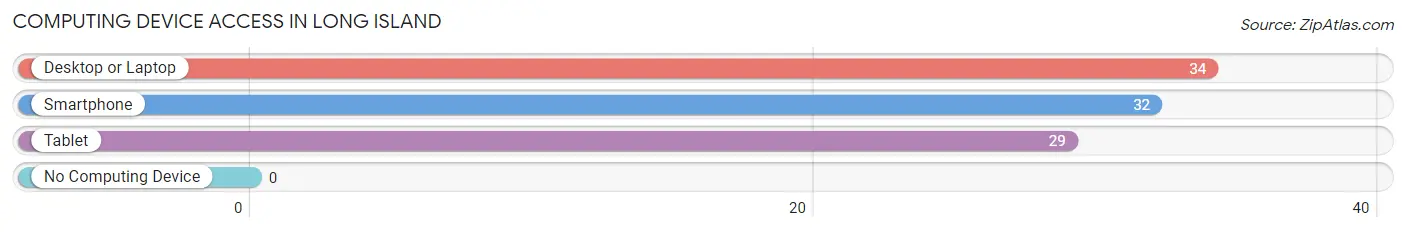
| Device Type | # Households | % Households |
| Desktop or Laptop | 34 | 97.1% |
| Smartphone | 32 | 91.4% |
| Tablet | 29 | 82.9% |
| No Computing Device | 0 | 0.0% |
| Total | 35 | 100.0% |
Internet Access in Long Island
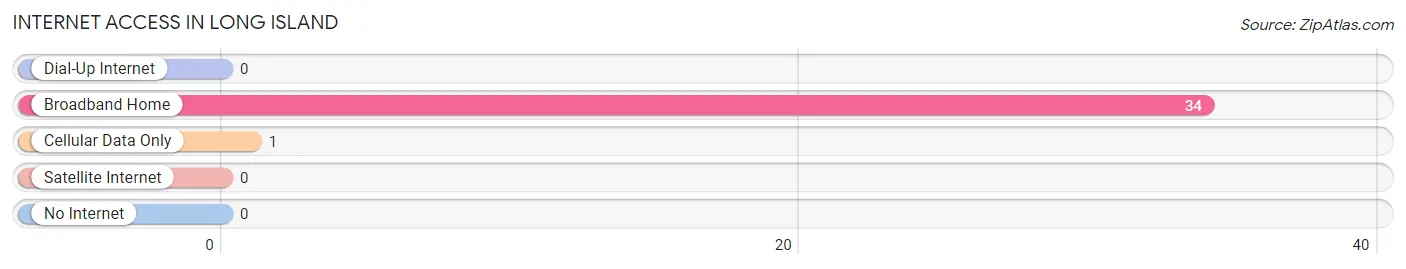
| Internet Type | # Households | % Households |
| Dial-Up Internet | 0 | 0.0% |
| Broadband Home | 34 | 97.1% |
| Cellular Data Only | 1 | 2.9% |
| Satellite Internet | 0 | 0.0% |
| No Internet | 0 | 0.0% |
| Total | 35 | 100.0% |
Long Island Summary
Long Island is a small island located in the Atlantic Ocean off the coast of New York City. It is the largest and most populated island in the contiguous United States, and is home to nearly three million people. Long Island is divided into four counties: Nassau, Suffolk, Queens, and Kings. It is a popular tourist destination, and is home to many of the world’s most famous beaches, including Jones Beach, Fire Island, and Long Beach.
Geography
Long Island is approximately 118 miles long and 23 miles wide at its widest point. It is bordered by the Atlantic Ocean to the south, the Long Island Sound to the north, and the East River to the west. The island is divided into two distinct regions: the North Shore and the South Shore. The North Shore is characterized by its rocky coastline, while the South Shore is known for its sandy beaches. The highest point on the island is Jayne’s Hill, which is located in Suffolk County and is 400 feet above sea level.
Economy
Long Island has a diverse economy that is largely driven by tourism, finance, and technology. The island is home to several major financial institutions, including Citigroup, Goldman Sachs, and Morgan Stanley. It is also home to several major technology companies, such as CA Technologies, Canon USA, and Microsoft. Tourism is a major industry on the island, with millions of visitors coming to enjoy its beaches, parks, and attractions each year.
Demographics
As of the 2010 census, Long Island had a population of 7,568,304. The population is largely composed of white (63.2%), African American (14.3%), Hispanic (13.3%), and Asian (7.2%) residents. The median household income is $90,735, and the median age is 40. The island is home to a large number of immigrants, with nearly one-third of the population being foreign-born.
Long Island is a vibrant and diverse region that is home to millions of people. It is a popular tourist destination, and is home to many of the world’s most famous beaches, financial institutions, and technology companies. The island’s economy is largely driven by tourism, finance, and technology, and its population is largely composed of white, African American, Hispanic, and Asian residents. Long Island is a unique and vibrant region that is sure to continue to be a popular destination for years to come.
Common Questions
What is Per Capita Income in Long Island?
Per Capita income in Long Island is $26,669.
What is the Median Family Income in Long Island?
Median Family Income in Long Island is $76,250.
What is the Median Household income in Long Island?
Median Household Income in Long Island is $75,625.
What is Income or Wage Gap in Long Island?
Income or Wage Gap in Long Island is 50.3%.
Women in Long Island earn 49.7 cents for every dollar earned by a man.
What is Inequality or Gini Index in Long Island?
Inequality or Gini Index in Long Island is 0.39.
What is the Total Population of Long Island?
Total Population of Long Island is 134.
What is the Total Male Population of Long Island?
Total Male Population of Long Island is 63.
What is the Total Female Population of Long Island?
Total Female Population of Long Island is 71.
What is the Ratio of Males per 100 Females in Long Island?
There are 88.73 Males per 100 Females in Long Island.
What is the Ratio of Females per 100 Males in Long Island?
There are 112.70 Females per 100 Males in Long Island.
What is the Median Population Age in Long Island?
Median Population Age in Long Island is 24.5 Years.
What is the Average Family Size in Long Island
Average Family Size in Long Island is 4.1 People.
What is the Average Household Size in Long Island
Average Household Size in Long Island is 3.8 People.
How Large is the Labor Force in Long Island?
There are 61 People in the Labor Forcein in Long Island.
What is the Percentage of People in the Labor Force in Long Island?
81.3% of People are in the Labor Force in Long Island.
What is the Unemployment Rate in Long Island?
Unemployment Rate in Long Island is 3.3%.