Zip Codes with the Highest Percentage of Families with Income Above $200,000 in Kansas
RELATED REPORTS & OPTIONS
Family Income | $200k+
Kansas
Compare Zip Codes
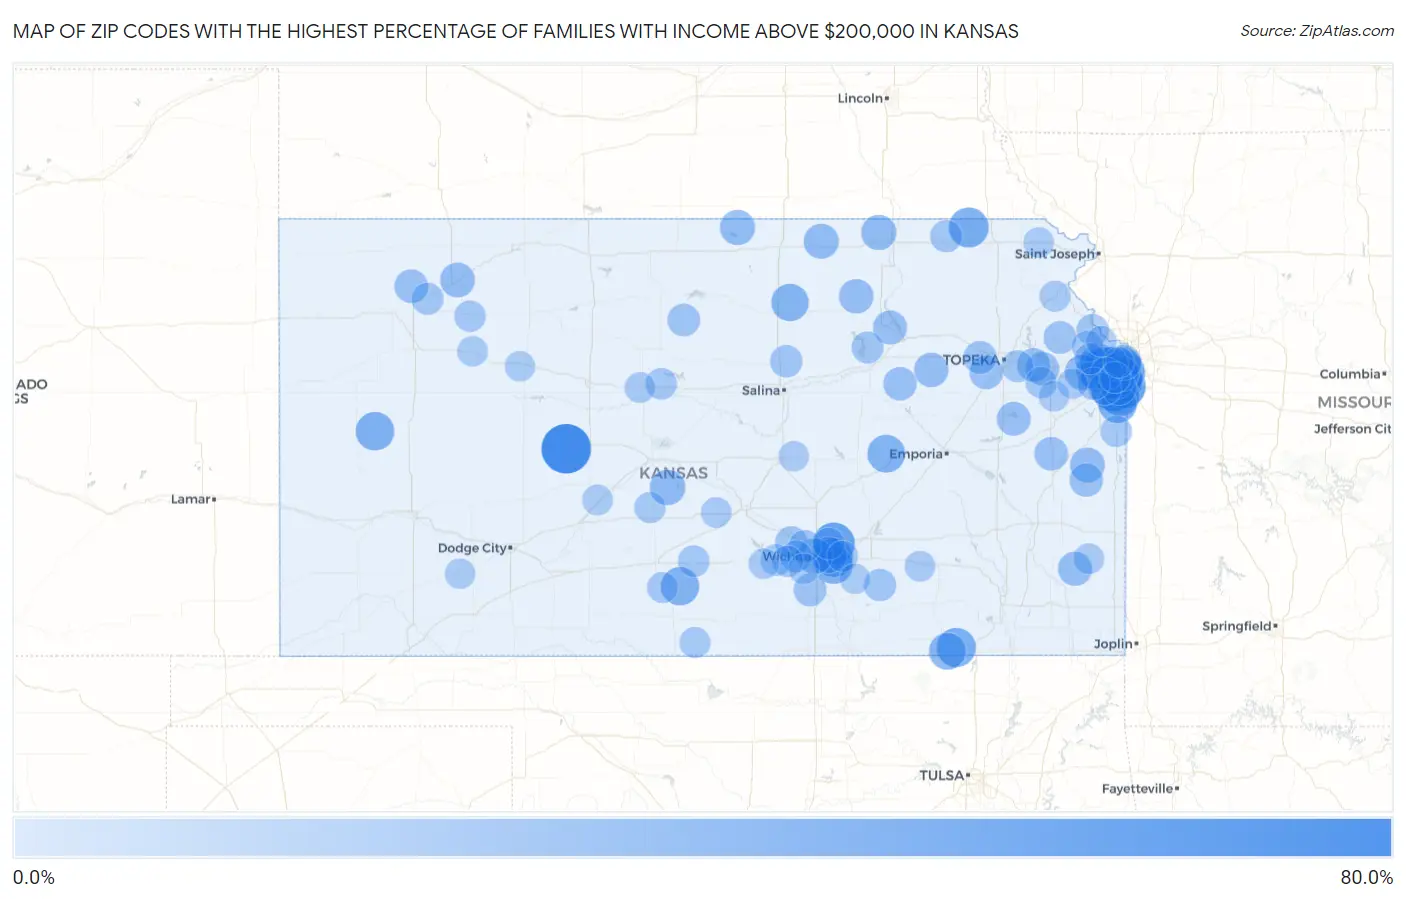
Map of Zip Codes with the Highest Percentage of Families with Income Above $200,000 in Kansas
0.0%
80.0%
Zip Codes with the Highest Percentage of Families with Income Above $200,000 in Kansas
| Zip Code | Families with Income > $200k | vs State | vs National | |
| 1. | 67513 | 71.4% | 11.1%(+60.3)#1 | 14.8%(+56.6)#107 |
| 2. | 66221 | 57.8% | 11.1%(+46.7)#2 | 14.8%(+43.0)#355 |
| 3. | 66224 | 53.3% | 11.1%(+42.2)#3 | 14.8%(+38.5)#521 |
| 4. | 66206 | 48.7% | 11.1%(+37.6)#4 | 14.8%(+33.9)#727 |
| 5. | 67228 | 48.6% | 11.1%(+37.5)#5 | 14.8%(+33.8)#734 |
| 6. | 66220 | 45.3% | 11.1%(+34.2)#6 | 14.8%(+30.5)#923 |
| 7. | 66209 | 45.2% | 11.1%(+34.1)#7 | 14.8%(+30.4)#926 |
| 8. | 66211 | 43.0% | 11.1%(+31.9)#8 | 14.8%(+28.2)#1,058 |
| 9. | 66408 | 41.0% | 11.1%(+29.9)#9 | 14.8%(+26.2)#1,231 |
| 10. | 67360 | 39.1% | 11.1%(+28.0)#10 | 14.8%(+24.3)#1,407 |
| 11. | 66085 | 38.9% | 11.1%(+27.8)#11 | 14.8%(+24.1)#1,421 |
| 12. | 67230 | 37.5% | 11.1%(+26.4)#12 | 14.8%(+22.7)#1,555 |
| 13. | 66013 | 37.2% | 11.1%(+26.1)#13 | 14.8%(+22.4)#1,584 |
| 14. | 67863 | 37.0% | 11.1%(+25.9)#14 | 14.8%(+22.2)#1,614 |
| 15. | 66208 | 36.4% | 11.1%(+25.3)#15 | 14.8%(+21.6)#1,680 |
| 16. | 67065 | 36.2% | 11.1%(+25.1)#16 | 14.8%(+21.4)#1,715 |
| 17. | 67232 | 35.3% | 11.1%(+24.2)#17 | 14.8%(+20.5)#1,811 |
| 18. | 66850 | 34.4% | 11.1%(+23.3)#18 | 14.8%(+19.6)#1,921 |
| 19. | 66227 | 34.1% | 11.1%(+23.0)#19 | 14.8%(+19.3)#1,951 |
| 20. | 67417 | 33.3% | 11.1%(+22.2)#20 | 14.8%(+18.5)#2,072 |
| 21. | 66226 | 33.2% | 11.1%(+22.1)#21 | 14.8%(+18.4)#2,085 |
| 22. | 66213 | 31.8% | 11.1%(+20.7)#22 | 14.8%(+17.0)#2,253 |
| 23. | 67334 | 31.8% | 11.1%(+20.7)#23 | 14.8%(+17.0)#2,263 |
| 24. | 66217 | 30.3% | 11.1%(+19.2)#24 | 14.8%(+15.5)#2,482 |
| 25. | 66218 | 29.8% | 11.1%(+18.7)#25 | 14.8%(+15.0)#2,547 |
| 26. | 67206 | 29.6% | 11.1%(+18.5)#26 | 14.8%(+14.8)#2,575 |
| 27. | 66018 | 28.0% | 11.1%(+16.9)#27 | 14.8%(+13.2)#2,867 |
| 28. | 67202 | 28.0% | 11.1%(+16.9)#28 | 14.8%(+13.2)#2,871 |
| 29. | 67545 | 27.5% | 11.1%(+16.4)#29 | 14.8%(+12.7)#2,967 |
| 30. | 66207 | 27.4% | 11.1%(+16.3)#30 | 14.8%(+12.6)#2,975 |
| 31. | 66223 | 27.0% | 11.1%(+15.9)#31 | 14.8%(+12.2)#3,045 |
| 32. | 66205 | 27.0% | 11.1%(+15.9)#32 | 14.8%(+12.2)#3,050 |
| 33. | 66970 | 26.7% | 11.1%(+15.6)#33 | 14.8%(+11.9)#3,121 |
| 34. | 66412 | 26.4% | 11.1%(+15.3)#34 | 14.8%(+11.6)#3,173 |
| 35. | 66944 | 26.2% | 11.1%(+15.1)#35 | 14.8%(+11.4)#3,209 |
| 36. | 67635 | 25.7% | 11.1%(+14.6)#36 | 14.8%(+10.9)#3,315 |
| 37. | 66072 | 25.6% | 11.1%(+14.5)#37 | 14.8%(+10.8)#3,336 |
| 38. | 67447 | 24.4% | 11.1%(+13.3)#38 | 14.8%(+9.60)#3,635 |
| 39. | 66401 | 24.2% | 11.1%(+13.1)#39 | 14.8%(+9.40)#3,668 |
| 40. | 66780 | 23.6% | 11.1%(+12.5)#40 | 14.8%(+8.80)#3,826 |
| 41. | 66503 | 23.0% | 11.1%(+11.9)#41 | 14.8%(+8.20)#3,948 |
| 42. | 66543 | 22.7% | 11.1%(+11.6)#42 | 14.8%(+7.90)#4,025 |
| 43. | 66216 | 22.5% | 11.1%(+11.4)#43 | 14.8%(+7.70)#4,078 |
| 44. | 66080 | 22.1% | 11.1%(+11.0)#44 | 14.8%(+7.30)#4,199 |
| 45. | 67734 | 22.0% | 11.1%(+10.9)#45 | 14.8%(+7.20)#4,225 |
| 46. | 66610 | 21.8% | 11.1%(+10.7)#46 | 14.8%(+7.00)#4,277 |
| 47. | 66049 | 21.7% | 11.1%(+10.6)#47 | 14.8%(+6.90)#4,296 |
| 48. | 66050 | 21.6% | 11.1%(+10.5)#48 | 14.8%(+6.80)#4,341 |
| 49. | 66014 | 21.4% | 11.1%(+10.3)#49 | 14.8%(+6.60)#4,391 |
| 50. | 66849 | 21.3% | 11.1%(+10.2)#50 | 14.8%(+6.50)#4,422 |
| 51. | 66615 | 20.1% | 11.1%(+9.00)#51 | 14.8%(+5.30)#4,792 |
| 52. | 67120 | 19.4% | 11.1%(+8.30)#52 | 14.8%(+4.60)#5,026 |
| 53. | 66219 | 19.1% | 11.1%(+8.00)#53 | 14.8%(+4.30)#5,120 |
| 54. | 66054 | 19.1% | 11.1%(+8.00)#54 | 14.8%(+4.30)#5,126 |
| 55. | 67485 | 19.0% | 11.1%(+7.90)#55 | 14.8%(+4.20)#5,168 |
| 56. | 67030 | 18.7% | 11.1%(+7.60)#56 | 14.8%(+3.90)#5,302 |
| 57. | 66062 | 18.4% | 11.1%(+7.30)#57 | 14.8%(+3.60)#5,398 |
| 58. | 66061 | 18.4% | 11.1%(+7.30)#58 | 14.8%(+3.60)#5,399 |
| 59. | 67205 | 18.2% | 11.1%(+7.10)#59 | 14.8%(+3.40)#5,490 |
| 60. | 67422 | 18.2% | 11.1%(+7.10)#60 | 14.8%(+3.40)#5,503 |
| 61. | 67008 | 18.1% | 11.1%(+7.00)#61 | 14.8%(+3.30)#5,552 |
| 62. | 66404 | 17.5% | 11.1%(+6.40)#62 | 14.8%(+2.70)#5,796 |
| 63. | 66542 | 17.1% | 11.1%(+6.00)#63 | 14.8%(+2.30)#5,961 |
| 64. | 67753 | 17.1% | 11.1%(+6.00)#64 | 14.8%(+2.30)#5,972 |
| 65. | 66514 | 16.9% | 11.1%(+5.80)#65 | 14.8%(+2.10)#6,049 |
| 66. | 66043 | 16.8% | 11.1%(+5.70)#66 | 14.8%(+2.00)#6,080 |
| 67. | 67226 | 16.2% | 11.1%(+5.10)#67 | 14.8%(+1.40)#6,350 |
| 68. | 67235 | 16.0% | 11.1%(+4.90)#68 | 14.8%(+1.20)#6,451 |
| 69. | 67035 | 16.0% | 11.1%(+4.90)#69 | 14.8%(+1.20)#6,475 |
| 70. | 67050 | 15.8% | 11.1%(+4.70)#70 | 14.8%(+1.000)#6,561 |
| 71. | 66053 | 15.6% | 11.1%(+4.50)#71 | 14.8%(+0.800)#6,649 |
| 72. | 67626 | 15.4% | 11.1%(+4.30)#72 | 14.8%(+0.600)#6,773 |
| 73. | 66047 | 15.2% | 11.1%(+4.10)#73 | 14.8%(+0.400)#6,853 |
| 74. | 67052 | 15.2% | 11.1%(+4.10)#74 | 14.8%(+0.400)#6,863 |
| 75. | 67740 | 15.2% | 11.1%(+4.10)#75 | 14.8%(+0.400)#6,885 |
| 76. | 66007 | 14.8% | 11.1%(+3.70)#76 | 14.8%(=0.000)#7,099 |
| 77. | 67576 | 14.8% | 11.1%(+3.70)#77 | 14.8%(=0.000)#7,117 |
| 78. | 66210 | 14.6% | 11.1%(+3.50)#78 | 14.8%(-0.200)#7,212 |
| 79. | 66012 | 14.6% | 11.1%(+3.50)#79 | 14.8%(-0.200)#7,222 |
| 80. | 67002 | 14.1% | 11.1%(+3.00)#80 | 14.8%(-0.700)#7,485 |
| 81. | 67134 | 14.1% | 11.1%(+3.00)#81 | 14.8%(-0.700)#7,514 |
| 82. | 67061 | 14.0% | 11.1%(+2.90)#82 | 14.8%(-0.800)#7,584 |
| 83. | 66016 | 13.9% | 11.1%(+2.80)#83 | 14.8%(-0.900)#7,636 |
| 84. | 66202 | 13.4% | 11.1%(+2.30)#84 | 14.8%(-1.40)#7,928 |
| 85. | 66109 | 13.3% | 11.1%(+2.20)#85 | 14.8%(-1.50)#7,990 |
| 86. | 67529 | 13.3% | 11.1%(+2.20)#86 | 14.8%(-1.50)#8,050 |
| 87. | 66746 | 13.3% | 11.1%(+2.20)#87 | 14.8%(-1.50)#8,057 |
| 88. | 67665 | 13.1% | 11.1%(+2.00)#88 | 14.8%(-1.70)#8,155 |
| 89. | 67510 | 13.1% | 11.1%(+2.00)#89 | 14.8%(-1.70)#8,192 |
| 90. | 66006 | 12.9% | 11.1%(+1.80)#90 | 14.8%(-1.90)#8,310 |
| 91. | 67215 | 12.9% | 11.1%(+1.80)#91 | 14.8%(-1.90)#8,314 |
| 92. | 67122 | 12.9% | 11.1%(+1.80)#92 | 14.8%(-1.90)#8,348 |
| 93. | 67751 | 12.8% | 11.1%(+1.70)#93 | 14.8%(-2.00)#8,409 |
| 94. | 67025 | 12.6% | 11.1%(+1.50)#94 | 14.8%(-2.20)#8,523 |
| 95. | 66532 | 12.6% | 11.1%(+1.50)#95 | 14.8%(-2.20)#8,541 |
| 96. | 66025 | 12.5% | 11.1%(+1.40)#96 | 14.8%(-2.30)#8,587 |
| 97. | 67039 | 12.5% | 11.1%(+1.40)#97 | 14.8%(-2.30)#8,594 |
| 98. | 67443 | 12.3% | 11.1%(+1.20)#98 | 14.8%(-2.50)#8,777 |
| 99. | 67672 | 12.2% | 11.1%(+1.10)#99 | 14.8%(-2.60)#8,848 |
| 100. | 67867 | 12.2% | 11.1%(+1.10)#100 | 14.8%(-2.60)#8,853 |
Common Questions
What are the Top 10 Zip Codes with the Highest Percentage of Families with Income Above $200,000 in Kansas?
Top 10 Zip Codes with the Highest Percentage of Families with Income Above $200,000 in Kansas are:
What zip code has the Highest Percentage of Families with Income Above $200,000 in Kansas?
67513 has the Highest Percentage of Families with Income Above $200,000 in Kansas with 71.4%.
What is the Percentage of Families with Income Above $200,000 in the State of Kansas?
Percentage of Families with Income Above $200,000 in Kansas is 11.1%.
What is the Percentage of Families with Income Above $200,000 in the United States?
Percentage of Families with Income Above $200,000 in the United States is 14.8%.