St Marys, KS Map & Demographics
St Marys Map
St Marys Overview
$28,028
PER CAPITA INCOME
$76,563
AVG FAMILY INCOME
$69,183
AVG HOUSEHOLD INCOME
47.7%
WAGE / INCOME GAP [ % ]
52.3¢/ $1
WAGE / INCOME GAP [ $ ]
0.36
INEQUALITY / GINI INDEX
2,661
TOTAL POPULATION
1,349
MALE POPULATION
1,312
FEMALE POPULATION
102.82
MALES / 100 FEMALES
97.26
FEMALES / 100 MALES
26.4
MEDIAN AGE
3.6
AVG FAMILY SIZE
3.0
AVG HOUSEHOLD SIZE
1,260
LABOR FORCE [ PEOPLE ]
63.9%
PERCENT IN LABOR FORCE
3.1%
UNEMPLOYMENT RATE
Income in St Marys
Income Overview in St Marys
Per Capita Income in St Marys is $28,028, while median incomes of families and households are $76,563 and $69,183 respectively.
| Characteristic | Number | Measure |
| Per Capita Income | 2,661 | $28,028 |
| Median Family Income | 640 | $76,563 |
| Mean Family Income | 640 | $96,183 |
| Median Household Income | 868 | $69,183 |
| Mean Household Income | 868 | $81,985 |
| Income Deficit | 640 | $0 |
| Wage / Income Gap (%) | 2,661 | 47.74% |
| Wage / Income Gap ($) | 2,661 | 52.26¢ per $1 |
| Gini / Inequality Index | 2,661 | 0.36 |
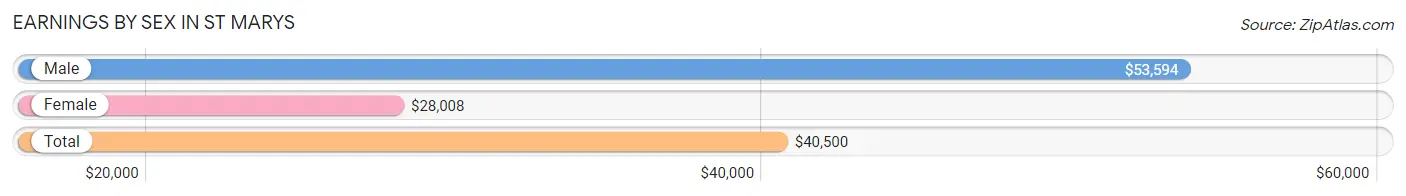
Earnings by Sex in St Marys
Average Earnings in St Marys are $40,500, $53,594 for men and $28,008 for women, a difference of 47.7%.
| Sex | Number | Average Earnings |
| Male | 758 (57.2%) | $53,594 |
| Female | 568 (42.8%) | $28,008 |
| Total | 1,326 (100.0%) | $40,500 |
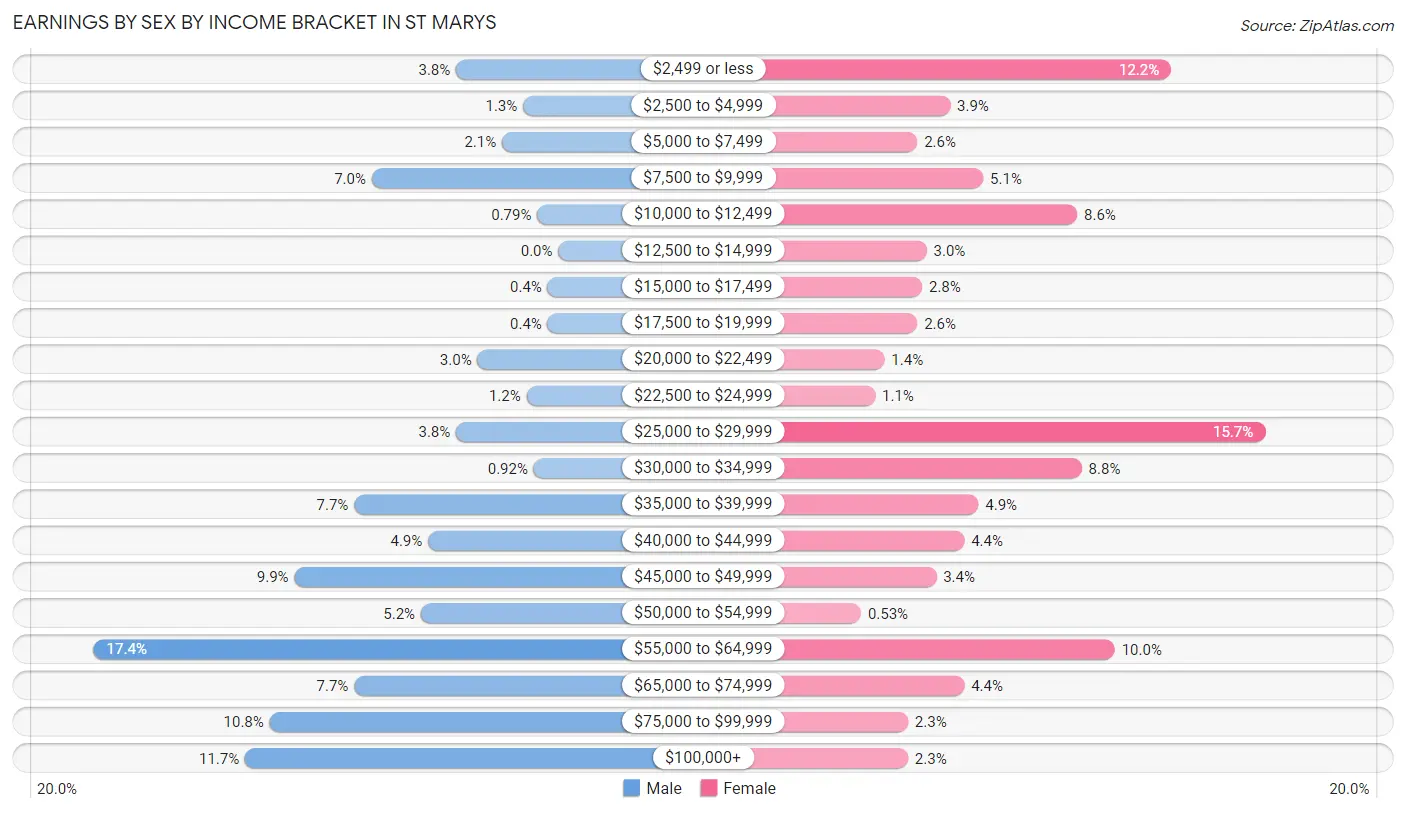
Earnings by Sex by Income Bracket in St Marys
The most common earnings brackets in St Marys are $55,000 to $64,999 for men (132 | 17.4%) and $25,000 to $29,999 for women (89 | 15.7%).
| Income | Male | Female |
| $2,499 or less | 29 (3.8%) | 69 (12.1%) |
| $2,500 to $4,999 | 10 (1.3%) | 22 (3.9%) |
| $5,000 to $7,499 | 16 (2.1%) | 15 (2.6%) |
| $7,500 to $9,999 | 53 (7.0%) | 29 (5.1%) |
| $10,000 to $12,499 | 6 (0.8%) | 49 (8.6%) |
| $12,500 to $14,999 | 0 (0.0%) | 17 (3.0%) |
| $15,000 to $17,499 | 3 (0.4%) | 16 (2.8%) |
| $17,500 to $19,999 | 3 (0.4%) | 15 (2.6%) |
| $20,000 to $22,499 | 23 (3.0%) | 8 (1.4%) |
| $22,500 to $24,999 | 9 (1.2%) | 6 (1.1%) |
| $25,000 to $29,999 | 29 (3.8%) | 89 (15.7%) |
| $30,000 to $34,999 | 7 (0.9%) | 50 (8.8%) |
| $35,000 to $39,999 | 58 (7.6%) | 28 (4.9%) |
| $40,000 to $44,999 | 37 (4.9%) | 25 (4.4%) |
| $45,000 to $49,999 | 75 (9.9%) | 19 (3.4%) |
| $50,000 to $54,999 | 39 (5.1%) | 3 (0.5%) |
| $55,000 to $64,999 | 132 (17.4%) | 57 (10.0%) |
| $65,000 to $74,999 | 58 (7.6%) | 25 (4.4%) |
| $75,000 to $99,999 | 82 (10.8%) | 13 (2.3%) |
| $100,000+ | 89 (11.7%) | 13 (2.3%) |
| Total | 758 (100.0%) | 568 (100.0%) |
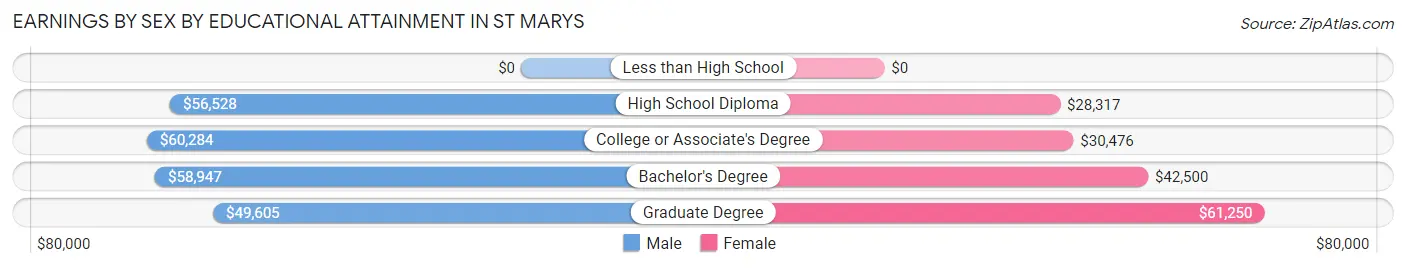
Earnings by Sex by Educational Attainment in St Marys
Average earnings in St Marys are $59,233 for men and $31,318 for women, a difference of 47.1%. Men with an educational attainment of college or associate's degree enjoy the highest average annual earnings of $60,284, while those with graduate degree education earn the least with $49,605. Women with an educational attainment of graduate degree earn the most with the average annual earnings of $61,250, while those with high school diploma education have the smallest earnings of $28,317.
| Educational Attainment | Male Income | Female Income |
| Less than High School | - | - |
| High School Diploma | $56,528 | $28,317 |
| College or Associate's Degree | $60,284 | $30,476 |
| Bachelor's Degree | $58,947 | $42,500 |
| Graduate Degree | $49,605 | $61,250 |
| Total | $59,233 | $31,318 |
Family Income in St Marys
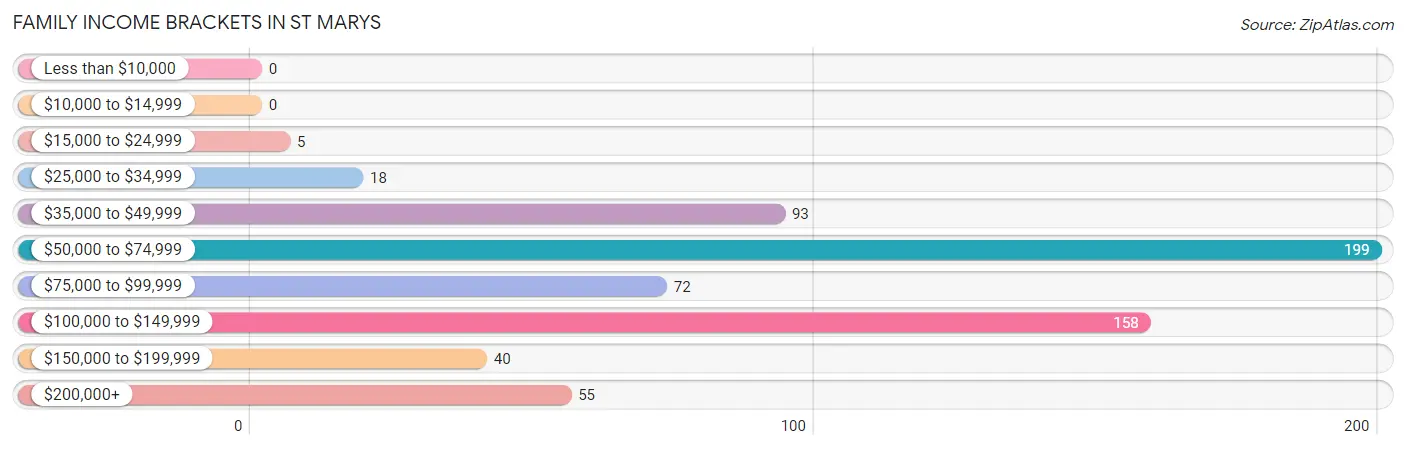
Family Income Brackets in St Marys
According to the St Marys family income data, there are 199 families falling into the $50,000 to $74,999 income range, which is the most common income bracket and makes up 31.1% of all families.
| Income Bracket | # Families | % Families |
| Less than $10,000 | 0 | 0.0% |
| $10,000 to $14,999 | 0 | 0.0% |
| $15,000 to $24,999 | 5 | 0.8% |
| $25,000 to $34,999 | 18 | 2.8% |
| $35,000 to $49,999 | 93 | 14.5% |
| $50,000 to $74,999 | 199 | 31.1% |
| $75,000 to $99,999 | 72 | 11.3% |
| $100,000 to $149,999 | 158 | 24.7% |
| $150,000 to $199,999 | 40 | 6.3% |
| $200,000+ | 55 | 8.6% |
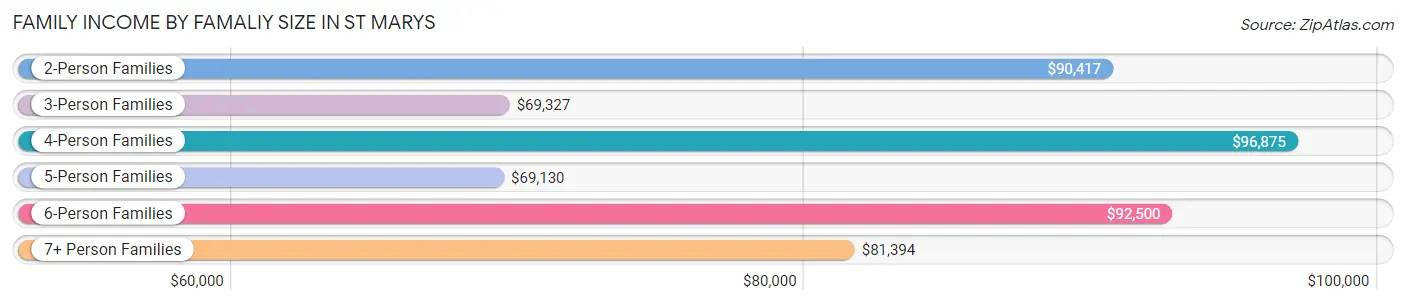
Family Income by Famaliy Size in St Marys
4-person families (72 | 11.3%) account for the highest median family income in St Marys with $96,875 per family, while 2-person families (232 | 36.2%) have the highest median income of $45,208 per family member.
| Income Bracket | # Families | Median Income |
| 2-Person Families | 232 (36.2%) | $90,417 |
| 3-Person Families | 121 (18.9%) | $69,327 |
| 4-Person Families | 72 (11.3%) | $96,875 |
| 5-Person Families | 56 (8.7%) | $69,130 |
| 6-Person Families | 62 (9.7%) | $92,500 |
| 7+ Person Families | 97 (15.2%) | $81,394 |
| Total | 640 (100.0%) | $76,563 |
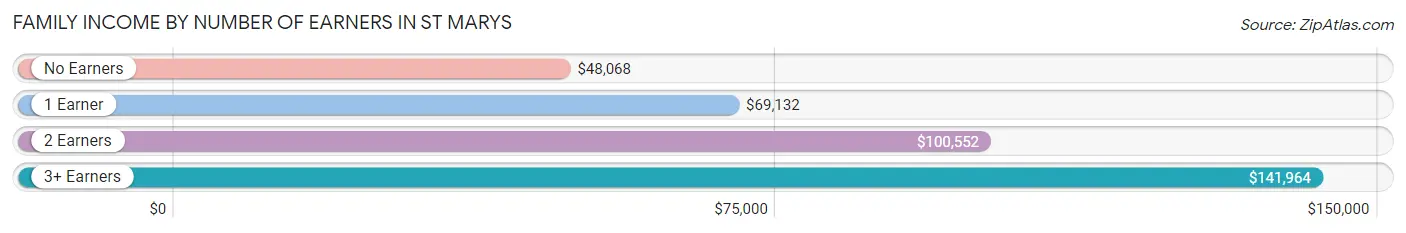
Family Income by Number of Earners in St Marys
The median family income in St Marys is $76,563, with families comprising 3+ earners (77) having the highest median family income of $141,964, while families with no earners (81) have the lowest median family income of $48,068, accounting for 12.0% and 12.7% of families, respectively.
| Number of Earners | # Families | Median Income |
| No Earners | 81 (12.7%) | $48,068 |
| 1 Earner | 209 (32.7%) | $69,132 |
| 2 Earners | 273 (42.7%) | $100,552 |
| 3+ Earners | 77 (12.0%) | $141,964 |
| Total | 640 (100.0%) | $76,563 |
Household Income in St Marys
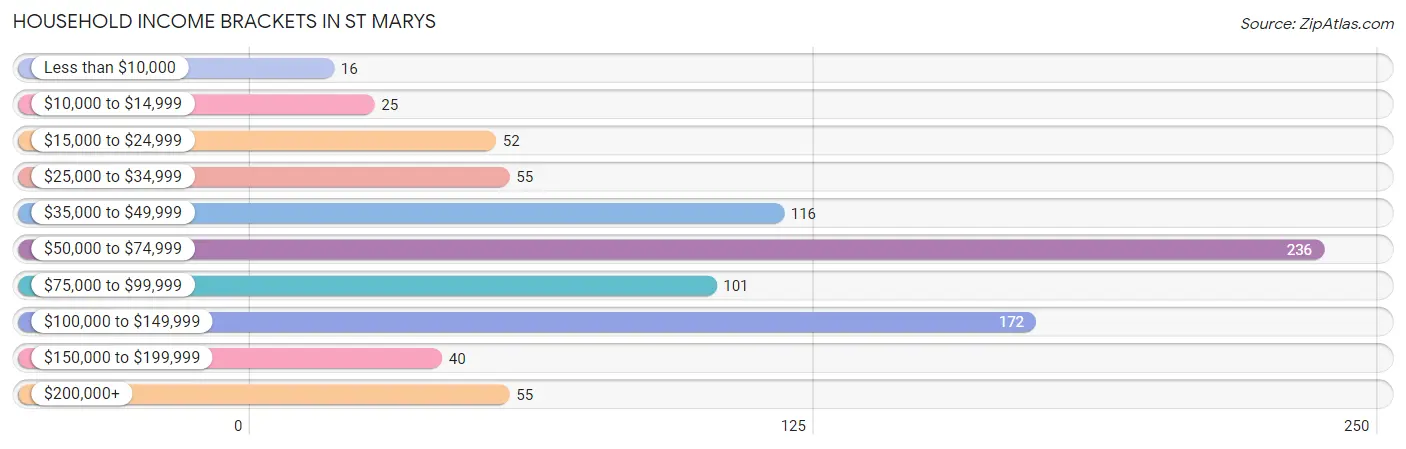
Household Income Brackets in St Marys
With 236 households falling in the category, the $50,000 to $74,999 income range is the most frequent in St Marys, accounting for 27.2% of all households. In contrast, only 16 households (1.8%) fall into the less than $10,000 income bracket, making it the least populous group.
| Income Bracket | # Households | % Households |
| Less than $10,000 | 16 | 1.8% |
| $10,000 to $14,999 | 25 | 2.9% |
| $15,000 to $24,999 | 52 | 6.0% |
| $25,000 to $34,999 | 55 | 6.3% |
| $35,000 to $49,999 | 116 | 13.4% |
| $50,000 to $74,999 | 236 | 27.2% |
| $75,000 to $99,999 | 101 | 11.6% |
| $100,000 to $149,999 | 172 | 19.8% |
| $150,000 to $199,999 | 40 | 4.6% |
| $200,000+ | 55 | 6.3% |
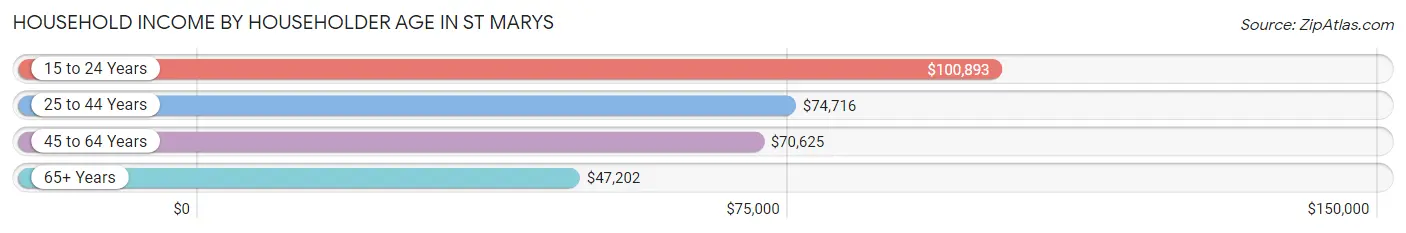
Household Income by Householder Age in St Marys
The median household income in St Marys is $69,183, with the highest median household income of $100,893 found in the 15 to 24 years age bracket for the primary householder. A total of 34 households (3.9%) fall into this category. Meanwhile, the 65+ years age bracket for the primary householder has the lowest median household income of $47,202, with 237 households (27.3%) in this group.
| Income Bracket | # Households | Median Income |
| 15 to 24 Years | 34 (3.9%) | $100,893 |
| 25 to 44 Years | 349 (40.2%) | $74,716 |
| 45 to 64 Years | 248 (28.6%) | $70,625 |
| 65+ Years | 237 (27.3%) | $47,202 |
| Total | 868 (100.0%) | $69,183 |
Poverty in St Marys
Income Below Poverty by Sex and Age in St Marys
With 3.2% poverty level for males and 6.2% for females among the residents of St Marys, 16 and 17 year old males and 12 to 14 year old females are the most vulnerable to poverty, with 5 males (13.2%) and 5 females (15.6%) in their respective age groups living below the poverty level.
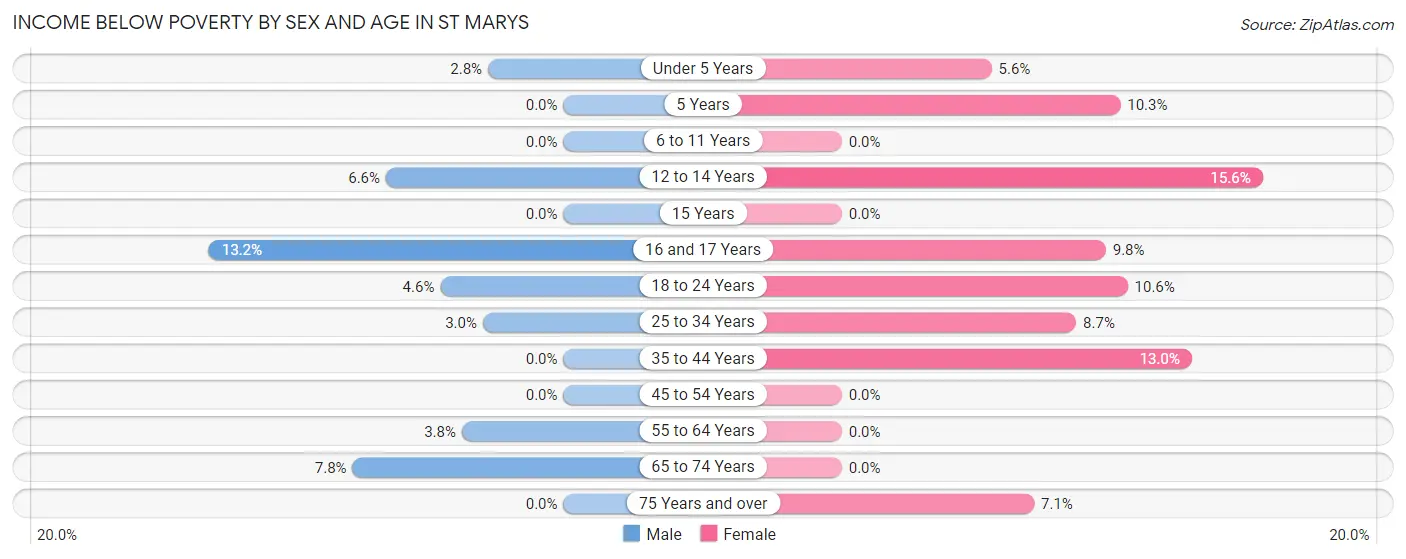
| Age Bracket | Male | Female |
| Under 5 Years | 3 (2.8%) | 7 (5.6%) |
| 5 Years | 0 (0.0%) | 3 (10.3%) |
| 6 to 11 Years | 0 (0.0%) | 0 (0.0%) |
| 12 to 14 Years | 6 (6.6%) | 5 (15.6%) |
| 15 Years | 0 (0.0%) | 0 (0.0%) |
| 16 and 17 Years | 5 (13.2%) | 5 (9.8%) |
| 18 to 24 Years | 8 (4.6%) | 26 (10.6%) |
| 25 to 34 Years | 6 (3.0%) | 20 (8.7%) |
| 35 to 44 Years | 0 (0.0%) | 10 (13.0%) |
| 45 to 54 Years | 0 (0.0%) | 0 (0.0%) |
| 55 to 64 Years | 6 (3.8%) | 0 (0.0%) |
| 65 to 74 Years | 9 (7.8%) | 0 (0.0%) |
| 75 Years and over | 0 (0.0%) | 4 (7.1%) |
| Total | 43 (3.2%) | 80 (6.2%) |
Income Above Poverty by Sex and Age in St Marys
According to the poverty statistics in St Marys, males aged 5 years and females aged 6 to 11 years are the age groups that are most secure financially, with 100.0% of males and 100.0% of females in these age groups living above the poverty line.
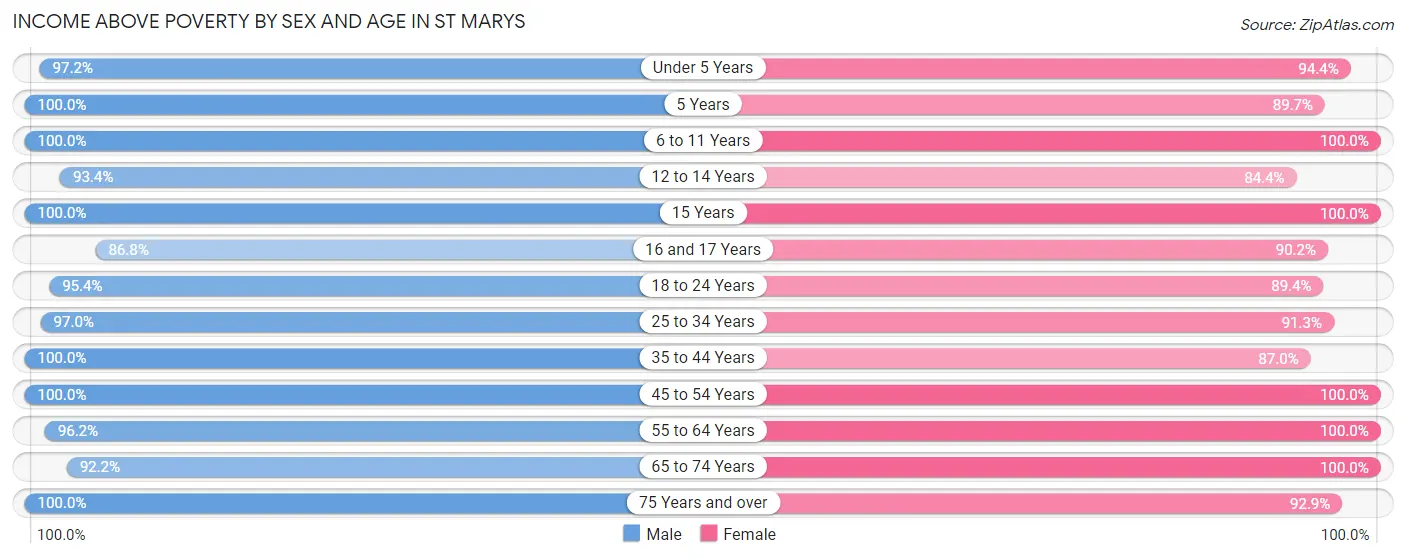
| Age Bracket | Male | Female |
| Under 5 Years | 104 (97.2%) | 119 (94.4%) |
| 5 Years | 43 (100.0%) | 26 (89.7%) |
| 6 to 11 Years | 127 (100.0%) | 94 (100.0%) |
| 12 to 14 Years | 85 (93.4%) | 27 (84.4%) |
| 15 Years | 10 (100.0%) | 22 (100.0%) |
| 16 and 17 Years | 33 (86.8%) | 46 (90.2%) |
| 18 to 24 Years | 167 (95.4%) | 219 (89.4%) |
| 25 to 34 Years | 195 (97.0%) | 210 (91.3%) |
| 35 to 44 Years | 131 (100.0%) | 67 (87.0%) |
| 45 to 54 Years | 56 (100.0%) | 108 (100.0%) |
| 55 to 64 Years | 153 (96.2%) | 108 (100.0%) |
| 65 to 74 Years | 106 (92.2%) | 116 (100.0%) |
| 75 Years and over | 77 (100.0%) | 52 (92.9%) |
| Total | 1,287 (96.8%) | 1,214 (93.8%) |
Income Below Poverty Among Married-Couple Families in St Marys
The poverty statistics for married-couple families in St Marys show that 1.1% or 6 of the total 572 families live below the poverty line. Families with 5 or more children have the highest poverty rate of 7.8%, comprising of 6 families. On the other hand, families with no children have the lowest poverty rate of 0.0%, which includes 0 families.
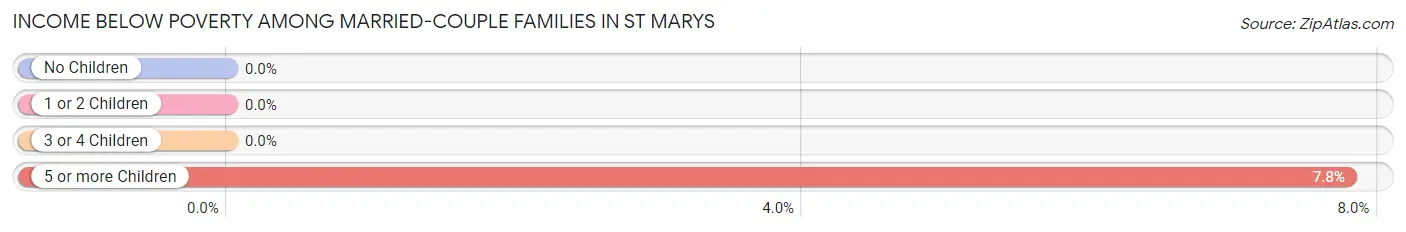
| Children | Above Poverty | Below Poverty |
| No Children | 259 (100.0%) | 0 (0.0%) |
| 1 or 2 Children | 128 (100.0%) | 0 (0.0%) |
| 3 or 4 Children | 108 (100.0%) | 0 (0.0%) |
| 5 or more Children | 71 (92.2%) | 6 (7.8%) |
| Total | 566 (99.0%) | 6 (1.1%) |
Income Below Poverty Among Single-Parent Households in St Marys
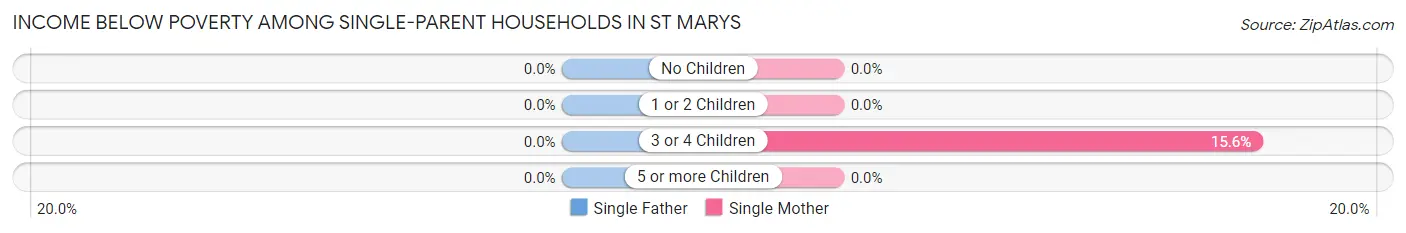
| Children | Single Father | Single Mother |
| No Children | 0 (0.0%) | 0 (0.0%) |
| 1 or 2 Children | 0 (0.0%) | 0 (0.0%) |
| 3 or 4 Children | 0 (0.0%) | 5 (15.6%) |
| 5 or more Children | 0 (0.0%) | 0 (0.0%) |
| Total | 0 (0.0%) | 5 (12.2%) |
Income Below Poverty Among Married-Couple vs Single-Parent Households in St Marys
The poverty data for St Marys shows that 6 of the married-couple family households (1.1%) and 5 of the single-parent households (7.3%) are living below the poverty level. Within the married-couple family households, those with 5 or more children have the highest poverty rate, with 6 households (7.8%) falling below the poverty line. Among the single-parent households, those with 3 or 4 children have the highest poverty rate, with 5 household (15.6%) living below poverty.
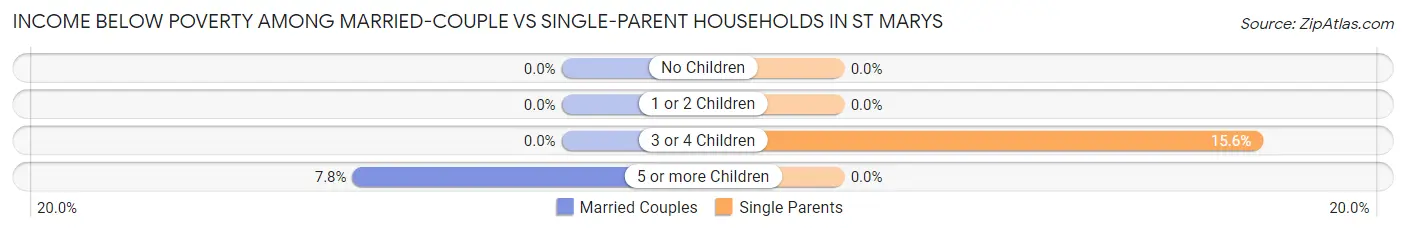
| Children | Married-Couple Families | Single-Parent Households |
| No Children | 0 (0.0%) | 0 (0.0%) |
| 1 or 2 Children | 0 (0.0%) | 0 (0.0%) |
| 3 or 4 Children | 0 (0.0%) | 5 (15.6%) |
| 5 or more Children | 6 (7.8%) | 0 (0.0%) |
| Total | 6 (1.1%) | 5 (7.3%) |
Race in St Marys
The most populous races in St Marys are White / Caucasian (2,301 | 86.5%), Hispanic or Latino (188 | 7.1%), and Two or more Races (164 | 6.2%).
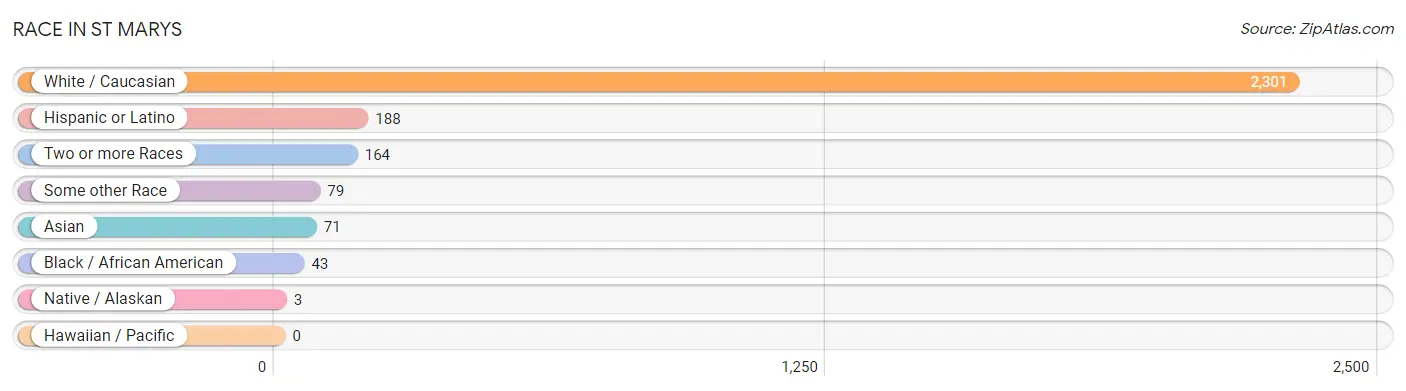
| Race | # Population | % Population |
| Asian | 71 | 2.7% |
| Black / African American | 43 | 1.6% |
| Hawaiian / Pacific | 0 | 0.0% |
| Hispanic or Latino | 188 | 7.1% |
| Native / Alaskan | 3 | 0.1% |
| White / Caucasian | 2,301 | 86.5% |
| Two or more Races | 164 | 6.2% |
| Some other Race | 79 | 3.0% |
| Total | 2,661 | 100.0% |
Ancestry in St Marys
The most populous ancestries reported in St Marys are German (560 | 21.0%), Irish (543 | 20.4%), Italian (339 | 12.7%), English (153 | 5.8%), and French (105 | 4.0%), together accounting for 63.9% of all St Marys residents.
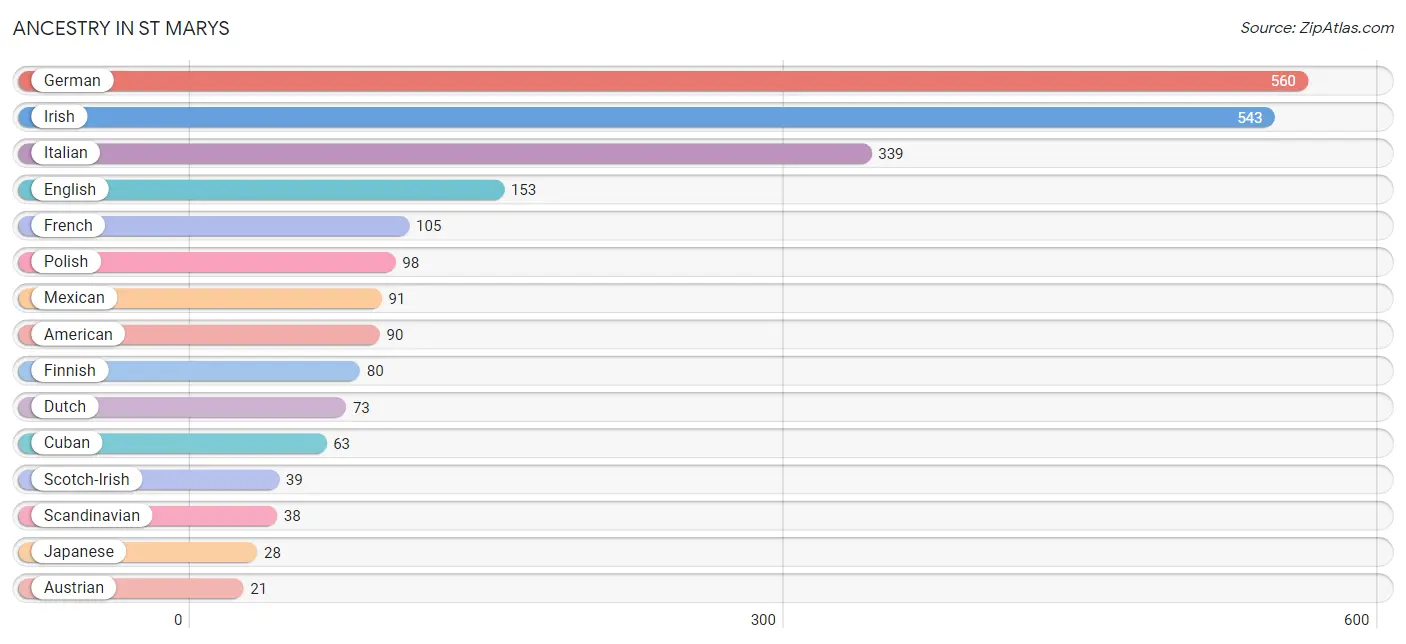
| Ancestry | # Population | % Population |
| American | 90 | 3.4% |
| Argentinean | 19 | 0.7% |
| Austrian | 21 | 0.8% |
| Belgian | 11 | 0.4% |
| British | 5 | 0.2% |
| Burmese | 2 | 0.1% |
| Central American | 7 | 0.3% |
| Cherokee | 11 | 0.4% |
| Creek | 8 | 0.3% |
| Cuban | 63 | 2.4% |
| Czech | 20 | 0.7% |
| Czechoslovakian | 10 | 0.4% |
| Danish | 17 | 0.6% |
| Dutch | 73 | 2.7% |
| English | 153 | 5.8% |
| European | 5 | 0.2% |
| Finnish | 80 | 3.0% |
| French | 105 | 4.0% |
| French American Indian | 5 | 0.2% |
| French Canadian | 16 | 0.6% |
| German | 560 | 21.0% |
| Guatemalan | 7 | 0.3% |
| Haitian | 10 | 0.4% |
| Hungarian | 5 | 0.2% |
| Indian (Asian) | 9 | 0.3% |
| Irish | 543 | 20.4% |
| Italian | 339 | 12.7% |
| Japanese | 28 | 1.1% |
| Luxembourger | 5 | 0.2% |
| Mexican | 91 | 3.4% |
| Norwegian | 5 | 0.2% |
| Polish | 98 | 3.7% |
| Portuguese | 4 | 0.2% |
| Potawatomi | 12 | 0.4% |
| Puerto Rican | 8 | 0.3% |
| Russian | 15 | 0.6% |
| Scandinavian | 38 | 1.4% |
| Scotch-Irish | 39 | 1.5% |
| Slovak | 5 | 0.2% |
| South American | 19 | 0.7% |
| Swedish | 11 | 0.4% |
| Ukrainian | 12 | 0.4% |
| Yugoslavian | 12 | 0.4% | View All 43 Rows |
Immigrants in St Marys
The most numerous immigrant groups reported in St Marys came from Asia (28 | 1.1%), Oceania (21 | 0.8%), Eastern Asia (16 | 0.6%), Philippines (12 | 0.4%), and South Eastern Asia (12 | 0.4%), together accounting for 3.3% of all St Marys residents.
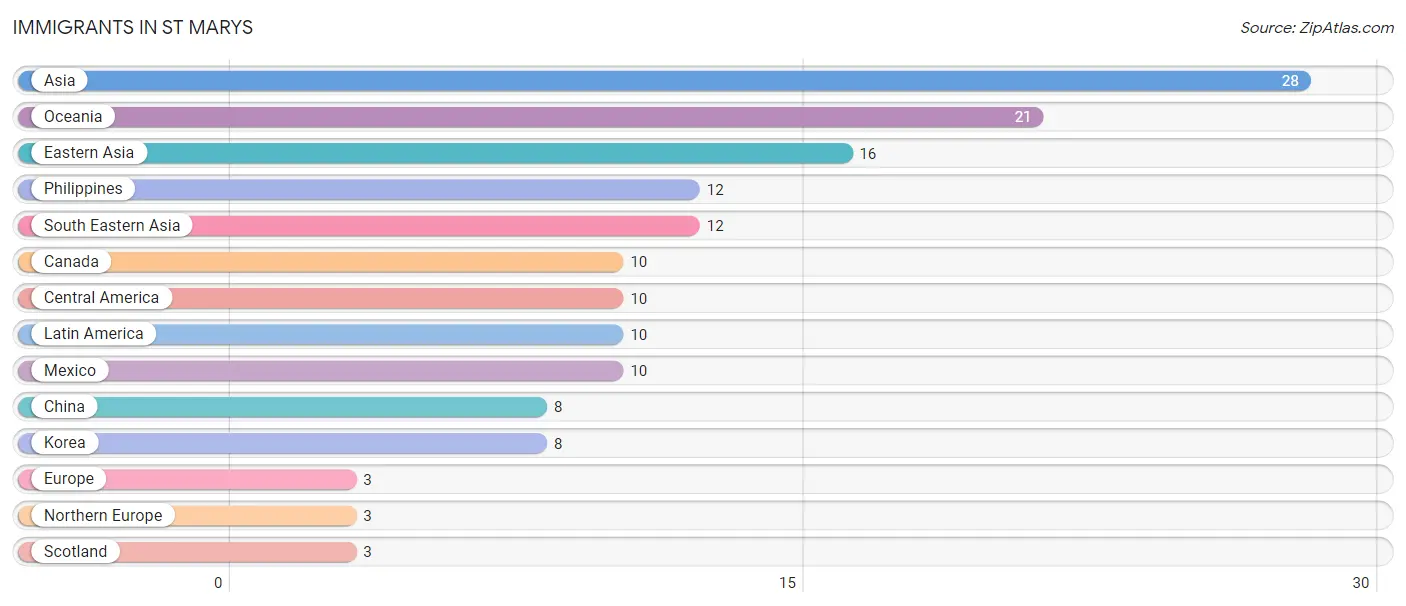
| Immigration Origin | # Population | % Population |
| Asia | 28 | 1.1% |
| Canada | 10 | 0.4% |
| Central America | 10 | 0.4% |
| China | 8 | 0.3% |
| Eastern Asia | 16 | 0.6% |
| Europe | 3 | 0.1% |
| Korea | 8 | 0.3% |
| Latin America | 10 | 0.4% |
| Mexico | 10 | 0.4% |
| Northern Europe | 3 | 0.1% |
| Oceania | 21 | 0.8% |
| Philippines | 12 | 0.4% |
| Scotland | 3 | 0.1% |
| South Eastern Asia | 12 | 0.4% | View All 14 Rows |
Sex and Age in St Marys
Sex and Age in St Marys
The most populous age groups in St Marys are 20 to 24 Years (135 | 10.0%) for men and 15 to 19 Years (194 | 14.8%) for women.
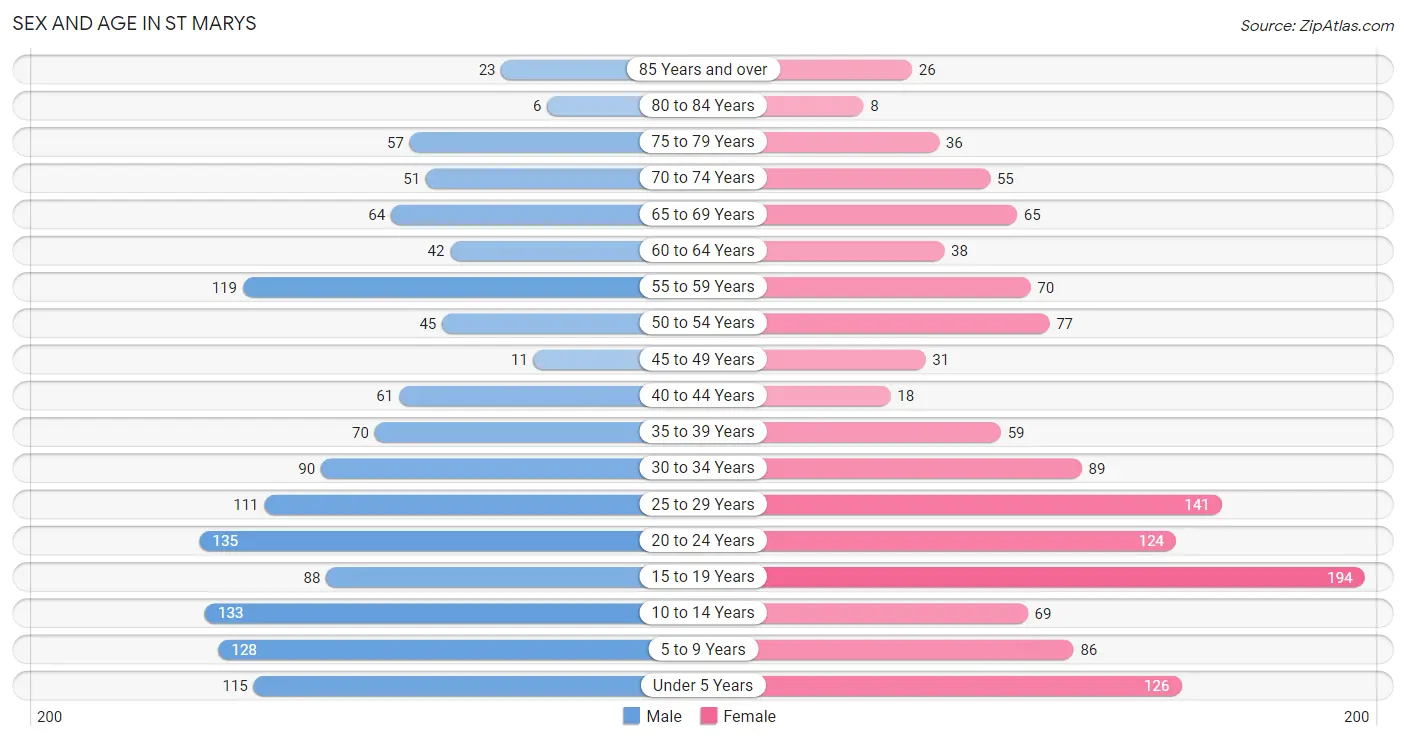
| Age Bracket | Male | Female |
| Under 5 Years | 115 (8.5%) | 126 (9.6%) |
| 5 to 9 Years | 128 (9.5%) | 86 (6.6%) |
| 10 to 14 Years | 133 (9.9%) | 69 (5.3%) |
| 15 to 19 Years | 88 (6.5%) | 194 (14.8%) |
| 20 to 24 Years | 135 (10.0%) | 124 (9.5%) |
| 25 to 29 Years | 111 (8.2%) | 141 (10.7%) |
| 30 to 34 Years | 90 (6.7%) | 89 (6.8%) |
| 35 to 39 Years | 70 (5.2%) | 59 (4.5%) |
| 40 to 44 Years | 61 (4.5%) | 18 (1.4%) |
| 45 to 49 Years | 11 (0.8%) | 31 (2.4%) |
| 50 to 54 Years | 45 (3.3%) | 77 (5.9%) |
| 55 to 59 Years | 119 (8.8%) | 70 (5.3%) |
| 60 to 64 Years | 42 (3.1%) | 38 (2.9%) |
| 65 to 69 Years | 64 (4.7%) | 65 (5.0%) |
| 70 to 74 Years | 51 (3.8%) | 55 (4.2%) |
| 75 to 79 Years | 57 (4.2%) | 36 (2.7%) |
| 80 to 84 Years | 6 (0.4%) | 8 (0.6%) |
| 85 Years and over | 23 (1.7%) | 26 (2.0%) |
| Total | 1,349 (100.0%) | 1,312 (100.0%) |
Families and Households in St Marys
Median Family Size in St Marys
The median family size in St Marys is 3.60 persons per family, with single male/father families (27 | 4.2%) accounting for the largest median family size of 4.96 persons per family. On the other hand, single female/mother families (41 | 6.4%) represent the smallest median family size with 3.22 persons per family.
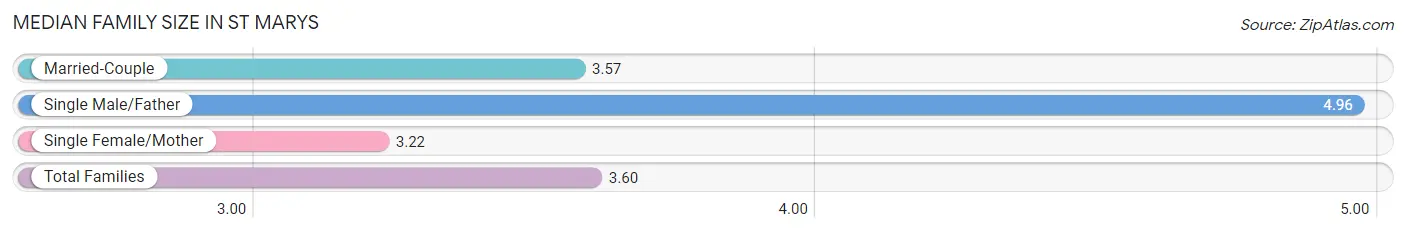
| Family Type | # Families | Family Size |
| Married-Couple | 572 (89.4%) | 3.57 |
| Single Male/Father | 27 (4.2%) | 4.96 |
| Single Female/Mother | 41 (6.4%) | 3.22 |
| Total Families | 640 (100.0%) | 3.60 |
Median Household Size in St Marys
The median household size in St Marys is 3.02 persons per household, with single male/father households (27 | 3.1%) accounting for the largest median household size of 4.96 persons per household. non-family households (228 | 26.3%) represent the smallest median household size with 1.29 persons per household.
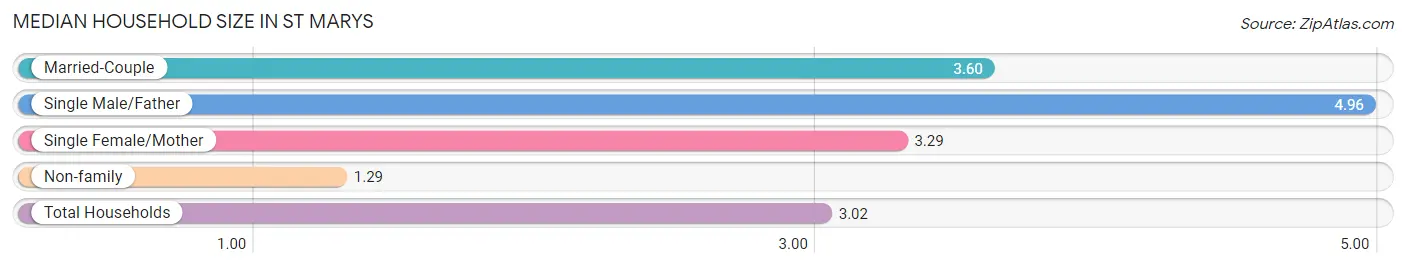
| Household Type | # Households | Household Size |
| Married-Couple | 572 (65.9%) | 3.60 |
| Single Male/Father | 27 (3.1%) | 4.96 |
| Single Female/Mother | 41 (4.7%) | 3.29 |
| Non-family | 228 (26.3%) | 1.29 |
| Total Households | 868 (100.0%) | 3.02 |
Household Size by Marriage Status in St Marys
Out of a total of 868 households in St Marys, 640 (73.7%) are family households, while 228 (26.3%) are nonfamily households. The most numerous type of family households are 2-person households, comprising 227, and the most common type of nonfamily households are 1-person households, comprising 196.
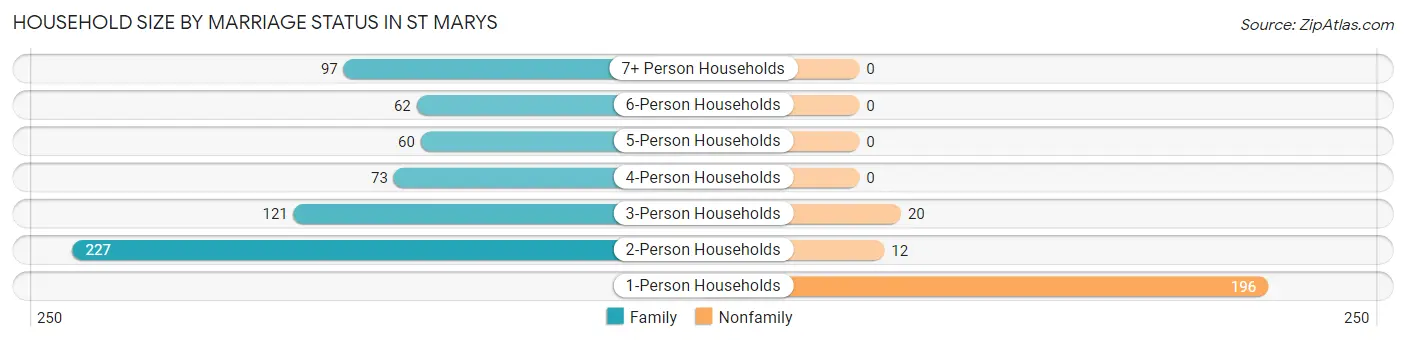
| Household Size | Family Households | Nonfamily Households |
| 1-Person Households | - | 196 (22.6%) |
| 2-Person Households | 227 (26.2%) | 12 (1.4%) |
| 3-Person Households | 121 (13.9%) | 20 (2.3%) |
| 4-Person Households | 73 (8.4%) | 0 (0.0%) |
| 5-Person Households | 60 (6.9%) | 0 (0.0%) |
| 6-Person Households | 62 (7.1%) | 0 (0.0%) |
| 7+ Person Households | 97 (11.2%) | 0 (0.0%) |
| Total | 640 (73.7%) | 228 (26.3%) |
Female Fertility in St Marys
Fertility by Age in St Marys
Average fertility rate in St Marys is 102.0 births per 1,000 women. Women in the age bracket of 35 to 50 years have the highest fertility rate with 219.0 births per 1,000 women. Women in the age bracket of 20 to 34 years acount for 57.1% of all women with births.
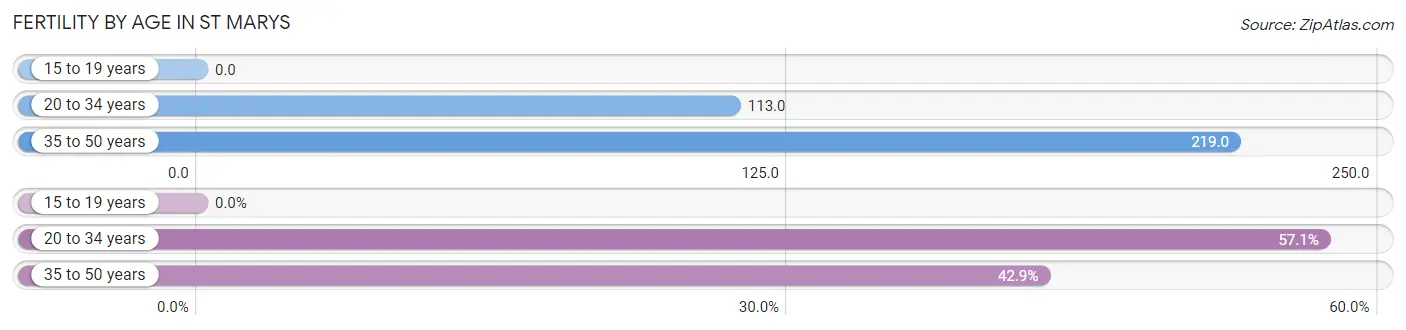
| Age Bracket | Women with Births | Births / 1,000 Women |
| 15 to 19 years | 0 (0.0%) | 0.0 |
| 20 to 34 years | 40 (57.1%) | 113.0 |
| 35 to 50 years | 30 (42.9%) | 219.0 |
| Total | 70 (100.0%) | 102.0 |
Fertility by Age by Marriage Status in St Marys
52.9% of women with births (70) in St Marys are married. The highest percentage of unmarried women with births falls into 35 to 50 years age bracket with 66.7% of them unmarried at the time of birth, while the lowest percentage of unmarried women with births belong to 20 to 34 years age bracket with 32.5% of them unmarried.
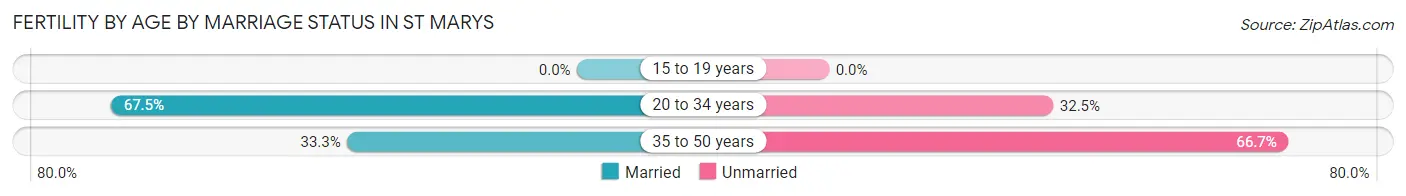
| Age Bracket | Married | Unmarried |
| 15 to 19 years | 0 (0.0%) | 0 (0.0%) |
| 20 to 34 years | 27 (67.5%) | 13 (32.5%) |
| 35 to 50 years | 10 (33.3%) | 20 (66.7%) |
| Total | 37 (52.9%) | 33 (47.1%) |
Fertility by Education in St Marys
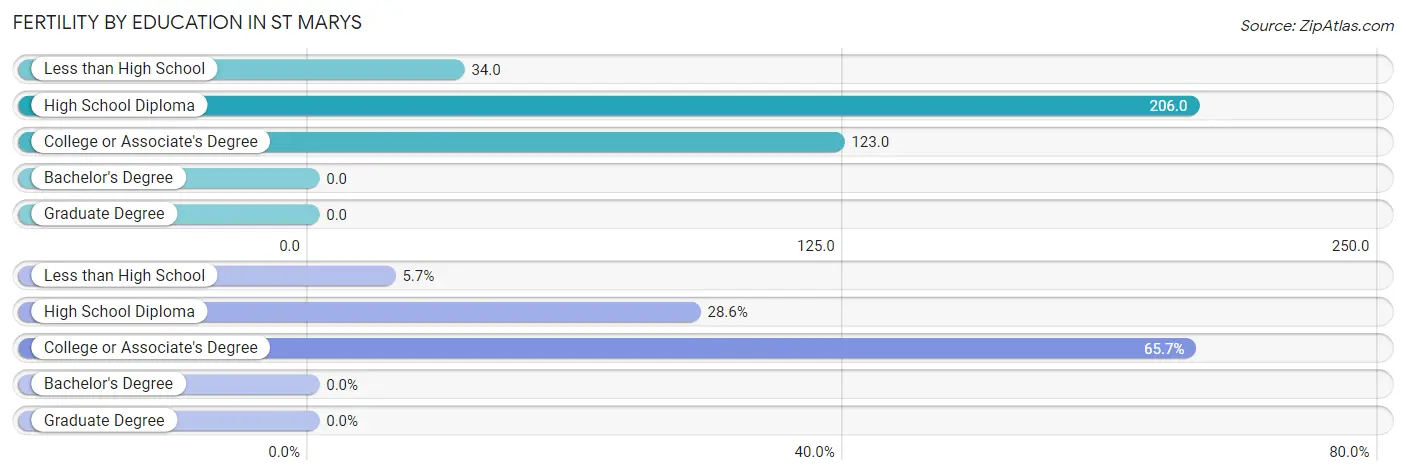
| Educational Attainment | Women with Births | Births / 1,000 Women |
| Less than High School | 4 (5.7%) | 34.0 |
| High School Diploma | 20 (28.6%) | 206.0 |
| College or Associate's Degree | 46 (65.7%) | 123.0 |
| Bachelor's Degree | 0 (0.0%) | 0.0 |
| Graduate Degree | 0 (0.0%) | 0.0 |
| Total | 70 (100.0%) | 102.0 |
Fertility by Education by Marriage Status in St Marys
47.1% of women with births in St Marys are unmarried. Women with the educational attainment of less than high school are most likely to be married with 100.0% of them married at childbirth, while women with the educational attainment of high school diploma are least likely to be married with 65.0% of them unmarried at childbirth.
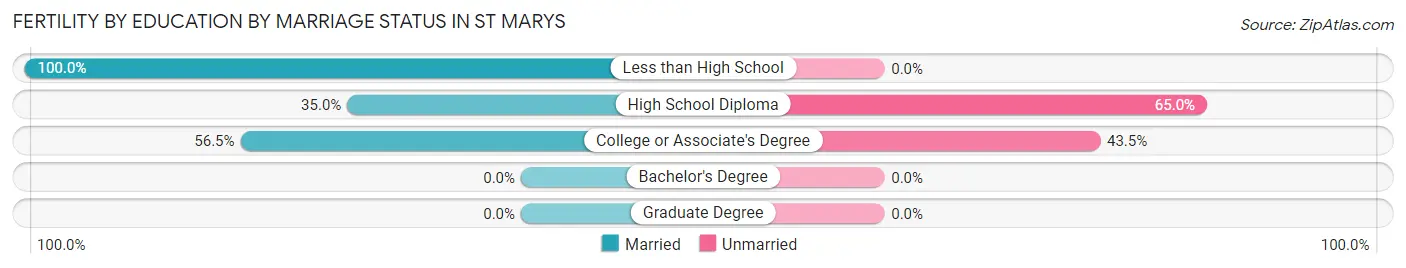
| Educational Attainment | Married | Unmarried |
| Less than High School | 4 (100.0%) | 0 (0.0%) |
| High School Diploma | 7 (35.0%) | 13 (65.0%) |
| College or Associate's Degree | 26 (56.5%) | 20 (43.5%) |
| Bachelor's Degree | 0 (0.0%) | 0 (0.0%) |
| Graduate Degree | 0 (0.0%) | 0 (0.0%) |
| Total | 37 (52.9%) | 33 (47.1%) |
Employment Characteristics in St Marys
Employment by Class of Employer in St Marys
Among the 1,173 employed individuals in St Marys, private company employees (733 | 62.5%), not-for-profit organizations (207 | 17.6%), and local government employees (111 | 9.5%) make up the most common classes of employment.
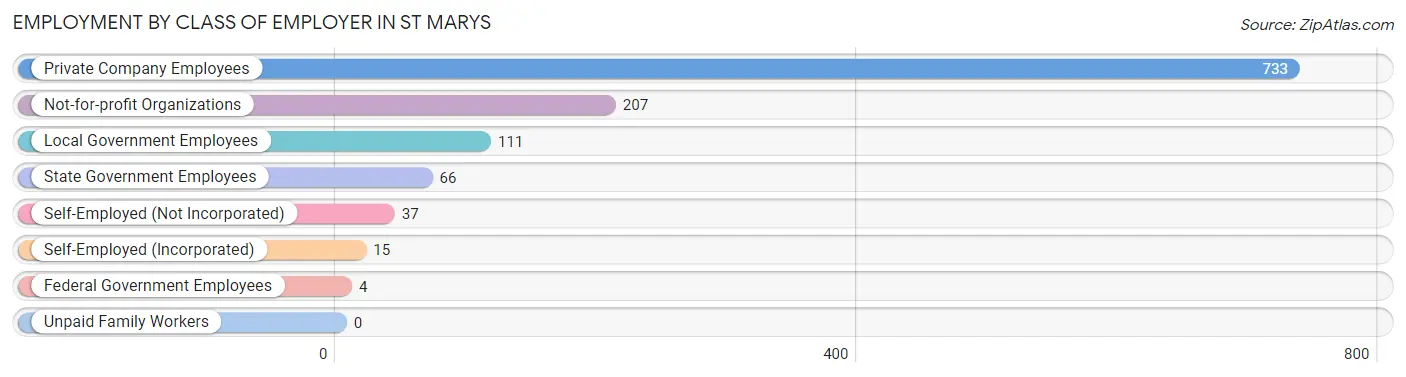
| Employer Class | # Employees | % Employees |
| Private Company Employees | 733 | 62.5% |
| Self-Employed (Incorporated) | 15 | 1.3% |
| Self-Employed (Not Incorporated) | 37 | 3.2% |
| Not-for-profit Organizations | 207 | 17.6% |
| Local Government Employees | 111 | 9.5% |
| State Government Employees | 66 | 5.6% |
| Federal Government Employees | 4 | 0.3% |
| Unpaid Family Workers | 0 | 0.0% |
| Total | 1,173 | 100.0% |
Employment Status by Age in St Marys
According to the labor force statistics for St Marys, out of the total population over 16 years of age (1,972), 63.9% or 1,260 individuals are in the labor force, with 3.1% or 39 of them unemployed. The age group with the highest labor force participation rate is 30 to 34 years, with 94.4% or 169 individuals in the labor force. Within the labor force, the 16 to 19 years age range has the highest percentage of unemployed individuals, with 14.3% or 19 of them being unemployed.
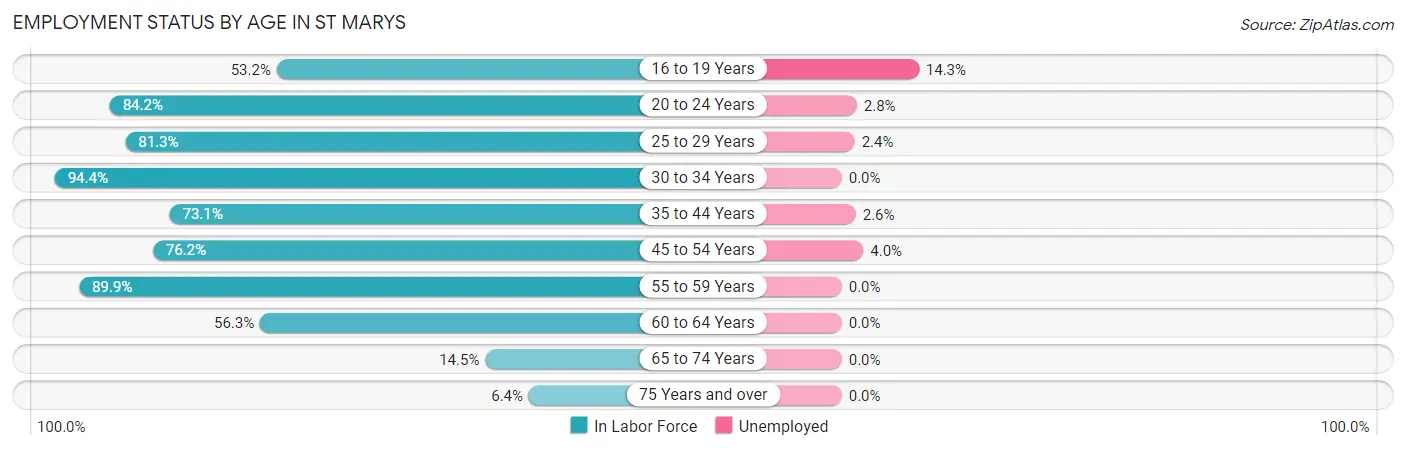
| Age Bracket | In Labor Force | Unemployed |
| 16 to 19 Years | 133 (53.2%) | 19 (14.3%) |
| 20 to 24 Years | 218 (84.2%) | 6 (2.8%) |
| 25 to 29 Years | 205 (81.3%) | 5 (2.4%) |
| 30 to 34 Years | 169 (94.4%) | 0 (0.0%) |
| 35 to 44 Years | 152 (73.1%) | 4 (2.6%) |
| 45 to 54 Years | 125 (76.2%) | 5 (4.0%) |
| 55 to 59 Years | 170 (89.9%) | 0 (0.0%) |
| 60 to 64 Years | 45 (56.3%) | 0 (0.0%) |
| 65 to 74 Years | 34 (14.5%) | 0 (0.0%) |
| 75 Years and over | 10 (6.4%) | 0 (0.0%) |
| Total | 1,260 (63.9%) | 39 (3.1%) |
Employment Status by Educational Attainment in St Marys
According to labor force statistics for St Marys, 80.8% of individuals (866) out of the total population between 25 and 64 years of age (1,072) are in the labor force, with 1.6% or 14 of them being unemployed. The group with the highest labor force participation rate are those with the educational attainment of less than high school, with 100.0% or 18 individuals in the labor force. Within the labor force, individuals with college / associate degree education have the highest percentage of unemployment, with 2.3% or 9 of them being unemployed.
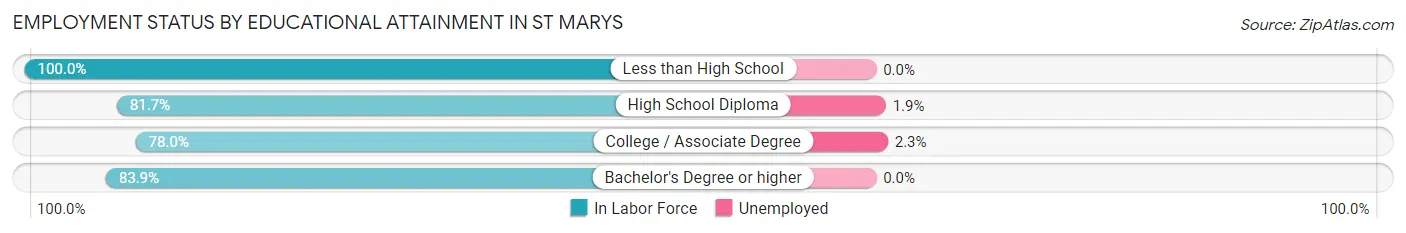
| Educational Attainment | In Labor Force | Unemployed |
| Less than High School | 18 (100.0%) | 0 (0.0%) |
| High School Diploma | 267 (81.7%) | 6 (1.9%) |
| College / Associate Degree | 383 (78.0%) | 11 (2.3%) |
| Bachelor's Degree or higher | 198 (83.9%) | 0 (0.0%) |
| Total | 866 (80.8%) | 17 (1.6%) |
Employment Occupations by Sex in St Marys
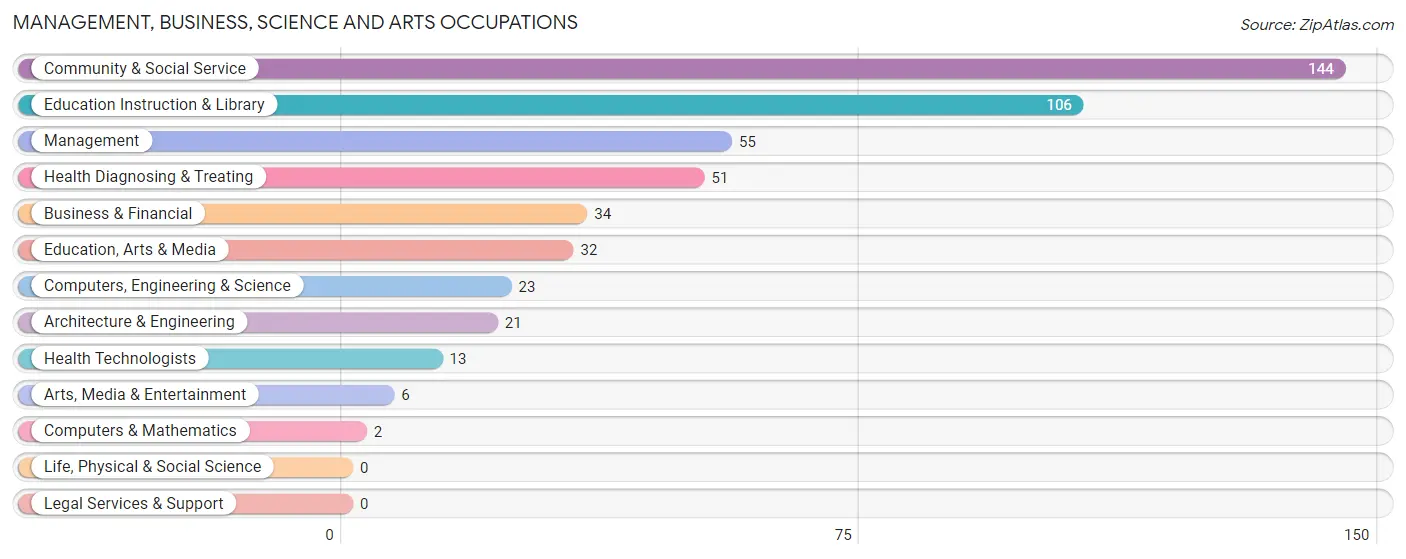
Management, Business, Science and Arts Occupations
The most common Management, Business, Science and Arts occupations in St Marys are Community & Social Service (144 | 11.8%), Education Instruction & Library (106 | 8.7%), Management (55 | 4.5%), Health Diagnosing & Treating (51 | 4.2%), and Business & Financial (34 | 2.8%).
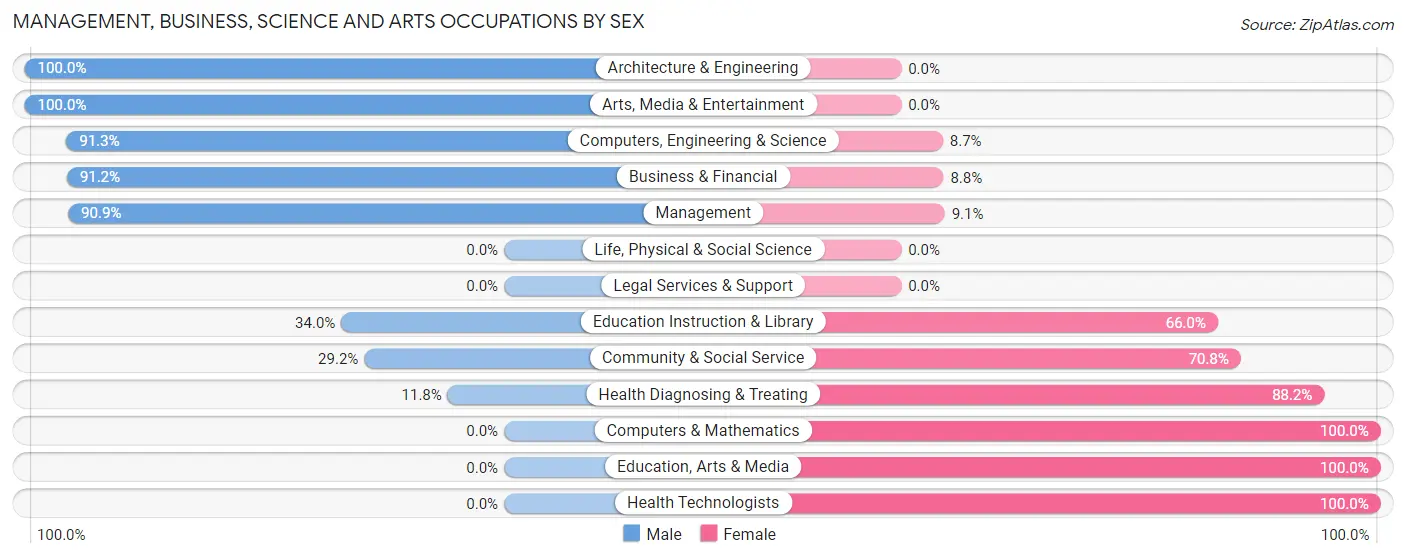
Management, Business, Science and Arts Occupations by Sex
Within the Management, Business, Science and Arts occupations in St Marys, the most male-oriented occupations are Architecture & Engineering (100.0%), Arts, Media & Entertainment (100.0%), and Computers, Engineering & Science (91.3%), while the most female-oriented occupations are Computers & Mathematics (100.0%), Education, Arts & Media (100.0%), and Health Technologists (100.0%).
| Occupation | Male | Female |
| Management | 50 (90.9%) | 5 (9.1%) |
| Business & Financial | 31 (91.2%) | 3 (8.8%) |
| Computers, Engineering & Science | 21 (91.3%) | 2 (8.7%) |
| Computers & Mathematics | 0 (0.0%) | 2 (100.0%) |
| Architecture & Engineering | 21 (100.0%) | 0 (0.0%) |
| Life, Physical & Social Science | 0 (0.0%) | 0 (0.0%) |
| Community & Social Service | 42 (29.2%) | 102 (70.8%) |
| Education, Arts & Media | 0 (0.0%) | 32 (100.0%) |
| Legal Services & Support | 0 (0.0%) | 0 (0.0%) |
| Education Instruction & Library | 36 (34.0%) | 70 (66.0%) |
| Arts, Media & Entertainment | 6 (100.0%) | 0 (0.0%) |
| Health Diagnosing & Treating | 6 (11.8%) | 45 (88.2%) |
| Health Technologists | 0 (0.0%) | 13 (100.0%) |
| Total (Category) | 150 (48.9%) | 157 (51.1%) |
| Total (Overall) | 694 (56.8%) | 528 (43.2%) |
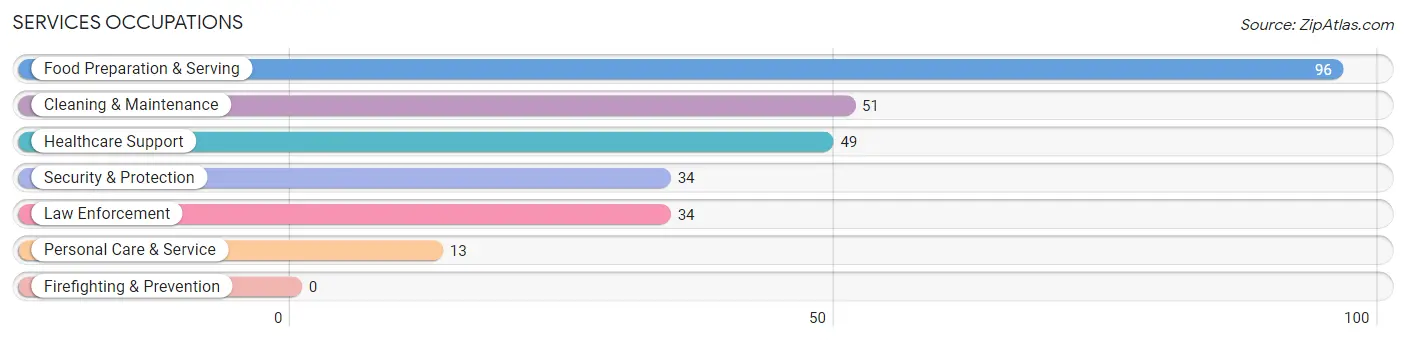
Services Occupations
The most common Services occupations in St Marys are Food Preparation & Serving (96 | 7.9%), Cleaning & Maintenance (51 | 4.2%), Healthcare Support (49 | 4.0%), Security & Protection (34 | 2.8%), and Law Enforcement (34 | 2.8%).
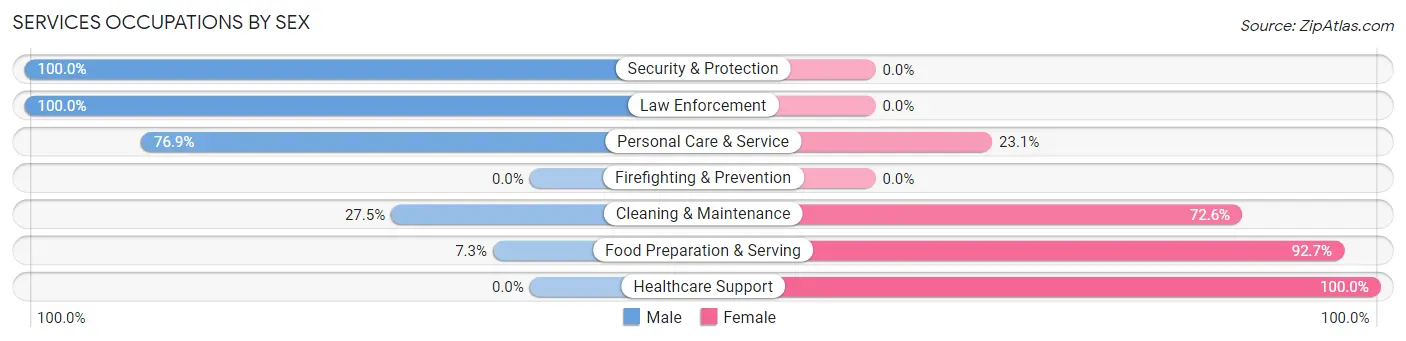
Services Occupations by Sex
Within the Services occupations in St Marys, the most male-oriented occupations are Security & Protection (100.0%), Law Enforcement (100.0%), and Personal Care & Service (76.9%), while the most female-oriented occupations are Healthcare Support (100.0%), Food Preparation & Serving (92.7%), and Cleaning & Maintenance (72.6%).
| Occupation | Male | Female |
| Healthcare Support | 0 (0.0%) | 49 (100.0%) |
| Security & Protection | 34 (100.0%) | 0 (0.0%) |
| Firefighting & Prevention | 0 (0.0%) | 0 (0.0%) |
| Law Enforcement | 34 (100.0%) | 0 (0.0%) |
| Food Preparation & Serving | 7 (7.3%) | 89 (92.7%) |
| Cleaning & Maintenance | 14 (27.5%) | 37 (72.6%) |
| Personal Care & Service | 10 (76.9%) | 3 (23.1%) |
| Total (Category) | 65 (26.8%) | 178 (73.3%) |
| Total (Overall) | 694 (56.8%) | 528 (43.2%) |
Sales and Office Occupations
The most common Sales and Office occupations in St Marys are Office & Administration (161 | 13.2%), and Sales & Related (39 | 3.2%).
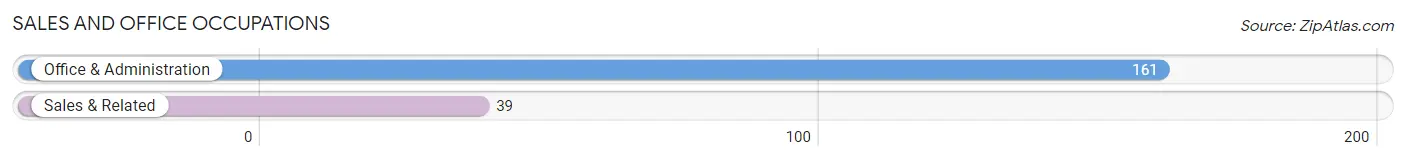
Sales and Office Occupations by Sex
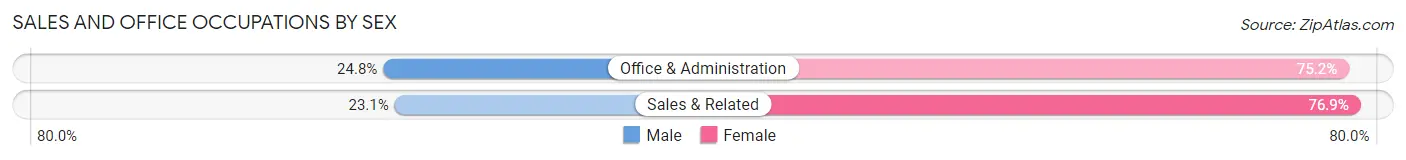
| Occupation | Male | Female |
| Sales & Related | 9 (23.1%) | 30 (76.9%) |
| Office & Administration | 40 (24.8%) | 121 (75.2%) |
| Total (Category) | 49 (24.5%) | 151 (75.5%) |
| Total (Overall) | 694 (56.8%) | 528 (43.2%) |
Natural Resources, Construction and Maintenance Occupations
The most common Natural Resources, Construction and Maintenance occupations in St Marys are Construction & Extraction (64 | 5.2%), Installation, Maintenance & Repair (45 | 3.7%), and Farming, Fishing & Forestry (14 | 1.1%).
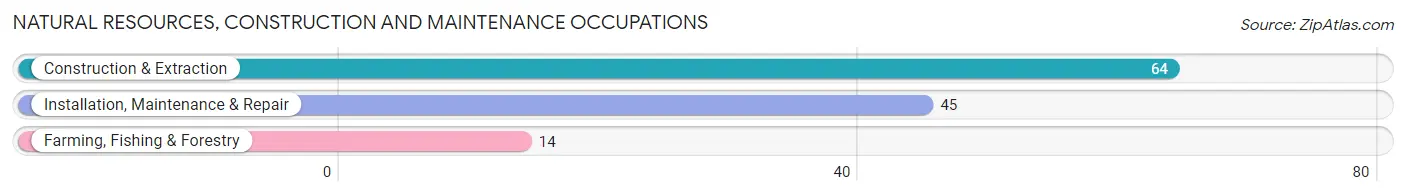
Natural Resources, Construction and Maintenance Occupations by Sex
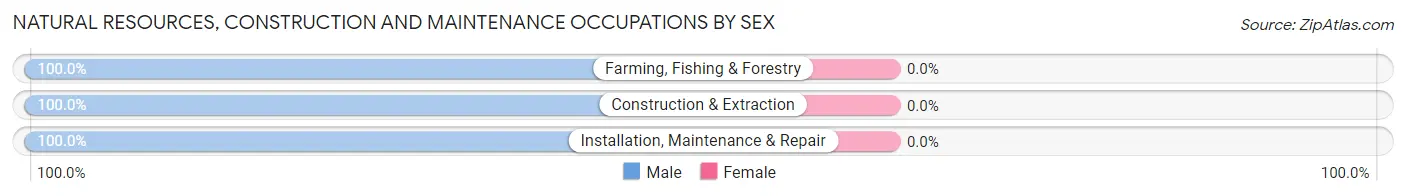
| Occupation | Male | Female |
| Farming, Fishing & Forestry | 14 (100.0%) | 0 (0.0%) |
| Construction & Extraction | 64 (100.0%) | 0 (0.0%) |
| Installation, Maintenance & Repair | 45 (100.0%) | 0 (0.0%) |
| Total (Category) | 123 (100.0%) | 0 (0.0%) |
| Total (Overall) | 694 (56.8%) | 528 (43.2%) |
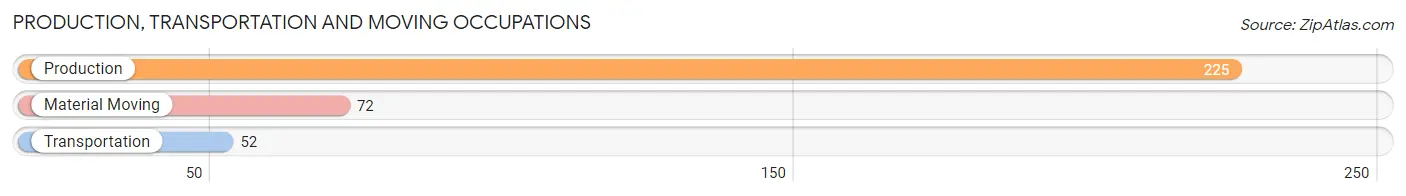
Production, Transportation and Moving Occupations
The most common Production, Transportation and Moving occupations in St Marys are Production (225 | 18.4%), Material Moving (72 | 5.9%), and Transportation (52 | 4.3%).
Production, Transportation and Moving Occupations by Sex
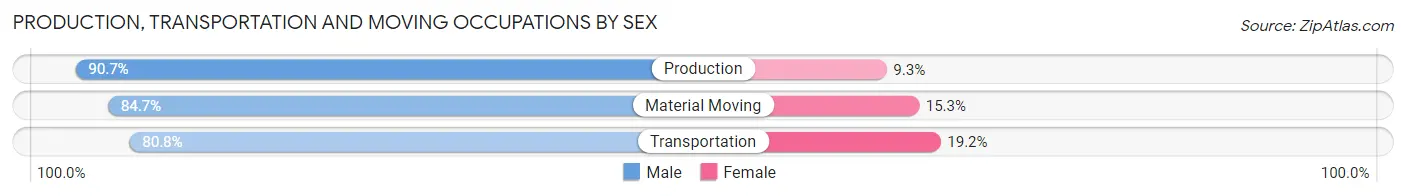
| Occupation | Male | Female |
| Production | 204 (90.7%) | 21 (9.3%) |
| Transportation | 42 (80.8%) | 10 (19.2%) |
| Material Moving | 61 (84.7%) | 11 (15.3%) |
| Total (Category) | 307 (88.0%) | 42 (12.0%) |
| Total (Overall) | 694 (56.8%) | 528 (43.2%) |
Employment Industries by Sex in St Marys
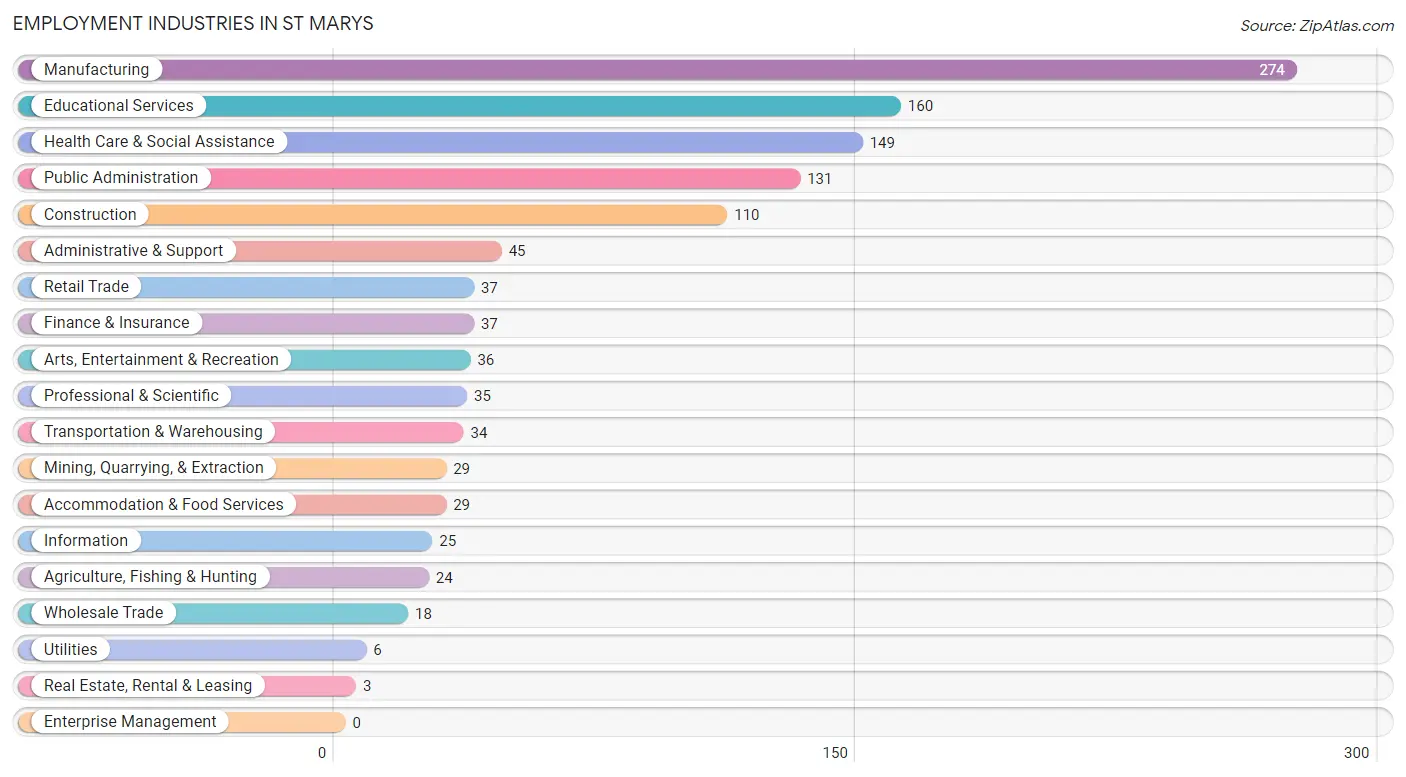
Employment Industries in St Marys
The major employment industries in St Marys include Manufacturing (274 | 22.4%), Educational Services (160 | 13.1%), Health Care & Social Assistance (149 | 12.2%), Public Administration (131 | 10.7%), and Construction (110 | 9.0%).
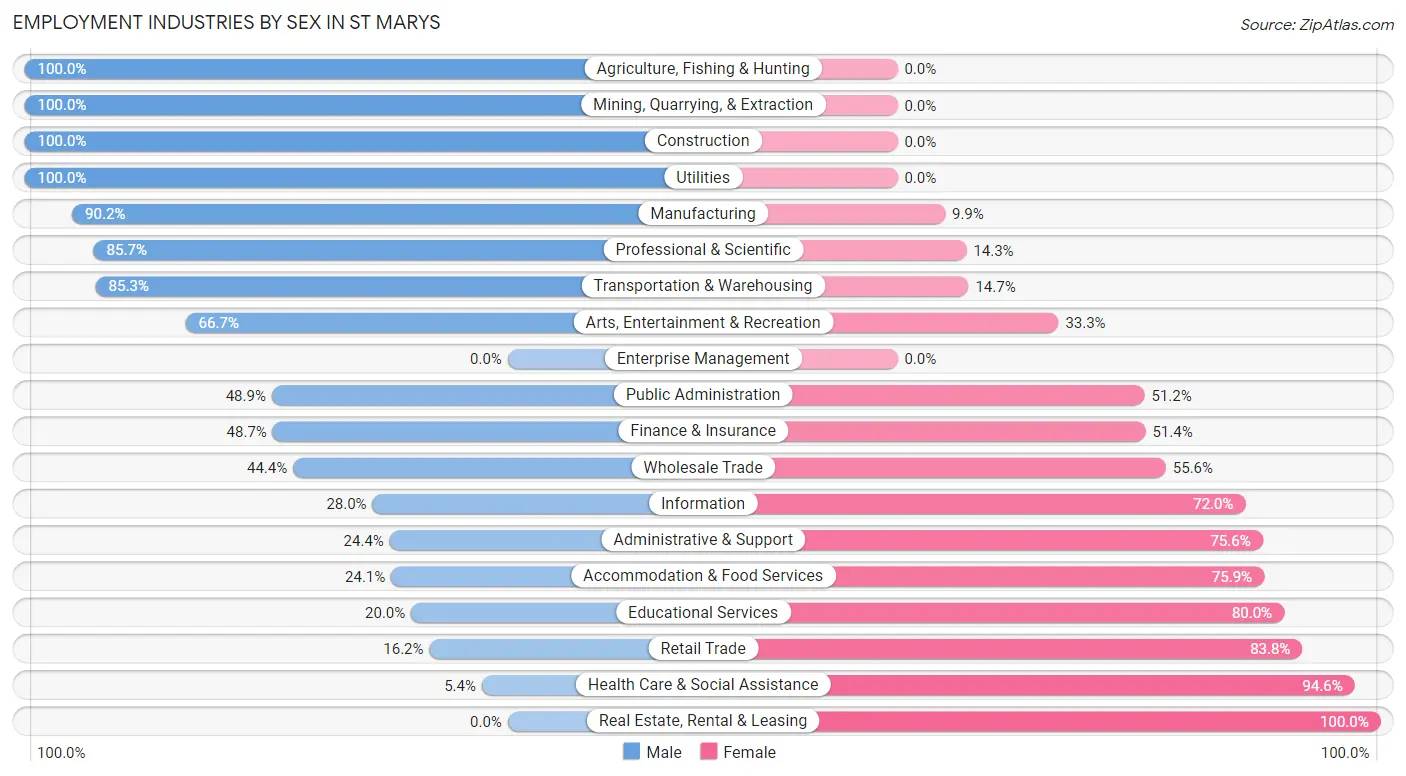
Employment Industries by Sex in St Marys
The St Marys industries that see more men than women are Agriculture, Fishing & Hunting (100.0%), Mining, Quarrying, & Extraction (100.0%), and Construction (100.0%), whereas the industries that tend to have a higher number of women are Real Estate, Rental & Leasing (100.0%), Health Care & Social Assistance (94.6%), and Retail Trade (83.8%).
| Industry | Male | Female |
| Agriculture, Fishing & Hunting | 24 (100.0%) | 0 (0.0%) |
| Mining, Quarrying, & Extraction | 29 (100.0%) | 0 (0.0%) |
| Construction | 110 (100.0%) | 0 (0.0%) |
| Manufacturing | 247 (90.1%) | 27 (9.9%) |
| Wholesale Trade | 8 (44.4%) | 10 (55.6%) |
| Retail Trade | 6 (16.2%) | 31 (83.8%) |
| Transportation & Warehousing | 29 (85.3%) | 5 (14.7%) |
| Utilities | 6 (100.0%) | 0 (0.0%) |
| Information | 7 (28.0%) | 18 (72.0%) |
| Finance & Insurance | 18 (48.6%) | 19 (51.3%) |
| Real Estate, Rental & Leasing | 0 (0.0%) | 3 (100.0%) |
| Professional & Scientific | 30 (85.7%) | 5 (14.3%) |
| Enterprise Management | 0 (0.0%) | 0 (0.0%) |
| Administrative & Support | 11 (24.4%) | 34 (75.6%) |
| Educational Services | 32 (20.0%) | 128 (80.0%) |
| Health Care & Social Assistance | 8 (5.4%) | 141 (94.6%) |
| Arts, Entertainment & Recreation | 24 (66.7%) | 12 (33.3%) |
| Accommodation & Food Services | 7 (24.1%) | 22 (75.9%) |
| Public Administration | 64 (48.8%) | 67 (51.1%) |
| Total | 694 (56.8%) | 528 (43.2%) |
Education in St Marys
School Enrollment in St Marys
The most common levels of schooling among the 730 students in St Marys are middle school (189 | 25.9%), college / undergraduate (160 | 21.9%), and high school (150 | 20.5%).
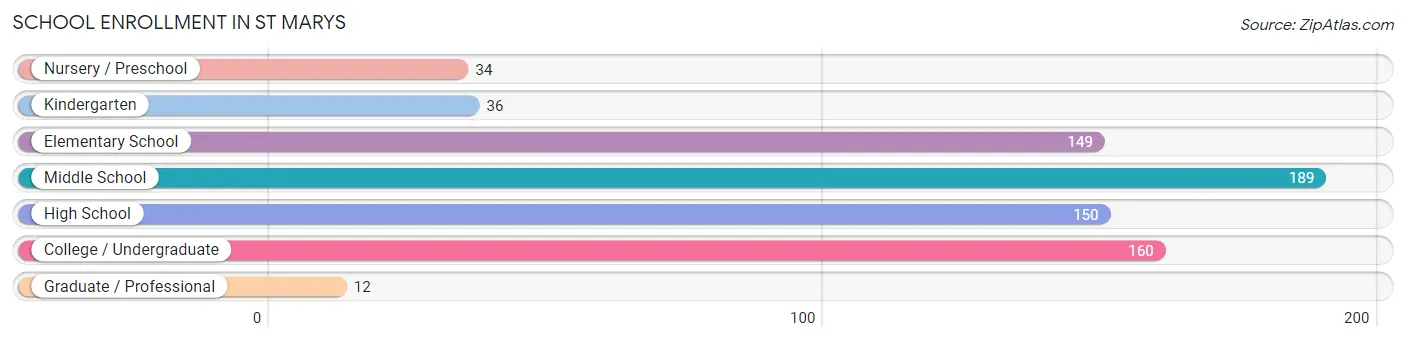
| School Level | # Students | % Students |
| Nursery / Preschool | 34 | 4.7% |
| Kindergarten | 36 | 4.9% |
| Elementary School | 149 | 20.4% |
| Middle School | 189 | 25.9% |
| High School | 150 | 20.5% |
| College / Undergraduate | 160 | 21.9% |
| Graduate / Professional | 12 | 1.6% |
| Total | 730 | 100.0% |
School Enrollment by Age by Funding Source in St Marys
Out of a total of 730 students who are enrolled in schools in St Marys, 351 (48.1%) attend a private institution, while the remaining 379 (51.9%) are enrolled in public schools. The age group of 25 to 34 year olds has the highest likelihood of being enrolled in private schools, with 24 (100.0% in the age bracket) enrolled. Conversely, the age group of 15 to 17 year olds has the lowest likelihood of being enrolled in a private school, with 82 (70.7% in the age bracket) attending a public institution.
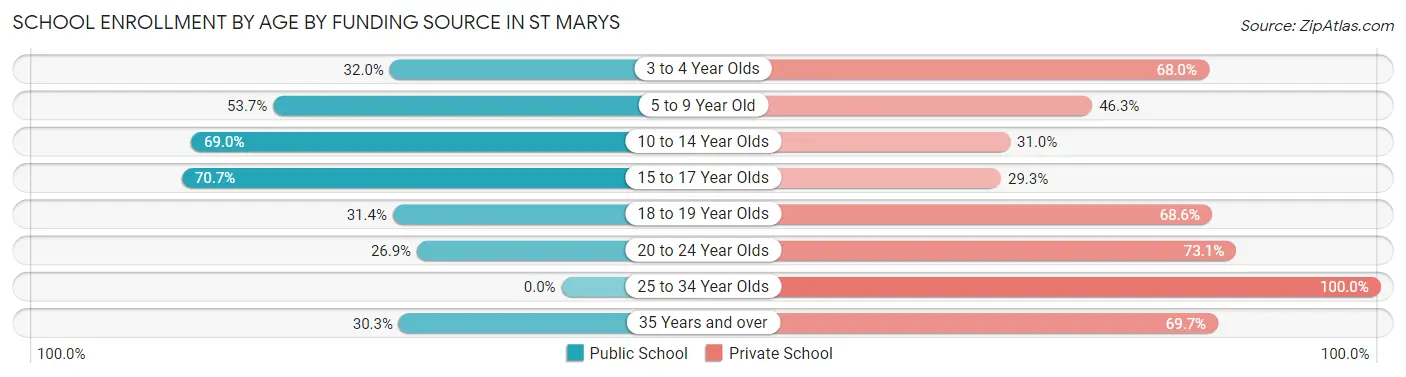
| Age Bracket | Public School | Private School |
| 3 to 4 Year Olds | 8 (32.0%) | 17 (68.0%) |
| 5 to 9 Year Old | 94 (53.7%) | 81 (46.3%) |
| 10 to 14 Year Olds | 138 (69.0%) | 62 (31.0%) |
| 15 to 17 Year Olds | 82 (70.7%) | 34 (29.3%) |
| 18 to 19 Year Olds | 33 (31.4%) | 72 (68.6%) |
| 20 to 24 Year Olds | 14 (26.9%) | 38 (73.1%) |
| 25 to 34 Year Olds | 0 (0.0%) | 24 (100.0%) |
| 35 Years and over | 10 (30.3%) | 23 (69.7%) |
| Total | 379 (51.9%) | 351 (48.1%) |
Educational Attainment by Field of Study in St Marys
Business (97 | 24.3%), education (69 | 17.3%), literature & languages (62 | 15.5%), multidisciplinary studies (39 | 9.8%), and social sciences (23 | 5.8%) are the most common fields of study among 399 individuals in St Marys who have obtained a bachelor's degree or higher.
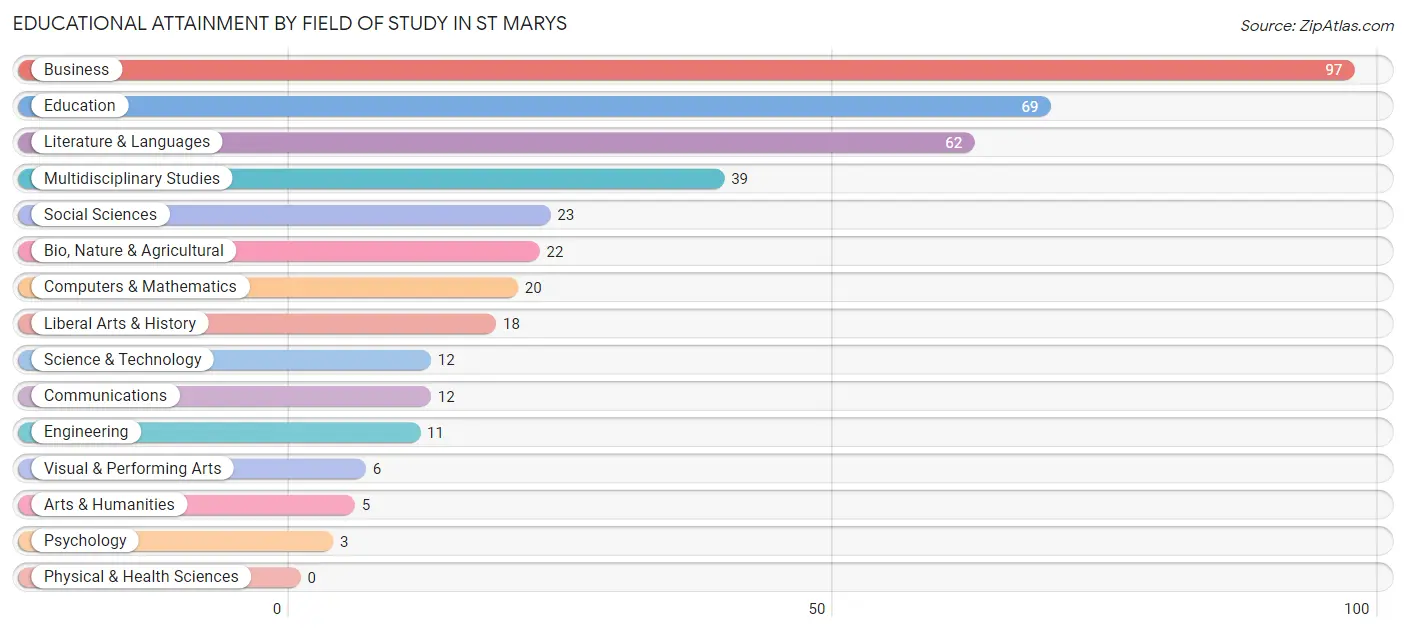
| Field of Study | # Graduates | % Graduates |
| Computers & Mathematics | 20 | 5.0% |
| Bio, Nature & Agricultural | 22 | 5.5% |
| Physical & Health Sciences | 0 | 0.0% |
| Psychology | 3 | 0.7% |
| Social Sciences | 23 | 5.8% |
| Engineering | 11 | 2.8% |
| Multidisciplinary Studies | 39 | 9.8% |
| Science & Technology | 12 | 3.0% |
| Business | 97 | 24.3% |
| Education | 69 | 17.3% |
| Literature & Languages | 62 | 15.5% |
| Liberal Arts & History | 18 | 4.5% |
| Visual & Performing Arts | 6 | 1.5% |
| Communications | 12 | 3.0% |
| Arts & Humanities | 5 | 1.3% |
| Total | 399 | 100.0% |
Transportation & Commute in St Marys
Vehicle Availability by Sex in St Marys
The most prevalent vehicle ownership categories in St Marys are males with 2 vehicles (283, accounting for 43.1%) and females with 2 vehicles (172, making up 55.6%).
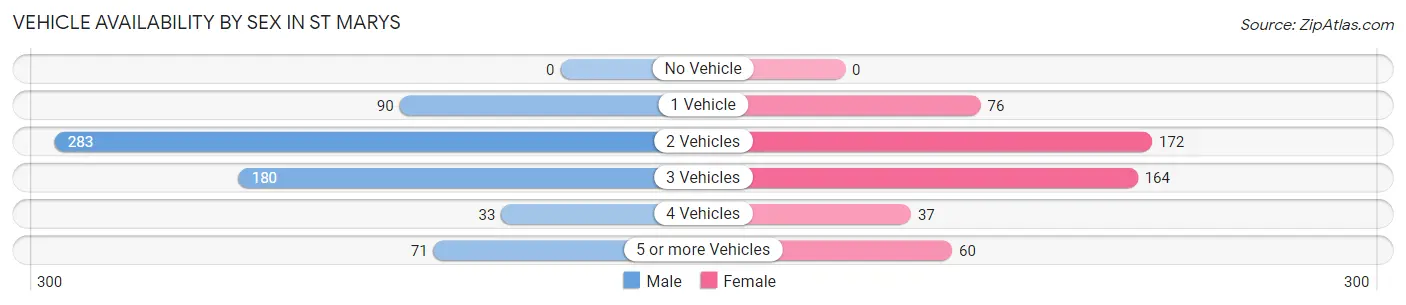
| Vehicles Available | Male | Female |
| No Vehicle | 0 (0.0%) | 0 (0.0%) |
| 1 Vehicle | 90 (13.7%) | 76 (14.9%) |
| 2 Vehicles | 283 (43.1%) | 172 (33.8%) |
| 3 Vehicles | 180 (27.4%) | 164 (32.2%) |
| 4 Vehicles | 33 (5.0%) | 37 (7.3%) |
| 5 or more Vehicles | 71 (10.8%) | 60 (11.8%) |
| Total | 657 (100.0%) | 509 (100.0%) |
Commute Time in St Marys
The most frequently occuring commute durations in St Marys are 5 to 9 minutes (348 commuters, 30.8%), 10 to 14 minutes (191 commuters, 16.9%), and 30 to 34 minutes (135 commuters, 11.9%).
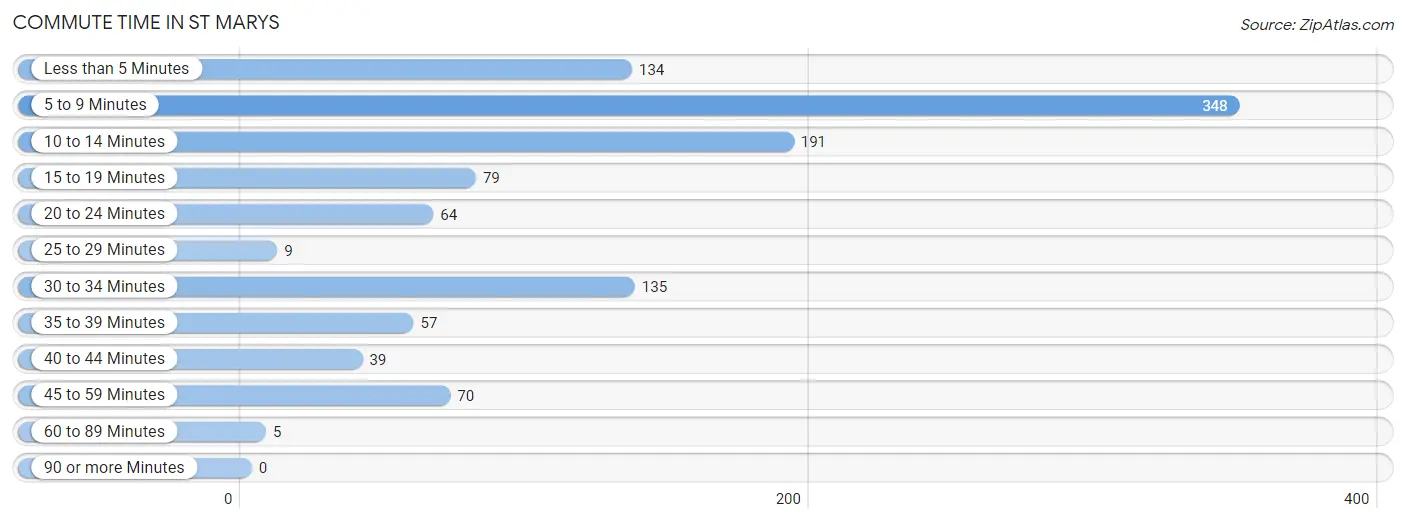
| Commute Time | # Commuters | % Commuters |
| Less than 5 Minutes | 134 | 11.8% |
| 5 to 9 Minutes | 348 | 30.8% |
| 10 to 14 Minutes | 191 | 16.9% |
| 15 to 19 Minutes | 79 | 7.0% |
| 20 to 24 Minutes | 64 | 5.7% |
| 25 to 29 Minutes | 9 | 0.8% |
| 30 to 34 Minutes | 135 | 11.9% |
| 35 to 39 Minutes | 57 | 5.0% |
| 40 to 44 Minutes | 39 | 3.5% |
| 45 to 59 Minutes | 70 | 6.2% |
| 60 to 89 Minutes | 5 | 0.4% |
| 90 or more Minutes | 0 | 0.0% |
Commute Time by Sex in St Marys
The most common commute times in St Marys are 5 to 9 minutes (150 commuters, 22.7%) for males and 5 to 9 minutes (198 commuters, 42.0%) for females.
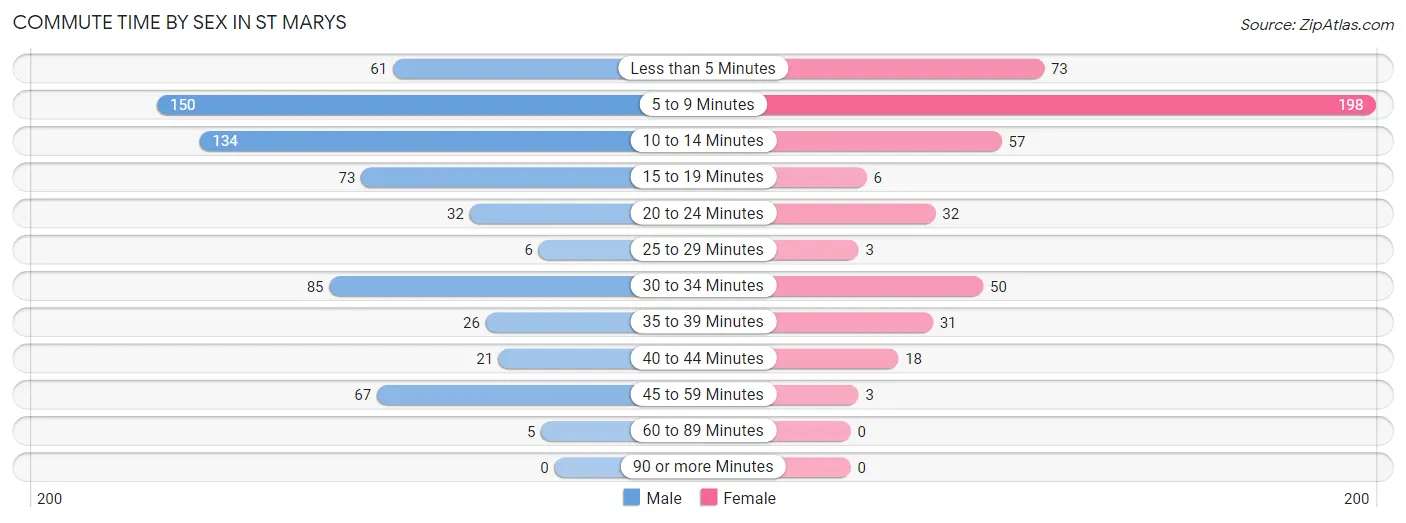
| Commute Time | Male | Female |
| Less than 5 Minutes | 61 (9.2%) | 73 (15.5%) |
| 5 to 9 Minutes | 150 (22.7%) | 198 (42.0%) |
| 10 to 14 Minutes | 134 (20.3%) | 57 (12.1%) |
| 15 to 19 Minutes | 73 (11.1%) | 6 (1.3%) |
| 20 to 24 Minutes | 32 (4.9%) | 32 (6.8%) |
| 25 to 29 Minutes | 6 (0.9%) | 3 (0.6%) |
| 30 to 34 Minutes | 85 (12.9%) | 50 (10.6%) |
| 35 to 39 Minutes | 26 (3.9%) | 31 (6.6%) |
| 40 to 44 Minutes | 21 (3.2%) | 18 (3.8%) |
| 45 to 59 Minutes | 67 (10.2%) | 3 (0.6%) |
| 60 to 89 Minutes | 5 (0.8%) | 0 (0.0%) |
| 90 or more Minutes | 0 (0.0%) | 0 (0.0%) |
Time of Departure to Work by Sex in St Marys
The most frequent times of departure to work in St Marys are 7:00 AM to 7:29 AM (96, 14.5%) for males and 7:30 AM to 7:59 AM (131, 27.8%) for females.
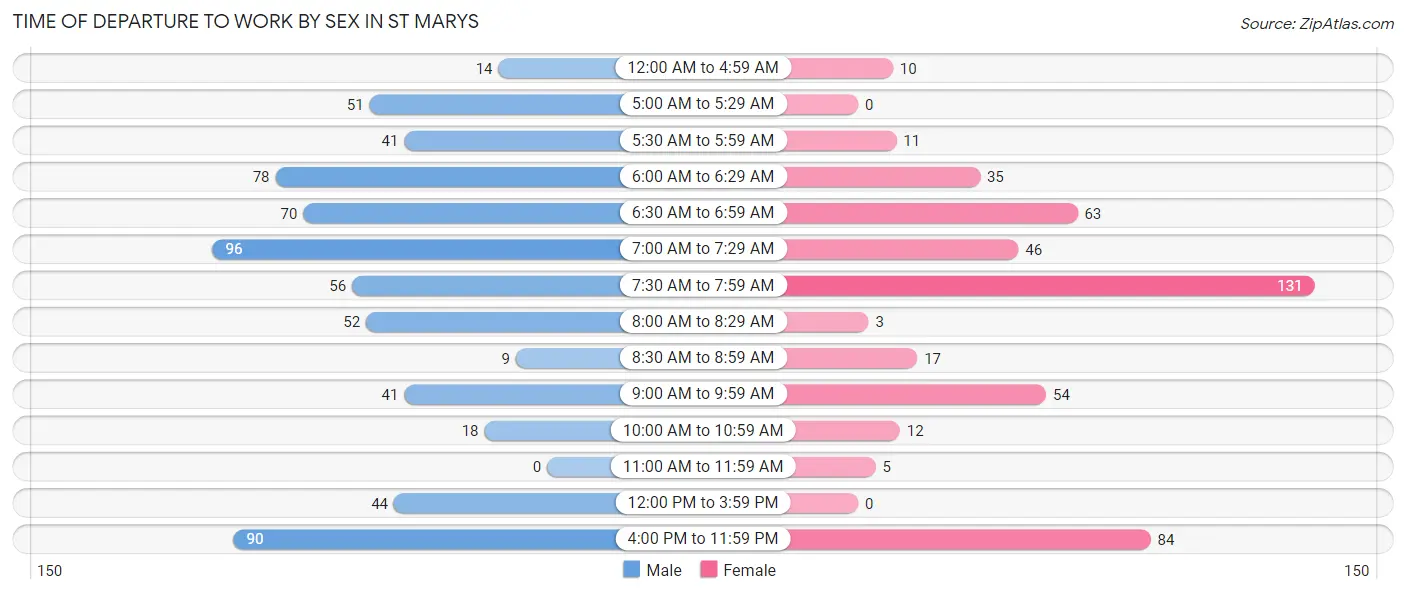
| Time of Departure | Male | Female |
| 12:00 AM to 4:59 AM | 14 (2.1%) | 10 (2.1%) |
| 5:00 AM to 5:29 AM | 51 (7.7%) | 0 (0.0%) |
| 5:30 AM to 5:59 AM | 41 (6.2%) | 11 (2.3%) |
| 6:00 AM to 6:29 AM | 78 (11.8%) | 35 (7.4%) |
| 6:30 AM to 6:59 AM | 70 (10.6%) | 63 (13.4%) |
| 7:00 AM to 7:29 AM | 96 (14.5%) | 46 (9.8%) |
| 7:30 AM to 7:59 AM | 56 (8.5%) | 131 (27.8%) |
| 8:00 AM to 8:29 AM | 52 (7.9%) | 3 (0.6%) |
| 8:30 AM to 8:59 AM | 9 (1.4%) | 17 (3.6%) |
| 9:00 AM to 9:59 AM | 41 (6.2%) | 54 (11.5%) |
| 10:00 AM to 10:59 AM | 18 (2.7%) | 12 (2.5%) |
| 11:00 AM to 11:59 AM | 0 (0.0%) | 5 (1.1%) |
| 12:00 PM to 3:59 PM | 44 (6.7%) | 0 (0.0%) |
| 4:00 PM to 11:59 PM | 90 (13.6%) | 84 (17.8%) |
| Total | 660 (100.0%) | 471 (100.0%) |
Housing Occupancy in St Marys
Occupancy by Ownership in St Marys
Of the total 868 dwellings in St Marys, owner-occupied units account for 560 (64.5%), while renter-occupied units make up 308 (35.5%).
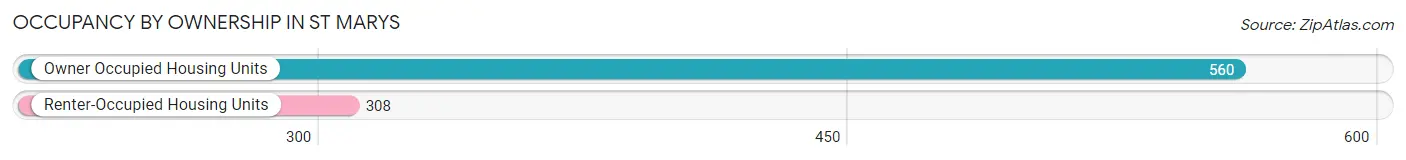
| Occupancy | # Housing Units | % Housing Units |
| Owner Occupied Housing Units | 560 | 64.5% |
| Renter-Occupied Housing Units | 308 | 35.5% |
| Total Occupied Housing Units | 868 | 100.0% |
Occupancy by Household Size in St Marys
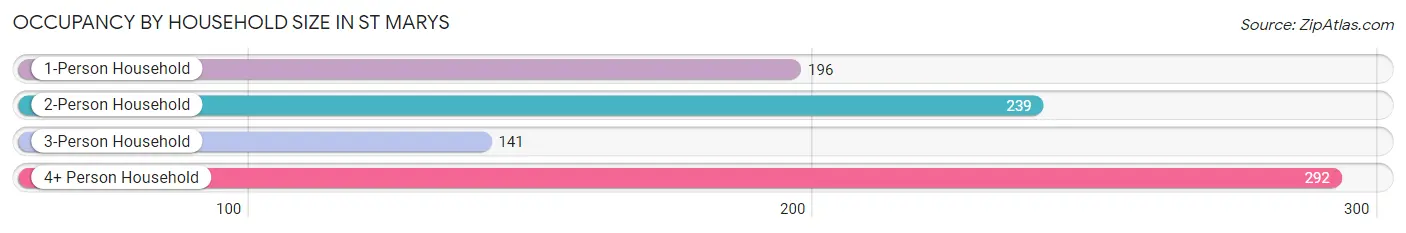
| Household Size | # Housing Units | % Housing Units |
| 1-Person Household | 196 | 22.6% |
| 2-Person Household | 239 | 27.5% |
| 3-Person Household | 141 | 16.2% |
| 4+ Person Household | 292 | 33.6% |
| Total Housing Units | 868 | 100.0% |
Occupancy by Ownership by Household Size in St Marys
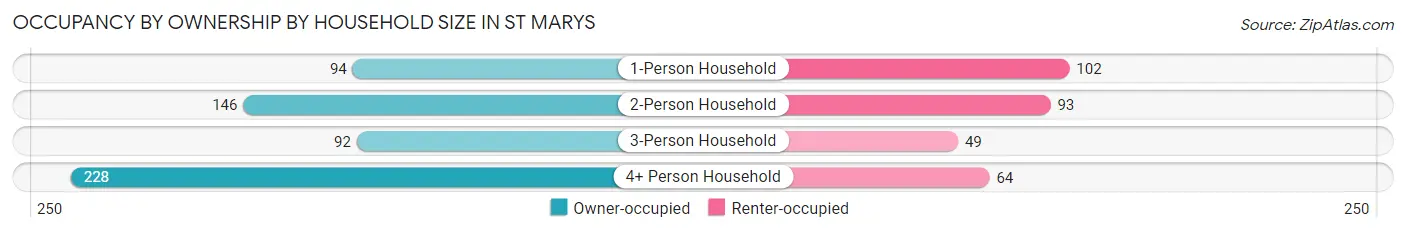
| Household Size | Owner-occupied | Renter-occupied |
| 1-Person Household | 94 (48.0%) | 102 (52.0%) |
| 2-Person Household | 146 (61.1%) | 93 (38.9%) |
| 3-Person Household | 92 (65.2%) | 49 (34.7%) |
| 4+ Person Household | 228 (78.1%) | 64 (21.9%) |
| Total Housing Units | 560 (64.5%) | 308 (35.5%) |
Occupancy by Educational Attainment in St Marys
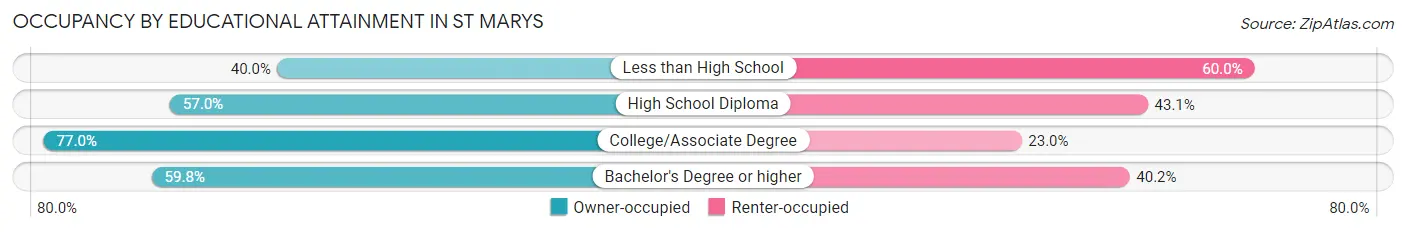
| Household Size | Owner-occupied | Renter-occupied |
| Less than High School | 6 (40.0%) | 9 (60.0%) |
| High School Diploma | 168 (57.0%) | 127 (43.0%) |
| College/Associate Degree | 234 (77.0%) | 70 (23.0%) |
| Bachelor's Degree or higher | 152 (59.8%) | 102 (40.2%) |
Occupancy by Age of Householder in St Marys
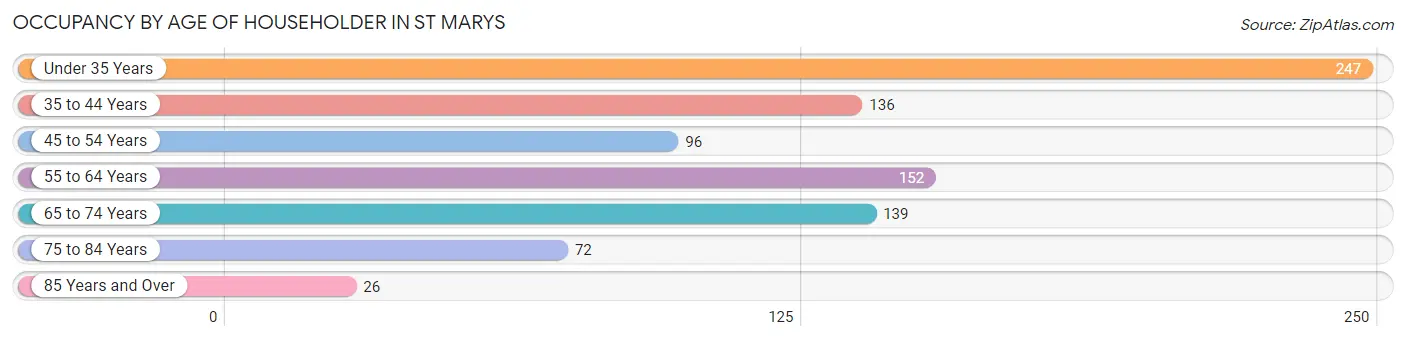
| Age Bracket | # Households | % Households |
| Under 35 Years | 247 | 28.5% |
| 35 to 44 Years | 136 | 15.7% |
| 45 to 54 Years | 96 | 11.1% |
| 55 to 64 Years | 152 | 17.5% |
| 65 to 74 Years | 139 | 16.0% |
| 75 to 84 Years | 72 | 8.3% |
| 85 Years and Over | 26 | 3.0% |
| Total | 868 | 100.0% |
Housing Finances in St Marys
Median Income by Occupancy in St Marys
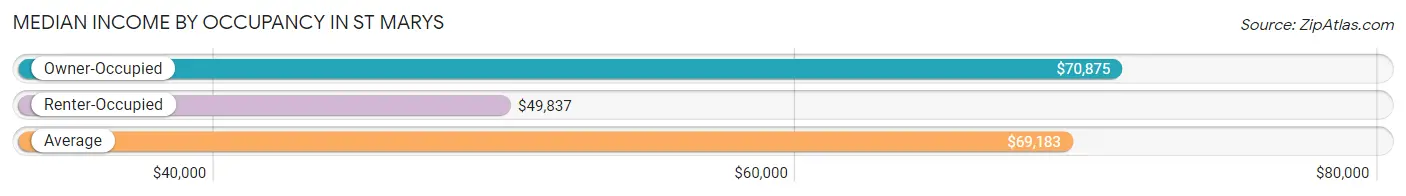
| Occupancy Type | # Households | Median Income |
| Owner-Occupied | 560 (64.5%) | $70,875 |
| Renter-Occupied | 308 (35.5%) | $49,837 |
| Average | 868 (100.0%) | $69,183 |
Occupancy by Householder Income Bracket in St Marys
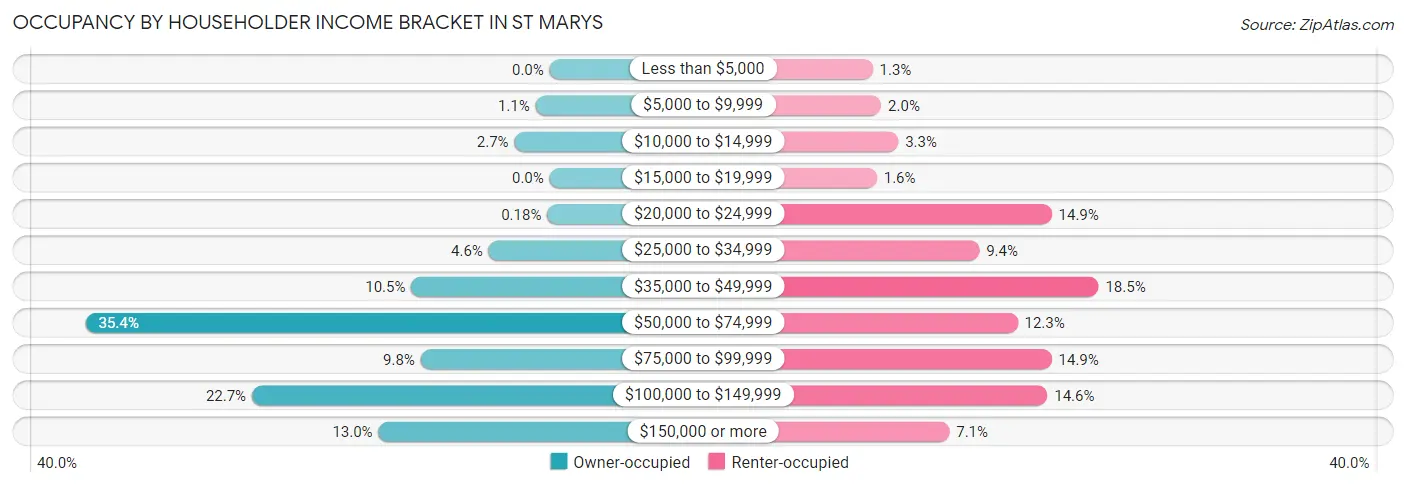
| Income Bracket | Owner-occupied | Renter-occupied |
| Less than $5,000 | 0 (0.0%) | 4 (1.3%) |
| $5,000 to $9,999 | 6 (1.1%) | 6 (1.9%) |
| $10,000 to $14,999 | 15 (2.7%) | 10 (3.3%) |
| $15,000 to $19,999 | 0 (0.0%) | 5 (1.6%) |
| $20,000 to $24,999 | 1 (0.2%) | 46 (14.9%) |
| $25,000 to $34,999 | 26 (4.6%) | 29 (9.4%) |
| $35,000 to $49,999 | 59 (10.5%) | 57 (18.5%) |
| $50,000 to $74,999 | 198 (35.4%) | 38 (12.3%) |
| $75,000 to $99,999 | 55 (9.8%) | 46 (14.9%) |
| $100,000 to $149,999 | 127 (22.7%) | 45 (14.6%) |
| $150,000 or more | 73 (13.0%) | 22 (7.1%) |
| Total | 560 (100.0%) | 308 (100.0%) |
Monthly Housing Cost Tiers in St Marys
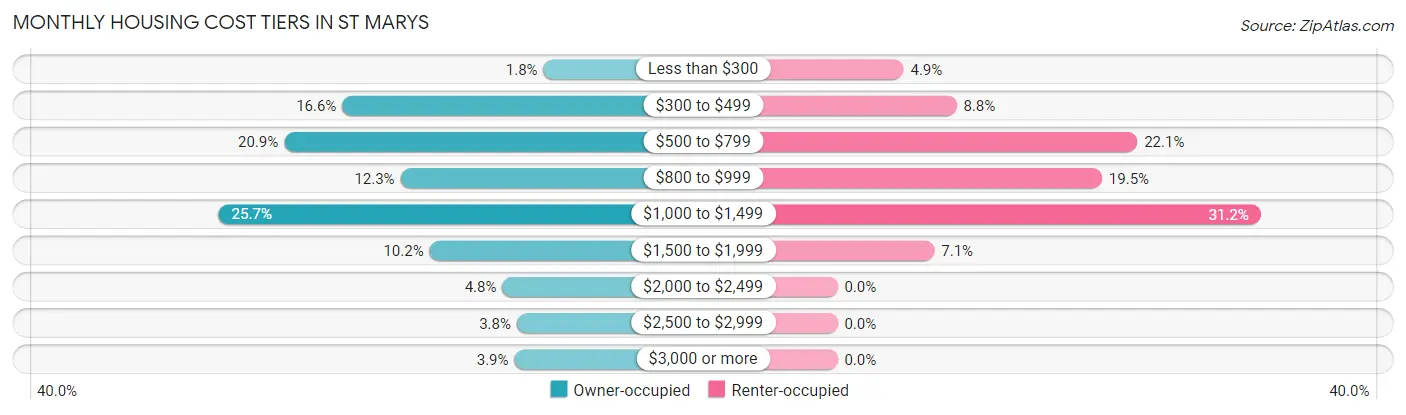
| Monthly Cost | Owner-occupied | Renter-occupied |
| Less than $300 | 10 (1.8%) | 15 (4.9%) |
| $300 to $499 | 93 (16.6%) | 27 (8.8%) |
| $500 to $799 | 117 (20.9%) | 68 (22.1%) |
| $800 to $999 | 69 (12.3%) | 60 (19.5%) |
| $1,000 to $1,499 | 144 (25.7%) | 96 (31.2%) |
| $1,500 to $1,999 | 57 (10.2%) | 22 (7.1%) |
| $2,000 to $2,499 | 27 (4.8%) | 0 (0.0%) |
| $2,500 to $2,999 | 21 (3.7%) | 0 (0.0%) |
| $3,000 or more | 22 (3.9%) | 0 (0.0%) |
| Total | 560 (100.0%) | 308 (100.0%) |
Physical Housing Characteristics in St Marys
Housing Structures in St Marys
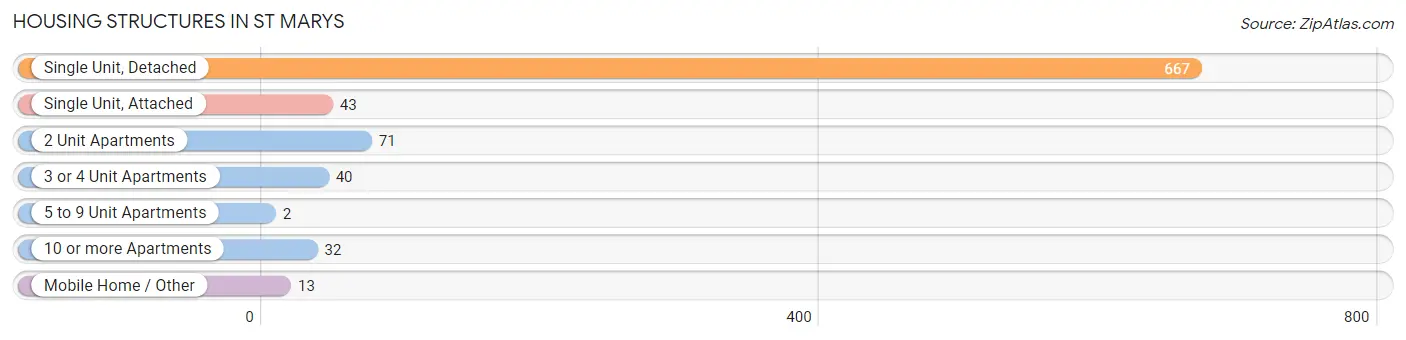
| Structure Type | # Housing Units | % Housing Units |
| Single Unit, Detached | 667 | 76.8% |
| Single Unit, Attached | 43 | 5.0% |
| 2 Unit Apartments | 71 | 8.2% |
| 3 or 4 Unit Apartments | 40 | 4.6% |
| 5 to 9 Unit Apartments | 2 | 0.2% |
| 10 or more Apartments | 32 | 3.7% |
| Mobile Home / Other | 13 | 1.5% |
| Total | 868 | 100.0% |
Housing Structures by Occupancy in St Marys
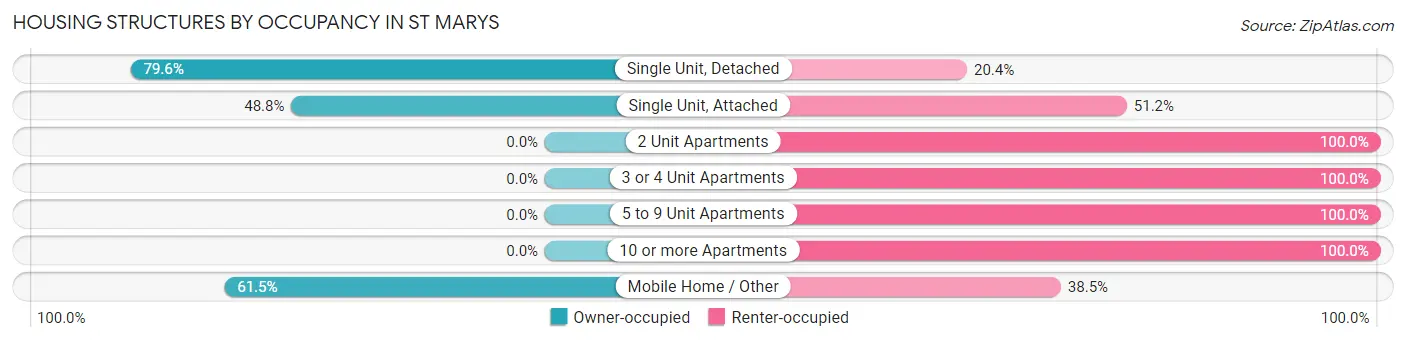
| Structure Type | Owner-occupied | Renter-occupied |
| Single Unit, Detached | 531 (79.6%) | 136 (20.4%) |
| Single Unit, Attached | 21 (48.8%) | 22 (51.2%) |
| 2 Unit Apartments | 0 (0.0%) | 71 (100.0%) |
| 3 or 4 Unit Apartments | 0 (0.0%) | 40 (100.0%) |
| 5 to 9 Unit Apartments | 0 (0.0%) | 2 (100.0%) |
| 10 or more Apartments | 0 (0.0%) | 32 (100.0%) |
| Mobile Home / Other | 8 (61.5%) | 5 (38.5%) |
| Total | 560 (64.5%) | 308 (35.5%) |
Housing Structures by Number of Rooms in St Marys
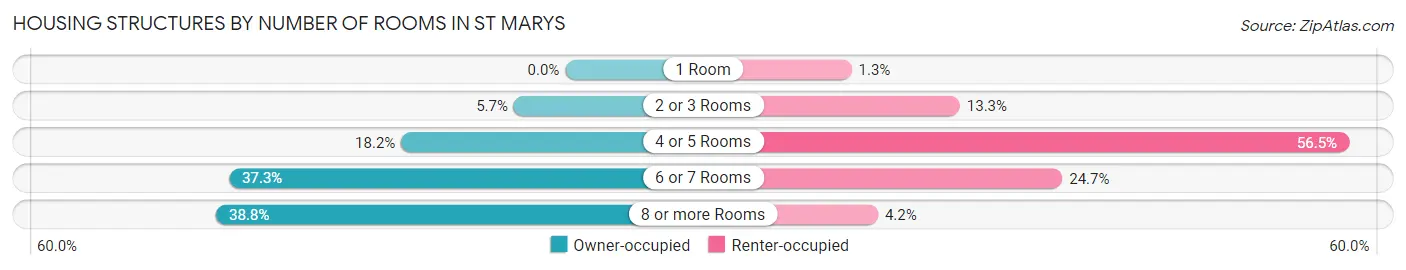
| Number of Rooms | Owner-occupied | Renter-occupied |
| 1 Room | 0 (0.0%) | 4 (1.3%) |
| 2 or 3 Rooms | 32 (5.7%) | 41 (13.3%) |
| 4 or 5 Rooms | 102 (18.2%) | 174 (56.5%) |
| 6 or 7 Rooms | 209 (37.3%) | 76 (24.7%) |
| 8 or more Rooms | 217 (38.8%) | 13 (4.2%) |
| Total | 560 (100.0%) | 308 (100.0%) |
Housing Structure by Heating Type in St Marys
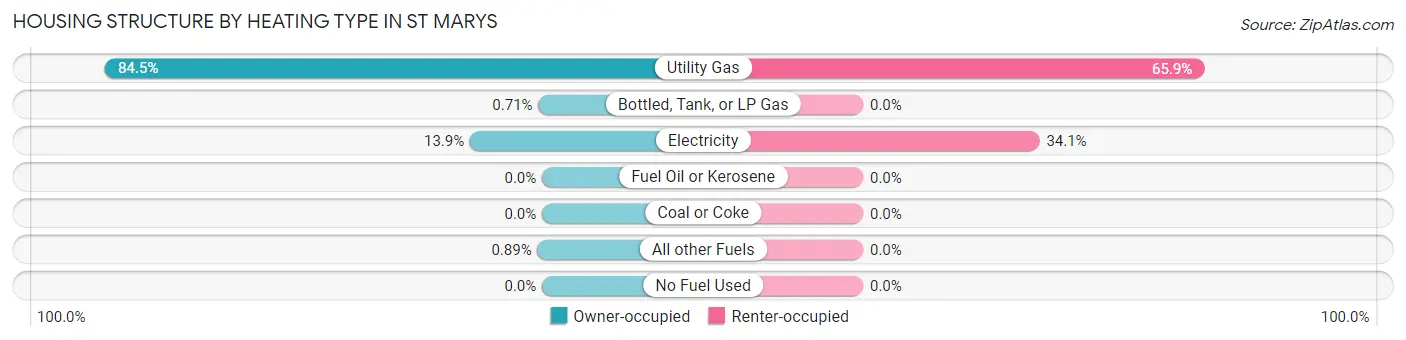
| Heating Type | Owner-occupied | Renter-occupied |
| Utility Gas | 473 (84.5%) | 203 (65.9%) |
| Bottled, Tank, or LP Gas | 4 (0.7%) | 0 (0.0%) |
| Electricity | 78 (13.9%) | 105 (34.1%) |
| Fuel Oil or Kerosene | 0 (0.0%) | 0 (0.0%) |
| Coal or Coke | 0 (0.0%) | 0 (0.0%) |
| All other Fuels | 5 (0.9%) | 0 (0.0%) |
| No Fuel Used | 0 (0.0%) | 0 (0.0%) |
| Total | 560 (100.0%) | 308 (100.0%) |
Household Vehicle Usage in St Marys
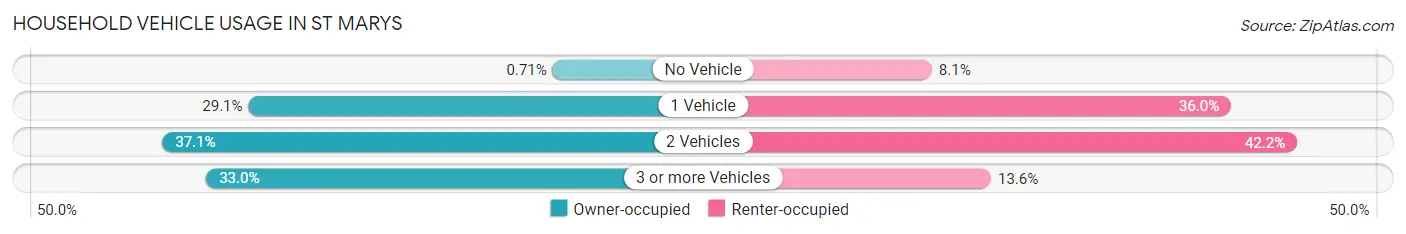
| Vehicles per Household | Owner-occupied | Renter-occupied |
| No Vehicle | 4 (0.7%) | 25 (8.1%) |
| 1 Vehicle | 163 (29.1%) | 111 (36.0%) |
| 2 Vehicles | 208 (37.1%) | 130 (42.2%) |
| 3 or more Vehicles | 185 (33.0%) | 42 (13.6%) |
| Total | 560 (100.0%) | 308 (100.0%) |
Real Estate & Mortgages in St Marys
Real Estate and Mortgage Overview in St Marys
| Characteristic | Without Mortgage | With Mortgage |
| Housing Units | 237 | 323 |
| Median Property Value | $189,300 | $177,100 |
| Median Household Income | $66,563 | $57 |
| Monthly Housing Costs | $578 | $16 |
| Real Estate Taxes | $1,950 | $0 |
Property Value by Mortgage Status in St Marys
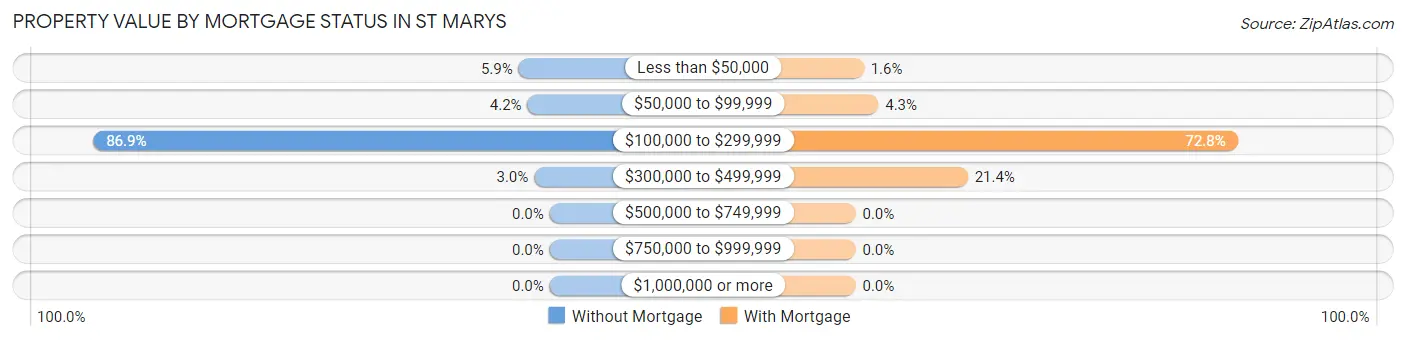
| Property Value | Without Mortgage | With Mortgage |
| Less than $50,000 | 14 (5.9%) | 5 (1.5%) |
| $50,000 to $99,999 | 10 (4.2%) | 14 (4.3%) |
| $100,000 to $299,999 | 206 (86.9%) | 235 (72.8%) |
| $300,000 to $499,999 | 7 (2.9%) | 69 (21.4%) |
| $500,000 to $749,999 | 0 (0.0%) | 0 (0.0%) |
| $750,000 to $999,999 | 0 (0.0%) | 0 (0.0%) |
| $1,000,000 or more | 0 (0.0%) | 0 (0.0%) |
| Total | 237 (100.0%) | 323 (100.0%) |
Household Income by Mortgage Status in St Marys
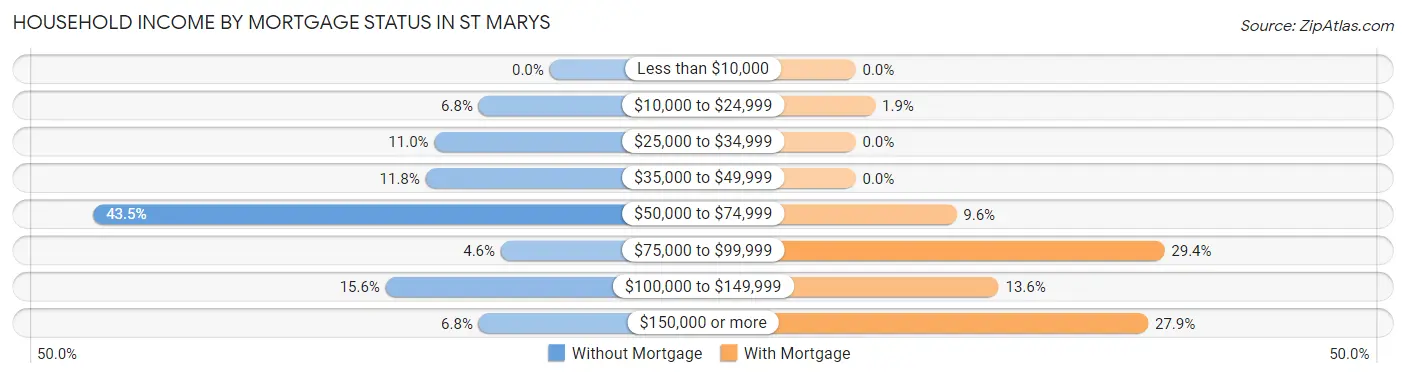
| Household Income | Without Mortgage | With Mortgage |
| Less than $10,000 | 0 (0.0%) | 0 (0.0%) |
| $10,000 to $24,999 | 16 (6.8%) | 6 (1.9%) |
| $25,000 to $34,999 | 26 (11.0%) | 0 (0.0%) |
| $35,000 to $49,999 | 28 (11.8%) | 0 (0.0%) |
| $50,000 to $74,999 | 103 (43.5%) | 31 (9.6%) |
| $75,000 to $99,999 | 11 (4.6%) | 95 (29.4%) |
| $100,000 to $149,999 | 37 (15.6%) | 44 (13.6%) |
| $150,000 or more | 16 (6.8%) | 90 (27.9%) |
| Total | 237 (100.0%) | 323 (100.0%) |
Property Value to Household Income Ratio in St Marys
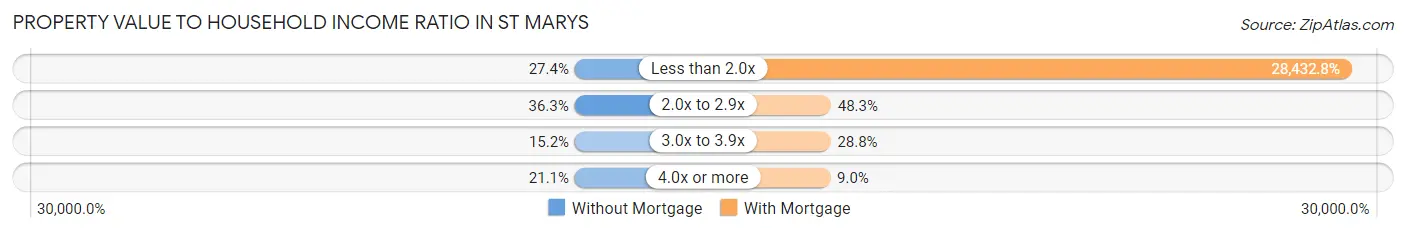
| Value-to-Income Ratio | Without Mortgage | With Mortgage |
| Less than 2.0x | 65 (27.4%) | 91,838 (28,432.8%) |
| 2.0x to 2.9x | 86 (36.3%) | 156 (48.3%) |
| 3.0x to 3.9x | 36 (15.2%) | 93 (28.8%) |
| 4.0x or more | 50 (21.1%) | 29 (9.0%) |
| Total | 237 (100.0%) | 323 (100.0%) |
Real Estate Taxes by Mortgage Status in St Marys
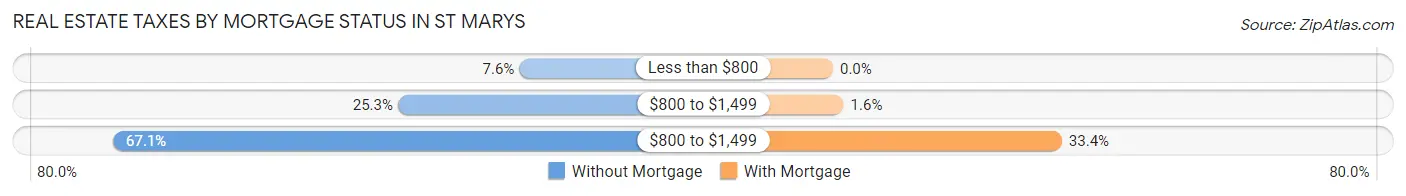
| Property Taxes | Without Mortgage | With Mortgage |
| Less than $800 | 18 (7.6%) | 0 (0.0%) |
| $800 to $1,499 | 60 (25.3%) | 5 (1.5%) |
| $800 to $1,499 | 159 (67.1%) | 108 (33.4%) |
| Total | 237 (100.0%) | 323 (100.0%) |
Health & Disability in St Marys
Health Insurance Coverage by Age in St Marys
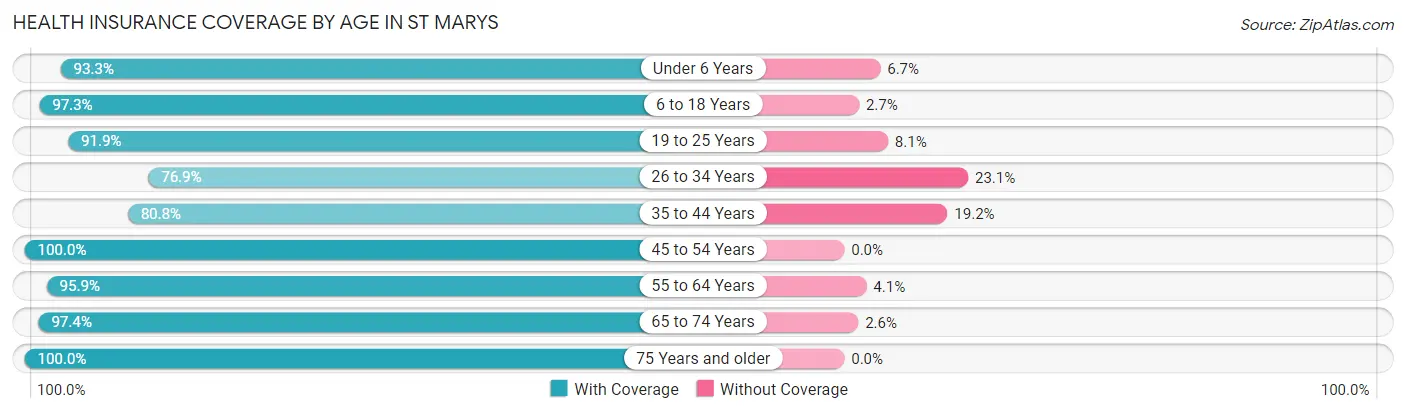
| Age Bracket | With Coverage | Without Coverage |
| Under 6 Years | 292 (93.3%) | 21 (6.7%) |
| 6 to 18 Years | 533 (97.3%) | 15 (2.7%) |
| 19 to 25 Years | 407 (91.9%) | 36 (8.1%) |
| 26 to 34 Years | 250 (76.9%) | 75 (23.1%) |
| 35 to 44 Years | 168 (80.8%) | 40 (19.2%) |
| 45 to 54 Years | 164 (100.0%) | 0 (0.0%) |
| 55 to 64 Years | 256 (95.9%) | 11 (4.1%) |
| 65 to 74 Years | 225 (97.4%) | 6 (2.6%) |
| 75 Years and older | 133 (100.0%) | 0 (0.0%) |
| Total | 2,428 (92.2%) | 204 (7.7%) |
Health Insurance Coverage by Citizenship Status in St Marys
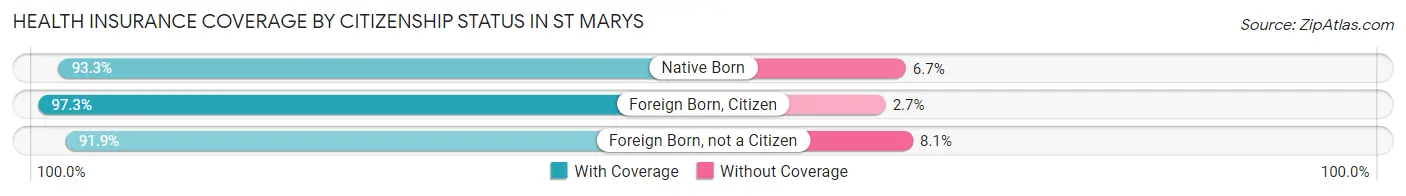
| Citizenship Status | With Coverage | Without Coverage |
| Native Born | 292 (93.3%) | 21 (6.7%) |
| Foreign Born, Citizen | 533 (97.3%) | 15 (2.7%) |
| Foreign Born, not a Citizen | 407 (91.9%) | 36 (8.1%) |
Health Insurance Coverage by Household Income in St Marys
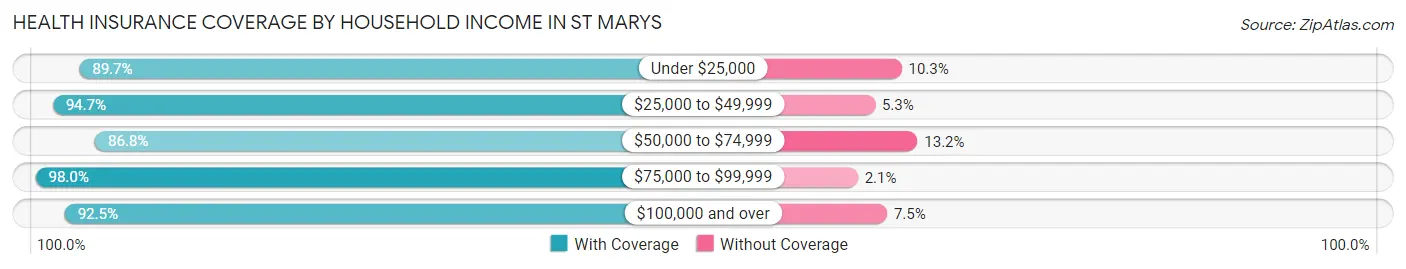
| Household Income | With Coverage | Without Coverage |
| Under $25,000 | 105 (89.7%) | 12 (10.3%) |
| $25,000 to $49,999 | 287 (94.7%) | 16 (5.3%) |
| $50,000 to $74,999 | 558 (86.8%) | 85 (13.2%) |
| $75,000 to $99,999 | 477 (98.0%) | 10 (2.1%) |
| $100,000 and over | 994 (92.5%) | 81 (7.5%) |
Public vs Private Health Insurance Coverage by Age in St Marys
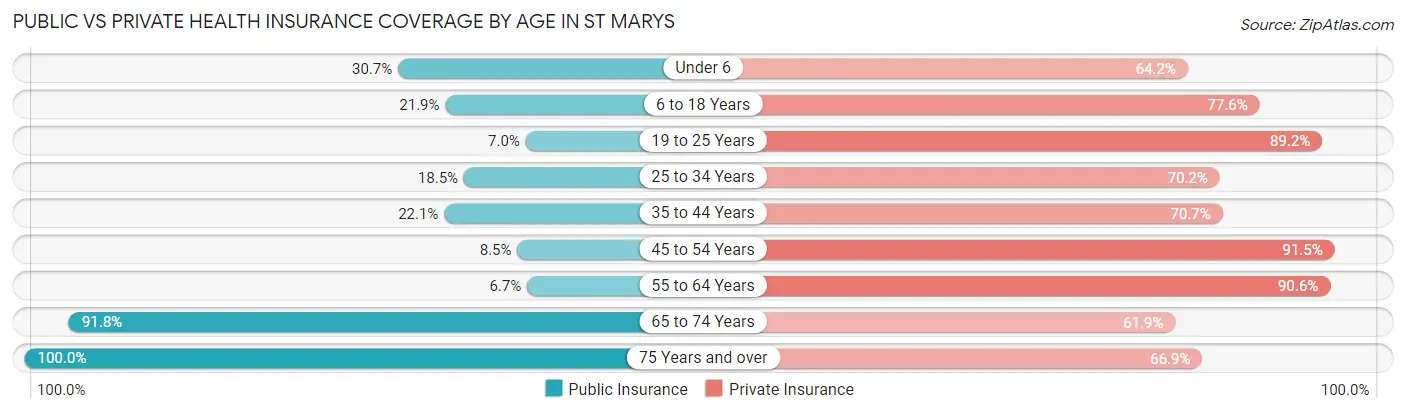
| Age Bracket | Public Insurance | Private Insurance |
| Under 6 | 96 (30.7%) | 201 (64.2%) |
| 6 to 18 Years | 120 (21.9%) | 425 (77.5%) |
| 19 to 25 Years | 31 (7.0%) | 395 (89.2%) |
| 25 to 34 Years | 60 (18.5%) | 228 (70.2%) |
| 35 to 44 Years | 46 (22.1%) | 147 (70.7%) |
| 45 to 54 Years | 14 (8.5%) | 150 (91.5%) |
| 55 to 64 Years | 18 (6.7%) | 242 (90.6%) |
| 65 to 74 Years | 212 (91.8%) | 143 (61.9%) |
| 75 Years and over | 133 (100.0%) | 89 (66.9%) |
| Total | 730 (27.7%) | 2,020 (76.7%) |
Disability Status by Sex by Age in St Marys
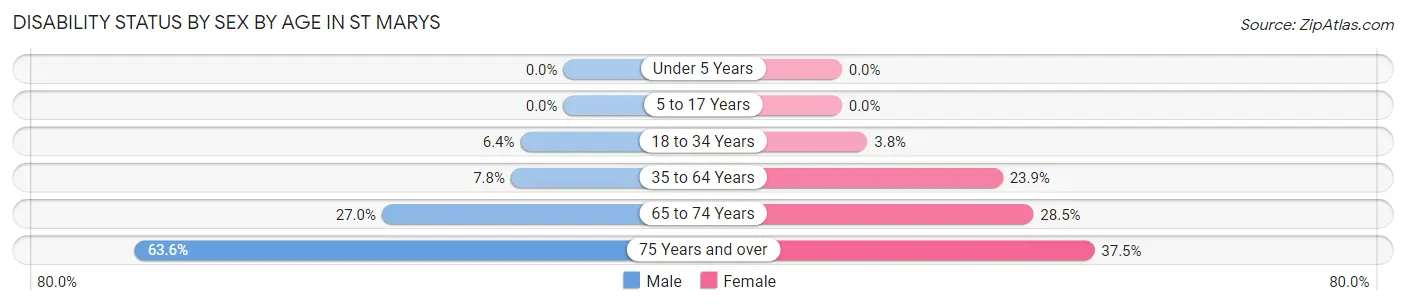
| Age Bracket | Male | Female |
| Under 5 Years | 0 (0.0%) | 0 (0.0%) |
| 5 to 17 Years | 0 (0.0%) | 0 (0.0%) |
| 18 to 34 Years | 24 (6.4%) | 18 (3.8%) |
| 35 to 64 Years | 27 (7.8%) | 70 (23.9%) |
| 65 to 74 Years | 31 (27.0%) | 33 (28.4%) |
| 75 Years and over | 49 (63.6%) | 21 (37.5%) |
Disability Class by Sex by Age in St Marys
Disability Class: Hearing Difficulty
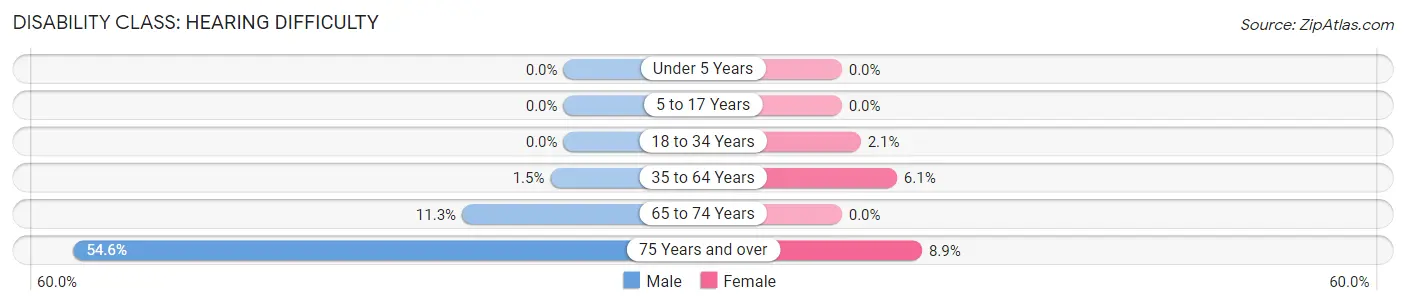
| Age Bracket | Male | Female |
| Under 5 Years | 0 (0.0%) | 0 (0.0%) |
| 5 to 17 Years | 0 (0.0%) | 0 (0.0%) |
| 18 to 34 Years | 0 (0.0%) | 10 (2.1%) |
| 35 to 64 Years | 5 (1.5%) | 18 (6.1%) |
| 65 to 74 Years | 13 (11.3%) | 0 (0.0%) |
| 75 Years and over | 42 (54.5%) | 5 (8.9%) |
Disability Class: Vision Difficulty
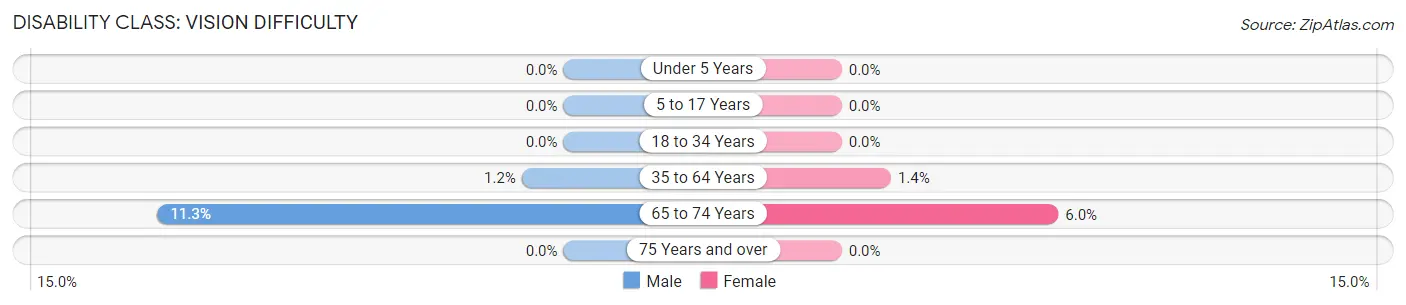
| Age Bracket | Male | Female |
| Under 5 Years | 0 (0.0%) | 0 (0.0%) |
| 5 to 17 Years | 0 (0.0%) | 0 (0.0%) |
| 18 to 34 Years | 0 (0.0%) | 0 (0.0%) |
| 35 to 64 Years | 4 (1.2%) | 4 (1.4%) |
| 65 to 74 Years | 13 (11.3%) | 7 (6.0%) |
| 75 Years and over | 0 (0.0%) | 0 (0.0%) |
Disability Class: Cognitive Difficulty
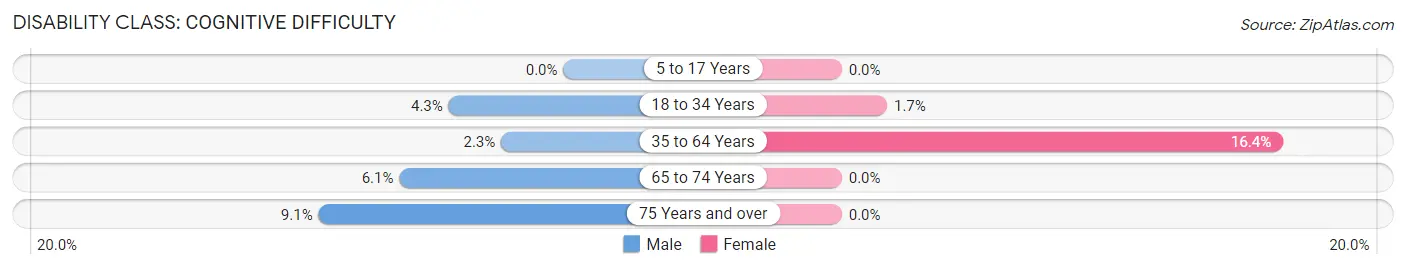
| Age Bracket | Male | Female |
| 5 to 17 Years | 0 (0.0%) | 0 (0.0%) |
| 18 to 34 Years | 16 (4.3%) | 8 (1.7%) |
| 35 to 64 Years | 8 (2.3%) | 48 (16.4%) |
| 65 to 74 Years | 7 (6.1%) | 0 (0.0%) |
| 75 Years and over | 7 (9.1%) | 0 (0.0%) |
Disability Class: Ambulatory Difficulty
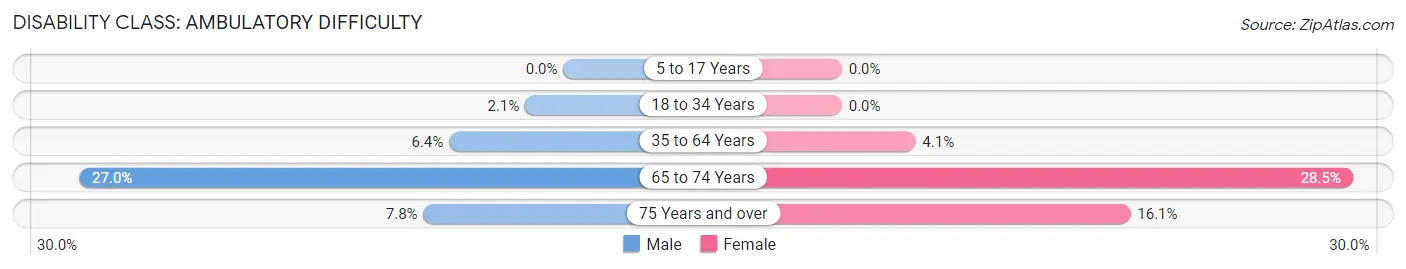
| Age Bracket | Male | Female |
| 5 to 17 Years | 0 (0.0%) | 0 (0.0%) |
| 18 to 34 Years | 8 (2.1%) | 0 (0.0%) |
| 35 to 64 Years | 22 (6.4%) | 12 (4.1%) |
| 65 to 74 Years | 31 (27.0%) | 33 (28.4%) |
| 75 Years and over | 6 (7.8%) | 9 (16.1%) |
Disability Class: Self-Care Difficulty
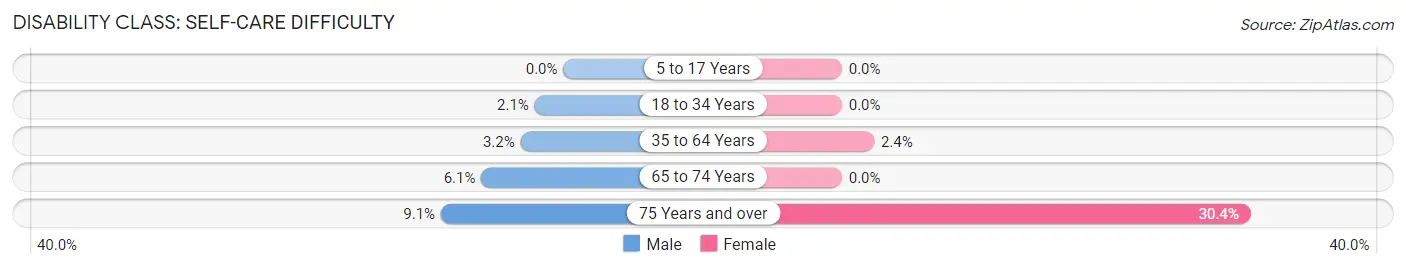
| Age Bracket | Male | Female |
| 5 to 17 Years | 0 (0.0%) | 0 (0.0%) |
| 18 to 34 Years | 8 (2.1%) | 0 (0.0%) |
| 35 to 64 Years | 11 (3.2%) | 7 (2.4%) |
| 65 to 74 Years | 7 (6.1%) | 0 (0.0%) |
| 75 Years and over | 7 (9.1%) | 17 (30.4%) |
Technology Access in St Marys
Computing Device Access in St Marys
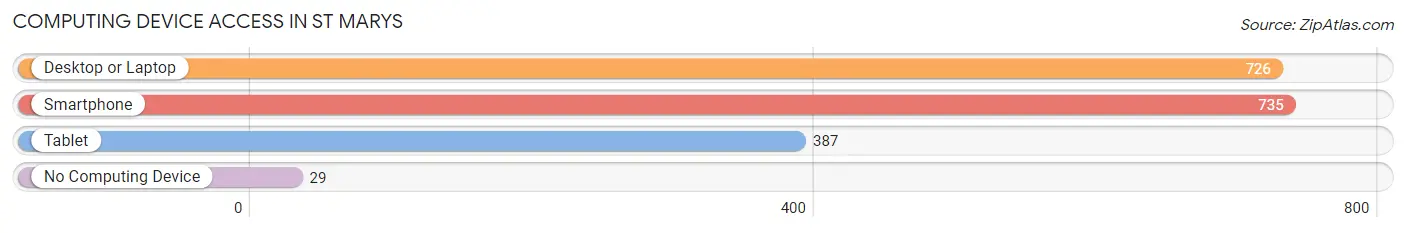
| Device Type | # Households | % Households |
| Desktop or Laptop | 726 | 83.6% |
| Smartphone | 735 | 84.7% |
| Tablet | 387 | 44.6% |
| No Computing Device | 29 | 3.3% |
| Total | 868 | 100.0% |
Internet Access in St Marys
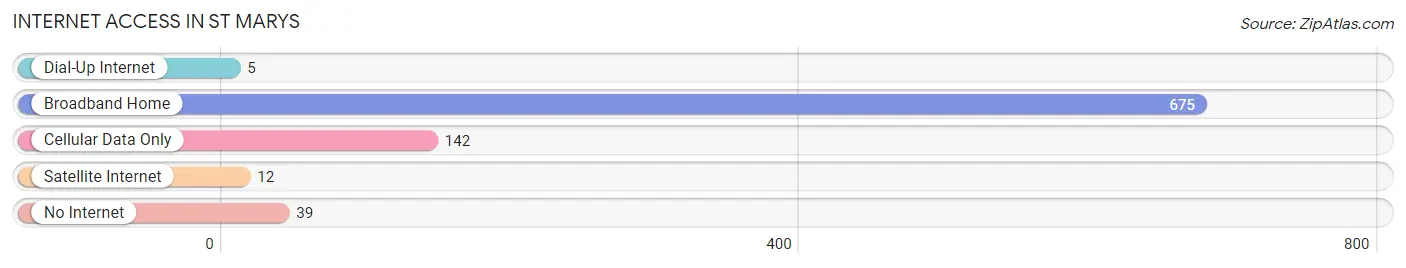
| Internet Type | # Households | % Households |
| Dial-Up Internet | 5 | 0.6% |
| Broadband Home | 675 | 77.8% |
| Cellular Data Only | 142 | 16.4% |
| Satellite Internet | 12 | 1.4% |
| No Internet | 39 | 4.5% |
| Total | 868 | 100.0% |
St Marys Summary
St Marys, Kansas is a small city located in Pottawatomie County, Kansas. It is situated on the banks of the Kansas River, about 25 miles east of Topeka. The city has a population of approximately 2,500 people and is part of the Manhattan, Kansas Metropolitan Statistical Area.
History
St Marys was founded in 1855 by a group of German Catholic immigrants who had come to the area from Pennsylvania. The town was named after the Virgin Mary, and the settlers built a church in her honor. The church still stands today and is the oldest building in St Marys.
The town grew slowly but steadily over the years, and by the early 1900s, it had become a thriving community. The town was home to a variety of businesses, including a flour mill, a creamery, a blacksmith shop, and a general store.
In the 1950s, St Marys began to experience a period of growth and development. The town was connected to the rest of the state by the Kansas Turnpike, and the population began to increase. The town also saw the construction of a new school, a library, and a hospital.
Geography
St Marys is located in the Flint Hills region of Kansas. The city is situated on the banks of the Kansas River, and the surrounding area is characterized by rolling hills and grassy plains. The climate in St Marys is generally mild, with hot summers and cold winters.
Economy
St Marys is a small city, and the economy is largely based on agriculture. The town is home to several farms, and the surrounding area is known for its production of wheat, corn, and soybeans.
The town also has a few small businesses, including a grocery store, a hardware store, and a few restaurants. The town is also home to a few manufacturing companies, including a plastics factory and a metal fabrication plant.
Demographics
As of the 2010 census, St Marys had a population of 2,500 people. The racial makeup of the city was 95.2% White, 0.8% African American, 0.4% Native American, 0.4% Asian, 0.2% Pacific Islander, and 2.8% from other races. Hispanic or Latino of any race were 4.4% of the population.
The median household income in St Marys was $41,250, and the median family income was $50,000. The per capita income was $20,845. About 11.2% of families and 14.2% of the population were below the poverty line, including 18.2% of those under age 18 and 8.2% of those age 65 or over.
St Marys is a small city with a rich history and a strong sense of community. The town is home to a variety of businesses, and the surrounding area is known for its agricultural production. The town has a diverse population, and the median household income is slightly above the national average.
Common Questions
What is Per Capita Income in St Marys?
Per Capita income in St Marys is $28,028.
What is the Median Family Income in St Marys?
Median Family Income in St Marys is $76,563.
What is the Median Household income in St Marys?
Median Household Income in St Marys is $69,183.
What is Income or Wage Gap in St Marys?
Income or Wage Gap in St Marys is 47.7%.
Women in St Marys earn 52.3 cents for every dollar earned by a man.
What is Inequality or Gini Index in St Marys?
Inequality or Gini Index in St Marys is 0.36.
What is the Total Population of St Marys?
Total Population of St Marys is 2,661.
What is the Total Male Population of St Marys?
Total Male Population of St Marys is 1,349.
What is the Total Female Population of St Marys?
Total Female Population of St Marys is 1,312.
What is the Ratio of Males per 100 Females in St Marys?
There are 102.82 Males per 100 Females in St Marys.
What is the Ratio of Females per 100 Males in St Marys?
There are 97.26 Females per 100 Males in St Marys.
What is the Median Population Age in St Marys?
Median Population Age in St Marys is 26.4 Years.
What is the Average Family Size in St Marys
Average Family Size in St Marys is 3.6 People.
What is the Average Household Size in St Marys
Average Household Size in St Marys is 3.0 People.
How Large is the Labor Force in St Marys?
There are 1,260 People in the Labor Forcein in St Marys.
What is the Percentage of People in the Labor Force in St Marys?
63.9% of People are in the Labor Force in St Marys.
What is the Unemployment Rate in St Marys?
Unemployment Rate in St Marys is 3.1%.