Plains, KS Map & Demographics
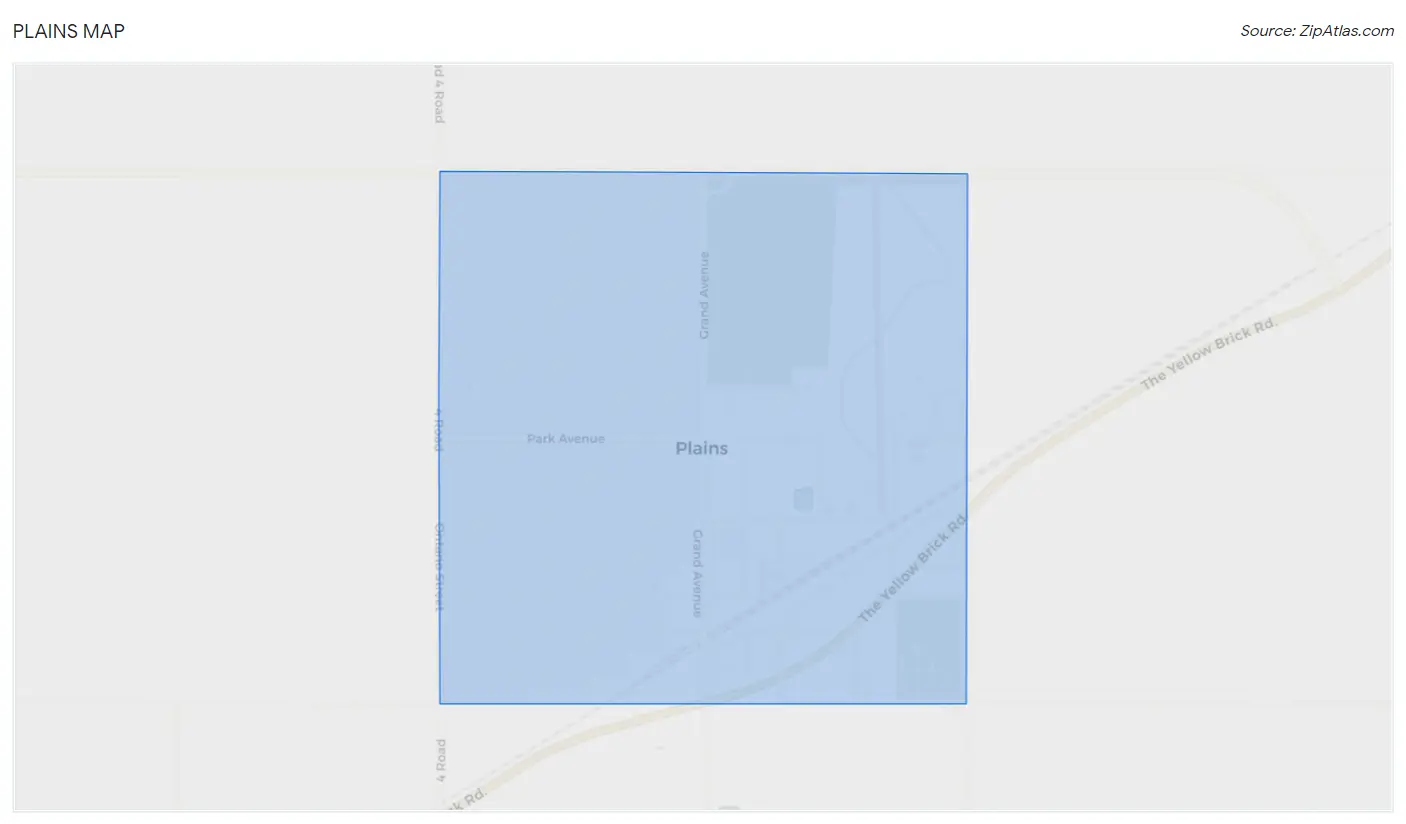
Plains Map
Plains Overview
$33,231
PER CAPITA INCOME
$81,875
AVG FAMILY INCOME
$72,222
AVG HOUSEHOLD INCOME
51.6%
WAGE / INCOME GAP [ % ]
48.4¢/ $1
WAGE / INCOME GAP [ $ ]
0.41
INEQUALITY / GINI INDEX
1,266
TOTAL POPULATION
647
MALE POPULATION
619
FEMALE POPULATION
104.52
MALES / 100 FEMALES
95.67
FEMALES / 100 MALES
29.6
MEDIAN AGE
3.3
AVG FAMILY SIZE
2.8
AVG HOUSEHOLD SIZE
612
LABOR FORCE [ PEOPLE ]
69.2%
PERCENT IN LABOR FORCE
1.8%
UNEMPLOYMENT RATE
Plains Zip Codes
Plains Area Codes
Income in Plains
Income Overview in Plains
Per Capita Income in Plains is $33,231, while median incomes of families and households are $81,875 and $72,222 respectively.
| Characteristic | Number | Measure |
| Per Capita Income | 1,266 | $33,231 |
| Median Family Income | 340 | $81,875 |
| Mean Family Income | 340 | $100,026 |
| Median Household Income | 448 | $72,222 |
| Mean Household Income | 448 | $94,205 |
| Income Deficit | 340 | $0 |
| Wage / Income Gap (%) | 1,266 | 51.57% |
| Wage / Income Gap ($) | 1,266 | 48.43¢ per $1 |
| Gini / Inequality Index | 1,266 | 0.41 |
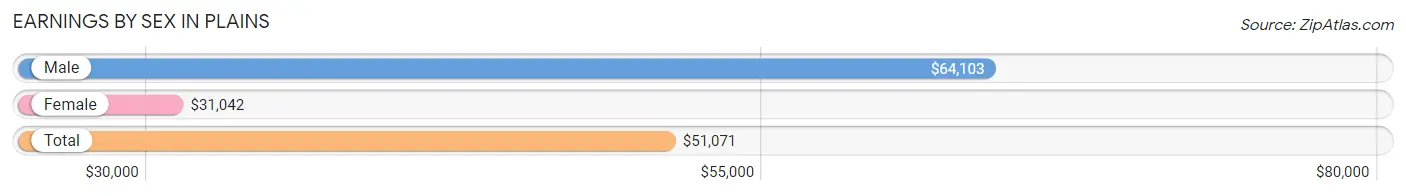
Earnings by Sex in Plains
Average Earnings in Plains are $51,071, $64,103 for men and $31,042 for women, a difference of 51.6%.
| Sex | Number | Average Earnings |
| Male | 349 (53.0%) | $64,103 |
| Female | 309 (47.0%) | $31,042 |
| Total | 658 (100.0%) | $51,071 |
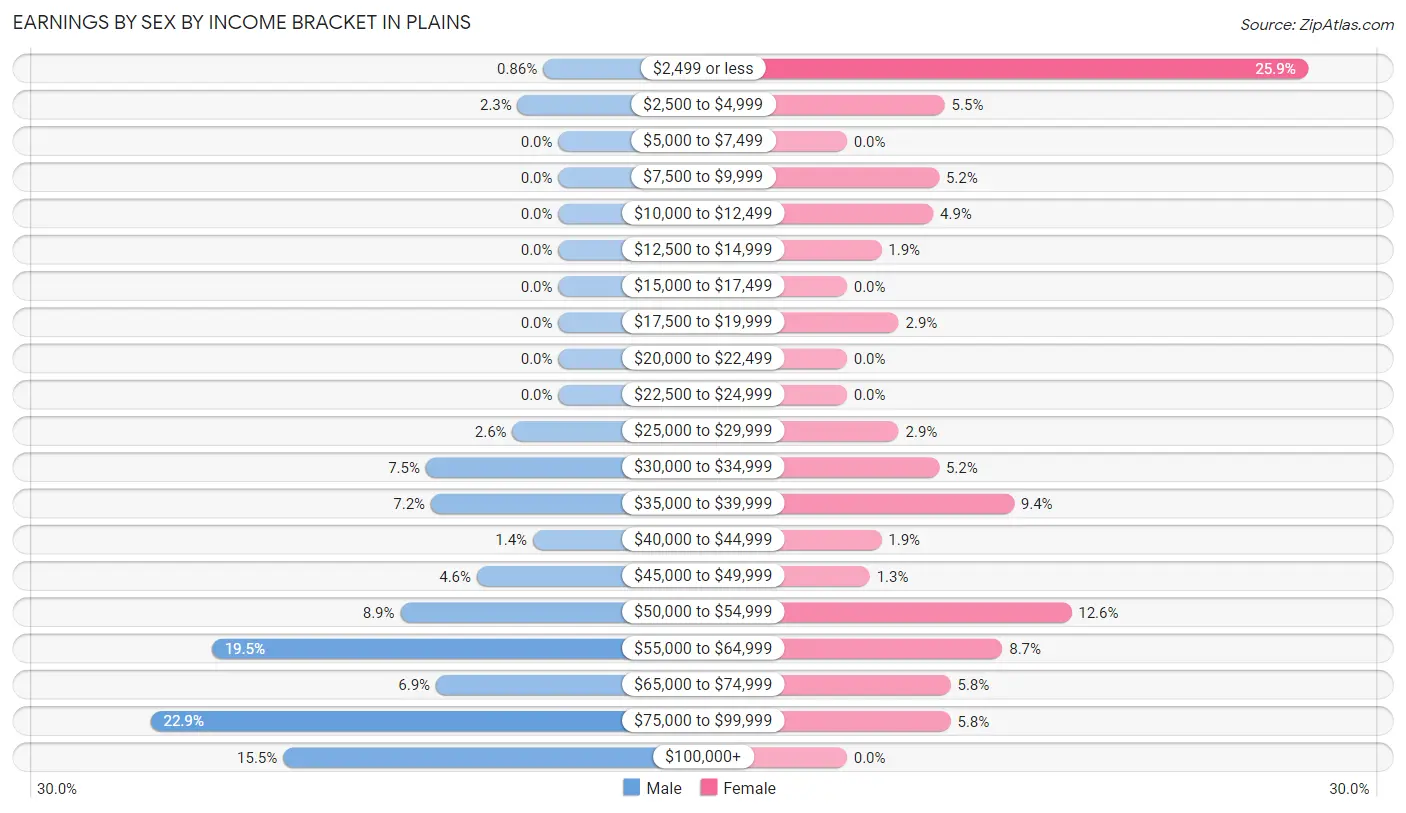
Earnings by Sex by Income Bracket in Plains
The most common earnings brackets in Plains are $75,000 to $99,999 for men (80 | 22.9%) and $2,499 or less for women (80 | 25.9%).
| Income | Male | Female |
| $2,499 or less | 3 (0.9%) | 80 (25.9%) |
| $2,500 to $4,999 | 8 (2.3%) | 17 (5.5%) |
| $5,000 to $7,499 | 0 (0.0%) | 0 (0.0%) |
| $7,500 to $9,999 | 0 (0.0%) | 16 (5.2%) |
| $10,000 to $12,499 | 0 (0.0%) | 15 (4.9%) |
| $12,500 to $14,999 | 0 (0.0%) | 6 (1.9%) |
| $15,000 to $17,499 | 0 (0.0%) | 0 (0.0%) |
| $17,500 to $19,999 | 0 (0.0%) | 9 (2.9%) |
| $20,000 to $22,499 | 0 (0.0%) | 0 (0.0%) |
| $22,500 to $24,999 | 0 (0.0%) | 0 (0.0%) |
| $25,000 to $29,999 | 9 (2.6%) | 9 (2.9%) |
| $30,000 to $34,999 | 26 (7.4%) | 16 (5.2%) |
| $35,000 to $39,999 | 25 (7.2%) | 29 (9.4%) |
| $40,000 to $44,999 | 5 (1.4%) | 6 (1.9%) |
| $45,000 to $49,999 | 16 (4.6%) | 4 (1.3%) |
| $50,000 to $54,999 | 31 (8.9%) | 39 (12.6%) |
| $55,000 to $64,999 | 68 (19.5%) | 27 (8.7%) |
| $65,000 to $74,999 | 24 (6.9%) | 18 (5.8%) |
| $75,000 to $99,999 | 80 (22.9%) | 18 (5.8%) |
| $100,000+ | 54 (15.5%) | 0 (0.0%) |
| Total | 349 (100.0%) | 309 (100.0%) |
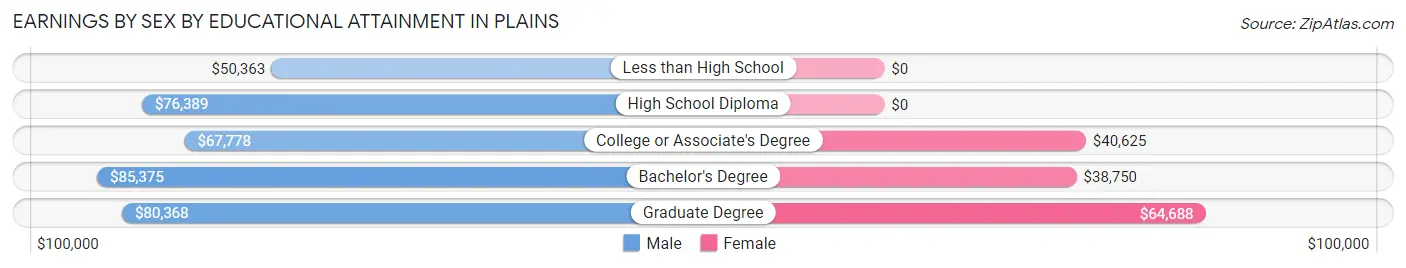
Earnings by Sex by Educational Attainment in Plains
Average earnings in Plains are $67,344 for men and $48,438 for women, a difference of 28.1%. Men with an educational attainment of bachelor's degree enjoy the highest average annual earnings of $85,375, while those with less than high school education earn the least with $50,363. Women with an educational attainment of graduate degree earn the most with the average annual earnings of $64,688, while those with bachelor's degree education have the smallest earnings of $38,750.
| Educational Attainment | Male Income | Female Income |
| Less than High School | $50,363 | $0 |
| High School Diploma | $76,389 | $0 |
| College or Associate's Degree | $67,778 | $40,625 |
| Bachelor's Degree | $85,375 | $38,750 |
| Graduate Degree | $80,368 | $64,688 |
| Total | $67,344 | $48,438 |
Family Income in Plains
Family Income Brackets in Plains
According to the Plains family income data, there are 98 families falling into the $75,000 to $99,999 income range, which is the most common income bracket and makes up 28.8% of all families.
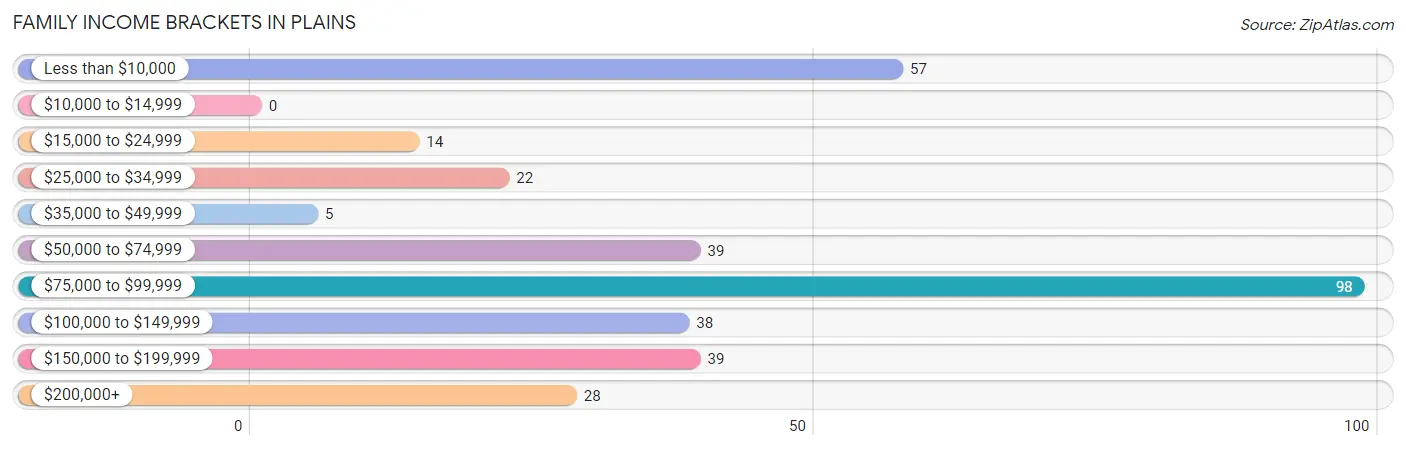
| Income Bracket | # Families | % Families |
| Less than $10,000 | 57 | 16.8% |
| $10,000 to $14,999 | 0 | 0.0% |
| $15,000 to $24,999 | 14 | 4.1% |
| $25,000 to $34,999 | 22 | 6.5% |
| $35,000 to $49,999 | 5 | 1.5% |
| $50,000 to $74,999 | 39 | 11.5% |
| $75,000 to $99,999 | 98 | 28.8% |
| $100,000 to $149,999 | 38 | 11.2% |
| $150,000 to $199,999 | 39 | 11.5% |
| $200,000+ | 28 | 8.2% |
Family Income by Famaliy Size in Plains
4-person families (82 | 24.1%) account for the highest median family income in Plains with $145,000 per family, while 4-person families (82 | 24.1%) have the highest median income of $36,250 per family member.
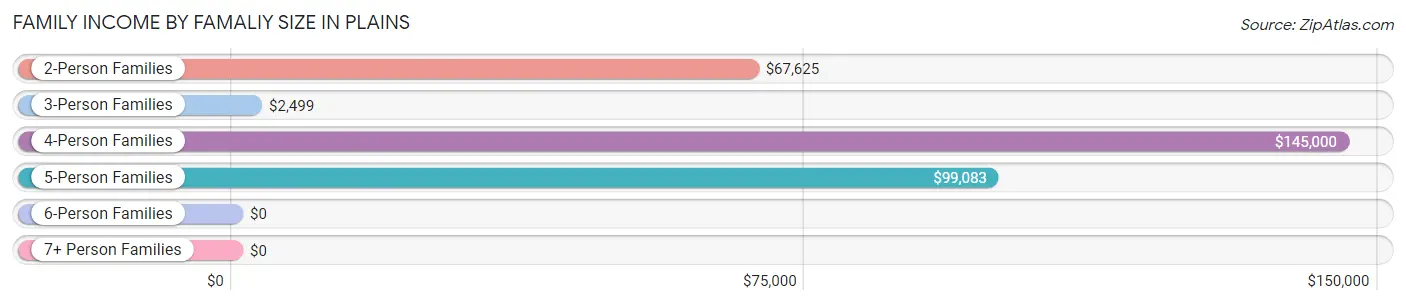
| Income Bracket | # Families | Median Income |
| 2-Person Families | 101 (29.7%) | $67,625 |
| 3-Person Families | 90 (26.5%) | $2,499 |
| 4-Person Families | 82 (24.1%) | $145,000 |
| 5-Person Families | 51 (15.0%) | $99,083 |
| 6-Person Families | 11 (3.2%) | $0 |
| 7+ Person Families | 5 (1.5%) | $0 |
| Total | 340 (100.0%) | $81,875 |
Family Income by Number of Earners in Plains
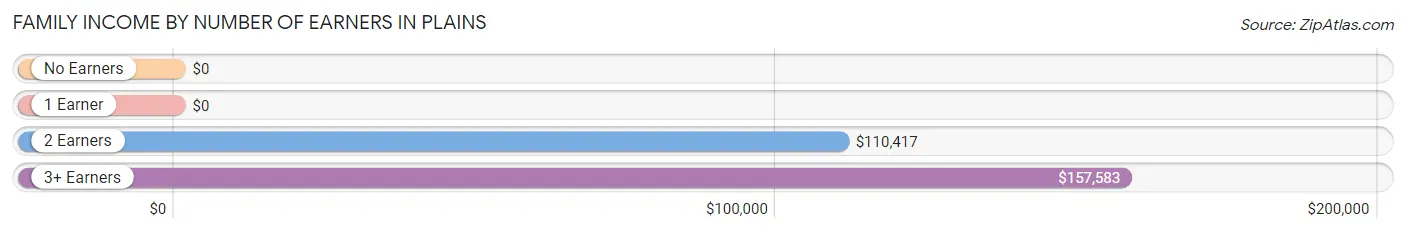
| Number of Earners | # Families | Median Income |
| No Earners | 31 (9.1%) | $0 |
| 1 Earner | 125 (36.8%) | $0 |
| 2 Earners | 151 (44.4%) | $110,417 |
| 3+ Earners | 33 (9.7%) | $157,583 |
| Total | 340 (100.0%) | $81,875 |
Household Income in Plains
Household Income Brackets in Plains
With 118 households falling in the category, the $50,000 to $74,999 income range is the most frequent in Plains, accounting for 26.3% of all households. In contrast, only 13 households (2.9%) fall into the less than $10,000 income bracket, making it the least populous group.
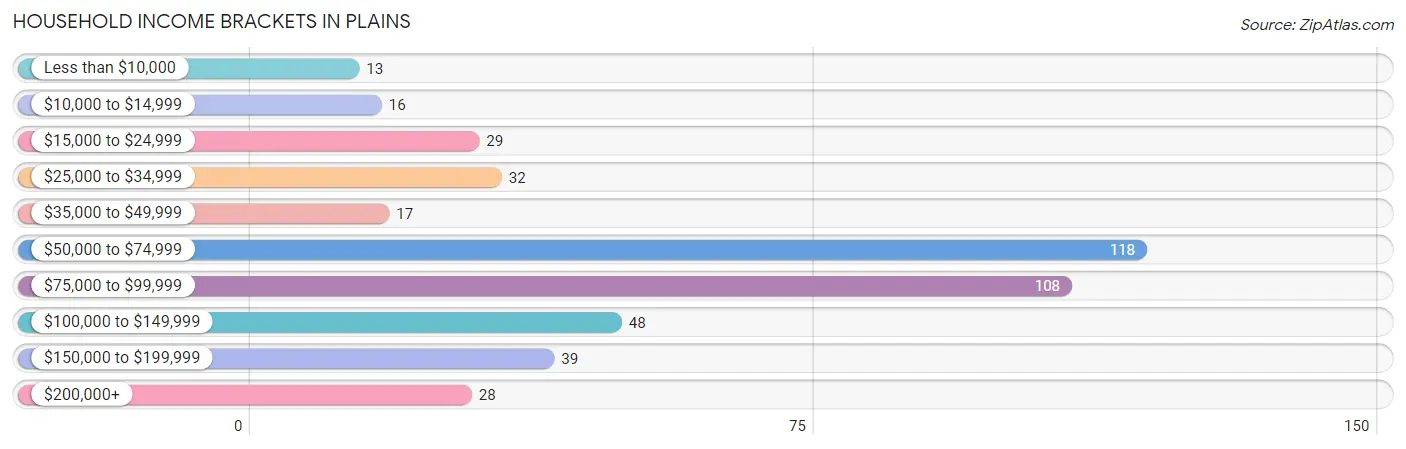
| Income Bracket | # Households | % Households |
| Less than $10,000 | 13 | 2.9% |
| $10,000 to $14,999 | 16 | 3.6% |
| $15,000 to $24,999 | 29 | 6.5% |
| $25,000 to $34,999 | 32 | 7.1% |
| $35,000 to $49,999 | 17 | 3.8% |
| $50,000 to $74,999 | 118 | 26.3% |
| $75,000 to $99,999 | 108 | 24.1% |
| $100,000 to $149,999 | 48 | 10.7% |
| $150,000 to $199,999 | 39 | 8.7% |
| $200,000+ | 28 | 6.3% |
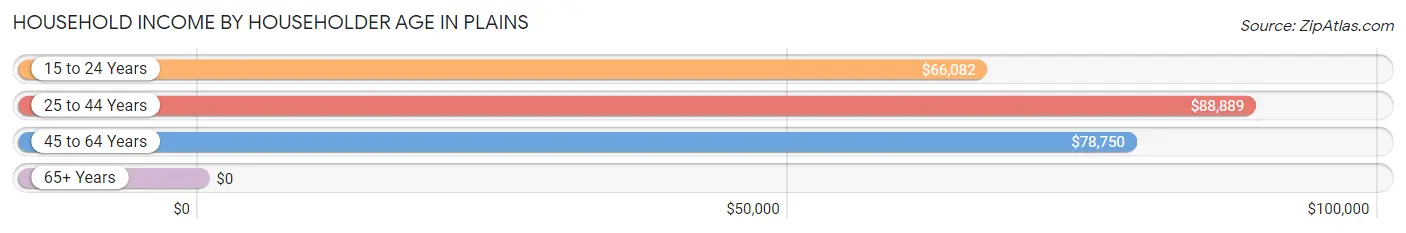
Household Income by Householder Age in Plains
The median household income in Plains is $72,222, with the highest median household income of $88,889 found in the 25 to 44 years age bracket for the primary householder. A total of 158 households (35.3%) fall into this category. Meanwhile, the 65+ years age bracket for the primary householder has the lowest median household income of $0, with 72 households (16.1%) in this group.
| Income Bracket | # Households | Median Income |
| 15 to 24 Years | 59 (13.2%) | $66,082 |
| 25 to 44 Years | 158 (35.3%) | $88,889 |
| 45 to 64 Years | 159 (35.5%) | $78,750 |
| 65+ Years | 72 (16.1%) | $0 |
| Total | 448 (100.0%) | $72,222 |
Poverty in Plains
Income Below Poverty by Sex and Age in Plains
With 8.5% poverty level for males and 15.8% for females among the residents of Plains, 6 to 11 year old males and 18 to 24 year old females are the most vulnerable to poverty, with 17 males (31.5%) and 55 females (61.1%) in their respective age groups living below the poverty level.
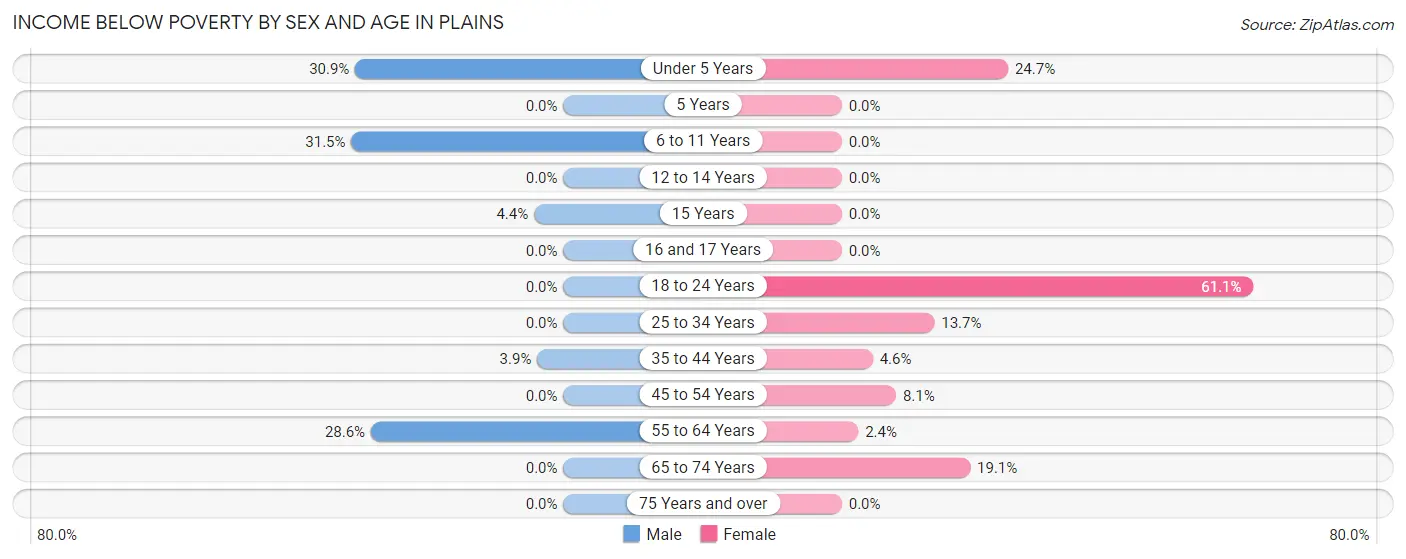
| Age Bracket | Male | Female |
| Under 5 Years | 17 (30.9%) | 19 (24.7%) |
| 5 Years | 0 (0.0%) | 0 (0.0%) |
| 6 to 11 Years | 17 (31.5%) | 0 (0.0%) |
| 12 to 14 Years | 0 (0.0%) | 0 (0.0%) |
| 15 Years | 1 (4.3%) | 0 (0.0%) |
| 16 and 17 Years | 0 (0.0%) | 0 (0.0%) |
| 18 to 24 Years | 0 (0.0%) | 55 (61.1%) |
| 25 to 34 Years | 0 (0.0%) | 7 (13.7%) |
| 35 to 44 Years | 4 (3.9%) | 5 (4.6%) |
| 45 to 54 Years | 0 (0.0%) | 7 (8.1%) |
| 55 to 64 Years | 16 (28.6%) | 1 (2.4%) |
| 65 to 74 Years | 0 (0.0%) | 4 (19.1%) |
| 75 Years and over | 0 (0.0%) | 0 (0.0%) |
| Total | 55 (8.5%) | 98 (15.8%) |
Income Above Poverty by Sex and Age in Plains
According to the poverty statistics in Plains, males aged 5 years and females aged 5 years are the age groups that are most secure financially, with 100.0% of males and 100.0% of females in these age groups living above the poverty line.
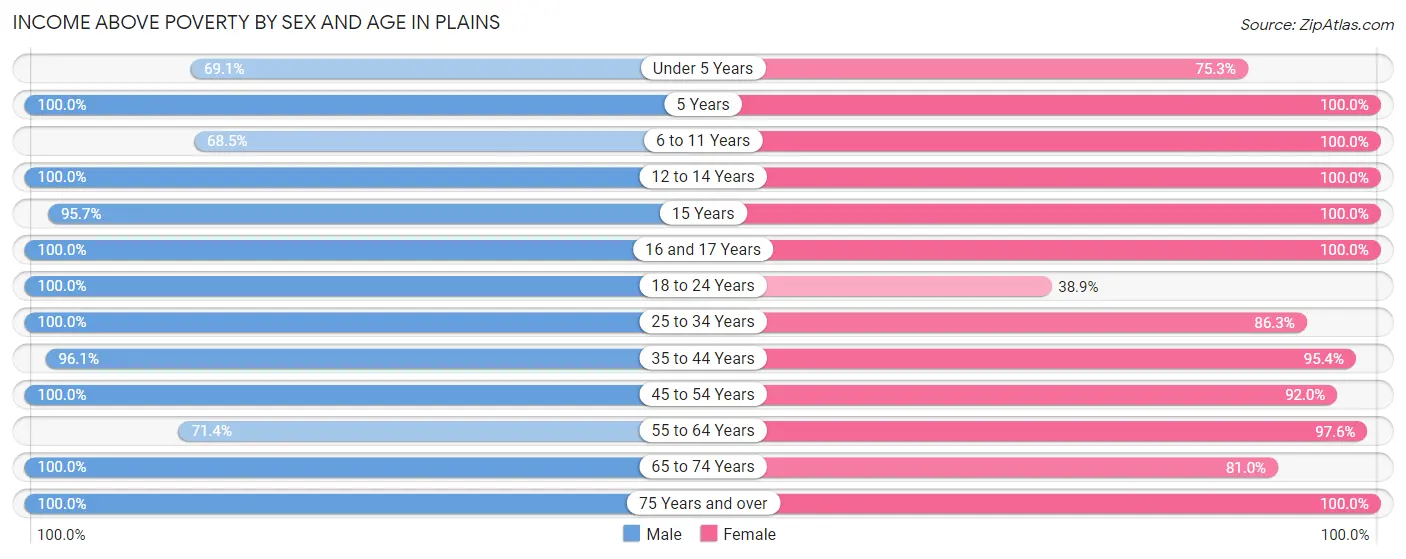
| Age Bracket | Male | Female |
| Under 5 Years | 38 (69.1%) | 58 (75.3%) |
| 5 Years | 1 (100.0%) | 2 (100.0%) |
| 6 to 11 Years | 37 (68.5%) | 53 (100.0%) |
| 12 to 14 Years | 74 (100.0%) | 33 (100.0%) |
| 15 Years | 22 (95.7%) | 10 (100.0%) |
| 16 and 17 Years | 31 (100.0%) | 25 (100.0%) |
| 18 to 24 Years | 48 (100.0%) | 35 (38.9%) |
| 25 to 34 Years | 52 (100.0%) | 44 (86.3%) |
| 35 to 44 Years | 99 (96.1%) | 104 (95.4%) |
| 45 to 54 Years | 91 (100.0%) | 80 (91.9%) |
| 55 to 64 Years | 40 (71.4%) | 40 (97.6%) |
| 65 to 74 Years | 36 (100.0%) | 17 (80.9%) |
| 75 Years and over | 23 (100.0%) | 20 (100.0%) |
| Total | 592 (91.5%) | 521 (84.2%) |
Income Below Poverty Among Married-Couple Families in Plains
The poverty statistics for married-couple families in Plains show that 2.3% or 5 of the total 219 families live below the poverty line. Families with 3 or 4 children have the highest poverty rate of 15.1%, comprising of 5 families. On the other hand, families with no children have the lowest poverty rate of 0.0%, which includes 0 families.
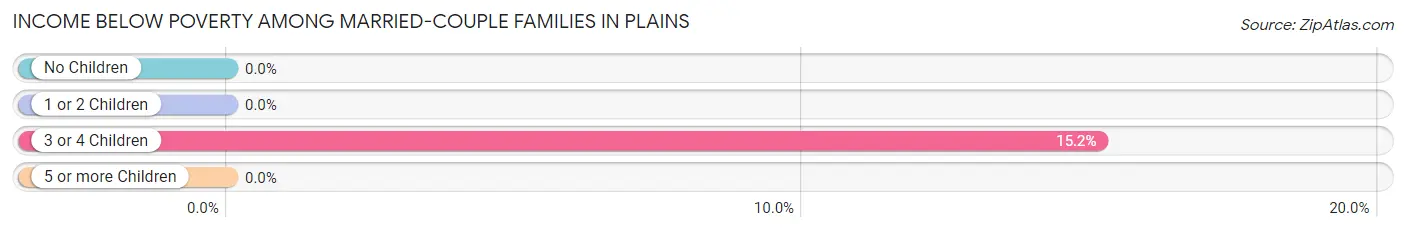
| Children | Above Poverty | Below Poverty |
| No Children | 57 (100.0%) | 0 (0.0%) |
| 1 or 2 Children | 126 (100.0%) | 0 (0.0%) |
| 3 or 4 Children | 28 (84.9%) | 5 (15.1%) |
| 5 or more Children | 3 (100.0%) | 0 (0.0%) |
| Total | 214 (97.7%) | 5 (2.3%) |
Income Below Poverty Among Single-Parent Households in Plains
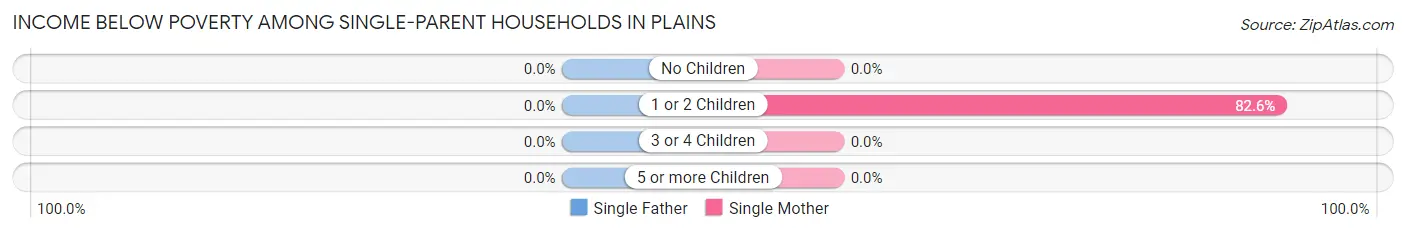
| Children | Single Father | Single Mother |
| No Children | 0 (0.0%) | 0 (0.0%) |
| 1 or 2 Children | 0 (0.0%) | 57 (82.6%) |
| 3 or 4 Children | 0 (0.0%) | 0 (0.0%) |
| 5 or more Children | 0 (0.0%) | 0 (0.0%) |
| Total | 0 (0.0%) | 57 (59.4%) |
Income Below Poverty Among Married-Couple vs Single-Parent Households in Plains
The poverty data for Plains shows that 5 of the married-couple family households (2.3%) and 57 of the single-parent households (47.1%) are living below the poverty level. Within the married-couple family households, those with 3 or 4 children have the highest poverty rate, with 5 households (15.1%) falling below the poverty line. Among the single-parent households, those with 1 or 2 children have the highest poverty rate, with 57 household (60.6%) living below poverty.
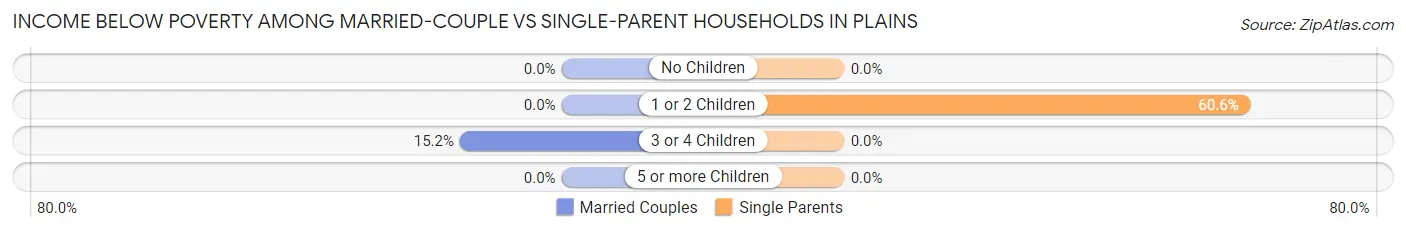
| Children | Married-Couple Families | Single-Parent Households |
| No Children | 0 (0.0%) | 0 (0.0%) |
| 1 or 2 Children | 0 (0.0%) | 57 (60.6%) |
| 3 or 4 Children | 5 (15.1%) | 0 (0.0%) |
| 5 or more Children | 0 (0.0%) | 0 (0.0%) |
| Total | 5 (2.3%) | 57 (47.1%) |
Race in Plains
The most populous races in Plains are White / Caucasian (742 | 58.6%), Hispanic or Latino (684 | 54.0%), and Some other Race (349 | 27.6%).
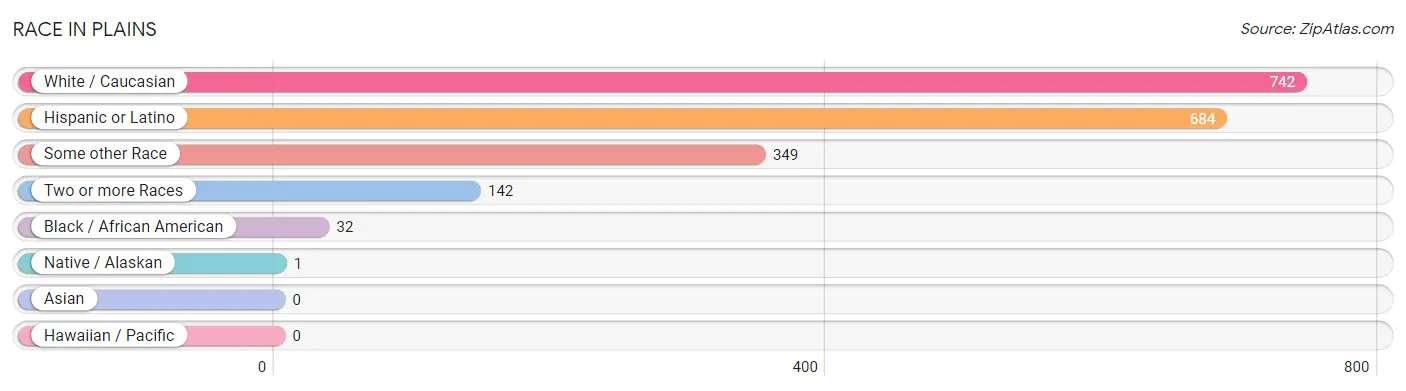
| Race | # Population | % Population |
| Asian | 0 | 0.0% |
| Black / African American | 32 | 2.5% |
| Hawaiian / Pacific | 0 | 0.0% |
| Hispanic or Latino | 684 | 54.0% |
| Native / Alaskan | 1 | 0.1% |
| White / Caucasian | 742 | 58.6% |
| Two or more Races | 142 | 11.2% |
| Some other Race | 349 | 27.6% |
| Total | 1,266 | 100.0% |
Ancestry in Plains
The most populous ancestries reported in Plains are Mexican (668 | 52.8%), German (341 | 26.9%), Irish (126 | 10.0%), English (96 | 7.6%), and Dutch (40 | 3.2%), together accounting for 100.4% of all Plains residents.
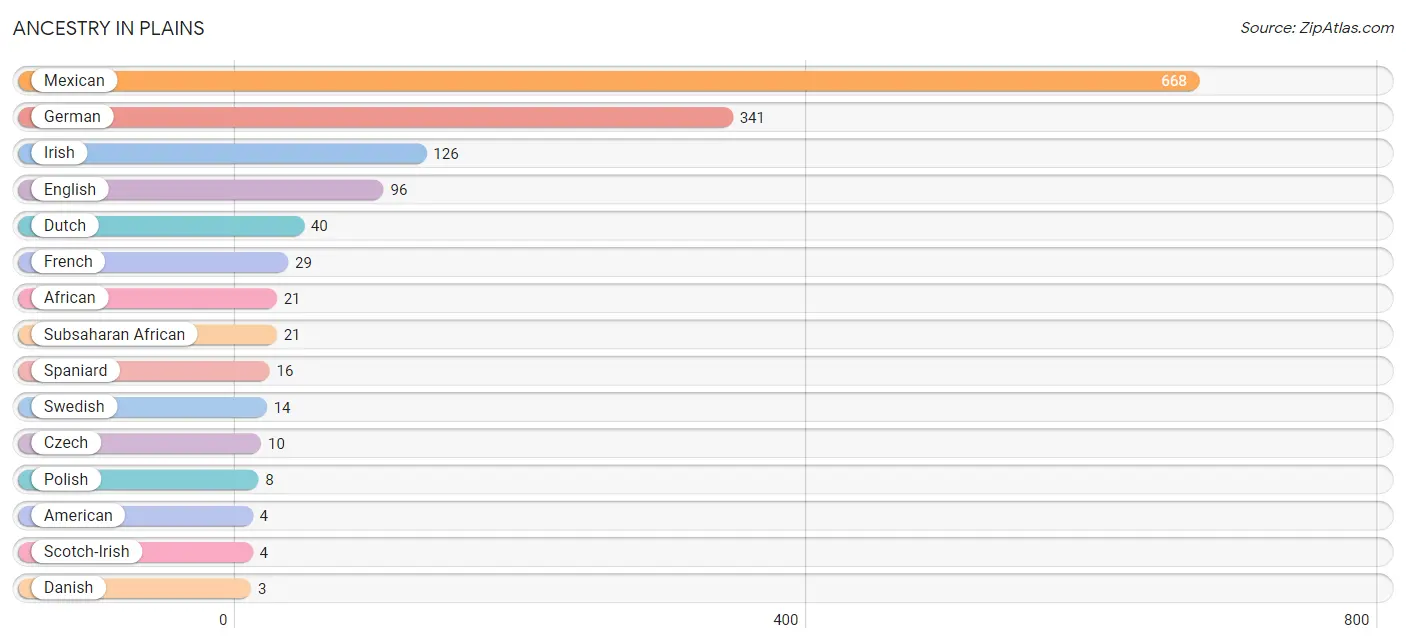
| Ancestry | # Population | % Population |
| African | 21 | 1.7% |
| American | 4 | 0.3% |
| Austrian | 2 | 0.2% |
| Czech | 10 | 0.8% |
| Danish | 3 | 0.2% |
| Dutch | 40 | 3.2% |
| English | 96 | 7.6% |
| French | 29 | 2.3% |
| German | 341 | 26.9% |
| Irish | 126 | 10.0% |
| Mexican | 668 | 52.8% |
| Polish | 8 | 0.6% |
| Scotch-Irish | 4 | 0.3% |
| Scottish | 3 | 0.2% |
| Spaniard | 16 | 1.3% |
| Subsaharan African | 21 | 1.7% |
| Swedish | 14 | 1.1% | View All 17 Rows |
Immigrants in Plains
The most numerous immigrant groups reported in Plains came from Central America (300 | 23.7%), Latin America (300 | 23.7%), Mexico (298 | 23.5%), Africa (10 | 0.8%), and Cameroon (10 | 0.8%), together accounting for 72.5% of all Plains residents.
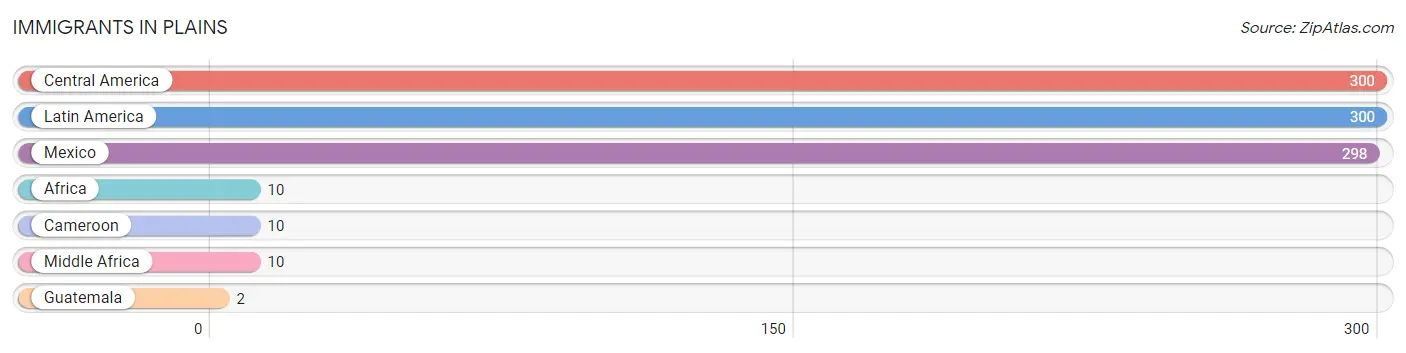
| Immigration Origin | # Population | % Population |
| Africa | 10 | 0.8% |
| Cameroon | 10 | 0.8% |
| Central America | 300 | 23.7% |
| Guatemala | 2 | 0.2% |
| Latin America | 300 | 23.7% |
| Mexico | 298 | 23.5% |
| Middle Africa | 10 | 0.8% | View All 7 Rows |
Sex and Age in Plains
Sex and Age in Plains
The most populous age groups in Plains are 40 to 44 Years (86 | 13.3%) for men and Under 5 Years (77 | 12.4%) for women.
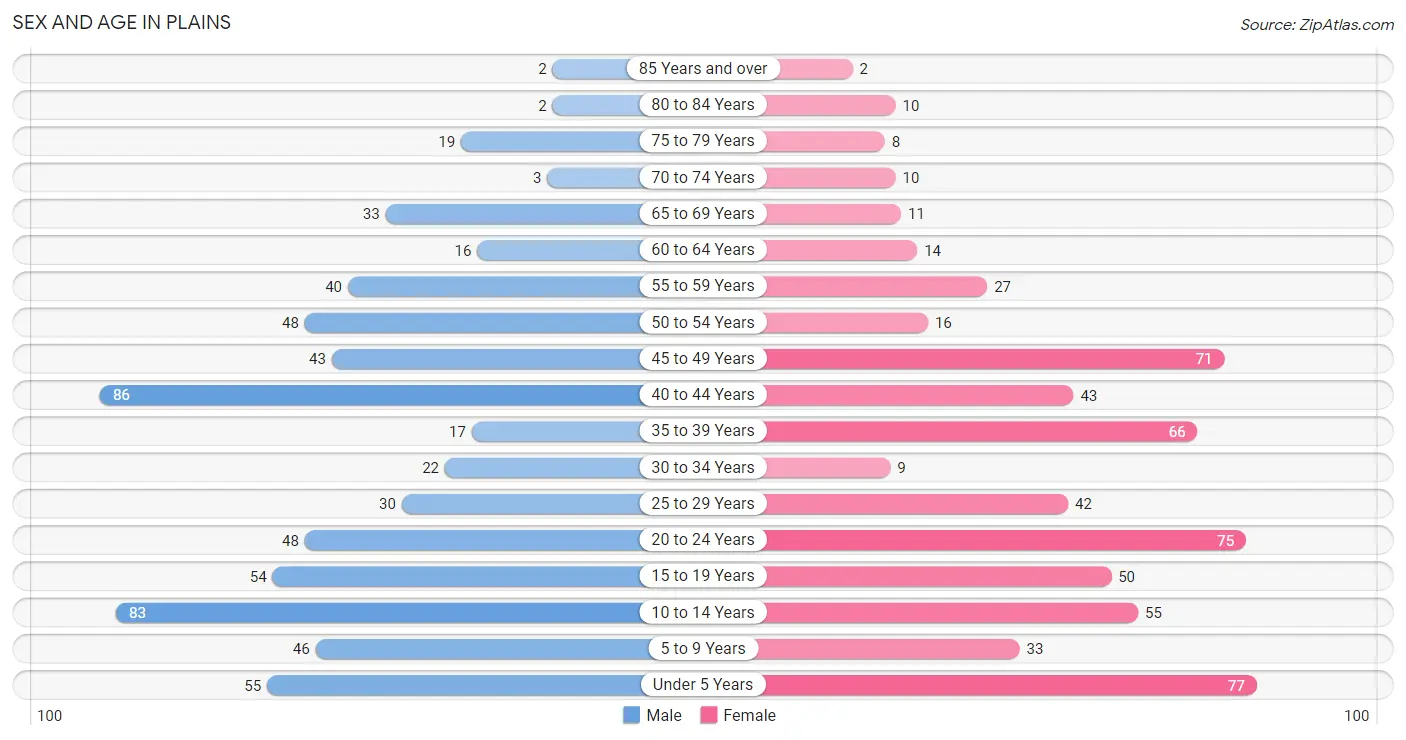
| Age Bracket | Male | Female |
| Under 5 Years | 55 (8.5%) | 77 (12.4%) |
| 5 to 9 Years | 46 (7.1%) | 33 (5.3%) |
| 10 to 14 Years | 83 (12.8%) | 55 (8.9%) |
| 15 to 19 Years | 54 (8.4%) | 50 (8.1%) |
| 20 to 24 Years | 48 (7.4%) | 75 (12.1%) |
| 25 to 29 Years | 30 (4.6%) | 42 (6.8%) |
| 30 to 34 Years | 22 (3.4%) | 9 (1.5%) |
| 35 to 39 Years | 17 (2.6%) | 66 (10.7%) |
| 40 to 44 Years | 86 (13.3%) | 43 (7.0%) |
| 45 to 49 Years | 43 (6.7%) | 71 (11.5%) |
| 50 to 54 Years | 48 (7.4%) | 16 (2.6%) |
| 55 to 59 Years | 40 (6.2%) | 27 (4.4%) |
| 60 to 64 Years | 16 (2.5%) | 14 (2.3%) |
| 65 to 69 Years | 33 (5.1%) | 11 (1.8%) |
| 70 to 74 Years | 3 (0.5%) | 10 (1.6%) |
| 75 to 79 Years | 19 (2.9%) | 8 (1.3%) |
| 80 to 84 Years | 2 (0.3%) | 10 (1.6%) |
| 85 Years and over | 2 (0.3%) | 2 (0.3%) |
| Total | 647 (100.0%) | 619 (100.0%) |
Families and Households in Plains
Median Family Size in Plains
The median family size in Plains is 3.26 persons per family, with married-couple families (219 | 64.4%) accounting for the largest median family size of 4.04 persons per family. On the other hand, single male/father families (25 | 7.3%) represent the smallest median family size with 1.60 persons per family.
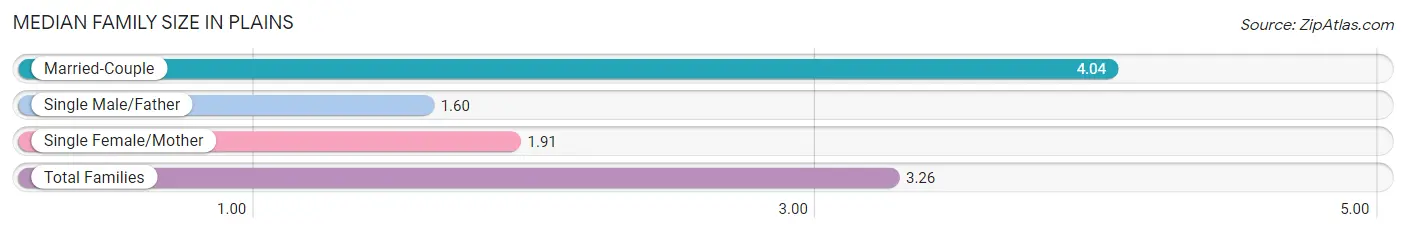
| Family Type | # Families | Family Size |
| Married-Couple | 219 (64.4%) | 4.04 |
| Single Male/Father | 25 (7.3%) | 1.60 |
| Single Female/Mother | 96 (28.2%) | 1.91 |
| Total Families | 340 (100.0%) | 3.26 |
Median Household Size in Plains
The median household size in Plains is 2.83 persons per household, with married-couple households (219 | 48.9%) accounting for the largest median household size of 4.04 persons per household. non-family households (108 | 24.1%) represent the smallest median household size with 1.03 persons per household.
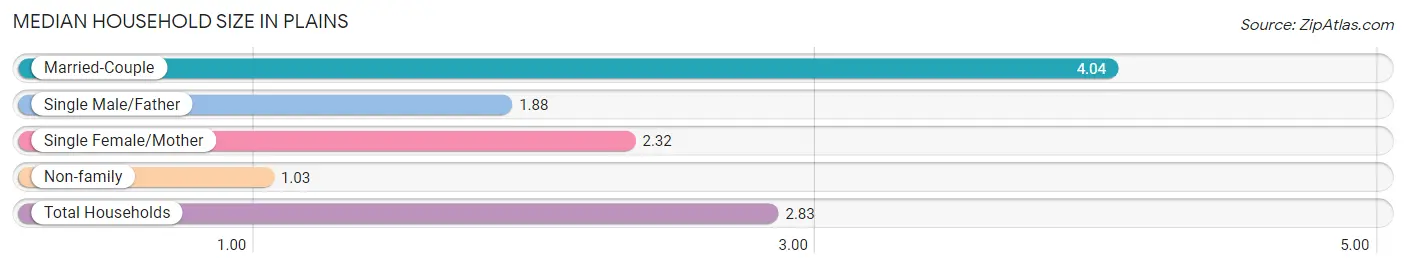
| Household Type | # Households | Household Size |
| Married-Couple | 219 (48.9%) | 4.04 |
| Single Male/Father | 25 (5.6%) | 1.88 |
| Single Female/Mother | 96 (21.4%) | 2.32 |
| Non-family | 108 (24.1%) | 1.03 |
| Total Households | 448 (100.0%) | 2.83 |
Household Size by Marriage Status in Plains
Out of a total of 448 households in Plains, 340 (75.9%) are family households, while 108 (24.1%) are nonfamily households. The most numerous type of family households are 4-person households, comprising 136, and the most common type of nonfamily households are 1-person households, comprising 102.
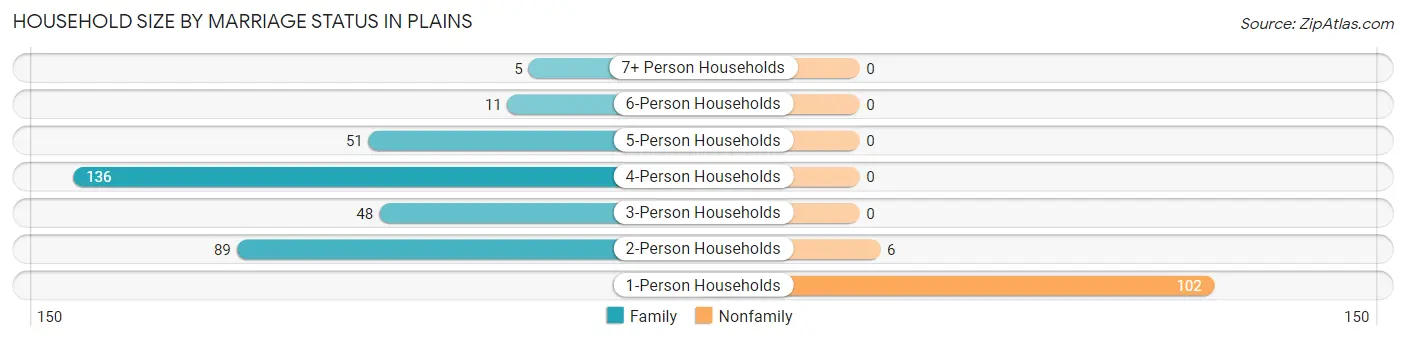
| Household Size | Family Households | Nonfamily Households |
| 1-Person Households | - | 102 (22.8%) |
| 2-Person Households | 89 (19.9%) | 6 (1.3%) |
| 3-Person Households | 48 (10.7%) | 0 (0.0%) |
| 4-Person Households | 136 (30.4%) | 0 (0.0%) |
| 5-Person Households | 51 (11.4%) | 0 (0.0%) |
| 6-Person Households | 11 (2.5%) | 0 (0.0%) |
| 7+ Person Households | 5 (1.1%) | 0 (0.0%) |
| Total | 340 (75.9%) | 108 (24.1%) |
Female Fertility in Plains
Fertility by Age in Plains
Average fertility rate in Plains is 206.0 births per 1,000 women. Women in the age bracket of 20 to 34 years have the highest fertility rate with 548.0 births per 1,000 women. Women in the age bracket of 20 to 34 years acount for 93.2% of all women with births.
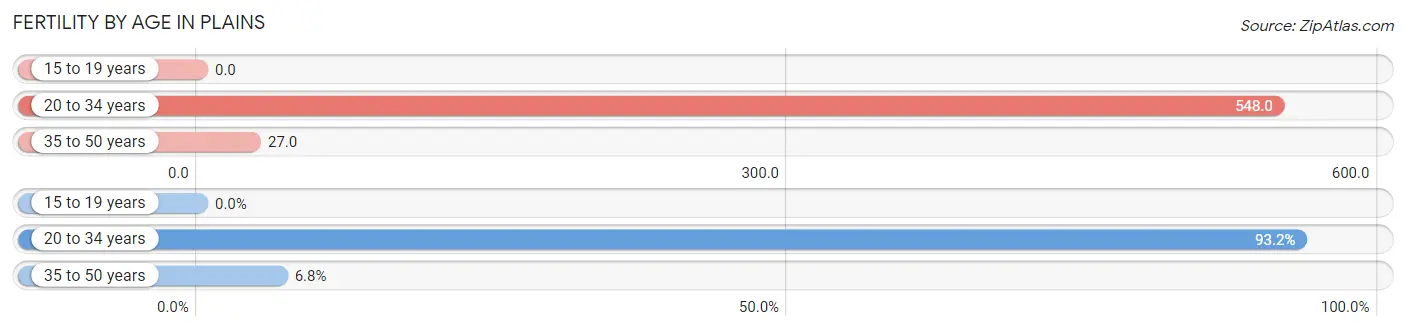
| Age Bracket | Women with Births | Births / 1,000 Women |
| 15 to 19 years | 0 (0.0%) | 0.0 |
| 20 to 34 years | 69 (93.2%) | 548.0 |
| 35 to 50 years | 5 (6.8%) | 27.0 |
| Total | 74 (100.0%) | 206.0 |
Fertility by Age by Marriage Status in Plains
23.0% of women with births (74) in Plains are married. The highest percentage of unmarried women with births falls into 20 to 34 years age bracket with 82.6% of them unmarried at the time of birth, while the lowest percentage of unmarried women with births belong to 35 to 50 years age bracket with 0.0% of them unmarried.
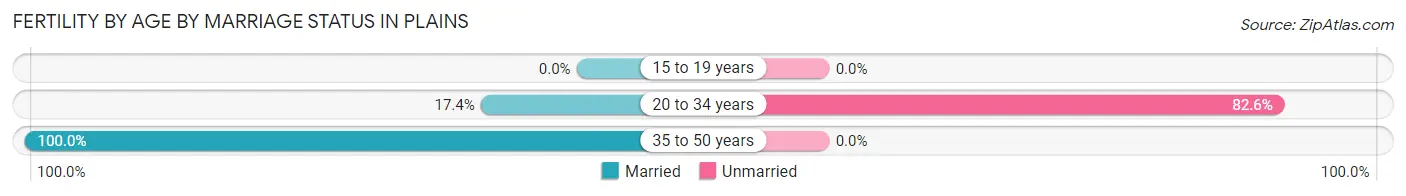
| Age Bracket | Married | Unmarried |
| 15 to 19 years | 0 (0.0%) | 0 (0.0%) |
| 20 to 34 years | 12 (17.4%) | 57 (82.6%) |
| 35 to 50 years | 5 (100.0%) | 0 (0.0%) |
| Total | 17 (23.0%) | 57 (77.0%) |
Fertility by Education in Plains
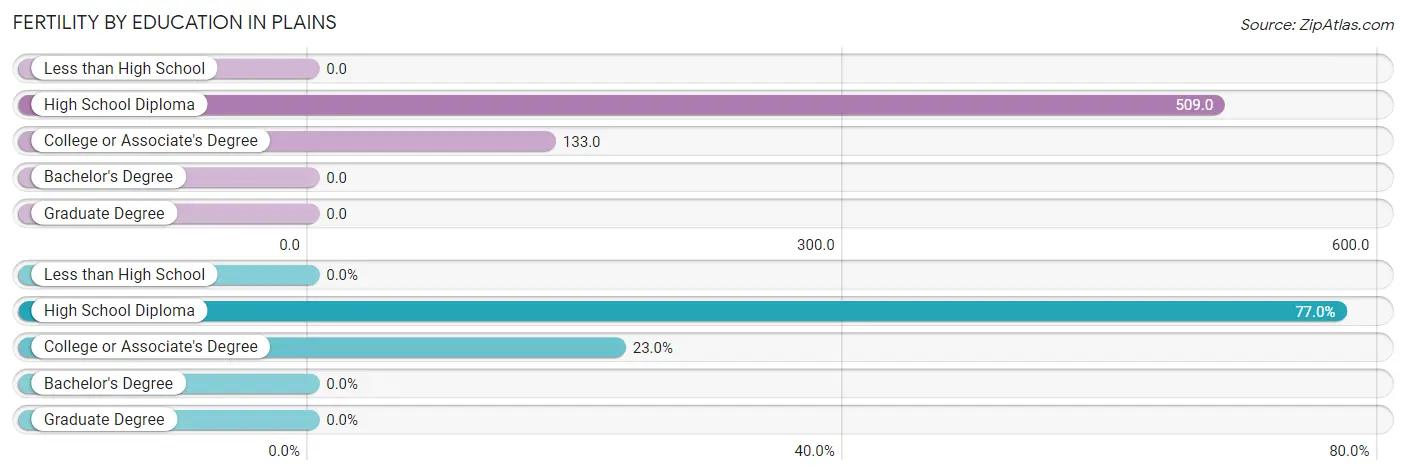
| Educational Attainment | Women with Births | Births / 1,000 Women |
| Less than High School | 0 (0.0%) | 0.0 |
| High School Diploma | 57 (77.0%) | 509.0 |
| College or Associate's Degree | 17 (23.0%) | 133.0 |
| Bachelor's Degree | 0 (0.0%) | 0.0 |
| Graduate Degree | 0 (0.0%) | 0.0 |
| Total | 74 (100.0%) | 206.0 |
Fertility by Education by Marriage Status in Plains
77.0% of women with births in Plains are unmarried. Women with the educational attainment of college or associate's degree are most likely to be married with 70.6% of them married at childbirth, while women with the educational attainment of high school diploma are least likely to be married with 91.2% of them unmarried at childbirth.
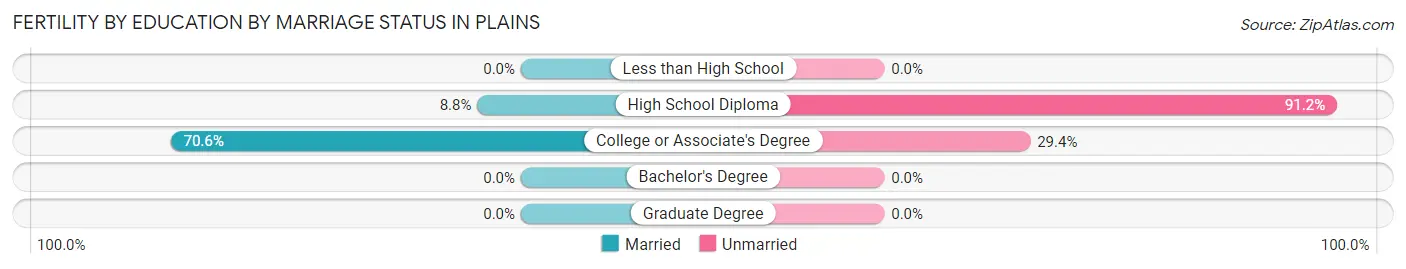
| Educational Attainment | Married | Unmarried |
| Less than High School | 0 (0.0%) | 0 (0.0%) |
| High School Diploma | 5 (8.8%) | 52 (91.2%) |
| College or Associate's Degree | 12 (70.6%) | 5 (29.4%) |
| Bachelor's Degree | 0 (0.0%) | 0 (0.0%) |
| Graduate Degree | 0 (0.0%) | 0 (0.0%) |
| Total | 17 (23.0%) | 57 (77.0%) |
Employment Characteristics in Plains
Employment by Class of Employer in Plains
Among the 586 employed individuals in Plains, private company employees (421 | 71.8%), not-for-profit organizations (42 | 7.2%), and self-employed (not incorporated) (38 | 6.5%) make up the most common classes of employment.
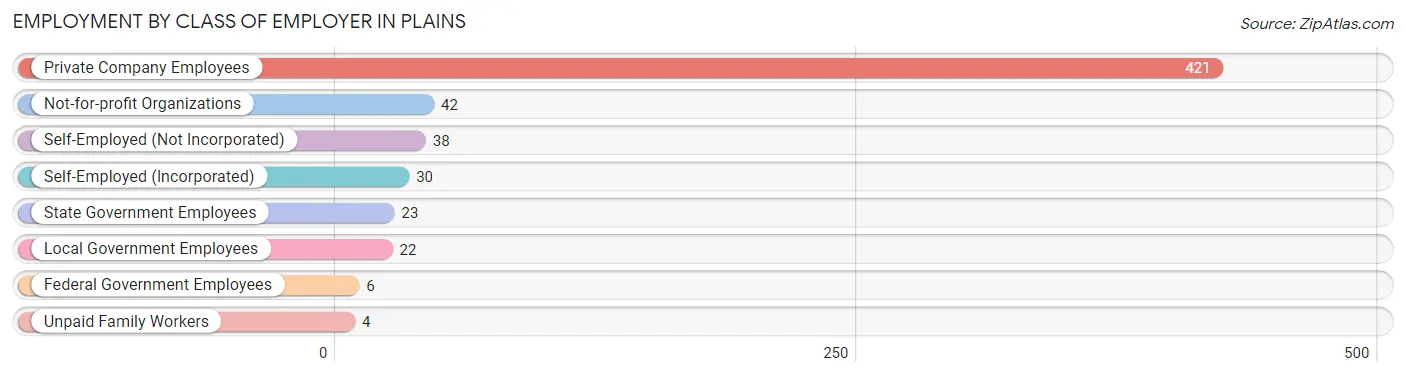
| Employer Class | # Employees | % Employees |
| Private Company Employees | 421 | 71.8% |
| Self-Employed (Incorporated) | 30 | 5.1% |
| Self-Employed (Not Incorporated) | 38 | 6.5% |
| Not-for-profit Organizations | 42 | 7.2% |
| Local Government Employees | 22 | 3.7% |
| State Government Employees | 23 | 3.9% |
| Federal Government Employees | 6 | 1.0% |
| Unpaid Family Workers | 4 | 0.7% |
| Total | 586 | 100.0% |
Employment Status by Age in Plains
According to the labor force statistics for Plains, out of the total population over 16 years of age (884), 69.2% or 612 individuals are in the labor force, with 1.8% or 11 of them unemployed. The age group with the highest labor force participation rate is 20 to 24 years, with 97.6% or 120 individuals in the labor force. Within the labor force, the 55 to 59 years age range has the highest percentage of unemployed individuals, with 10.0% or 4 of them being unemployed.
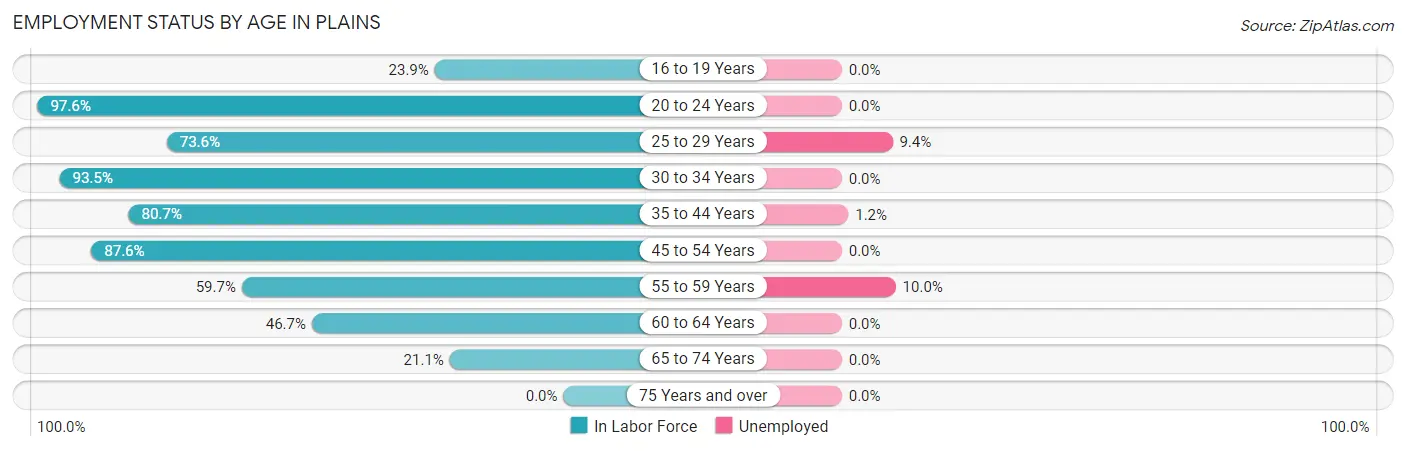
| Age Bracket | In Labor Force | Unemployed |
| 16 to 19 Years | 17 (23.9%) | 0 (0.0%) |
| 20 to 24 Years | 120 (97.6%) | 0 (0.0%) |
| 25 to 29 Years | 53 (73.6%) | 5 (9.4%) |
| 30 to 34 Years | 29 (93.5%) | 0 (0.0%) |
| 35 to 44 Years | 171 (80.7%) | 2 (1.2%) |
| 45 to 54 Years | 156 (87.6%) | 0 (0.0%) |
| 55 to 59 Years | 40 (59.7%) | 4 (10.0%) |
| 60 to 64 Years | 14 (46.7%) | 0 (0.0%) |
| 65 to 74 Years | 12 (21.1%) | 0 (0.0%) |
| 75 Years and over | 0 (0.0%) | 0 (0.0%) |
| Total | 612 (69.2%) | 11 (1.8%) |
Employment Status by Educational Attainment in Plains
According to labor force statistics for Plains, 78.5% of individuals (463) out of the total population between 25 and 64 years of age (590) are in the labor force, with 2.4% or 11 of them being unemployed. The group with the highest labor force participation rate are those with the educational attainment of bachelor's degree or higher, with 100.0% or 100 individuals in the labor force. Within the labor force, individuals with bachelor's degree or higher education have the highest percentage of unemployment, with 6.0% or 6 of them being unemployed.
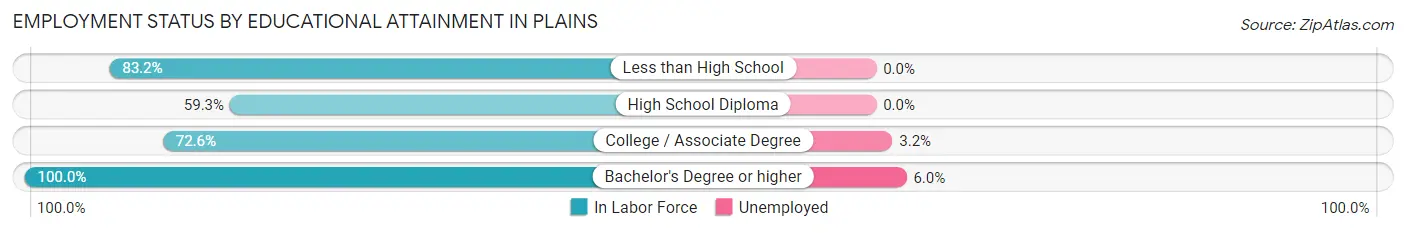
| Educational Attainment | In Labor Force | Unemployed |
| Less than High School | 153 (83.2%) | 0 (0.0%) |
| High School Diploma | 54 (59.3%) | 0 (0.0%) |
| College / Associate Degree | 156 (72.6%) | 7 (3.2%) |
| Bachelor's Degree or higher | 100 (100.0%) | 6 (6.0%) |
| Total | 463 (78.5%) | 14 (2.4%) |
Employment Occupations by Sex in Plains
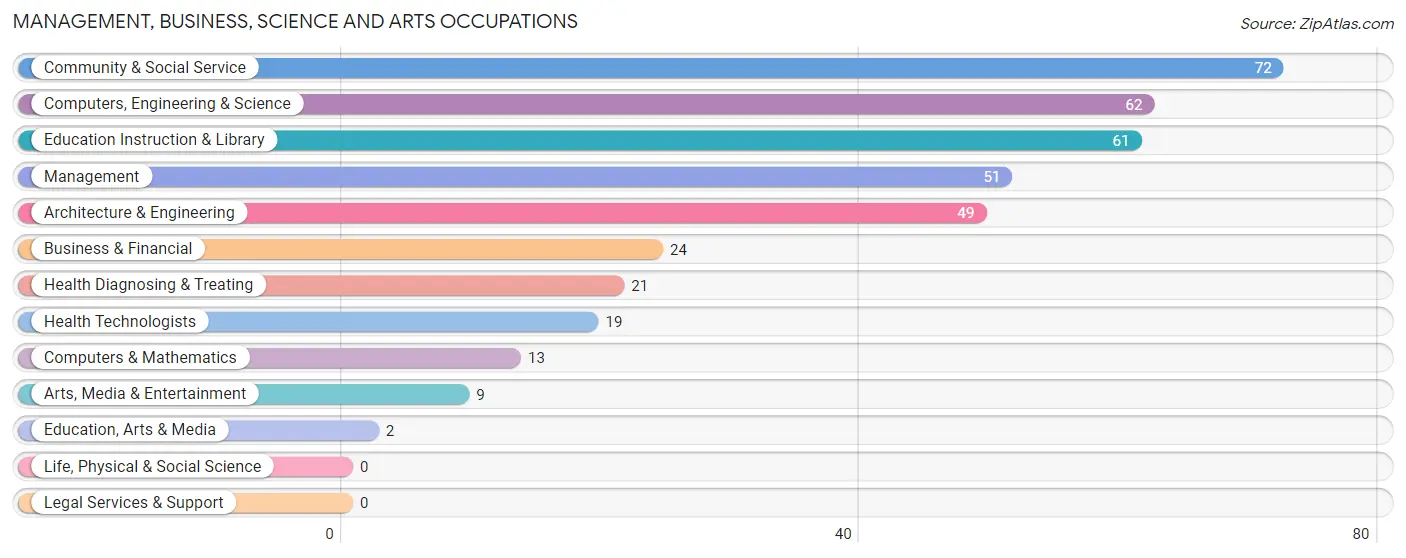
Management, Business, Science and Arts Occupations
The most common Management, Business, Science and Arts occupations in Plains are Community & Social Service (72 | 12.0%), Computers, Engineering & Science (62 | 10.3%), Education Instruction & Library (61 | 10.2%), Management (51 | 8.5%), and Architecture & Engineering (49 | 8.2%).
Management, Business, Science and Arts Occupations by Sex
Within the Management, Business, Science and Arts occupations in Plains, the most male-oriented occupations are Computers, Engineering & Science (100.0%), Computers & Mathematics (100.0%), and Architecture & Engineering (100.0%), while the most female-oriented occupations are Business & Financial (100.0%), Education, Arts & Media (100.0%), and Health Diagnosing & Treating (90.5%).
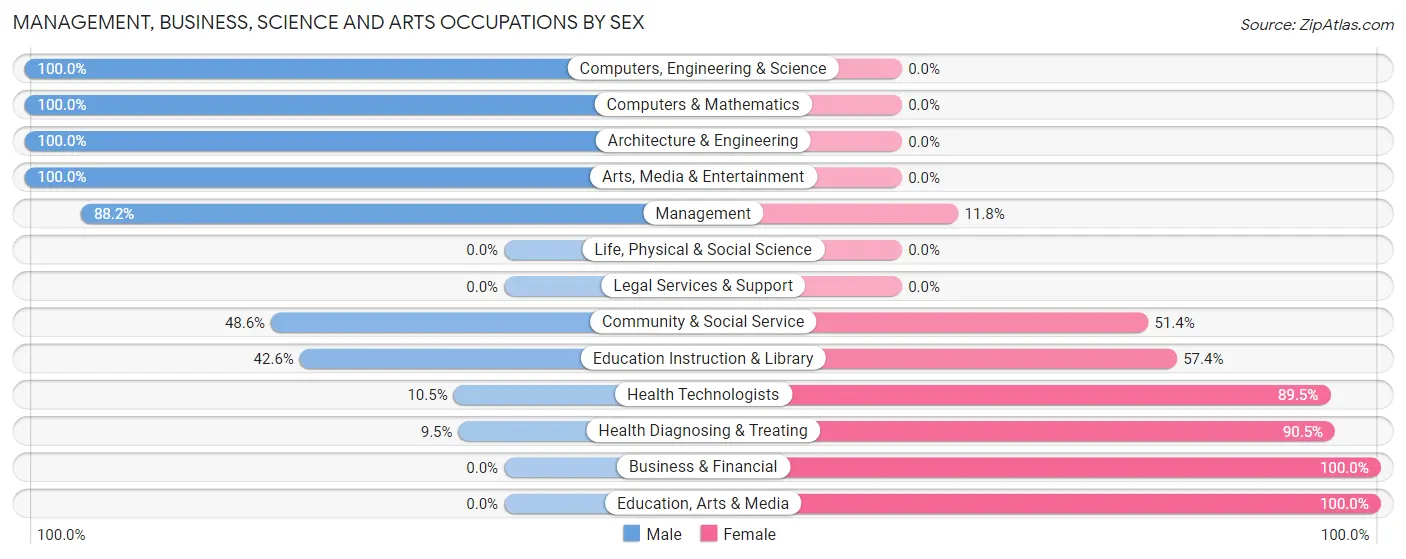
| Occupation | Male | Female |
| Management | 45 (88.2%) | 6 (11.8%) |
| Business & Financial | 0 (0.0%) | 24 (100.0%) |
| Computers, Engineering & Science | 62 (100.0%) | 0 (0.0%) |
| Computers & Mathematics | 13 (100.0%) | 0 (0.0%) |
| Architecture & Engineering | 49 (100.0%) | 0 (0.0%) |
| Life, Physical & Social Science | 0 (0.0%) | 0 (0.0%) |
| Community & Social Service | 35 (48.6%) | 37 (51.4%) |
| Education, Arts & Media | 0 (0.0%) | 2 (100.0%) |
| Legal Services & Support | 0 (0.0%) | 0 (0.0%) |
| Education Instruction & Library | 26 (42.6%) | 35 (57.4%) |
| Arts, Media & Entertainment | 9 (100.0%) | 0 (0.0%) |
| Health Diagnosing & Treating | 2 (9.5%) | 19 (90.5%) |
| Health Technologists | 2 (10.5%) | 17 (89.5%) |
| Total (Category) | 144 (62.6%) | 86 (37.4%) |
| Total (Overall) | 332 (55.2%) | 269 (44.8%) |
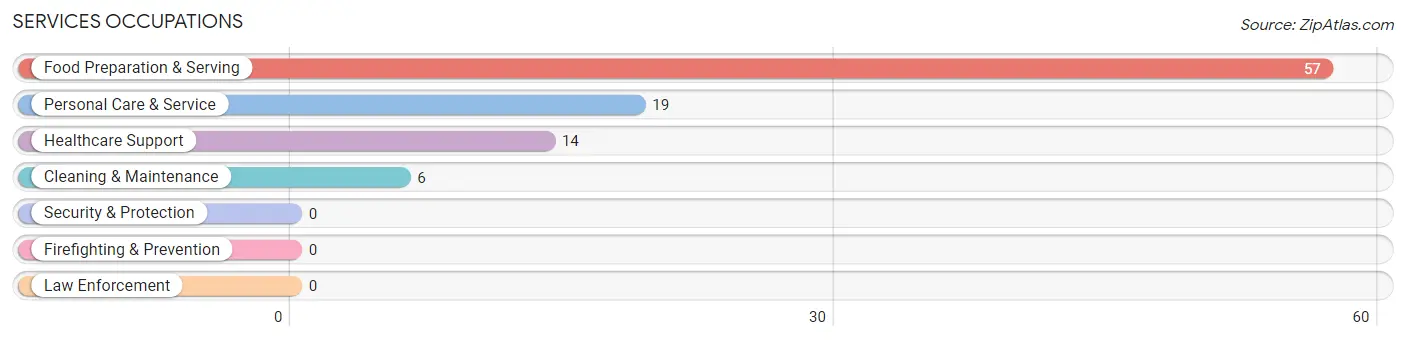
Services Occupations
The most common Services occupations in Plains are Food Preparation & Serving (57 | 9.5%), Personal Care & Service (19 | 3.2%), Healthcare Support (14 | 2.3%), and Cleaning & Maintenance (6 | 1.0%).
Services Occupations by Sex
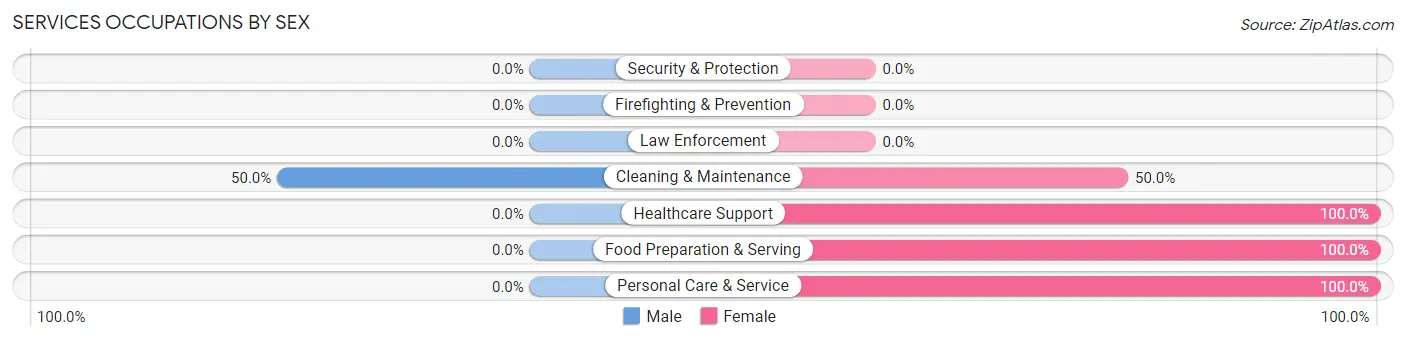
| Occupation | Male | Female |
| Healthcare Support | 0 (0.0%) | 14 (100.0%) |
| Security & Protection | 0 (0.0%) | 0 (0.0%) |
| Firefighting & Prevention | 0 (0.0%) | 0 (0.0%) |
| Law Enforcement | 0 (0.0%) | 0 (0.0%) |
| Food Preparation & Serving | 0 (0.0%) | 57 (100.0%) |
| Cleaning & Maintenance | 3 (50.0%) | 3 (50.0%) |
| Personal Care & Service | 0 (0.0%) | 19 (100.0%) |
| Total (Category) | 3 (3.1%) | 93 (96.9%) |
| Total (Overall) | 332 (55.2%) | 269 (44.8%) |
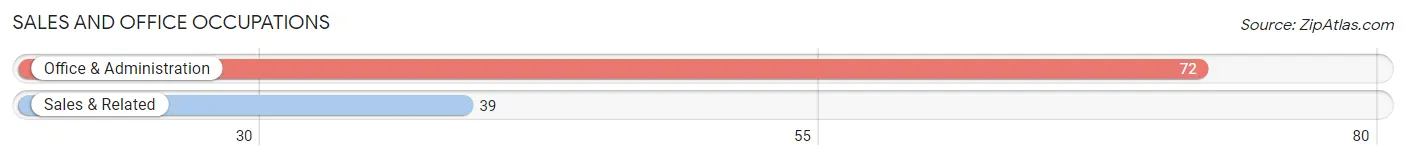
Sales and Office Occupations
The most common Sales and Office occupations in Plains are Office & Administration (72 | 12.0%), and Sales & Related (39 | 6.5%).
Sales and Office Occupations by Sex
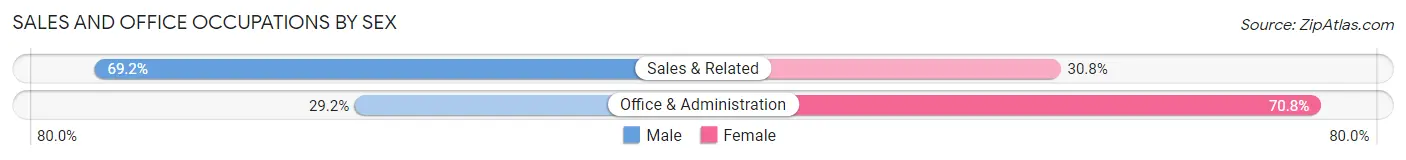
| Occupation | Male | Female |
| Sales & Related | 27 (69.2%) | 12 (30.8%) |
| Office & Administration | 21 (29.2%) | 51 (70.8%) |
| Total (Category) | 48 (43.2%) | 63 (56.8%) |
| Total (Overall) | 332 (55.2%) | 269 (44.8%) |
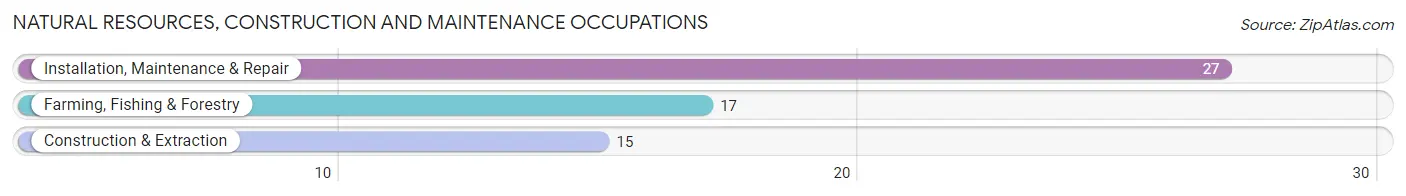
Natural Resources, Construction and Maintenance Occupations
The most common Natural Resources, Construction and Maintenance occupations in Plains are Installation, Maintenance & Repair (27 | 4.5%), Farming, Fishing & Forestry (17 | 2.8%), and Construction & Extraction (15 | 2.5%).
Natural Resources, Construction and Maintenance Occupations by Sex
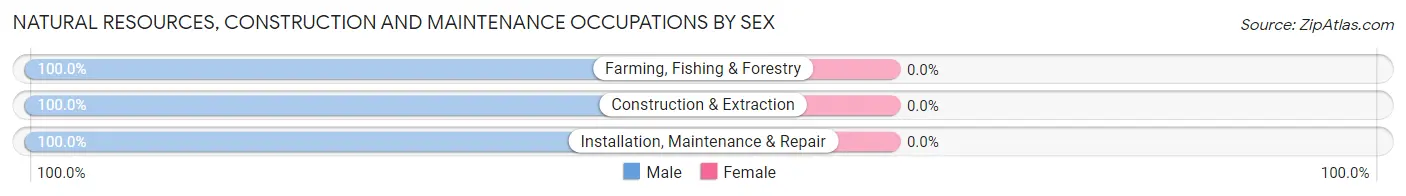
| Occupation | Male | Female |
| Farming, Fishing & Forestry | 17 (100.0%) | 0 (0.0%) |
| Construction & Extraction | 15 (100.0%) | 0 (0.0%) |
| Installation, Maintenance & Repair | 27 (100.0%) | 0 (0.0%) |
| Total (Category) | 59 (100.0%) | 0 (0.0%) |
| Total (Overall) | 332 (55.2%) | 269 (44.8%) |
Production, Transportation and Moving Occupations
The most common Production, Transportation and Moving occupations in Plains are Production (50 | 8.3%), Transportation (48 | 8.0%), and Material Moving (7 | 1.2%).
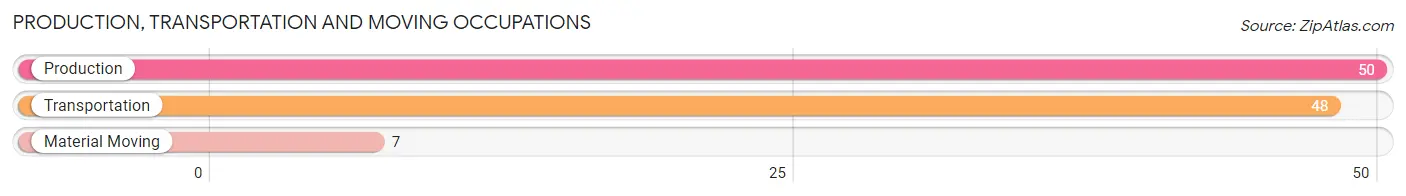
Production, Transportation and Moving Occupations by Sex
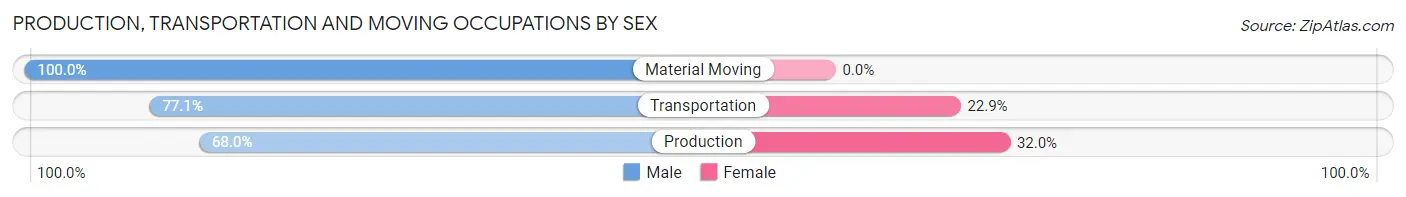
| Occupation | Male | Female |
| Production | 34 (68.0%) | 16 (32.0%) |
| Transportation | 37 (77.1%) | 11 (22.9%) |
| Material Moving | 7 (100.0%) | 0 (0.0%) |
| Total (Category) | 78 (74.3%) | 27 (25.7%) |
| Total (Overall) | 332 (55.2%) | 269 (44.8%) |
Employment Industries by Sex in Plains
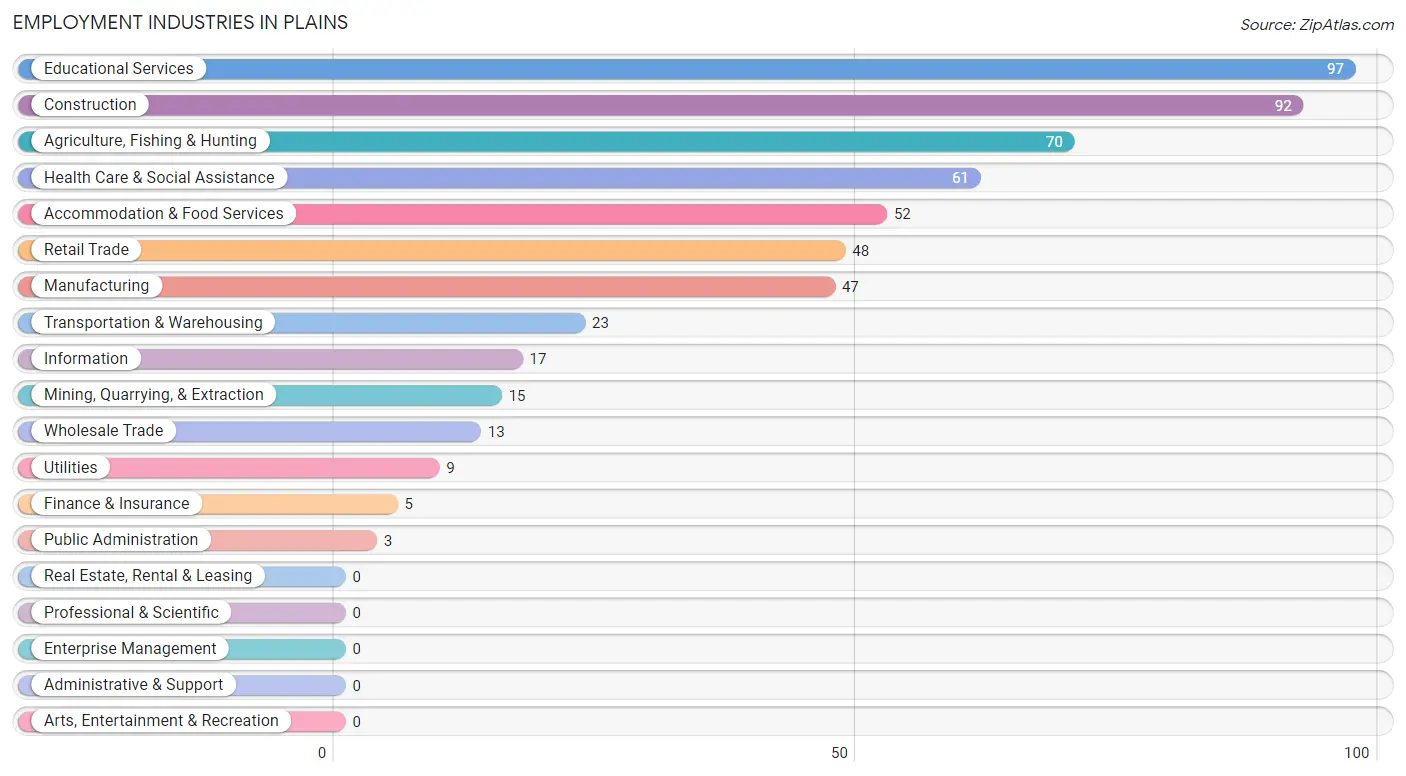
Employment Industries in Plains
The major employment industries in Plains include Educational Services (97 | 16.1%), Construction (92 | 15.3%), Agriculture, Fishing & Hunting (70 | 11.7%), Health Care & Social Assistance (61 | 10.2%), and Accommodation & Food Services (52 | 8.6%).
Employment Industries by Sex in Plains
The Plains industries that see more men than women are Mining, Quarrying, & Extraction (100.0%), Utilities (100.0%), and Construction (97.8%), whereas the industries that tend to have a higher number of women are Finance & Insurance (100.0%), Accommodation & Food Services (100.0%), and Public Administration (100.0%).
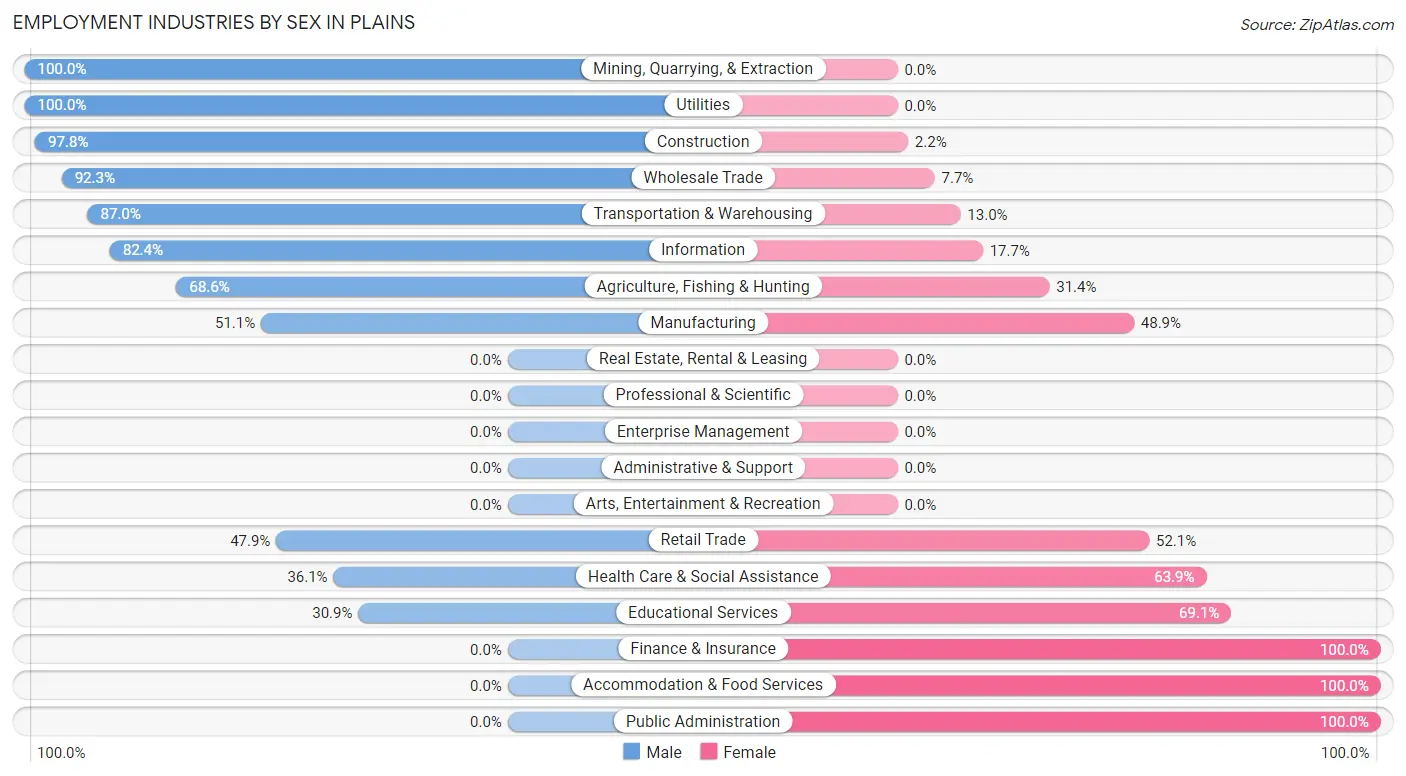
| Industry | Male | Female |
| Agriculture, Fishing & Hunting | 48 (68.6%) | 22 (31.4%) |
| Mining, Quarrying, & Extraction | 15 (100.0%) | 0 (0.0%) |
| Construction | 90 (97.8%) | 2 (2.2%) |
| Manufacturing | 24 (51.1%) | 23 (48.9%) |
| Wholesale Trade | 12 (92.3%) | 1 (7.7%) |
| Retail Trade | 23 (47.9%) | 25 (52.1%) |
| Transportation & Warehousing | 20 (87.0%) | 3 (13.0%) |
| Utilities | 9 (100.0%) | 0 (0.0%) |
| Information | 14 (82.4%) | 3 (17.6%) |
| Finance & Insurance | 0 (0.0%) | 5 (100.0%) |
| Real Estate, Rental & Leasing | 0 (0.0%) | 0 (0.0%) |
| Professional & Scientific | 0 (0.0%) | 0 (0.0%) |
| Enterprise Management | 0 (0.0%) | 0 (0.0%) |
| Administrative & Support | 0 (0.0%) | 0 (0.0%) |
| Educational Services | 30 (30.9%) | 67 (69.1%) |
| Health Care & Social Assistance | 22 (36.1%) | 39 (63.9%) |
| Arts, Entertainment & Recreation | 0 (0.0%) | 0 (0.0%) |
| Accommodation & Food Services | 0 (0.0%) | 52 (100.0%) |
| Public Administration | 0 (0.0%) | 3 (100.0%) |
| Total | 332 (55.2%) | 269 (44.8%) |
Education in Plains
School Enrollment in Plains
The most common levels of schooling among the 399 students in Plains are high school (117 | 29.3%), middle school (108 | 27.1%), and elementary school (61 | 15.3%).
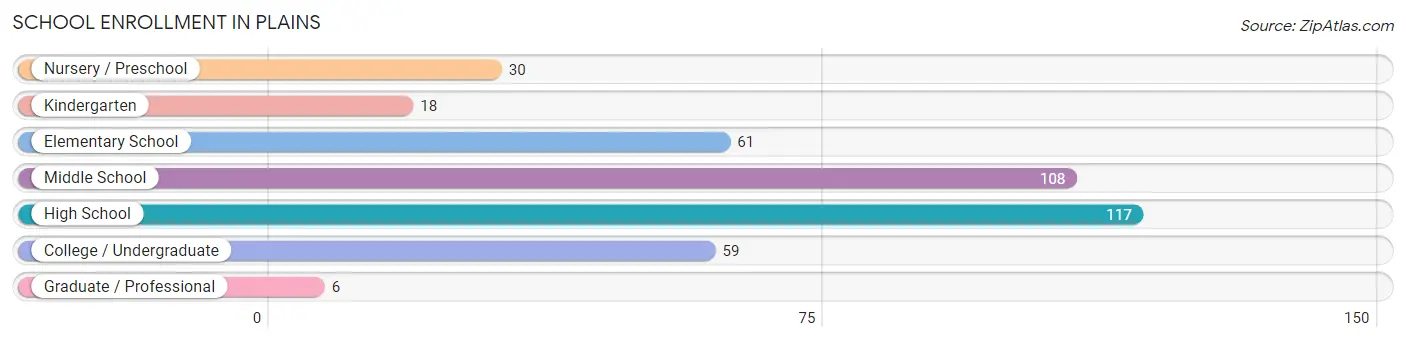
| School Level | # Students | % Students |
| Nursery / Preschool | 30 | 7.5% |
| Kindergarten | 18 | 4.5% |
| Elementary School | 61 | 15.3% |
| Middle School | 108 | 27.1% |
| High School | 117 | 29.3% |
| College / Undergraduate | 59 | 14.8% |
| Graduate / Professional | 6 | 1.5% |
| Total | 399 | 100.0% |
School Enrollment by Age by Funding Source in Plains
Out of a total of 399 students who are enrolled in schools in Plains, 32 (8.0%) attend a private institution, while the remaining 367 (92.0%) are enrolled in public schools. The age group of 18 to 19 year olds has the highest likelihood of being enrolled in private schools, with 11 (73.3% in the age bracket) enrolled. Conversely, the age group of 3 to 4 year olds has the lowest likelihood of being enrolled in a private school, with 30 (100.0% in the age bracket) attending a public institution.
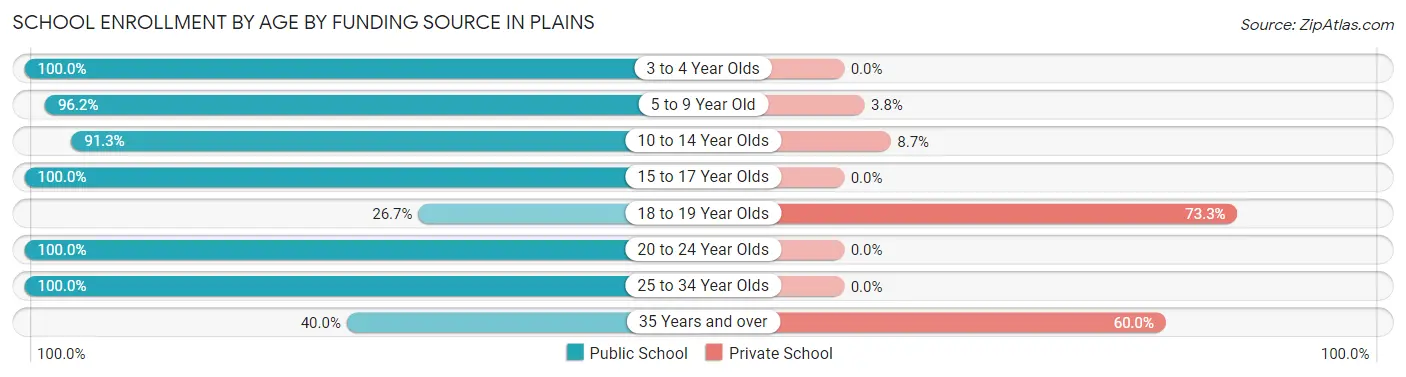
| Age Bracket | Public School | Private School |
| 3 to 4 Year Olds | 30 (100.0%) | 0 (0.0%) |
| 5 to 9 Year Old | 76 (96.2%) | 3 (3.8%) |
| 10 to 14 Year Olds | 126 (91.3%) | 12 (8.7%) |
| 15 to 17 Year Olds | 72 (100.0%) | 0 (0.0%) |
| 18 to 19 Year Olds | 4 (26.7%) | 11 (73.3%) |
| 20 to 24 Year Olds | 45 (100.0%) | 0 (0.0%) |
| 25 to 34 Year Olds | 10 (100.0%) | 0 (0.0%) |
| 35 Years and over | 4 (40.0%) | 6 (60.0%) |
| Total | 367 (92.0%) | 32 (8.0%) |
Educational Attainment by Field of Study in Plains
Education (74 | 50.0%), bio, nature & agricultural (44 | 29.7%), business (10 | 6.8%), science & technology (6 | 4.1%), and arts & humanities (4 | 2.7%) are the most common fields of study among 148 individuals in Plains who have obtained a bachelor's degree or higher.
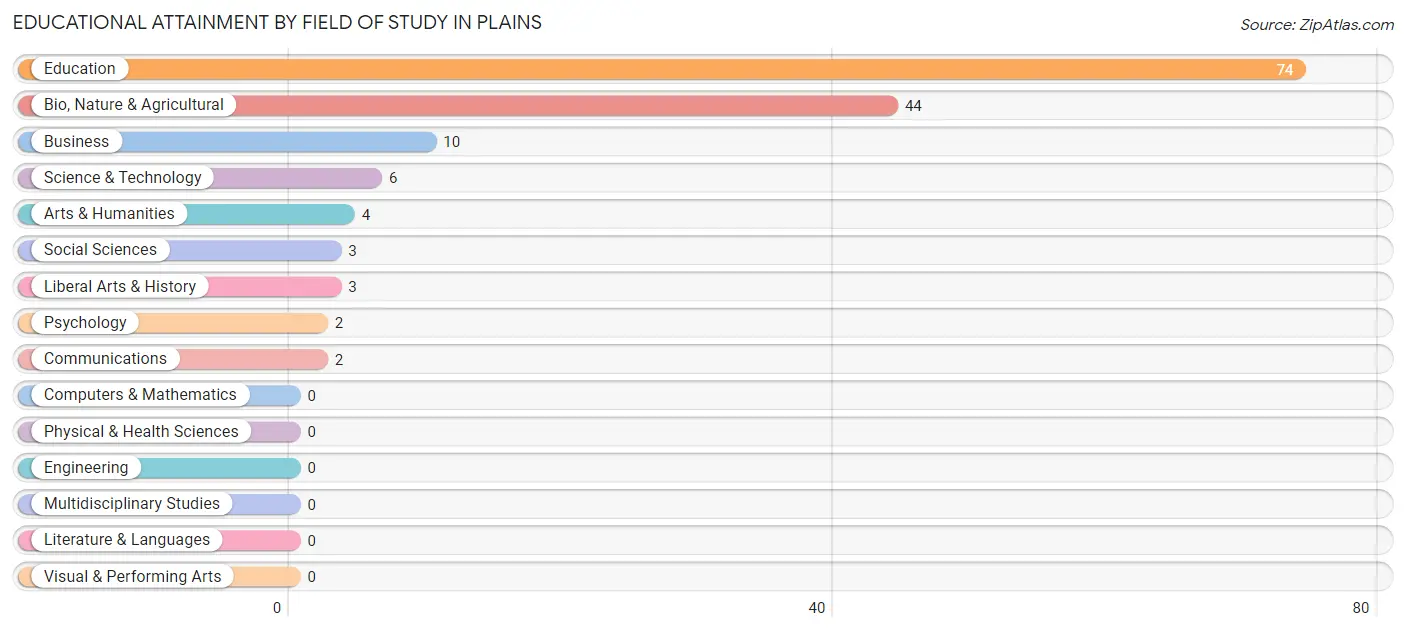
| Field of Study | # Graduates | % Graduates |
| Computers & Mathematics | 0 | 0.0% |
| Bio, Nature & Agricultural | 44 | 29.7% |
| Physical & Health Sciences | 0 | 0.0% |
| Psychology | 2 | 1.3% |
| Social Sciences | 3 | 2.0% |
| Engineering | 0 | 0.0% |
| Multidisciplinary Studies | 0 | 0.0% |
| Science & Technology | 6 | 4.1% |
| Business | 10 | 6.8% |
| Education | 74 | 50.0% |
| Literature & Languages | 0 | 0.0% |
| Liberal Arts & History | 3 | 2.0% |
| Visual & Performing Arts | 0 | 0.0% |
| Communications | 2 | 1.3% |
| Arts & Humanities | 4 | 2.7% |
| Total | 148 | 100.0% |
Transportation & Commute in Plains
Vehicle Availability by Sex in Plains
The most prevalent vehicle ownership categories in Plains are males with 2 vehicles (108, accounting for 33.6%) and females with 2 vehicles (51, making up 40.7%).
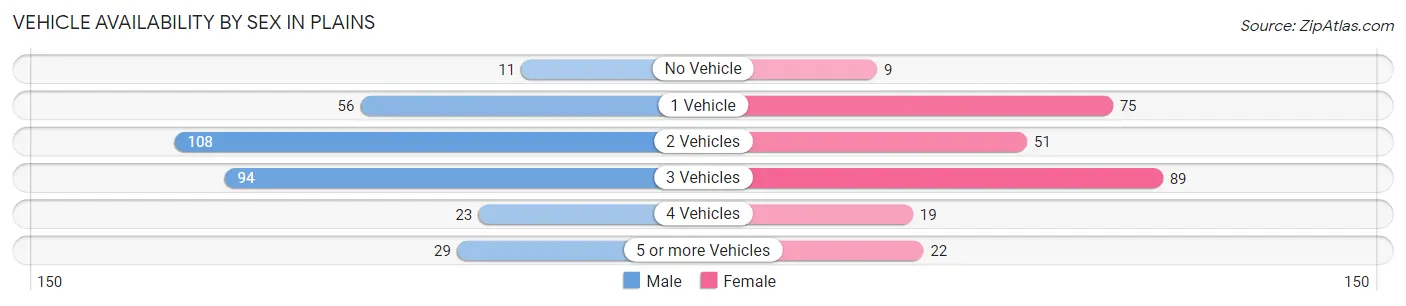
| Vehicles Available | Male | Female |
| No Vehicle | 11 (3.4%) | 9 (3.4%) |
| 1 Vehicle | 56 (17.4%) | 75 (28.3%) |
| 2 Vehicles | 108 (33.6%) | 51 (19.3%) |
| 3 Vehicles | 94 (29.3%) | 89 (33.6%) |
| 4 Vehicles | 23 (7.2%) | 19 (7.2%) |
| 5 or more Vehicles | 29 (9.0%) | 22 (8.3%) |
| Total | 321 (100.0%) | 265 (100.0%) |
Commute Time in Plains
The most frequently occuring commute durations in Plains are less than 5 minutes (177 commuters, 31.2%), 5 to 9 minutes (96 commuters, 16.9%), and 20 to 24 minutes (96 commuters, 16.9%).
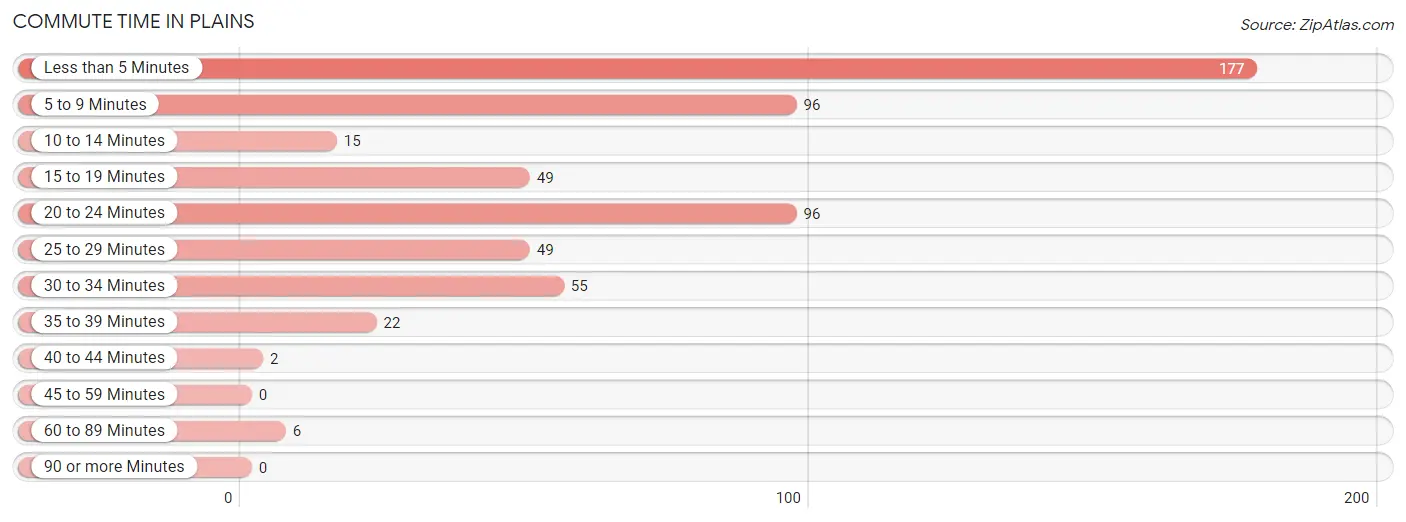
| Commute Time | # Commuters | % Commuters |
| Less than 5 Minutes | 177 | 31.2% |
| 5 to 9 Minutes | 96 | 16.9% |
| 10 to 14 Minutes | 15 | 2.6% |
| 15 to 19 Minutes | 49 | 8.6% |
| 20 to 24 Minutes | 96 | 16.9% |
| 25 to 29 Minutes | 49 | 8.6% |
| 30 to 34 Minutes | 55 | 9.7% |
| 35 to 39 Minutes | 22 | 3.9% |
| 40 to 44 Minutes | 2 | 0.4% |
| 45 to 59 Minutes | 0 | 0.0% |
| 60 to 89 Minutes | 6 | 1.1% |
| 90 or more Minutes | 0 | 0.0% |
Commute Time by Sex in Plains
The most common commute times in Plains are 20 to 24 minutes (91 commuters, 28.3%) for males and less than 5 minutes (108 commuters, 43.9%) for females.
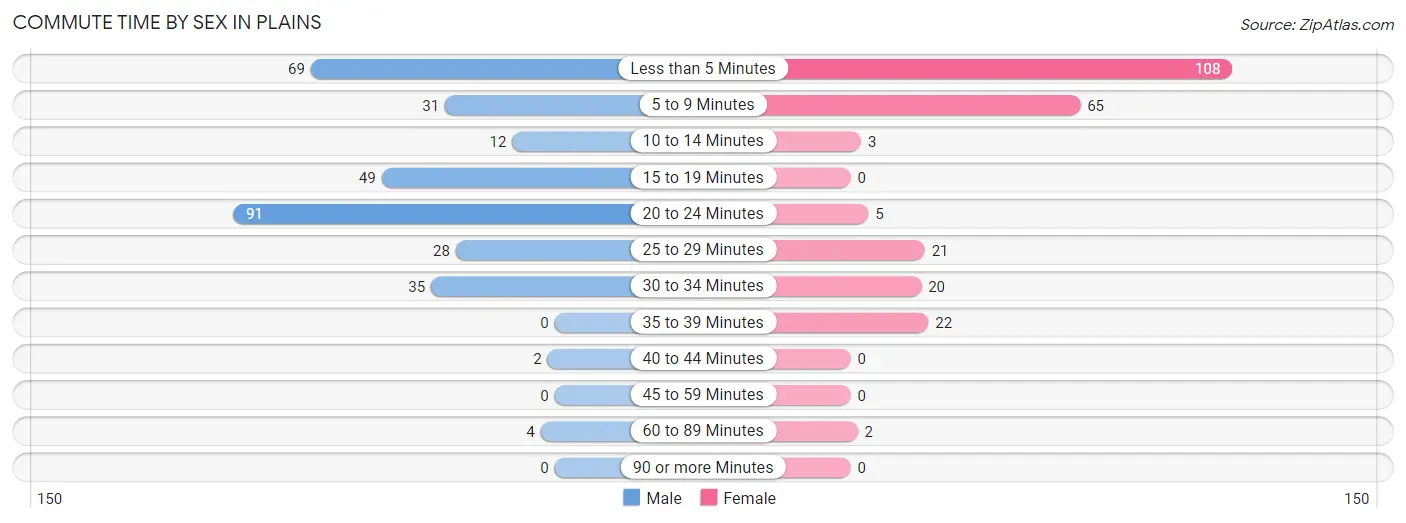
| Commute Time | Male | Female |
| Less than 5 Minutes | 69 (21.5%) | 108 (43.9%) |
| 5 to 9 Minutes | 31 (9.7%) | 65 (26.4%) |
| 10 to 14 Minutes | 12 (3.7%) | 3 (1.2%) |
| 15 to 19 Minutes | 49 (15.3%) | 0 (0.0%) |
| 20 to 24 Minutes | 91 (28.3%) | 5 (2.0%) |
| 25 to 29 Minutes | 28 (8.7%) | 21 (8.5%) |
| 30 to 34 Minutes | 35 (10.9%) | 20 (8.1%) |
| 35 to 39 Minutes | 0 (0.0%) | 22 (8.9%) |
| 40 to 44 Minutes | 2 (0.6%) | 0 (0.0%) |
| 45 to 59 Minutes | 0 (0.0%) | 0 (0.0%) |
| 60 to 89 Minutes | 4 (1.3%) | 2 (0.8%) |
| 90 or more Minutes | 0 (0.0%) | 0 (0.0%) |
Time of Departure to Work by Sex in Plains
The most frequent times of departure to work in Plains are 7:30 AM to 7:59 AM (95, 29.6%) for males and 7:30 AM to 7:59 AM (72, 29.3%) for females.
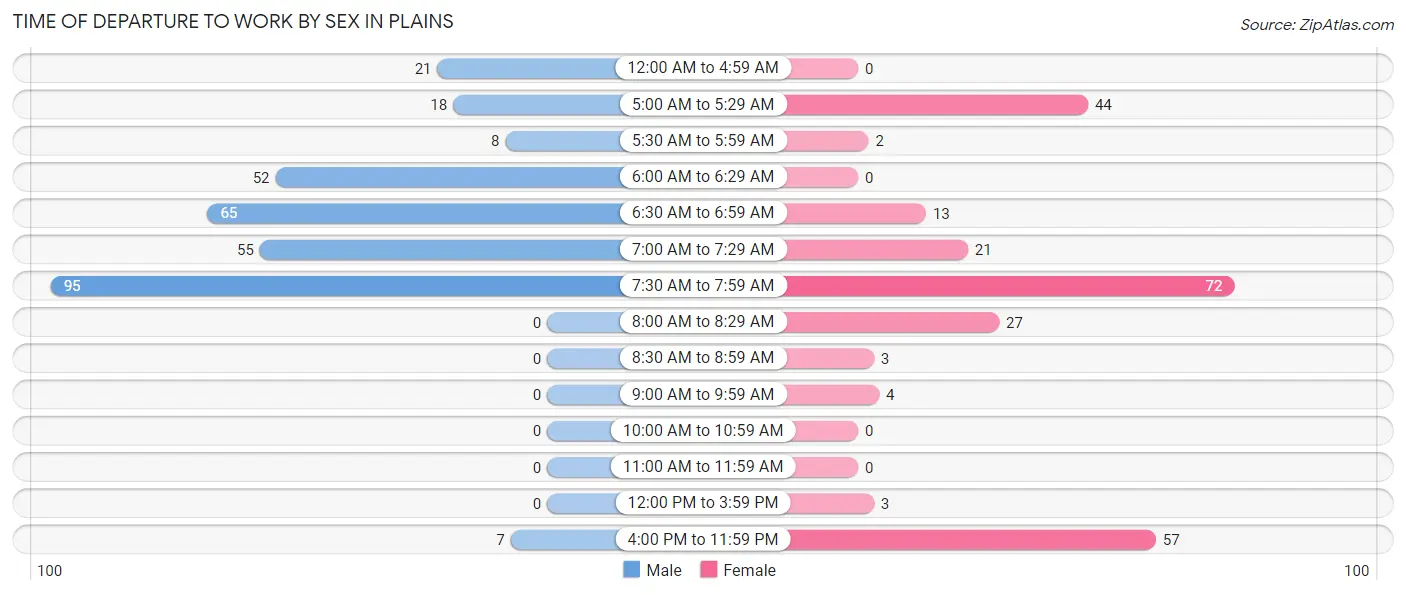
| Time of Departure | Male | Female |
| 12:00 AM to 4:59 AM | 21 (6.5%) | 0 (0.0%) |
| 5:00 AM to 5:29 AM | 18 (5.6%) | 44 (17.9%) |
| 5:30 AM to 5:59 AM | 8 (2.5%) | 2 (0.8%) |
| 6:00 AM to 6:29 AM | 52 (16.2%) | 0 (0.0%) |
| 6:30 AM to 6:59 AM | 65 (20.3%) | 13 (5.3%) |
| 7:00 AM to 7:29 AM | 55 (17.1%) | 21 (8.5%) |
| 7:30 AM to 7:59 AM | 95 (29.6%) | 72 (29.3%) |
| 8:00 AM to 8:29 AM | 0 (0.0%) | 27 (11.0%) |
| 8:30 AM to 8:59 AM | 0 (0.0%) | 3 (1.2%) |
| 9:00 AM to 9:59 AM | 0 (0.0%) | 4 (1.6%) |
| 10:00 AM to 10:59 AM | 0 (0.0%) | 0 (0.0%) |
| 11:00 AM to 11:59 AM | 0 (0.0%) | 0 (0.0%) |
| 12:00 PM to 3:59 PM | 0 (0.0%) | 3 (1.2%) |
| 4:00 PM to 11:59 PM | 7 (2.2%) | 57 (23.2%) |
| Total | 321 (100.0%) | 246 (100.0%) |
Housing Occupancy in Plains
Occupancy by Ownership in Plains
Of the total 448 dwellings in Plains, owner-occupied units account for 337 (75.2%), while renter-occupied units make up 111 (24.8%).
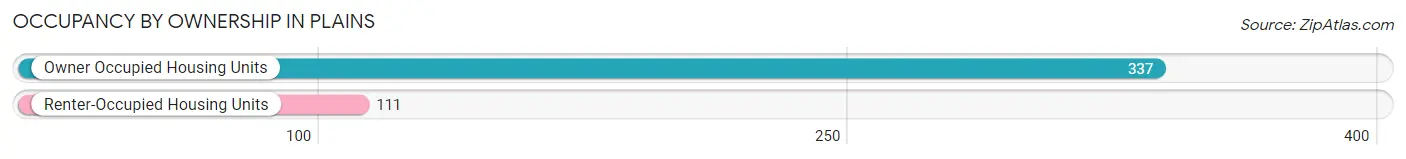
| Occupancy | # Housing Units | % Housing Units |
| Owner Occupied Housing Units | 337 | 75.2% |
| Renter-Occupied Housing Units | 111 | 24.8% |
| Total Occupied Housing Units | 448 | 100.0% |
Occupancy by Household Size in Plains
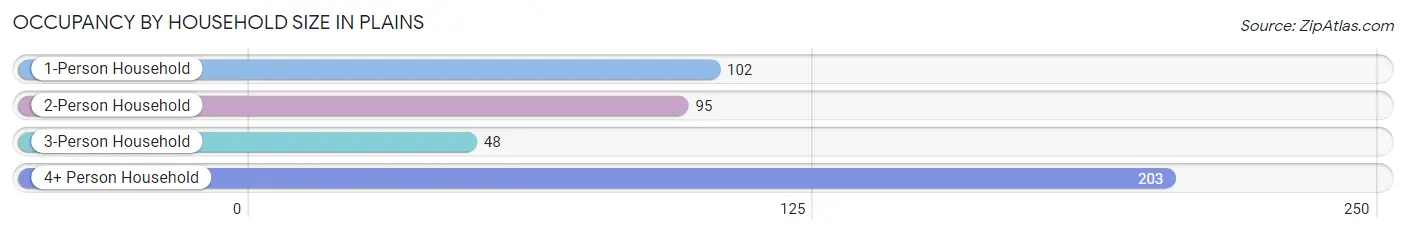
| Household Size | # Housing Units | % Housing Units |
| 1-Person Household | 102 | 22.8% |
| 2-Person Household | 95 | 21.2% |
| 3-Person Household | 48 | 10.7% |
| 4+ Person Household | 203 | 45.3% |
| Total Housing Units | 448 | 100.0% |
Occupancy by Ownership by Household Size in Plains
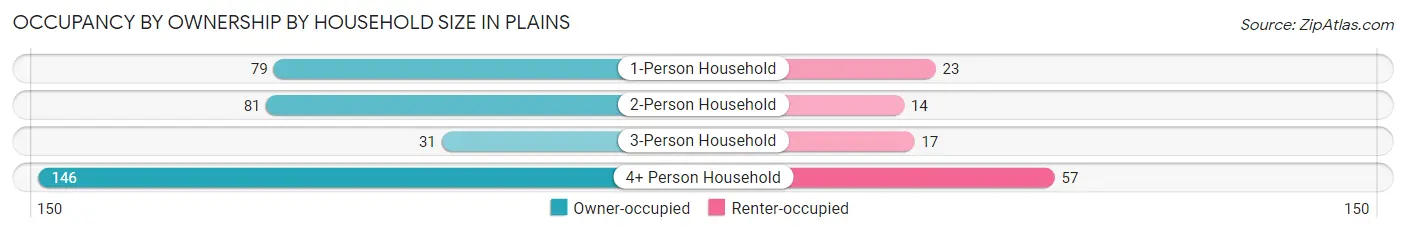
| Household Size | Owner-occupied | Renter-occupied |
| 1-Person Household | 79 (77.4%) | 23 (22.6%) |
| 2-Person Household | 81 (85.3%) | 14 (14.7%) |
| 3-Person Household | 31 (64.6%) | 17 (35.4%) |
| 4+ Person Household | 146 (71.9%) | 57 (28.1%) |
| Total Housing Units | 337 (75.2%) | 111 (24.8%) |
Occupancy by Educational Attainment in Plains
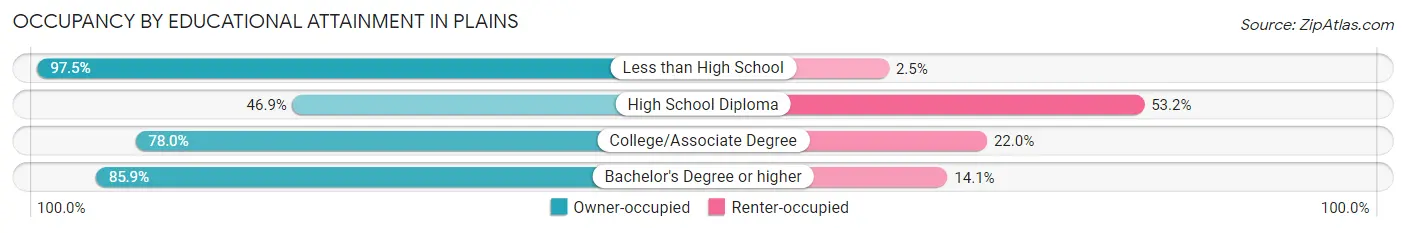
| Household Size | Owner-occupied | Renter-occupied |
| Less than High School | 77 (97.5%) | 2 (2.5%) |
| High School Diploma | 52 (46.9%) | 59 (53.1%) |
| College/Associate Degree | 135 (78.0%) | 38 (22.0%) |
| Bachelor's Degree or higher | 73 (85.9%) | 12 (14.1%) |
Occupancy by Age of Householder in Plains
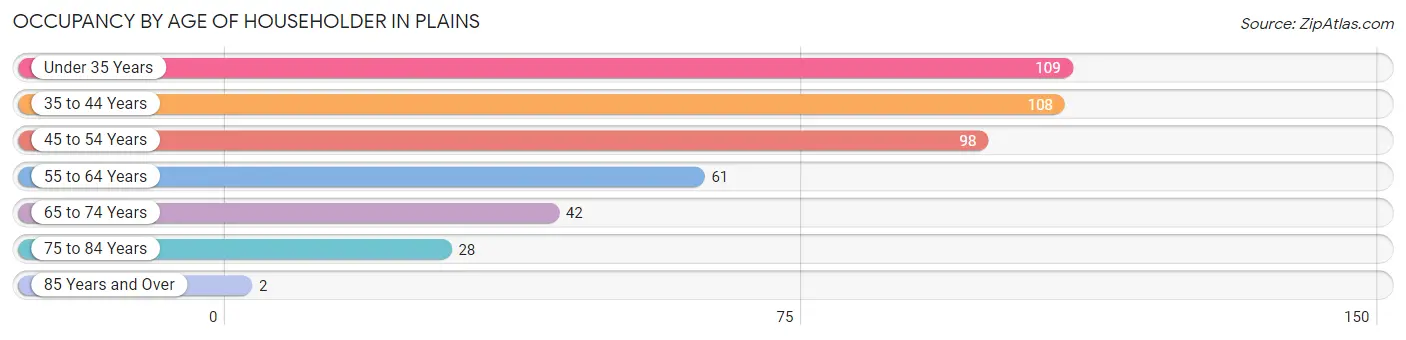
| Age Bracket | # Households | % Households |
| Under 35 Years | 109 | 24.3% |
| 35 to 44 Years | 108 | 24.1% |
| 45 to 54 Years | 98 | 21.9% |
| 55 to 64 Years | 61 | 13.6% |
| 65 to 74 Years | 42 | 9.4% |
| 75 to 84 Years | 28 | 6.2% |
| 85 Years and Over | 2 | 0.4% |
| Total | 448 | 100.0% |
Housing Finances in Plains
Median Income by Occupancy in Plains
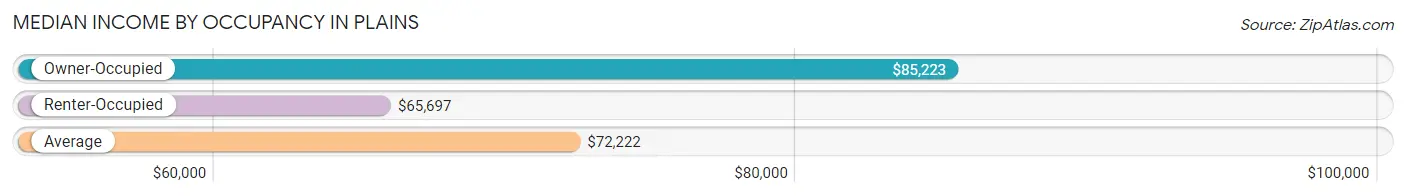
| Occupancy Type | # Households | Median Income |
| Owner-Occupied | 337 (75.2%) | $85,223 |
| Renter-Occupied | 111 (24.8%) | $65,697 |
| Average | 448 (100.0%) | $72,222 |
Occupancy by Householder Income Bracket in Plains
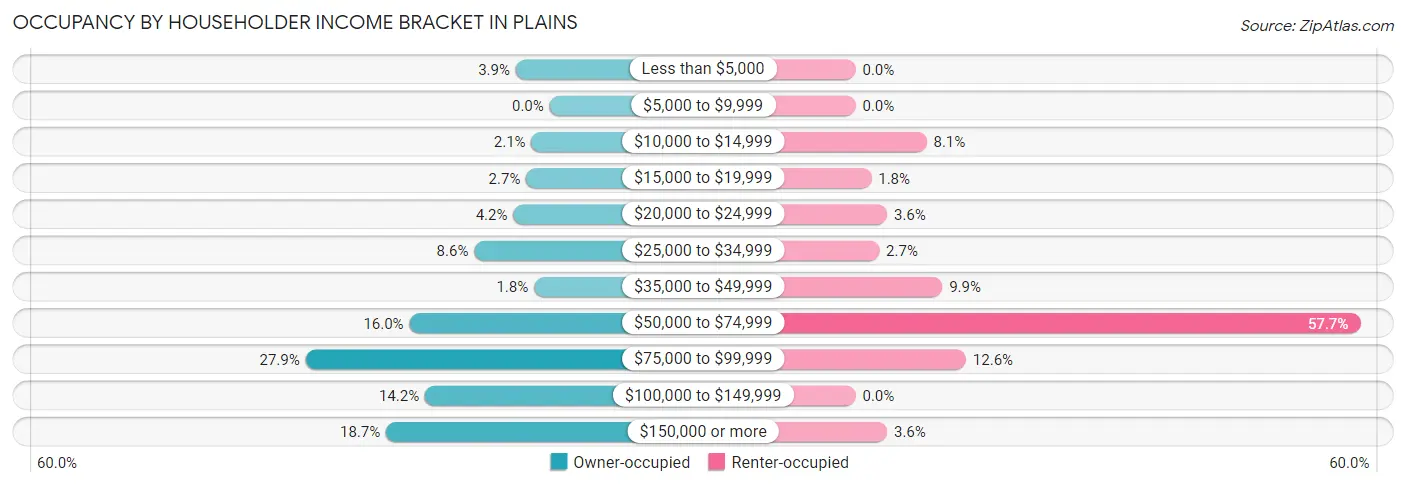
| Income Bracket | Owner-occupied | Renter-occupied |
| Less than $5,000 | 13 (3.9%) | 0 (0.0%) |
| $5,000 to $9,999 | 0 (0.0%) | 0 (0.0%) |
| $10,000 to $14,999 | 7 (2.1%) | 9 (8.1%) |
| $15,000 to $19,999 | 9 (2.7%) | 2 (1.8%) |
| $20,000 to $24,999 | 14 (4.2%) | 4 (3.6%) |
| $25,000 to $34,999 | 29 (8.6%) | 3 (2.7%) |
| $35,000 to $49,999 | 6 (1.8%) | 11 (9.9%) |
| $50,000 to $74,999 | 54 (16.0%) | 64 (57.7%) |
| $75,000 to $99,999 | 94 (27.9%) | 14 (12.6%) |
| $100,000 to $149,999 | 48 (14.2%) | 0 (0.0%) |
| $150,000 or more | 63 (18.7%) | 4 (3.6%) |
| Total | 337 (100.0%) | 111 (100.0%) |
Monthly Housing Cost Tiers in Plains
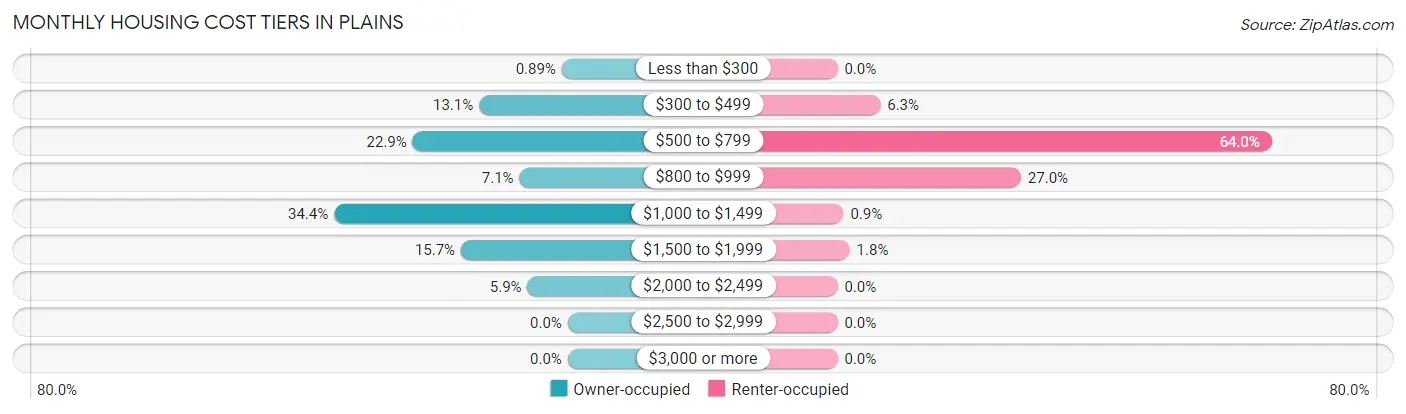
| Monthly Cost | Owner-occupied | Renter-occupied |
| Less than $300 | 3 (0.9%) | 0 (0.0%) |
| $300 to $499 | 44 (13.1%) | 7 (6.3%) |
| $500 to $799 | 77 (22.9%) | 71 (64.0%) |
| $800 to $999 | 24 (7.1%) | 30 (27.0%) |
| $1,000 to $1,499 | 116 (34.4%) | 1 (0.9%) |
| $1,500 to $1,999 | 53 (15.7%) | 2 (1.8%) |
| $2,000 to $2,499 | 20 (5.9%) | 0 (0.0%) |
| $2,500 to $2,999 | 0 (0.0%) | 0 (0.0%) |
| $3,000 or more | 0 (0.0%) | 0 (0.0%) |
| Total | 337 (100.0%) | 111 (100.0%) |
Physical Housing Characteristics in Plains
Housing Structures in Plains
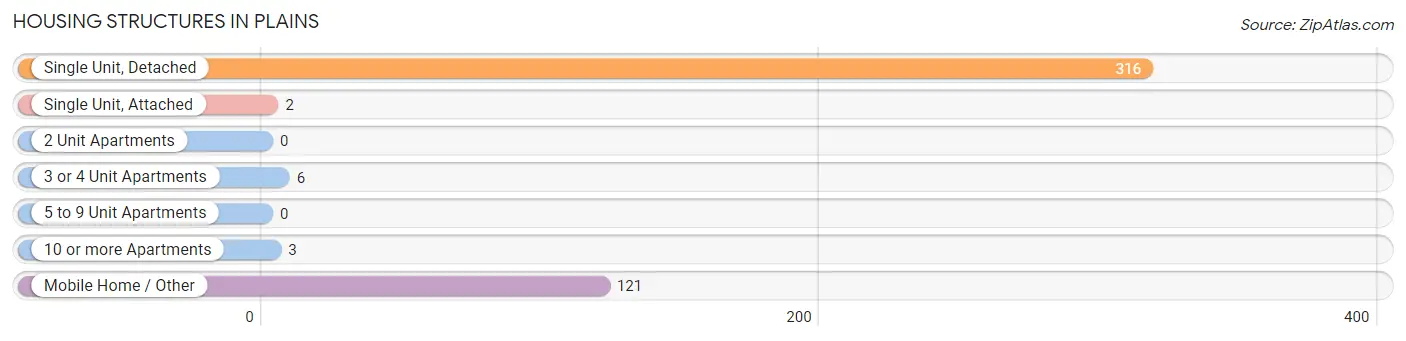
| Structure Type | # Housing Units | % Housing Units |
| Single Unit, Detached | 316 | 70.5% |
| Single Unit, Attached | 2 | 0.4% |
| 2 Unit Apartments | 0 | 0.0% |
| 3 or 4 Unit Apartments | 6 | 1.3% |
| 5 to 9 Unit Apartments | 0 | 0.0% |
| 10 or more Apartments | 3 | 0.7% |
| Mobile Home / Other | 121 | 27.0% |
| Total | 448 | 100.0% |
Housing Structures by Occupancy in Plains
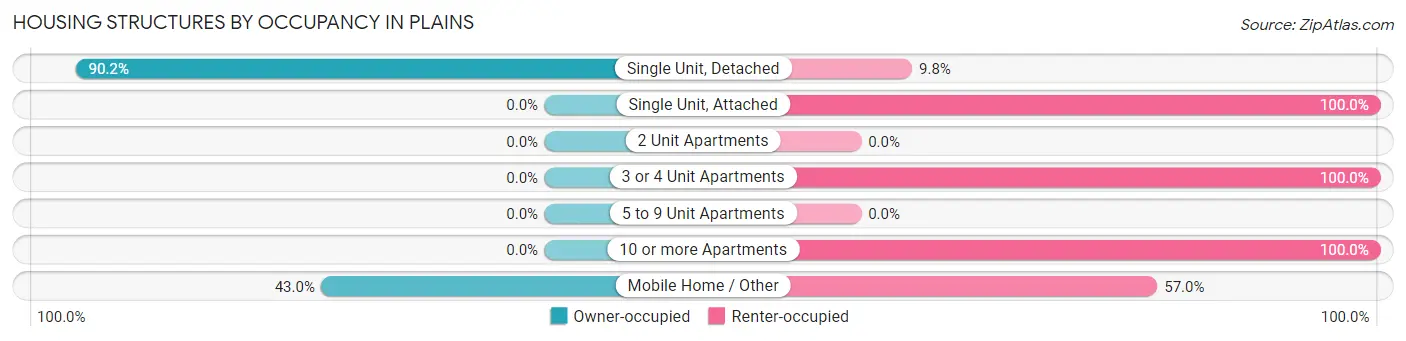
| Structure Type | Owner-occupied | Renter-occupied |
| Single Unit, Detached | 285 (90.2%) | 31 (9.8%) |
| Single Unit, Attached | 0 (0.0%) | 2 (100.0%) |
| 2 Unit Apartments | 0 (0.0%) | 0 (0.0%) |
| 3 or 4 Unit Apartments | 0 (0.0%) | 6 (100.0%) |
| 5 to 9 Unit Apartments | 0 (0.0%) | 0 (0.0%) |
| 10 or more Apartments | 0 (0.0%) | 3 (100.0%) |
| Mobile Home / Other | 52 (43.0%) | 69 (57.0%) |
| Total | 337 (75.2%) | 111 (24.8%) |
Housing Structures by Number of Rooms in Plains
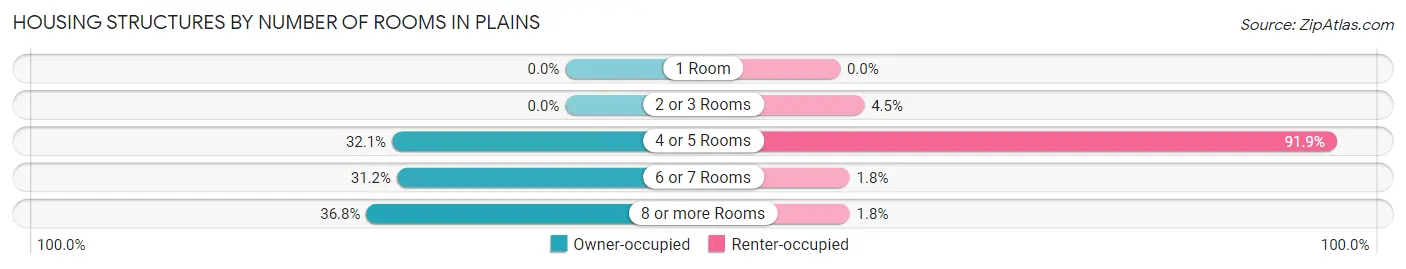
| Number of Rooms | Owner-occupied | Renter-occupied |
| 1 Room | 0 (0.0%) | 0 (0.0%) |
| 2 or 3 Rooms | 0 (0.0%) | 5 (4.5%) |
| 4 or 5 Rooms | 108 (32.1%) | 102 (91.9%) |
| 6 or 7 Rooms | 105 (31.2%) | 2 (1.8%) |
| 8 or more Rooms | 124 (36.8%) | 2 (1.8%) |
| Total | 337 (100.0%) | 111 (100.0%) |
Housing Structure by Heating Type in Plains
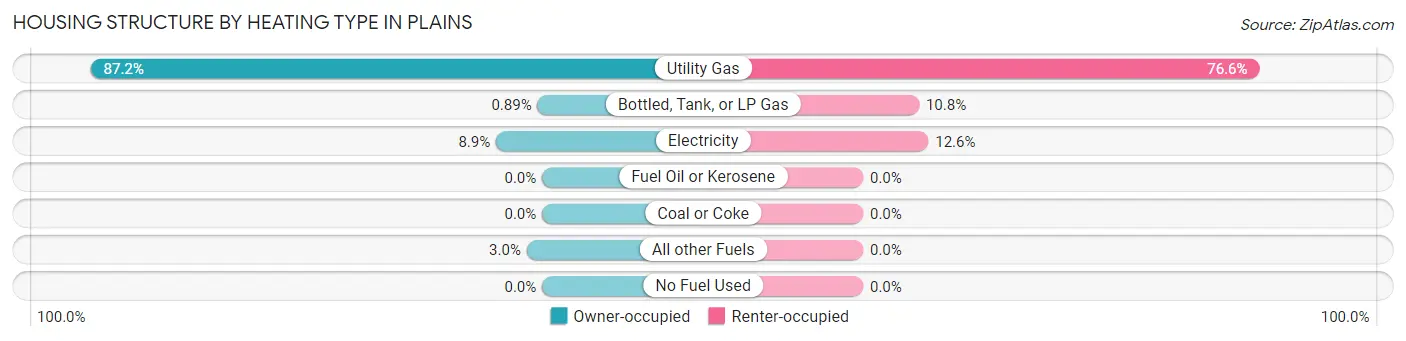
| Heating Type | Owner-occupied | Renter-occupied |
| Utility Gas | 294 (87.2%) | 85 (76.6%) |
| Bottled, Tank, or LP Gas | 3 (0.9%) | 12 (10.8%) |
| Electricity | 30 (8.9%) | 14 (12.6%) |
| Fuel Oil or Kerosene | 0 (0.0%) | 0 (0.0%) |
| Coal or Coke | 0 (0.0%) | 0 (0.0%) |
| All other Fuels | 10 (3.0%) | 0 (0.0%) |
| No Fuel Used | 0 (0.0%) | 0 (0.0%) |
| Total | 337 (100.0%) | 111 (100.0%) |
Household Vehicle Usage in Plains
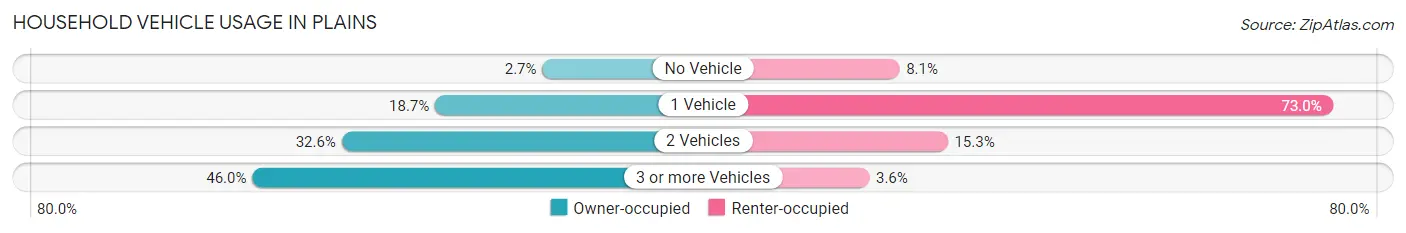
| Vehicles per Household | Owner-occupied | Renter-occupied |
| No Vehicle | 9 (2.7%) | 9 (8.1%) |
| 1 Vehicle | 63 (18.7%) | 81 (73.0%) |
| 2 Vehicles | 110 (32.6%) | 17 (15.3%) |
| 3 or more Vehicles | 155 (46.0%) | 4 (3.6%) |
| Total | 337 (100.0%) | 111 (100.0%) |
Real Estate & Mortgages in Plains
Real Estate and Mortgage Overview in Plains
| Characteristic | Without Mortgage | With Mortgage |
| Housing Units | 135 | 202 |
| Median Property Value | $111,700 | $151,300 |
| Median Household Income | $87,396 | $29 |
| Monthly Housing Costs | $566 | $0 |
| Real Estate Taxes | $1,603 | $33 |
Property Value by Mortgage Status in Plains
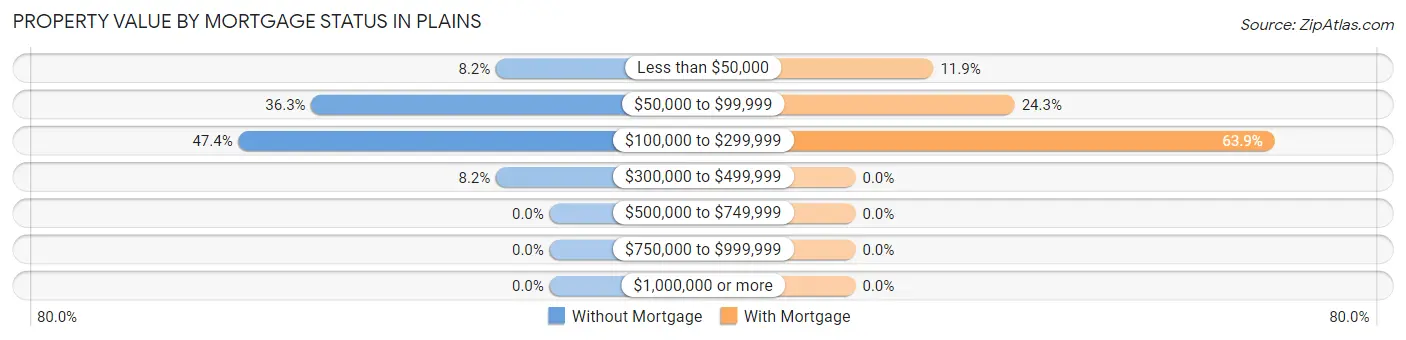
| Property Value | Without Mortgage | With Mortgage |
| Less than $50,000 | 11 (8.2%) | 24 (11.9%) |
| $50,000 to $99,999 | 49 (36.3%) | 49 (24.3%) |
| $100,000 to $299,999 | 64 (47.4%) | 129 (63.9%) |
| $300,000 to $499,999 | 11 (8.2%) | 0 (0.0%) |
| $500,000 to $749,999 | 0 (0.0%) | 0 (0.0%) |
| $750,000 to $999,999 | 0 (0.0%) | 0 (0.0%) |
| $1,000,000 or more | 0 (0.0%) | 0 (0.0%) |
| Total | 135 (100.0%) | 202 (100.0%) |
Household Income by Mortgage Status in Plains
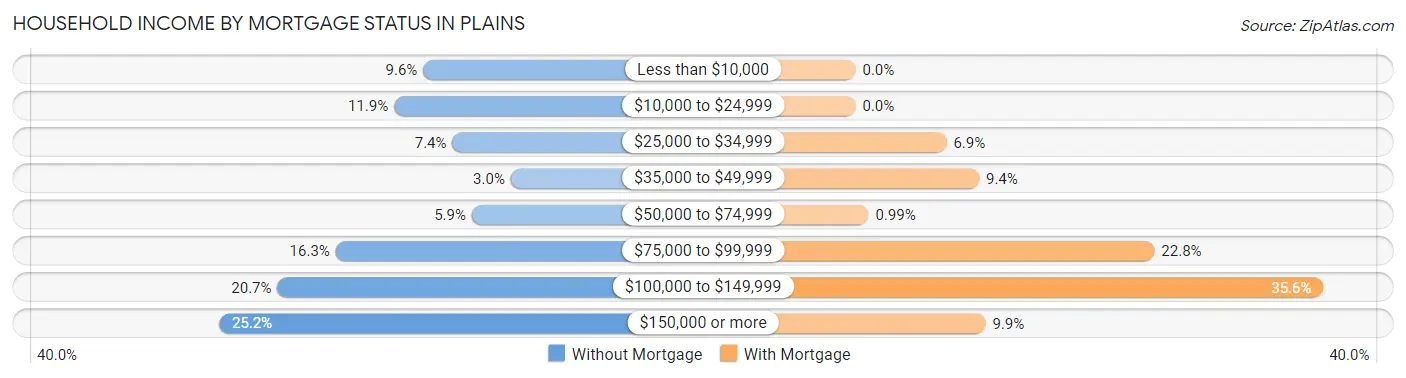
| Household Income | Without Mortgage | With Mortgage |
| Less than $10,000 | 13 (9.6%) | 0 (0.0%) |
| $10,000 to $24,999 | 16 (11.8%) | 0 (0.0%) |
| $25,000 to $34,999 | 10 (7.4%) | 14 (6.9%) |
| $35,000 to $49,999 | 4 (3.0%) | 19 (9.4%) |
| $50,000 to $74,999 | 8 (5.9%) | 2 (1.0%) |
| $75,000 to $99,999 | 22 (16.3%) | 46 (22.8%) |
| $100,000 to $149,999 | 28 (20.7%) | 72 (35.6%) |
| $150,000 or more | 34 (25.2%) | 20 (9.9%) |
| Total | 135 (100.0%) | 202 (100.0%) |
Property Value to Household Income Ratio in Plains
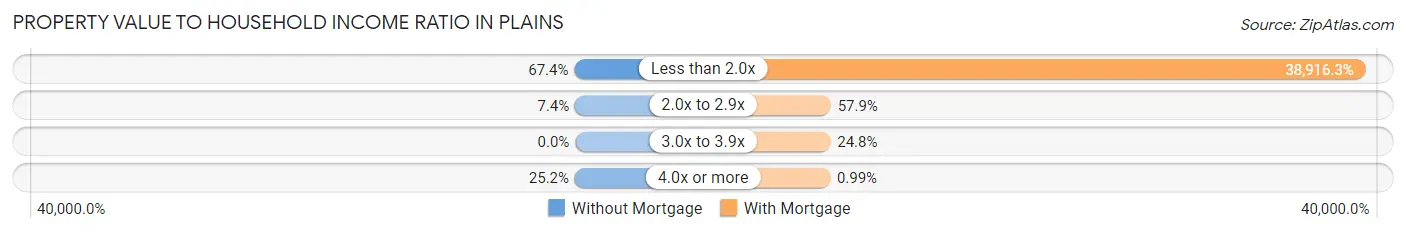
| Value-to-Income Ratio | Without Mortgage | With Mortgage |
| Less than 2.0x | 91 (67.4%) | 78,611 (38,916.3%) |
| 2.0x to 2.9x | 10 (7.4%) | 117 (57.9%) |
| 3.0x to 3.9x | 0 (0.0%) | 50 (24.7%) |
| 4.0x or more | 34 (25.2%) | 2 (1.0%) |
| Total | 135 (100.0%) | 202 (100.0%) |
Real Estate Taxes by Mortgage Status in Plains
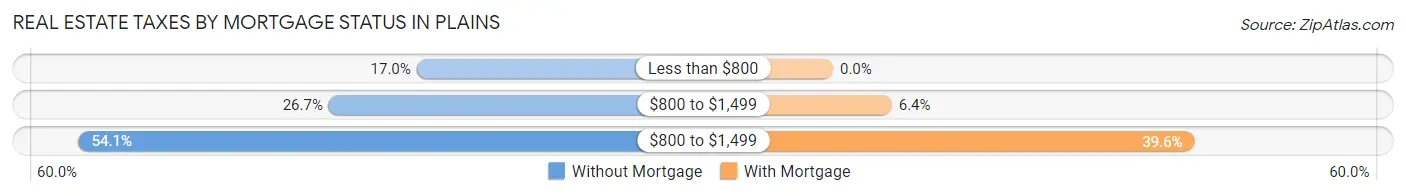
| Property Taxes | Without Mortgage | With Mortgage |
| Less than $800 | 23 (17.0%) | 0 (0.0%) |
| $800 to $1,499 | 36 (26.7%) | 13 (6.4%) |
| $800 to $1,499 | 73 (54.1%) | 80 (39.6%) |
| Total | 135 (100.0%) | 202 (100.0%) |
Health & Disability in Plains
Health Insurance Coverage by Age in Plains
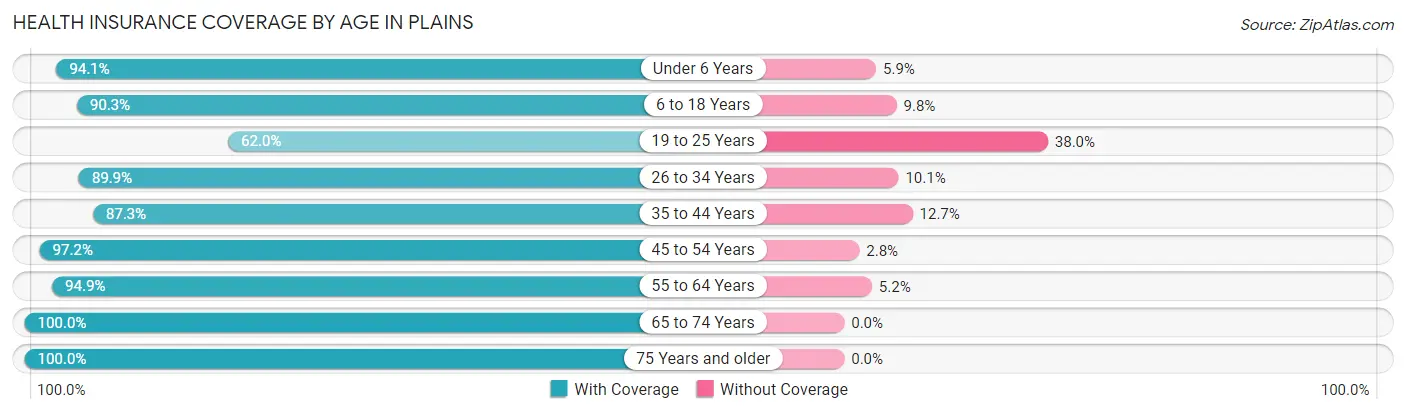
| Age Bracket | With Coverage | Without Coverage |
| Under 6 Years | 127 (94.1%) | 8 (5.9%) |
| 6 to 18 Years | 287 (90.2%) | 31 (9.8%) |
| 19 to 25 Years | 85 (62.0%) | 52 (38.0%) |
| 26 to 34 Years | 80 (89.9%) | 9 (10.1%) |
| 35 to 44 Years | 185 (87.3%) | 27 (12.7%) |
| 45 to 54 Years | 173 (97.2%) | 5 (2.8%) |
| 55 to 64 Years | 92 (94.9%) | 5 (5.1%) |
| 65 to 74 Years | 57 (100.0%) | 0 (0.0%) |
| 75 Years and older | 43 (100.0%) | 0 (0.0%) |
| Total | 1,129 (89.2%) | 137 (10.8%) |
Health Insurance Coverage by Citizenship Status in Plains
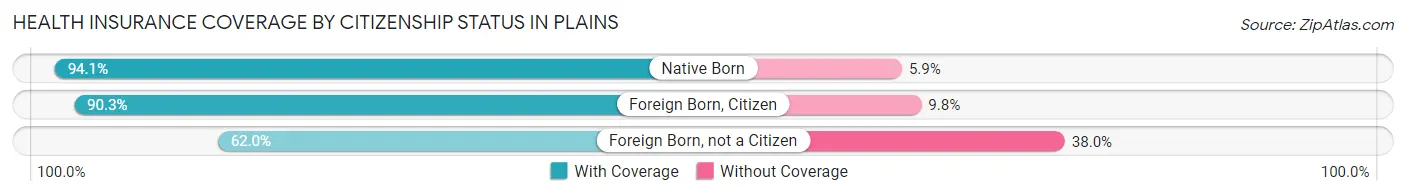
| Citizenship Status | With Coverage | Without Coverage |
| Native Born | 127 (94.1%) | 8 (5.9%) |
| Foreign Born, Citizen | 287 (90.2%) | 31 (9.8%) |
| Foreign Born, not a Citizen | 85 (62.0%) | 52 (38.0%) |
Health Insurance Coverage by Household Income in Plains
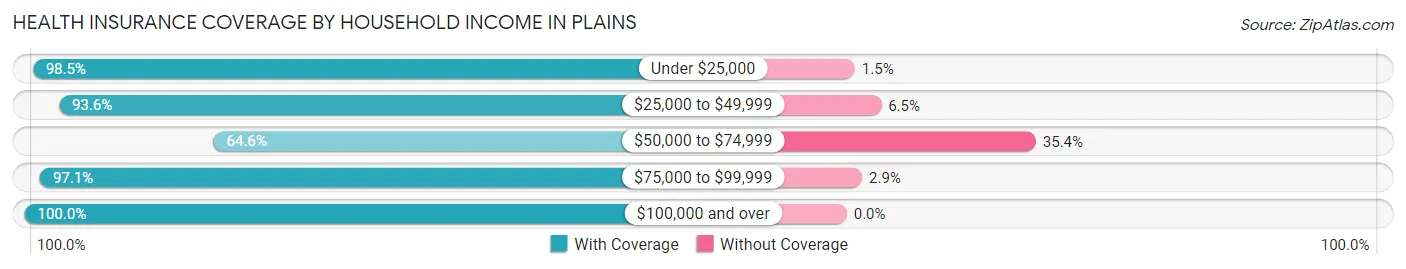
| Household Income | With Coverage | Without Coverage |
| Under $25,000 | 65 (98.5%) | 1 (1.5%) |
| $25,000 to $49,999 | 116 (93.5%) | 8 (6.5%) |
| $50,000 to $74,999 | 217 (64.6%) | 119 (35.4%) |
| $75,000 to $99,999 | 303 (97.1%) | 9 (2.9%) |
| $100,000 and over | 428 (100.0%) | 0 (0.0%) |
Public vs Private Health Insurance Coverage by Age in Plains
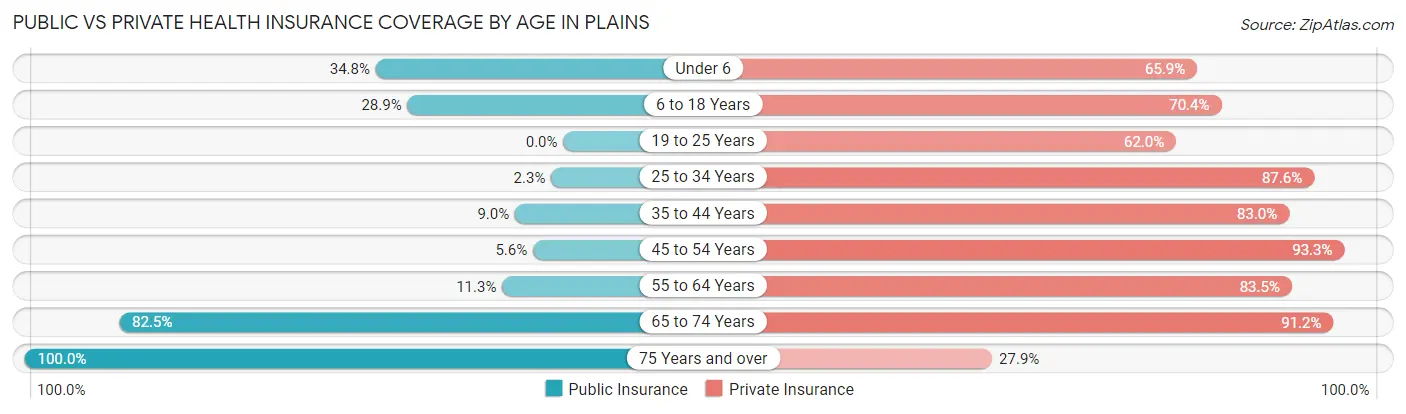
| Age Bracket | Public Insurance | Private Insurance |
| Under 6 | 47 (34.8%) | 89 (65.9%) |
| 6 to 18 Years | 92 (28.9%) | 224 (70.4%) |
| 19 to 25 Years | 0 (0.0%) | 85 (62.0%) |
| 25 to 34 Years | 2 (2.2%) | 78 (87.6%) |
| 35 to 44 Years | 19 (9.0%) | 176 (83.0%) |
| 45 to 54 Years | 10 (5.6%) | 166 (93.3%) |
| 55 to 64 Years | 11 (11.3%) | 81 (83.5%) |
| 65 to 74 Years | 47 (82.5%) | 52 (91.2%) |
| 75 Years and over | 43 (100.0%) | 12 (27.9%) |
| Total | 271 (21.4%) | 963 (76.1%) |
Disability Status by Sex by Age in Plains
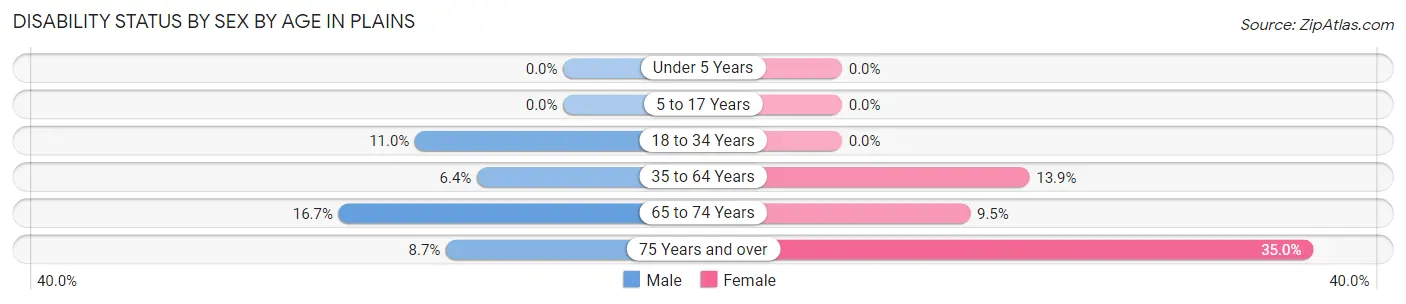
| Age Bracket | Male | Female |
| Under 5 Years | 0 (0.0%) | 0 (0.0%) |
| 5 to 17 Years | 0 (0.0%) | 0 (0.0%) |
| 18 to 34 Years | 11 (11.0%) | 0 (0.0%) |
| 35 to 64 Years | 16 (6.4%) | 33 (13.9%) |
| 65 to 74 Years | 6 (16.7%) | 2 (9.5%) |
| 75 Years and over | 2 (8.7%) | 7 (35.0%) |
Disability Class by Sex by Age in Plains
Disability Class: Hearing Difficulty
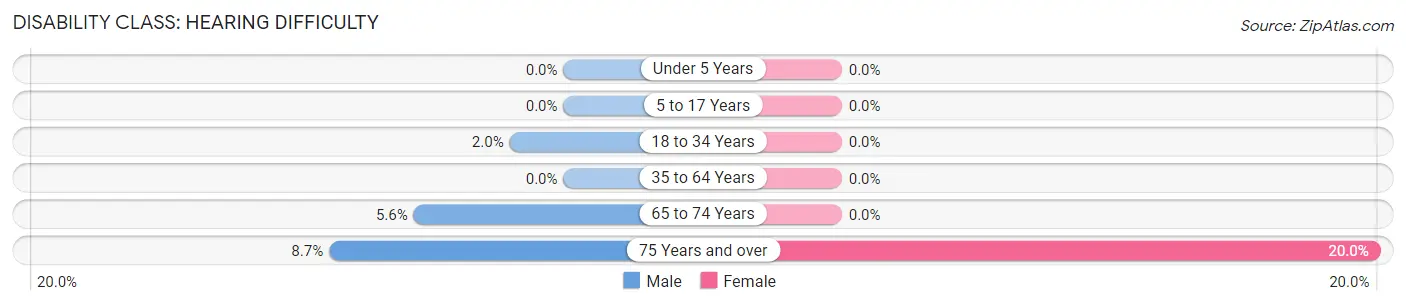
| Age Bracket | Male | Female |
| Under 5 Years | 0 (0.0%) | 0 (0.0%) |
| 5 to 17 Years | 0 (0.0%) | 0 (0.0%) |
| 18 to 34 Years | 2 (2.0%) | 0 (0.0%) |
| 35 to 64 Years | 0 (0.0%) | 0 (0.0%) |
| 65 to 74 Years | 2 (5.6%) | 0 (0.0%) |
| 75 Years and over | 2 (8.7%) | 4 (20.0%) |
Disability Class: Vision Difficulty
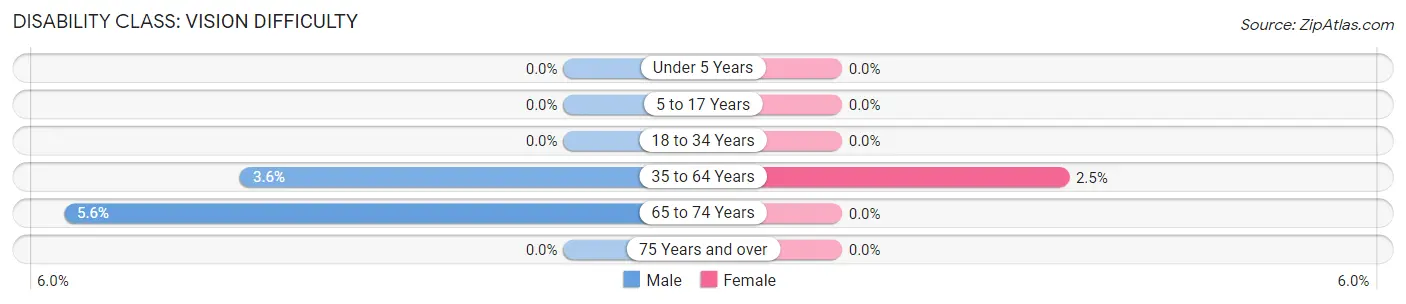
| Age Bracket | Male | Female |
| Under 5 Years | 0 (0.0%) | 0 (0.0%) |
| 5 to 17 Years | 0 (0.0%) | 0 (0.0%) |
| 18 to 34 Years | 0 (0.0%) | 0 (0.0%) |
| 35 to 64 Years | 9 (3.6%) | 6 (2.5%) |
| 65 to 74 Years | 2 (5.6%) | 0 (0.0%) |
| 75 Years and over | 0 (0.0%) | 0 (0.0%) |
Disability Class: Cognitive Difficulty
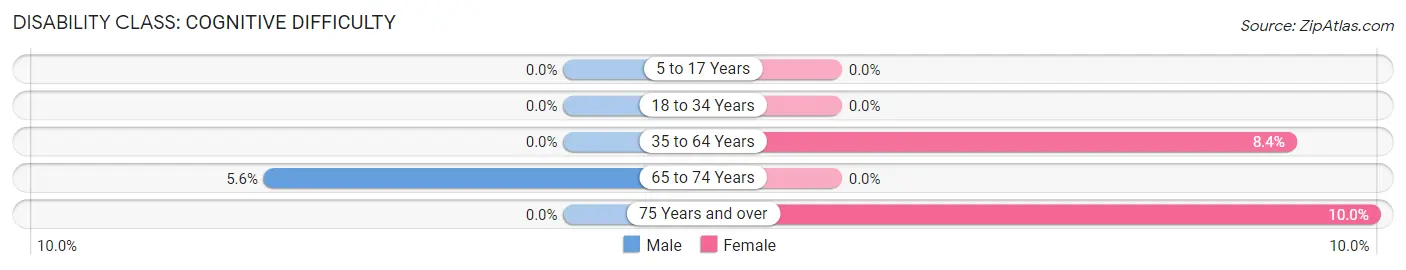
| Age Bracket | Male | Female |
| 5 to 17 Years | 0 (0.0%) | 0 (0.0%) |
| 18 to 34 Years | 0 (0.0%) | 0 (0.0%) |
| 35 to 64 Years | 0 (0.0%) | 20 (8.4%) |
| 65 to 74 Years | 2 (5.6%) | 0 (0.0%) |
| 75 Years and over | 0 (0.0%) | 2 (10.0%) |
Disability Class: Ambulatory Difficulty
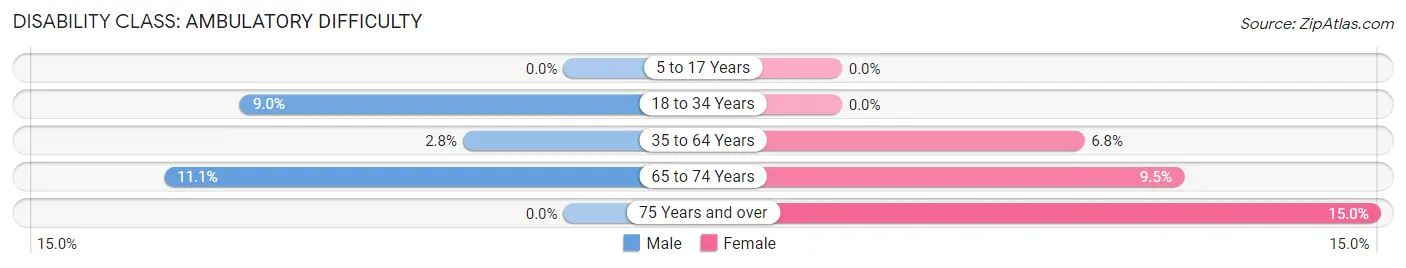
| Age Bracket | Male | Female |
| 5 to 17 Years | 0 (0.0%) | 0 (0.0%) |
| 18 to 34 Years | 9 (9.0%) | 0 (0.0%) |
| 35 to 64 Years | 7 (2.8%) | 16 (6.8%) |
| 65 to 74 Years | 4 (11.1%) | 2 (9.5%) |
| 75 Years and over | 0 (0.0%) | 3 (15.0%) |
Disability Class: Self-Care Difficulty
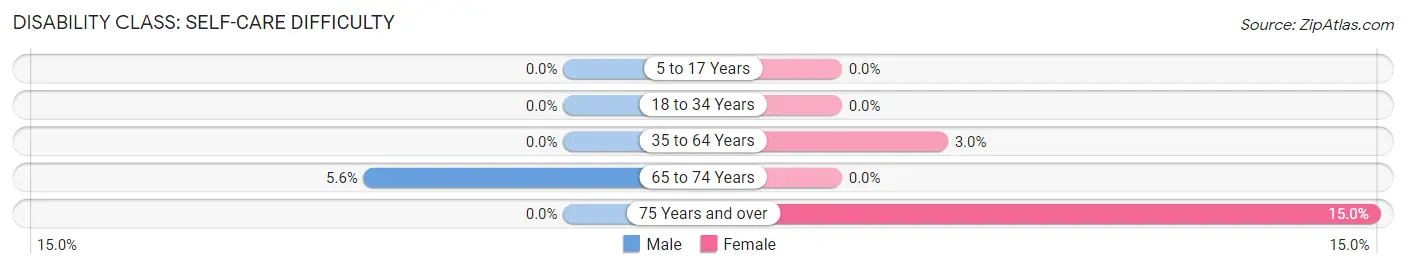
| Age Bracket | Male | Female |
| 5 to 17 Years | 0 (0.0%) | 0 (0.0%) |
| 18 to 34 Years | 0 (0.0%) | 0 (0.0%) |
| 35 to 64 Years | 0 (0.0%) | 7 (2.9%) |
| 65 to 74 Years | 2 (5.6%) | 0 (0.0%) |
| 75 Years and over | 0 (0.0%) | 3 (15.0%) |
Technology Access in Plains
Computing Device Access in Plains
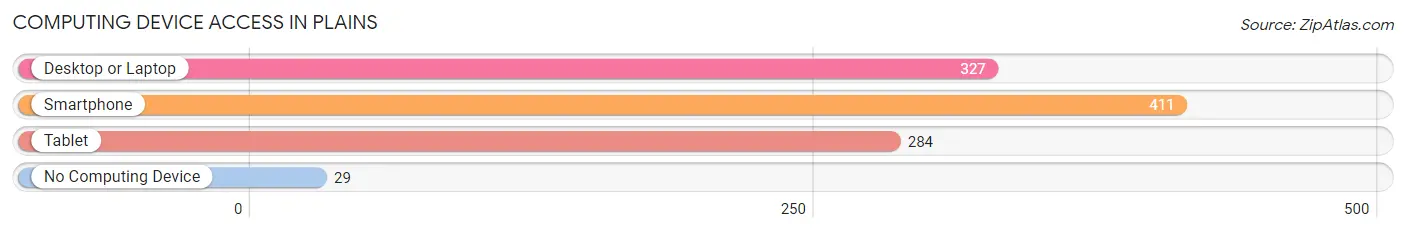
| Device Type | # Households | % Households |
| Desktop or Laptop | 327 | 73.0% |
| Smartphone | 411 | 91.7% |
| Tablet | 284 | 63.4% |
| No Computing Device | 29 | 6.5% |
| Total | 448 | 100.0% |
Internet Access in Plains
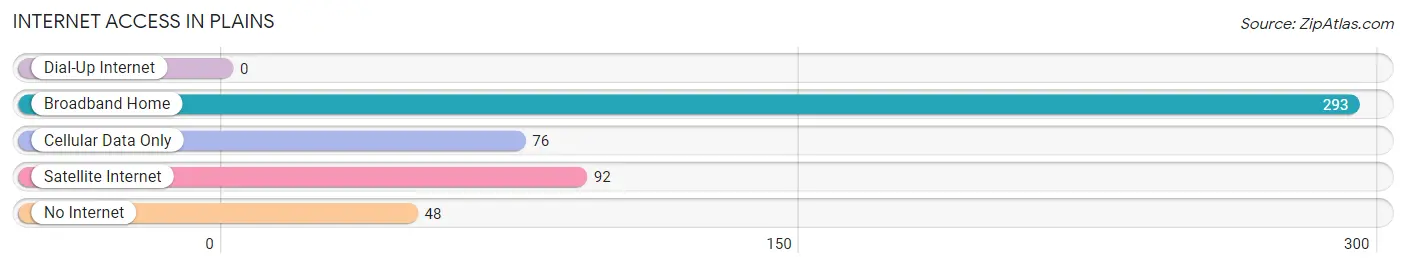
| Internet Type | # Households | % Households |
| Dial-Up Internet | 0 | 0.0% |
| Broadband Home | 293 | 65.4% |
| Cellular Data Only | 76 | 17.0% |
| Satellite Internet | 92 | 20.5% |
| No Internet | 48 | 10.7% |
| Total | 448 | 100.0% |
Plains Summary
Plains, Kansas is a small town located in the southwestern corner of the state. It is situated in the High Plains region of the Great Plains, and is part of the larger High Plains region of the United States. The town is located in the county of Meade, and is the county seat. The population of Plains, Kansas was estimated to be 1,072 in 2019.
Geography
Plains, Kansas is located in the High Plains region of the Great Plains. The town is situated in the southwestern corner of the state, and is part of the larger High Plains region of the United States. The town is located in the county of Meade, and is the county seat. Plains, Kansas is located at an elevation of 3,845 feet above sea level. The town is located in the Central Time Zone, and is in the Mountain Standard Time Zone during the summer months.
The town of Plains, Kansas is located in a semi-arid climate, with hot summers and cold winters. The average annual temperature is around 54 degrees Fahrenheit, with an average high of around 85 degrees Fahrenheit in the summer months and an average low of around 25 degrees Fahrenheit in the winter months. The average annual precipitation is around 17 inches, with most of the precipitation occurring in the spring and summer months.
Economy
The economy of Plains, Kansas is largely based on agriculture and ranching. The town is home to several large farms and ranches, which produce a variety of crops and livestock. The town is also home to several small businesses, including a grocery store, a hardware store, and a few restaurants. The town is also home to a few manufacturing companies, which produce a variety of products, including furniture, clothing, and electronics.
Demographics
The population of Plains, Kansas was estimated to be 1,072 in 2019. The town is predominantly white, with around 95% of the population identifying as white. The remaining 5% of the population is made up of African Americans, Native Americans, and other races. The median household income in Plains, Kansas is around $45,000, and the median home value is around $90,000.
The town of Plains, Kansas is served by the Meade County School District, which includes one elementary school, one middle school, and one high school. The town is also home to a few churches, including the First United Methodist Church, the Plains Baptist Church, and the Plains Presbyterian Church.
Conclusion
Plains, Kansas is a small town located in the southwestern corner of the state. It is situated in the High Plains region of the Great Plains, and is part of the larger High Plains region of the United States. The town is located in the county of Meade, and is the county seat. The population of Plains, Kansas was estimated to be 1,072 in 2019. The economy of Plains, Kansas is largely based on agriculture and ranching, and the town is home to several small businesses. The town is predominantly white, with around 95% of the population identifying as white. The town is served by the Meade County School District, and is home to a few churches.
Common Questions
What is Per Capita Income in Plains?
Per Capita income in Plains is $33,231.
What is the Median Family Income in Plains?
Median Family Income in Plains is $81,875.
What is the Median Household income in Plains?
Median Household Income in Plains is $72,222.
What is Income or Wage Gap in Plains?
Income or Wage Gap in Plains is 51.6%.
Women in Plains earn 48.4 cents for every dollar earned by a man.
What is Inequality or Gini Index in Plains?
Inequality or Gini Index in Plains is 0.41.
What is the Total Population of Plains?
Total Population of Plains is 1,266.
What is the Total Male Population of Plains?
Total Male Population of Plains is 647.
What is the Total Female Population of Plains?
Total Female Population of Plains is 619.
What is the Ratio of Males per 100 Females in Plains?
There are 104.52 Males per 100 Females in Plains.
What is the Ratio of Females per 100 Males in Plains?
There are 95.67 Females per 100 Males in Plains.
What is the Median Population Age in Plains?
Median Population Age in Plains is 29.6 Years.
What is the Average Family Size in Plains
Average Family Size in Plains is 3.3 People.
What is the Average Household Size in Plains
Average Household Size in Plains is 2.8 People.
How Large is the Labor Force in Plains?
There are 612 People in the Labor Forcein in Plains.
What is the Percentage of People in the Labor Force in Plains?
69.2% of People are in the Labor Force in Plains.
What is the Unemployment Rate in Plains?
Unemployment Rate in Plains is 1.8%.