Zip Codes with the Highest Percentage of Population Employed in Architecture & Engineering in Kansas
RELATED REPORTS & OPTIONS
Architecture & Engineering
Kansas
Compare Zip Codes
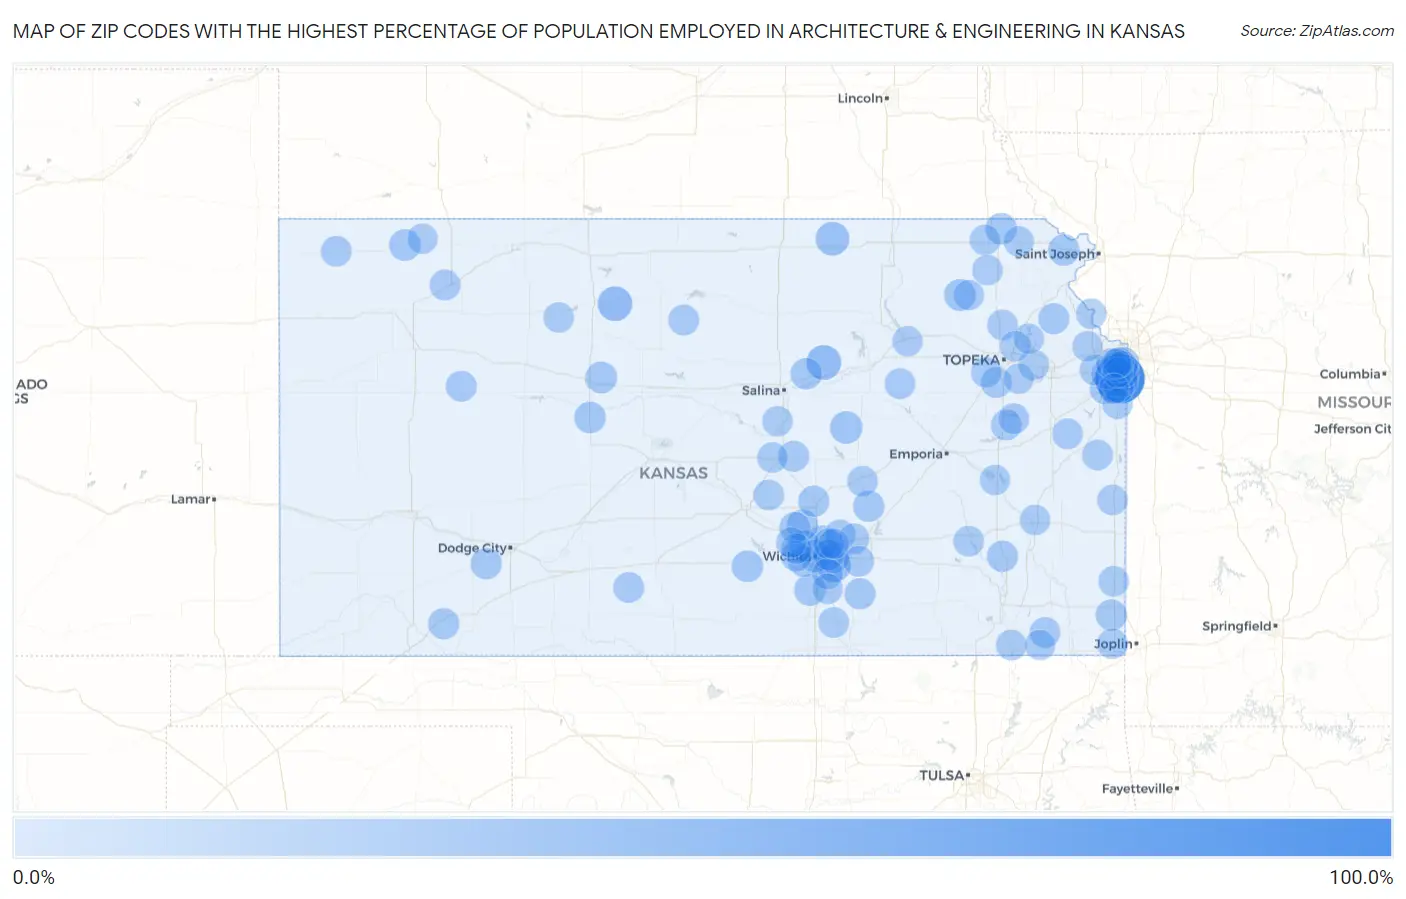
Map of Zip Codes with the Highest Percentage of Population Employed in Architecture & Engineering in Kansas
0.0%
100.0%
Zip Codes with the Highest Percentage of Population Employed in Architecture & Engineering in Kansas
| Zip Code | % Employed | vs State | vs National | |
| 1. | 66251 | 100.0% | 2.0%(+98.0)#1 | 2.1%(+97.9)#7 |
| 2. | 67482 | 24.1% | 2.0%(+22.1)#2 | 2.1%(+22.0)#69 |
| 3. | 67675 | 23.2% | 2.0%(+21.2)#3 | 2.1%(+21.1)#76 |
| 4. | 67232 | 22.0% | 2.0%(+20.0)#4 | 2.1%(+19.9)#85 |
| 5. | 66958 | 18.6% | 2.0%(+16.5)#5 | 2.1%(+16.4)#106 |
| 6. | 67475 | 13.0% | 2.0%(+11.0)#6 | 2.1%(+10.9)#198 |
| 7. | 67202 | 9.8% | 2.0%(+7.80)#7 | 2.1%(+7.70)#354 |
| 8. | 66432 | 9.8% | 2.0%(+7.76)#8 | 2.1%(+7.65)#357 |
| 9. | 67627 | 9.0% | 2.0%(+6.95)#9 | 2.1%(+6.84)#420 |
| 10. | 67744 | 9.0% | 2.0%(+6.95)#10 | 2.1%(+6.84)#421 |
| 11. | 67067 | 8.8% | 2.0%(+6.73)#11 | 2.1%(+6.62)#447 |
| 12. | 67120 | 8.5% | 2.0%(+6.51)#12 | 2.1%(+6.40)#480 |
| 13. | 66515 | 8.2% | 2.0%(+6.14)#13 | 2.1%(+6.03)#541 |
| 14. | 67205 | 8.1% | 2.0%(+6.07)#14 | 2.1%(+5.96)#550 |
| 15. | 67111 | 8.1% | 2.0%(+6.07)#15 | 2.1%(+5.96)#551 |
| 16. | 67553 | 8.0% | 2.0%(+5.96)#16 | 2.1%(+5.85)#573 |
| 17. | 67480 | 7.5% | 2.0%(+5.51)#17 | 2.1%(+5.40)#647 |
| 18. | 66087 | 7.4% | 2.0%(+5.35)#18 | 2.1%(+5.25)#675 |
| 19. | 66840 | 7.1% | 2.0%(+5.01)#19 | 2.1%(+4.90)#738 |
| 20. | 66781 | 7.0% | 2.0%(+5.01)#20 | 2.1%(+4.90)#740 |
| 21. | 67841 | 6.9% | 2.0%(+4.89)#21 | 2.1%(+4.79)#767 |
| 22. | 67135 | 6.9% | 2.0%(+4.82)#22 | 2.1%(+4.71)#785 |
| 23. | 67869 | 6.5% | 2.0%(+4.46)#23 | 2.1%(+4.35)#890 |
| 24. | 66717 | 6.4% | 2.0%(+4.34)#24 | 2.1%(+4.23)#928 |
| 25. | 67016 | 6.1% | 2.0%(+4.08)#25 | 2.1%(+3.97)#1,029 |
| 26. | 67117 | 6.1% | 2.0%(+4.07)#26 | 2.1%(+3.96)#1,038 |
| 27. | 67209 | 5.9% | 2.0%(+3.88)#27 | 2.1%(+3.77)#1,117 |
| 28. | 66097 | 5.9% | 2.0%(+3.85)#28 | 2.1%(+3.74)#1,134 |
| 29. | 67131 | 5.9% | 2.0%(+3.84)#29 | 2.1%(+3.73)#1,141 |
| 30. | 67230 | 5.8% | 2.0%(+3.79)#30 | 2.1%(+3.68)#1,165 |
| 31. | 67757 | 5.5% | 2.0%(+3.47)#31 | 2.1%(+3.36)#1,320 |
| 32. | 67443 | 5.5% | 2.0%(+3.42)#32 | 2.1%(+3.31)#1,352 |
| 33. | 66211 | 5.4% | 2.0%(+3.32)#33 | 2.1%(+3.22)#1,409 |
| 34. | 67485 | 5.2% | 2.0%(+3.19)#34 | 2.1%(+3.09)#1,499 |
| 35. | 66546 | 5.2% | 2.0%(+3.14)#35 | 2.1%(+3.03)#1,527 |
| 36. | 67736 | 5.2% | 2.0%(+3.11)#36 | 2.1%(+3.01)#1,557 |
| 37. | 67017 | 5.0% | 2.0%(+3.01)#37 | 2.1%(+2.90)#1,633 |
| 38. | 67206 | 5.0% | 2.0%(+2.94)#38 | 2.1%(+2.83)#1,681 |
| 39. | 66210 | 4.8% | 2.0%(+2.76)#39 | 2.1%(+2.66)#1,827 |
| 40. | 67144 | 4.7% | 2.0%(+2.70)#40 | 2.1%(+2.59)#1,889 |
| 41. | 66849 | 4.7% | 2.0%(+2.63)#41 | 2.1%(+2.52)#1,968 |
| 42. | 67226 | 4.6% | 2.0%(+2.59)#42 | 2.1%(+2.48)#1,998 |
| 43. | 67010 | 4.5% | 2.0%(+2.48)#43 | 2.1%(+2.37)#2,101 |
| 44. | 67731 | 4.5% | 2.0%(+2.46)#44 | 2.1%(+2.35)#2,124 |
| 45. | 66062 | 4.4% | 2.0%(+2.40)#45 | 2.1%(+2.29)#2,209 |
| 46. | 66079 | 4.4% | 2.0%(+2.33)#46 | 2.1%(+2.23)#2,287 |
| 47. | 66026 | 4.3% | 2.0%(+2.31)#47 | 2.1%(+2.20)#2,321 |
| 48. | 66451 | 4.3% | 2.0%(+2.24)#48 | 2.1%(+2.13)#2,393 |
| 49. | 67028 | 4.3% | 2.0%(+2.23)#49 | 2.1%(+2.12)#2,402 |
| 50. | 67037 | 4.2% | 2.0%(+2.19)#50 | 2.1%(+2.08)#2,456 |
| 51. | 66205 | 4.2% | 2.0%(+2.13)#51 | 2.1%(+2.03)#2,518 |
| 52. | 66543 | 4.2% | 2.0%(+2.13)#52 | 2.1%(+2.02)#2,528 |
| 53. | 66227 | 4.1% | 2.0%(+2.08)#53 | 2.1%(+1.97)#2,597 |
| 54. | 67235 | 4.1% | 2.0%(+2.02)#54 | 2.1%(+1.92)#2,673 |
| 55. | 67330 | 4.0% | 2.0%(+1.99)#55 | 2.1%(+1.88)#2,727 |
| 56. | 66735 | 4.0% | 2.0%(+1.99)#56 | 2.1%(+1.88)#2,729 |
| 57. | 66213 | 4.0% | 2.0%(+1.92)#57 | 2.1%(+1.81)#2,836 |
| 58. | 66209 | 3.9% | 2.0%(+1.86)#58 | 2.1%(+1.75)#2,939 |
| 59. | 66851 | 3.9% | 2.0%(+1.83)#59 | 2.1%(+1.72)#2,976 |
| 60. | 66777 | 3.8% | 2.0%(+1.76)#60 | 2.1%(+1.66)#3,084 |
| 61. | 67522 | 3.8% | 2.0%(+1.72)#61 | 2.1%(+1.61)#3,183 |
| 62. | 67337 | 3.7% | 2.0%(+1.63)#62 | 2.1%(+1.52)#3,359 |
| 63. | 66013 | 3.6% | 2.0%(+1.60)#63 | 2.1%(+1.50)#3,414 |
| 64. | 67460 | 3.6% | 2.0%(+1.56)#64 | 2.1%(+1.46)#3,502 |
| 65. | 66534 | 3.6% | 2.0%(+1.51)#65 | 2.1%(+1.40)#3,608 |
| 66. | 66767 | 3.5% | 2.0%(+1.50)#66 | 2.1%(+1.39)#3,638 |
| 67. | 66219 | 3.5% | 2.0%(+1.48)#67 | 2.1%(+1.37)#3,677 |
| 68. | 66050 | 3.5% | 2.0%(+1.46)#68 | 2.1%(+1.36)#3,726 |
| 69. | 66223 | 3.5% | 2.0%(+1.44)#69 | 2.1%(+1.33)#3,782 |
| 70. | 66749 | 3.4% | 2.0%(+1.37)#70 | 2.1%(+1.26)#3,941 |
| 71. | 67119 | 3.4% | 2.0%(+1.36)#71 | 2.1%(+1.26)#3,951 |
| 72. | 66206 | 3.3% | 2.0%(+1.29)#72 | 2.1%(+1.18)#4,115 |
| 73. | 66204 | 3.3% | 2.0%(+1.27)#73 | 2.1%(+1.17)#4,160 |
| 74. | 66216 | 3.3% | 2.0%(+1.25)#74 | 2.1%(+1.15)#4,210 |
| 75. | 67228 | 3.3% | 2.0%(+1.24)#75 | 2.1%(+1.14)#4,240 |
| 76. | 66540 | 3.3% | 2.0%(+1.24)#76 | 2.1%(+1.13)#4,256 |
| 77. | 66440 | 3.3% | 2.0%(+1.22)#77 | 2.1%(+1.11)#4,292 |
| 78. | 66208 | 3.2% | 2.0%(+1.20)#78 | 2.1%(+1.09)#4,361 |
| 79. | 67223 | 3.2% | 2.0%(+1.11)#79 | 2.1%(+1.00)#4,601 |
| 80. | 67342 | 3.1% | 2.0%(+1.05)#80 | 2.1%(+0.947)#4,753 |
| 81. | 66550 | 3.1% | 2.0%(+1.02)#81 | 2.1%(+0.916)#4,831 |
| 82. | 66212 | 3.1% | 2.0%(+1.01)#82 | 2.1%(+0.904)#4,877 |
| 83. | 67110 | 3.0% | 2.0%(+0.969)#83 | 2.1%(+0.861)#5,029 |
| 84. | 66202 | 3.0% | 2.0%(+0.940)#84 | 2.1%(+0.832)#5,117 |
| 85. | 66007 | 3.0% | 2.0%(+0.937)#85 | 2.1%(+0.829)#5,128 |
| 86. | 67456 | 2.9% | 2.0%(+0.897)#86 | 2.1%(+0.790)#5,280 |
| 87. | 66610 | 2.9% | 2.0%(+0.886)#87 | 2.1%(+0.778)#5,329 |
| 88. | 66770 | 2.9% | 2.0%(+0.884)#88 | 2.1%(+0.776)#5,336 |
| 89. | 66203 | 2.9% | 2.0%(+0.876)#89 | 2.1%(+0.768)#5,368 |
| 90. | 66027 | 2.9% | 2.0%(+0.860)#90 | 2.1%(+0.753)#5,417 |
| 91. | 66839 | 2.9% | 2.0%(+0.845)#91 | 2.1%(+0.738)#5,466 |
| 92. | 67739 | 2.9% | 2.0%(+0.843)#92 | 2.1%(+0.735)#5,477 |
| 93. | 66617 | 2.9% | 2.0%(+0.833)#93 | 2.1%(+0.725)#5,512 |
| 94. | 66502 | 2.8% | 2.0%(+0.803)#94 | 2.1%(+0.695)#5,603 |
| 95. | 66221 | 2.8% | 2.0%(+0.800)#95 | 2.1%(+0.692)#5,616 |
| 96. | 67030 | 2.8% | 2.0%(+0.787)#96 | 2.1%(+0.680)#5,670 |
| 97. | 67632 | 2.8% | 2.0%(+0.736)#97 | 2.1%(+0.629)#5,877 |
| 98. | 66070 | 2.7% | 2.0%(+0.707)#98 | 2.1%(+0.599)#5,973 |
| 99. | 66434 | 2.7% | 2.0%(+0.699)#99 | 2.1%(+0.592)#5,999 |
| 100. | 66409 | 2.7% | 2.0%(+0.696)#100 | 2.1%(+0.588)#6,012 |
Common Questions
What are the Top 10 Zip Codes with the Highest Percentage of Population Employed in Architecture & Engineering in Kansas?
Top 10 Zip Codes with the Highest Percentage of Population Employed in Architecture & Engineering in Kansas are:
What zip code has the Highest Percentage of Population Employed in Architecture & Engineering in Kansas?
66251 has the Highest Percentage of Population Employed in Architecture & Engineering in Kansas with 100.0%.
What is the Percentage of Population Employed in Architecture & Engineering in the State of Kansas?
Percentage of Population Employed in Architecture & Engineering in Kansas is 2.0%.
What is the Percentage of Population Employed in Architecture & Engineering in the United States?
Percentage of Population Employed in Architecture & Engineering in the United States is 2.1%.