Lecompton, KS Map & Demographics
Lecompton Map
Lecompton Overview
$30,719
PER CAPITA INCOME
$103,750
AVG FAMILY INCOME
$67,813
AVG HOUSEHOLD INCOME
22.5%
WAGE / INCOME GAP [ % ]
77.5¢/ $1
WAGE / INCOME GAP [ $ ]
0.38
INEQUALITY / GINI INDEX
864
TOTAL POPULATION
440
MALE POPULATION
424
FEMALE POPULATION
103.77
MALES / 100 FEMALES
96.36
FEMALES / 100 MALES
34.0
MEDIAN AGE
3.7
AVG FAMILY SIZE
3.2
AVG HOUSEHOLD SIZE
494
LABOR FORCE [ PEOPLE ]
75.3%
PERCENT IN LABOR FORCE
5.3%
UNEMPLOYMENT RATE
Lecompton Zip Codes
Lecompton Area Codes
Income in Lecompton
Income Overview in Lecompton
Per Capita Income in Lecompton is $30,719, while median incomes of families and households are $103,750 and $67,813 respectively.
| Characteristic | Number | Measure |
| Per Capita Income | 864 | $30,719 |
| Median Family Income | 213 | $103,750 |
| Mean Family Income | 213 | $96,812 |
| Median Household Income | 272 | $67,813 |
| Mean Household Income | 272 | $88,850 |
| Income Deficit | 213 | $0 |
| Wage / Income Gap (%) | 864 | 22.51% |
| Wage / Income Gap ($) | 864 | 77.49¢ per $1 |
| Gini / Inequality Index | 864 | 0.38 |
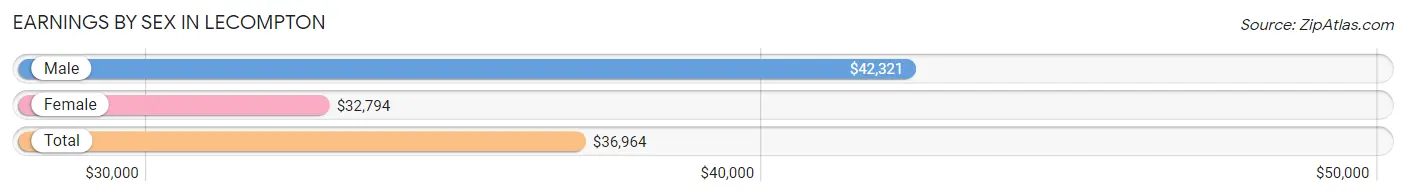
Earnings by Sex in Lecompton
Average Earnings in Lecompton are $36,964, $42,321 for men and $32,794 for women, a difference of 22.5%.
| Sex | Number | Average Earnings |
| Male | 270 (53.1%) | $42,321 |
| Female | 238 (46.9%) | $32,794 |
| Total | 508 (100.0%) | $36,964 |
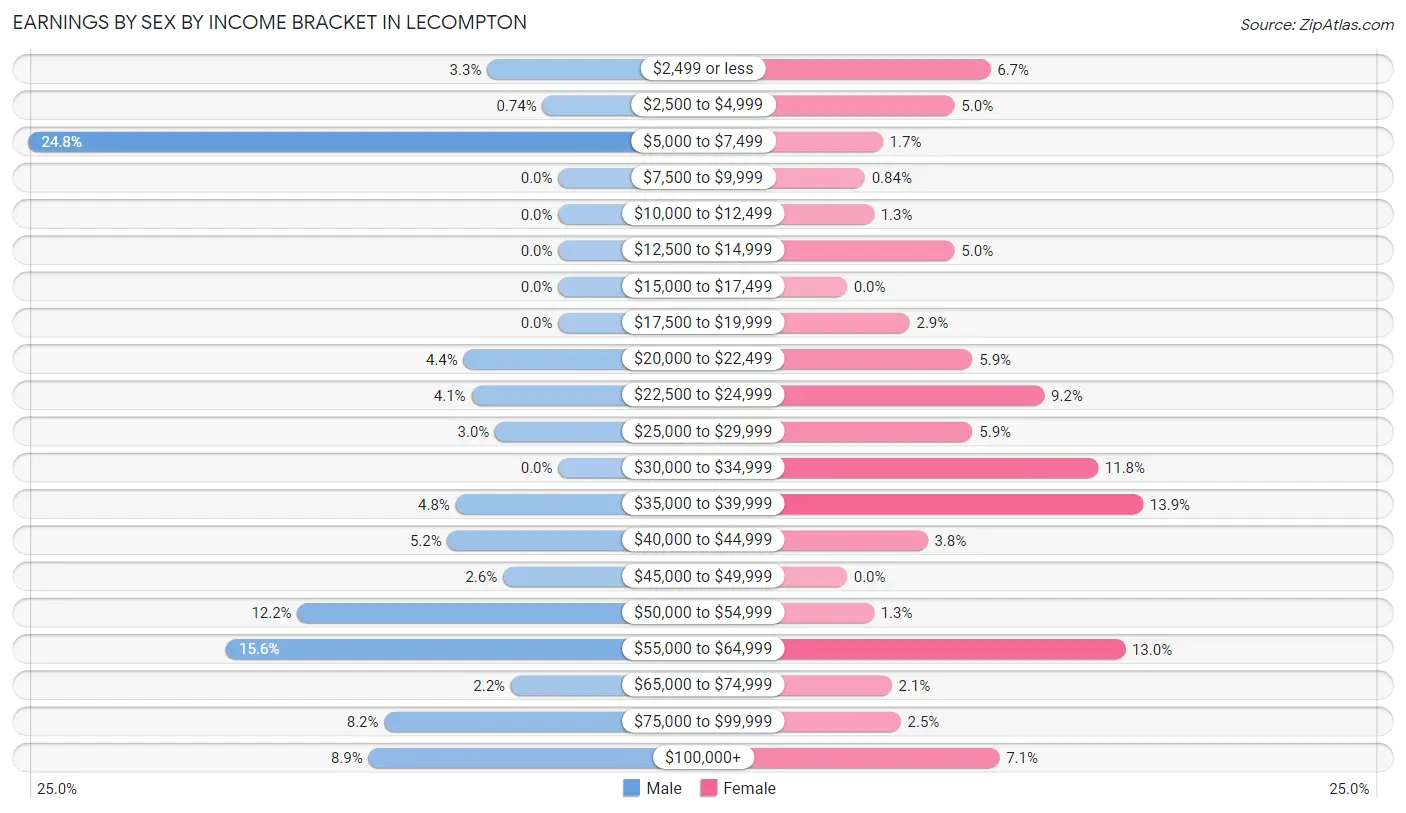
Earnings by Sex by Income Bracket in Lecompton
The most common earnings brackets in Lecompton are $5,000 to $7,499 for men (67 | 24.8%) and $35,000 to $39,999 for women (33 | 13.9%).
| Income | Male | Female |
| $2,499 or less | 9 (3.3%) | 16 (6.7%) |
| $2,500 to $4,999 | 2 (0.7%) | 12 (5.0%) |
| $5,000 to $7,499 | 67 (24.8%) | 4 (1.7%) |
| $7,500 to $9,999 | 0 (0.0%) | 2 (0.8%) |
| $10,000 to $12,499 | 0 (0.0%) | 3 (1.3%) |
| $12,500 to $14,999 | 0 (0.0%) | 12 (5.0%) |
| $15,000 to $17,499 | 0 (0.0%) | 0 (0.0%) |
| $17,500 to $19,999 | 0 (0.0%) | 7 (2.9%) |
| $20,000 to $22,499 | 12 (4.4%) | 14 (5.9%) |
| $22,500 to $24,999 | 11 (4.1%) | 22 (9.2%) |
| $25,000 to $29,999 | 8 (3.0%) | 14 (5.9%) |
| $30,000 to $34,999 | 0 (0.0%) | 28 (11.8%) |
| $35,000 to $39,999 | 13 (4.8%) | 33 (13.9%) |
| $40,000 to $44,999 | 14 (5.2%) | 9 (3.8%) |
| $45,000 to $49,999 | 7 (2.6%) | 0 (0.0%) |
| $50,000 to $54,999 | 33 (12.2%) | 3 (1.3%) |
| $55,000 to $64,999 | 42 (15.6%) | 31 (13.0%) |
| $65,000 to $74,999 | 6 (2.2%) | 5 (2.1%) |
| $75,000 to $99,999 | 22 (8.2%) | 6 (2.5%) |
| $100,000+ | 24 (8.9%) | 17 (7.1%) |
| Total | 270 (100.0%) | 238 (100.0%) |
Earnings by Sex by Educational Attainment in Lecompton
Average earnings in Lecompton are $54,453 for men and $37,663 for women, a difference of 30.8%. Men with an educational attainment of bachelor's degree enjoy the highest average annual earnings of $115,750, while those with less than high school education earn the least with $24,091. Women with an educational attainment of high school diploma earn the most with the average annual earnings of $36,250, while those with college or associate's degree education have the smallest earnings of $34,286.

| Educational Attainment | Male Income | Female Income |
| Less than High School | $24,091 | $0 |
| High School Diploma | $53,266 | $36,250 |
| College or Associate's Degree | $56,833 | $34,286 |
| Bachelor's Degree | $115,750 | $0 |
| Graduate Degree | - | - |
| Total | $54,453 | $37,663 |
Family Income in Lecompton
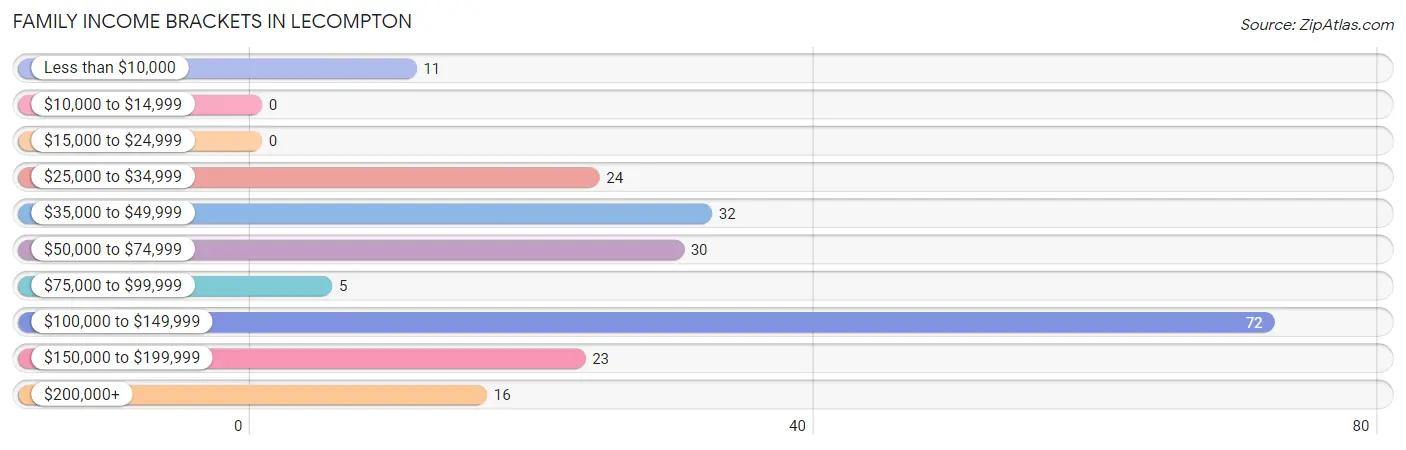
Family Income Brackets in Lecompton
According to the Lecompton family income data, there are 72 families falling into the $100,000 to $149,999 income range, which is the most common income bracket and makes up 33.8% of all families.
| Income Bracket | # Families | % Families |
| Less than $10,000 | 11 | 5.2% |
| $10,000 to $14,999 | 0 | 0.0% |
| $15,000 to $24,999 | 0 | 0.0% |
| $25,000 to $34,999 | 24 | 11.3% |
| $35,000 to $49,999 | 32 | 15.0% |
| $50,000 to $74,999 | 30 | 14.1% |
| $75,000 to $99,999 | 5 | 2.3% |
| $100,000 to $149,999 | 72 | 33.8% |
| $150,000 to $199,999 | 23 | 10.8% |
| $200,000+ | 16 | 7.5% |
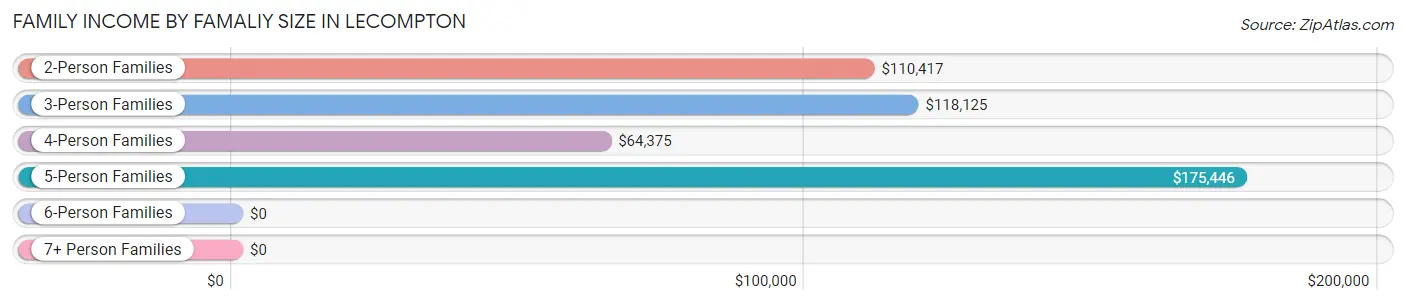
Family Income by Famaliy Size in Lecompton
5-person families (23 | 10.8%) account for the highest median family income in Lecompton with $175,446 per family, while 2-person families (136 | 63.8%) have the highest median income of $55,208 per family member.
| Income Bracket | # Families | Median Income |
| 2-Person Families | 136 (63.8%) | $110,417 |
| 3-Person Families | 20 (9.4%) | $118,125 |
| 4-Person Families | 15 (7.0%) | $64,375 |
| 5-Person Families | 23 (10.8%) | $175,446 |
| 6-Person Families | 19 (8.9%) | $0 |
| 7+ Person Families | 0 (0.0%) | $0 |
| Total | 213 (100.0%) | $103,750 |
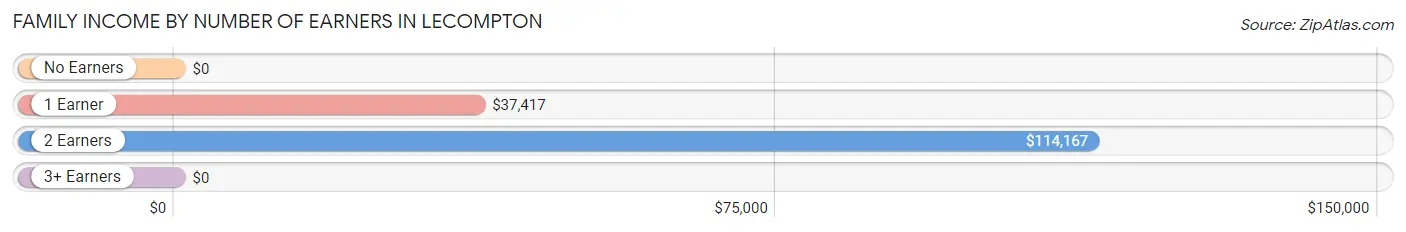
Family Income by Number of Earners in Lecompton
| Number of Earners | # Families | Median Income |
| No Earners | 16 (7.5%) | $0 |
| 1 Earner | 75 (35.2%) | $37,417 |
| 2 Earners | 92 (43.2%) | $114,167 |
| 3+ Earners | 30 (14.1%) | $0 |
| Total | 213 (100.0%) | $103,750 |
Household Income in Lecompton
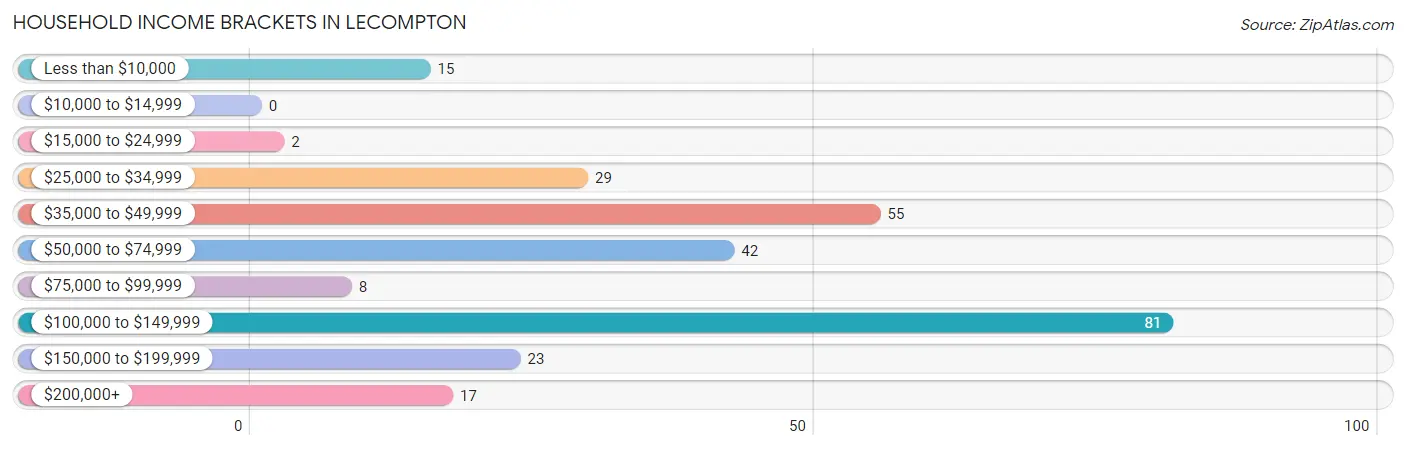
Household Income Brackets in Lecompton
With 81 households falling in the category, the $100,000 to $149,999 income range is the most frequent in Lecompton, accounting for 29.8% of all households.
| Income Bracket | # Households | % Households |
| Less than $10,000 | 15 | 5.5% |
| $10,000 to $14,999 | 0 | 0.0% |
| $15,000 to $24,999 | 2 | 0.7% |
| $25,000 to $34,999 | 29 | 10.7% |
| $35,000 to $49,999 | 55 | 20.2% |
| $50,000 to $74,999 | 42 | 15.4% |
| $75,000 to $99,999 | 8 | 2.9% |
| $100,000 to $149,999 | 81 | 29.8% |
| $150,000 to $199,999 | 23 | 8.5% |
| $200,000+ | 17 | 6.3% |
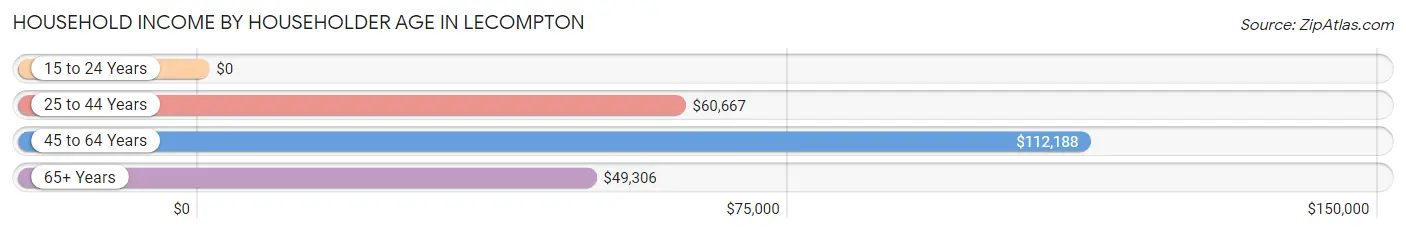
Household Income by Householder Age in Lecompton
The median household income in Lecompton is $67,813, with the highest median household income of $112,188 found in the 45 to 64 years age bracket for the primary householder. A total of 143 households (52.6%) fall into this category. Meanwhile, the 15 to 24 years age bracket for the primary householder has the lowest median household income of $0, with 18 households (6.6%) in this group.
| Income Bracket | # Households | Median Income |
| 15 to 24 Years | 18 (6.6%) | $0 |
| 25 to 44 Years | 60 (22.1%) | $60,667 |
| 45 to 64 Years | 143 (52.6%) | $112,188 |
| 65+ Years | 51 (18.8%) | $49,306 |
| Total | 272 (100.0%) | $67,813 |
Poverty in Lecompton
Income Below Poverty by Sex and Age in Lecompton
With 12.7% poverty level for males and 15.3% for females among the residents of Lecompton, under 5 year old males and 16 and 17 year old females are the most vulnerable to poverty, with 11 males (78.6%) and 8 females (72.7%) in their respective age groups living below the poverty level.
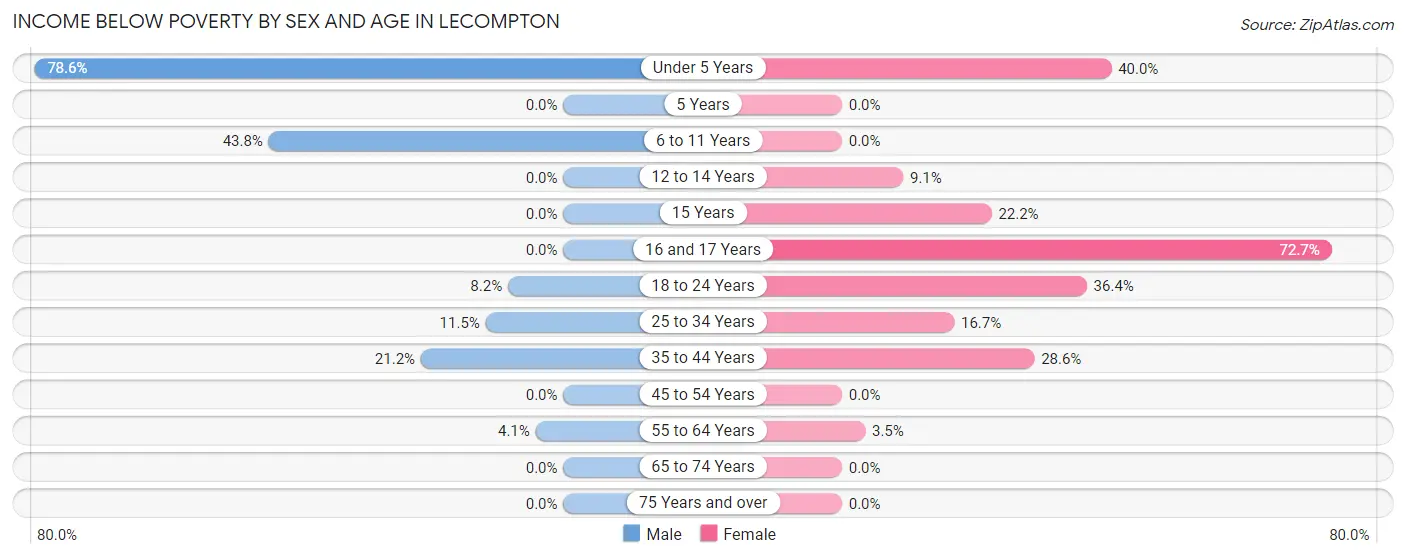
| Age Bracket | Male | Female |
| Under 5 Years | 11 (78.6%) | 14 (40.0%) |
| 5 Years | 0 (0.0%) | 0 (0.0%) |
| 6 to 11 Years | 21 (43.8%) | 0 (0.0%) |
| 12 to 14 Years | 0 (0.0%) | 1 (9.1%) |
| 15 Years | 0 (0.0%) | 2 (22.2%) |
| 16 and 17 Years | 0 (0.0%) | 8 (72.7%) |
| 18 to 24 Years | 6 (8.2%) | 20 (36.4%) |
| 25 to 34 Years | 3 (11.5%) | 8 (16.7%) |
| 35 to 44 Years | 11 (21.1%) | 10 (28.6%) |
| 45 to 54 Years | 0 (0.0%) | 0 (0.0%) |
| 55 to 64 Years | 4 (4.1%) | 2 (3.5%) |
| 65 to 74 Years | 0 (0.0%) | 0 (0.0%) |
| 75 Years and over | 0 (0.0%) | 0 (0.0%) |
| Total | 56 (12.7%) | 65 (15.3%) |
Income Above Poverty by Sex and Age in Lecompton
According to the poverty statistics in Lecompton, males aged 12 to 14 years and females aged 5 years are the age groups that are most secure financially, with 100.0% of males and 100.0% of females in these age groups living above the poverty line.
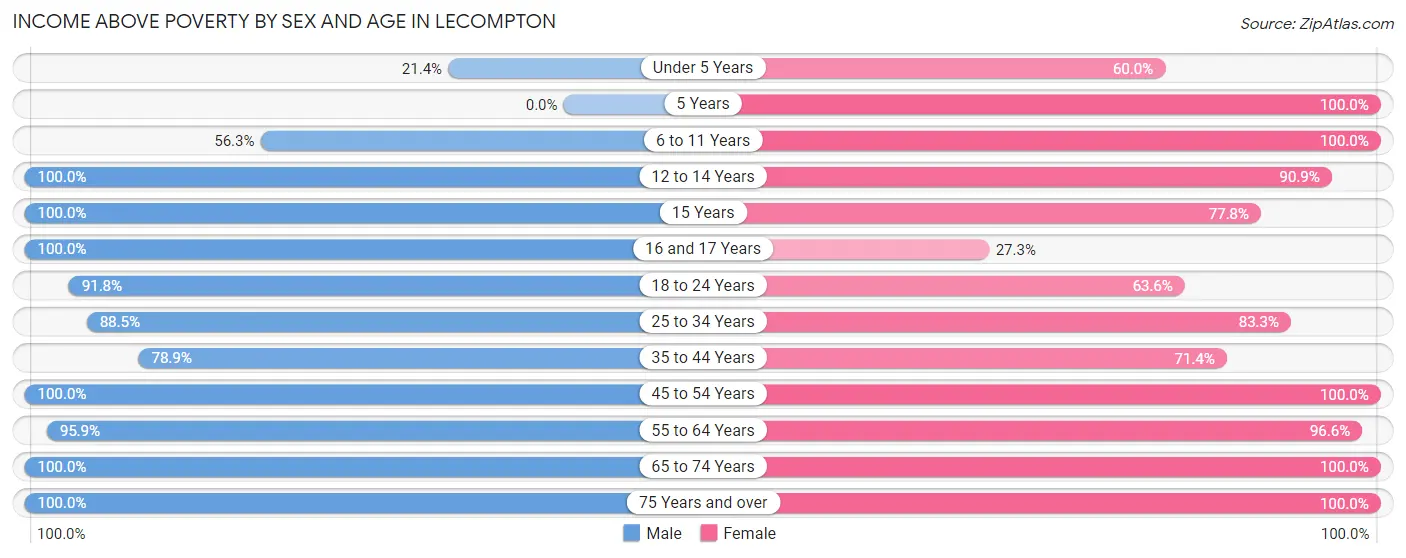
| Age Bracket | Male | Female |
| Under 5 Years | 3 (21.4%) | 21 (60.0%) |
| 5 Years | 0 (0.0%) | 6 (100.0%) |
| 6 to 11 Years | 27 (56.2%) | 55 (100.0%) |
| 12 to 14 Years | 26 (100.0%) | 10 (90.9%) |
| 15 Years | 4 (100.0%) | 7 (77.8%) |
| 16 and 17 Years | 14 (100.0%) | 3 (27.3%) |
| 18 to 24 Years | 67 (91.8%) | 35 (63.6%) |
| 25 to 34 Years | 23 (88.5%) | 40 (83.3%) |
| 35 to 44 Years | 41 (78.8%) | 25 (71.4%) |
| 45 to 54 Years | 55 (100.0%) | 56 (100.0%) |
| 55 to 64 Years | 93 (95.9%) | 56 (96.6%) |
| 65 to 74 Years | 20 (100.0%) | 22 (100.0%) |
| 75 Years and over | 11 (100.0%) | 23 (100.0%) |
| Total | 384 (87.3%) | 359 (84.7%) |
Income Below Poverty Among Married-Couple Families in Lecompton
The poverty statistics for married-couple families in Lecompton show that 5.8% or 10 of the total 174 families live below the poverty line. Families with 1 or 2 children have the highest poverty rate of 22.7%, comprising of 10 families. On the other hand, families with no children have the lowest poverty rate of 0.0%, which includes 0 families.
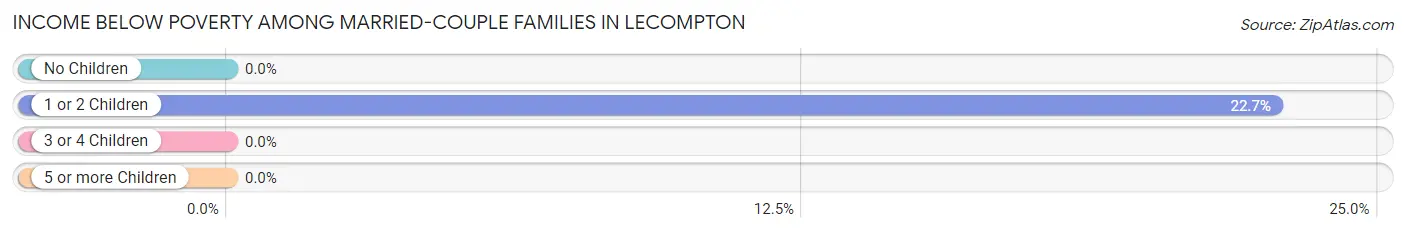
| Children | Above Poverty | Below Poverty |
| No Children | 115 (100.0%) | 0 (0.0%) |
| 1 or 2 Children | 34 (77.3%) | 10 (22.7%) |
| 3 or 4 Children | 15 (100.0%) | 0 (0.0%) |
| 5 or more Children | 0 (0.0%) | 0 (0.0%) |
| Total | 164 (94.3%) | 10 (5.8%) |
Income Below Poverty Among Single-Parent Households in Lecompton
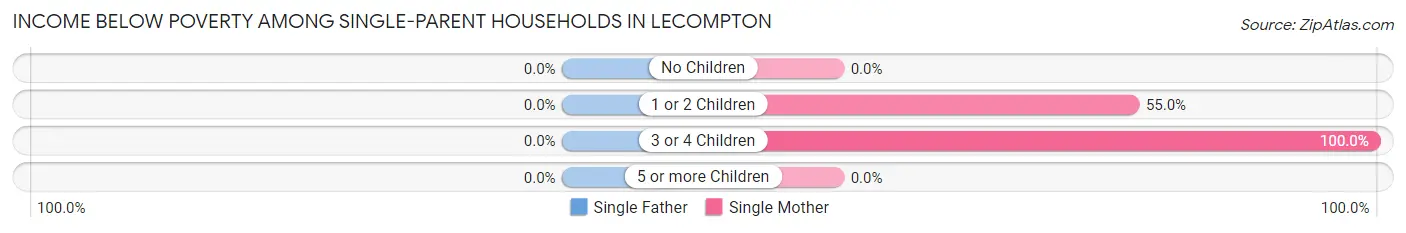
| Children | Single Father | Single Mother |
| No Children | 0 (0.0%) | 0 (0.0%) |
| 1 or 2 Children | 0 (0.0%) | 11 (55.0%) |
| 3 or 4 Children | 0 (0.0%) | 1 (100.0%) |
| 5 or more Children | 0 (0.0%) | 0 (0.0%) |
| Total | 0 (0.0%) | 12 (40.0%) |
Income Below Poverty Among Married-Couple vs Single-Parent Households in Lecompton
The poverty data for Lecompton shows that 10 of the married-couple family households (5.8%) and 12 of the single-parent households (30.8%) are living below the poverty level. Within the married-couple family households, those with 1 or 2 children have the highest poverty rate, with 10 households (22.7%) falling below the poverty line. Among the single-parent households, those with 3 or 4 children have the highest poverty rate, with 1 household (100.0%) living below poverty.
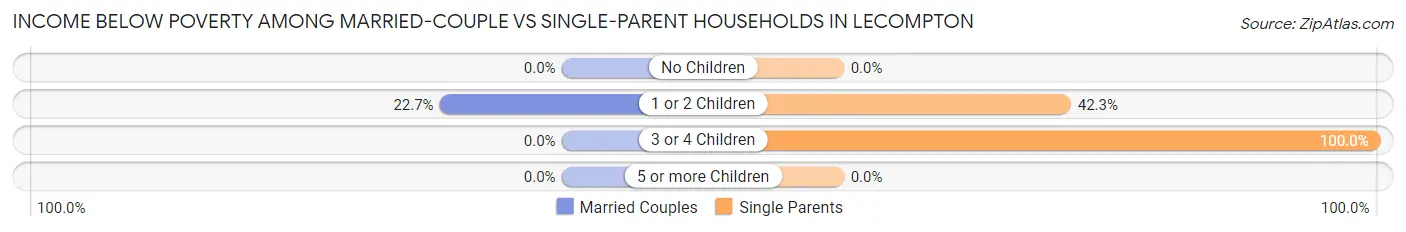
| Children | Married-Couple Families | Single-Parent Households |
| No Children | 0 (0.0%) | 0 (0.0%) |
| 1 or 2 Children | 10 (22.7%) | 11 (42.3%) |
| 3 or 4 Children | 0 (0.0%) | 1 (100.0%) |
| 5 or more Children | 0 (0.0%) | 0 (0.0%) |
| Total | 10 (5.8%) | 12 (30.8%) |
Race in Lecompton
The most populous races in Lecompton are White / Caucasian (698 | 80.8%), Two or more Races (134 | 15.5%), and Hispanic or Latino (43 | 5.0%).
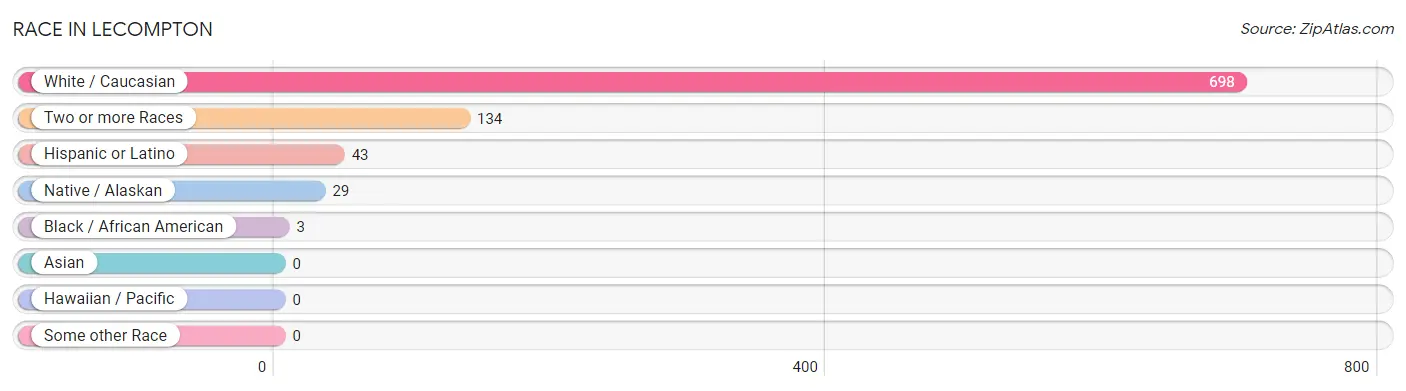
| Race | # Population | % Population |
| Asian | 0 | 0.0% |
| Black / African American | 3 | 0.4% |
| Hawaiian / Pacific | 0 | 0.0% |
| Hispanic or Latino | 43 | 5.0% |
| Native / Alaskan | 29 | 3.4% |
| White / Caucasian | 698 | 80.8% |
| Two or more Races | 134 | 15.5% |
| Some other Race | 0 | 0.0% |
| Total | 864 | 100.0% |
Ancestry in Lecompton
The most populous ancestries reported in Lecompton are German (135 | 15.6%), Irish (117 | 13.5%), English (83 | 9.6%), French (81 | 9.4%), and Scottish (52 | 6.0%), together accounting for 54.2% of all Lecompton residents.
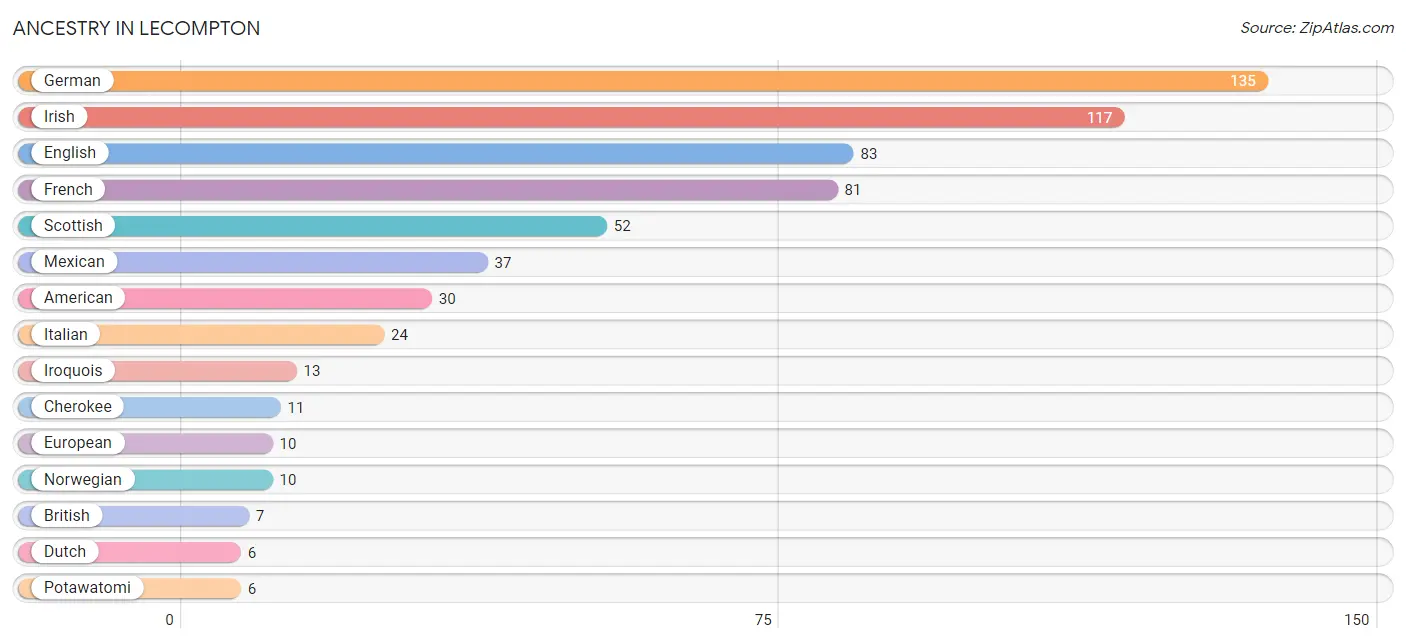
| Ancestry | # Population | % Population |
| American | 30 | 3.5% |
| Austrian | 2 | 0.2% |
| Bhutanese | 3 | 0.4% |
| British | 7 | 0.8% |
| Cherokee | 11 | 1.3% |
| Creek | 3 | 0.4% |
| Czech | 3 | 0.4% |
| Dutch | 6 | 0.7% |
| English | 83 | 9.6% |
| European | 10 | 1.2% |
| French | 81 | 9.4% |
| German | 135 | 15.6% |
| Irish | 117 | 13.5% |
| Iroquois | 13 | 1.5% |
| Italian | 24 | 2.8% |
| Mexican | 37 | 4.3% |
| Norwegian | 10 | 1.2% |
| Polish | 4 | 0.5% |
| Potawatomi | 6 | 0.7% |
| Scandinavian | 4 | 0.5% |
| Scotch-Irish | 5 | 0.6% |
| Scottish | 52 | 6.0% |
| Shoshone | 2 | 0.2% |
| Slovak | 3 | 0.4% |
| Spaniard | 6 | 0.7% |
| Swiss | 3 | 0.4% |
| Welsh | 4 | 0.5% | View All 27 Rows |
Immigrants in Lecompton

| Immigration Origin | # Population | % Population | View All 0 Rows |
Sex and Age in Lecompton
Sex and Age in Lecompton
The most populous age groups in Lecompton are 15 to 19 Years (84 | 19.1%) for men and 10 to 14 Years (56 | 13.2%) for women.
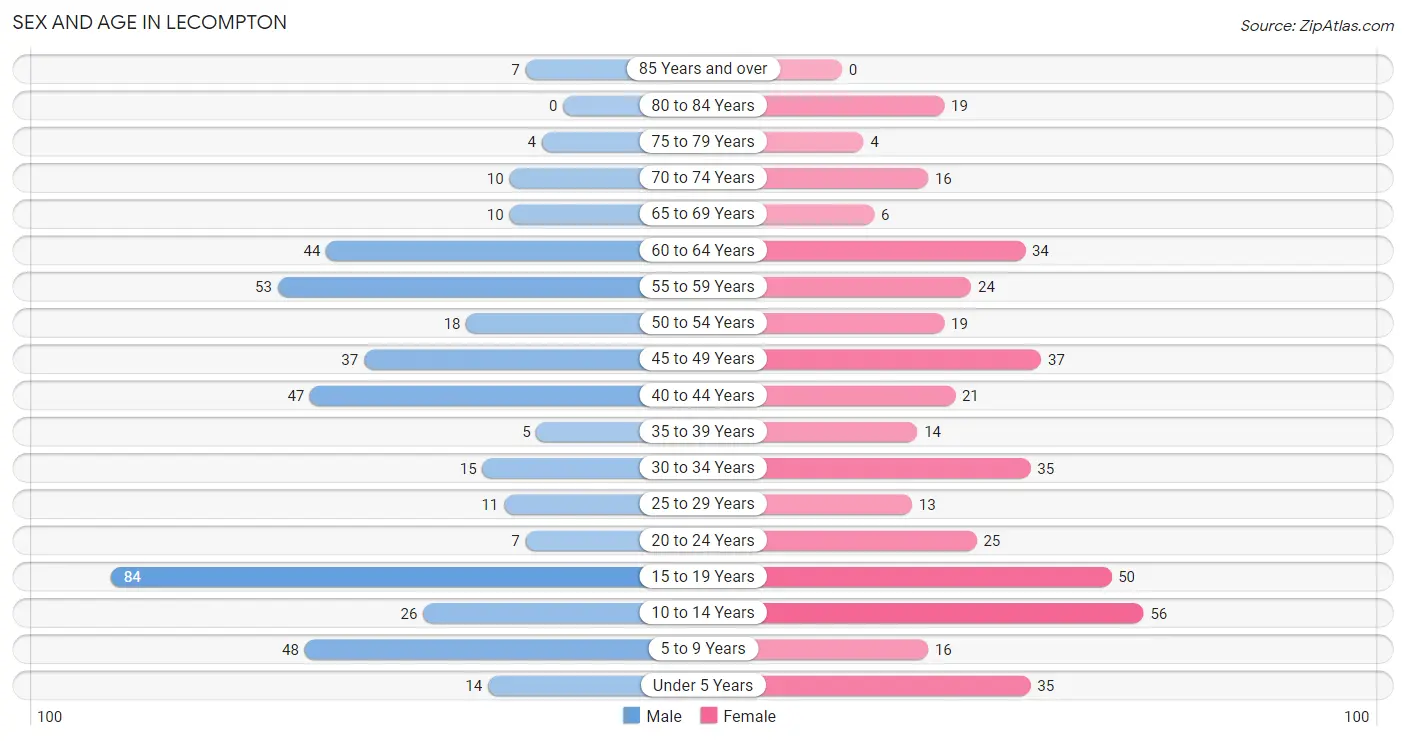
| Age Bracket | Male | Female |
| Under 5 Years | 14 (3.2%) | 35 (8.3%) |
| 5 to 9 Years | 48 (10.9%) | 16 (3.8%) |
| 10 to 14 Years | 26 (5.9%) | 56 (13.2%) |
| 15 to 19 Years | 84 (19.1%) | 50 (11.8%) |
| 20 to 24 Years | 7 (1.6%) | 25 (5.9%) |
| 25 to 29 Years | 11 (2.5%) | 13 (3.1%) |
| 30 to 34 Years | 15 (3.4%) | 35 (8.3%) |
| 35 to 39 Years | 5 (1.1%) | 14 (3.3%) |
| 40 to 44 Years | 47 (10.7%) | 21 (5.0%) |
| 45 to 49 Years | 37 (8.4%) | 37 (8.7%) |
| 50 to 54 Years | 18 (4.1%) | 19 (4.5%) |
| 55 to 59 Years | 53 (12.0%) | 24 (5.7%) |
| 60 to 64 Years | 44 (10.0%) | 34 (8.0%) |
| 65 to 69 Years | 10 (2.3%) | 6 (1.4%) |
| 70 to 74 Years | 10 (2.3%) | 16 (3.8%) |
| 75 to 79 Years | 4 (0.9%) | 4 (0.9%) |
| 80 to 84 Years | 0 (0.0%) | 19 (4.5%) |
| 85 Years and over | 7 (1.6%) | 0 (0.0%) |
| Total | 440 (100.0%) | 424 (100.0%) |
Families and Households in Lecompton
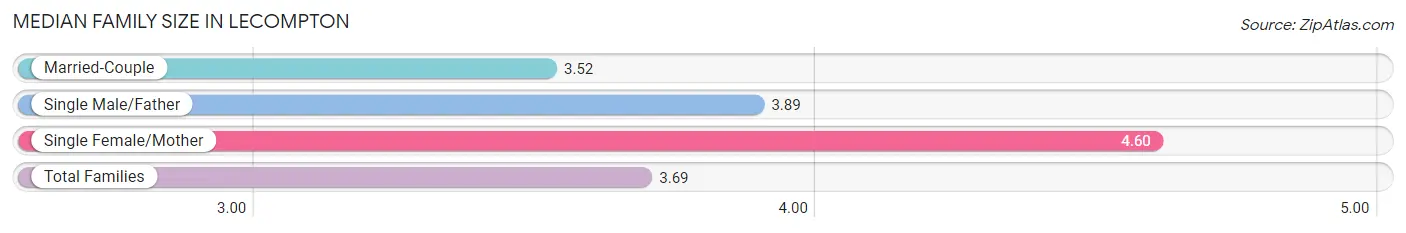
Median Family Size in Lecompton
The median family size in Lecompton is 3.69 persons per family, with single female/mother families (30 | 14.1%) accounting for the largest median family size of 4.6 persons per family. On the other hand, married-couple families (174 | 81.7%) represent the smallest median family size with 3.52 persons per family.
| Family Type | # Families | Family Size |
| Married-Couple | 174 (81.7%) | 3.52 |
| Single Male/Father | 9 (4.2%) | 3.89 |
| Single Female/Mother | 30 (14.1%) | 4.60 |
| Total Families | 213 (100.0%) | 3.69 |
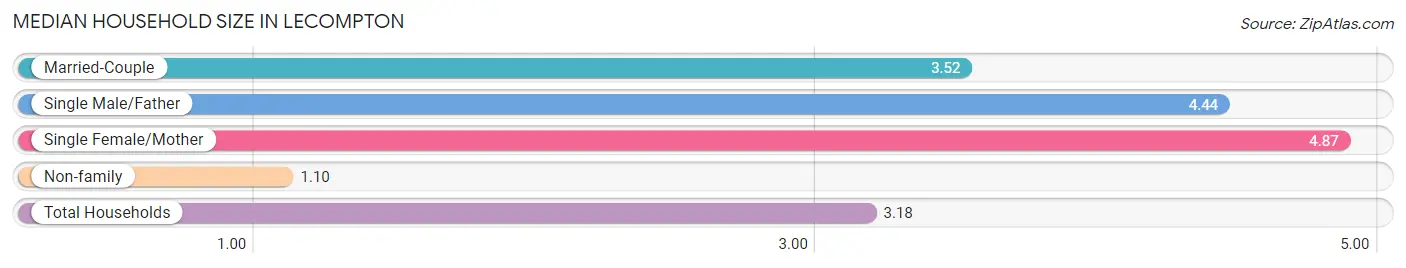
Median Household Size in Lecompton
The median household size in Lecompton is 3.18 persons per household, with single female/mother households (30 | 11.0%) accounting for the largest median household size of 4.87 persons per household. non-family households (59 | 21.7%) represent the smallest median household size with 1.10 persons per household.
| Household Type | # Households | Household Size |
| Married-Couple | 174 (64.0%) | 3.52 |
| Single Male/Father | 9 (3.3%) | 4.44 |
| Single Female/Mother | 30 (11.0%) | 4.87 |
| Non-family | 59 (21.7%) | 1.10 |
| Total Households | 272 (100.0%) | 3.18 |
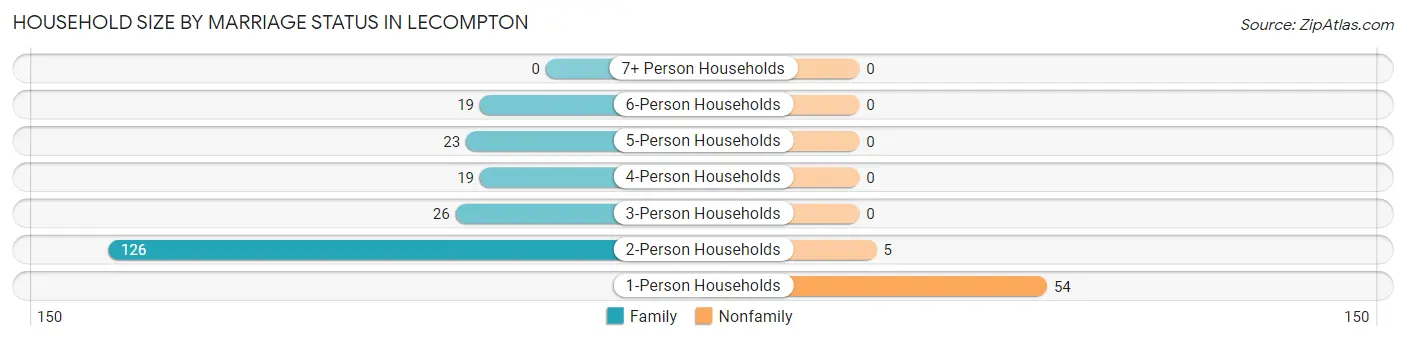
Household Size by Marriage Status in Lecompton
Out of a total of 272 households in Lecompton, 213 (78.3%) are family households, while 59 (21.7%) are nonfamily households. The most numerous type of family households are 2-person households, comprising 126, and the most common type of nonfamily households are 1-person households, comprising 54.
| Household Size | Family Households | Nonfamily Households |
| 1-Person Households | - | 54 (19.9%) |
| 2-Person Households | 126 (46.3%) | 5 (1.8%) |
| 3-Person Households | 26 (9.6%) | 0 (0.0%) |
| 4-Person Households | 19 (7.0%) | 0 (0.0%) |
| 5-Person Households | 23 (8.5%) | 0 (0.0%) |
| 6-Person Households | 19 (7.0%) | 0 (0.0%) |
| 7+ Person Households | 0 (0.0%) | 0 (0.0%) |
| Total | 213 (78.3%) | 59 (21.7%) |
Female Fertility in Lecompton
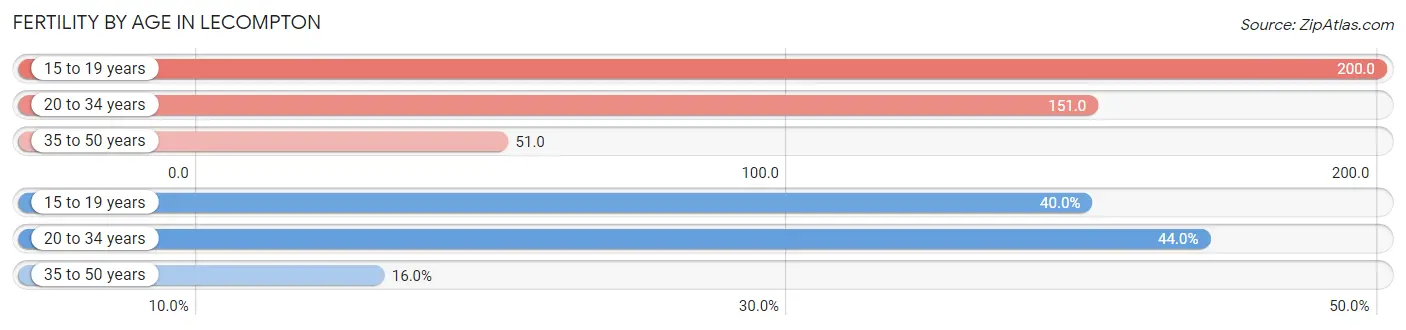
Fertility by Age in Lecompton
Average fertility rate in Lecompton is 124.0 births per 1,000 women. Women in the age bracket of 15 to 19 years have the highest fertility rate with 200.0 births per 1,000 women. Women in the age bracket of 20 to 34 years acount for 44.0% of all women with births.
| Age Bracket | Women with Births | Births / 1,000 Women |
| 15 to 19 years | 10 (40.0%) | 200.0 |
| 20 to 34 years | 11 (44.0%) | 151.0 |
| 35 to 50 years | 4 (16.0%) | 51.0 |
| Total | 25 (100.0%) | 124.0 |
Fertility by Age by Marriage Status in Lecompton
76.0% of women with births (25) in Lecompton are married. The highest percentage of unmarried women with births falls into 20 to 34 years age bracket with 54.5% of them unmarried at the time of birth, while the lowest percentage of unmarried women with births belong to 15 to 19 years age bracket with 0.0% of them unmarried.
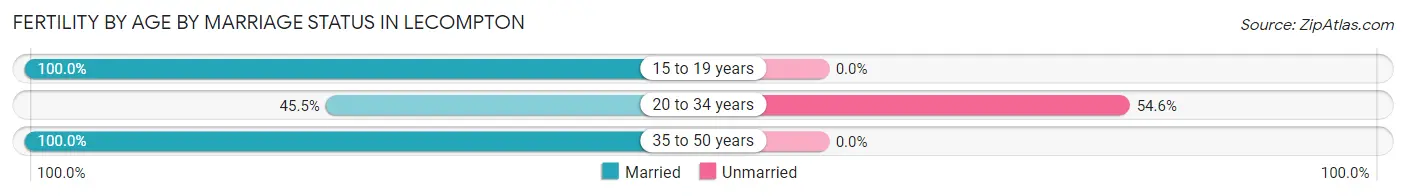
| Age Bracket | Married | Unmarried |
| 15 to 19 years | 10 (100.0%) | 0 (0.0%) |
| 20 to 34 years | 5 (45.5%) | 6 (54.5%) |
| 35 to 50 years | 4 (100.0%) | 0 (0.0%) |
| Total | 19 (76.0%) | 6 (24.0%) |
Fertility by Education in Lecompton
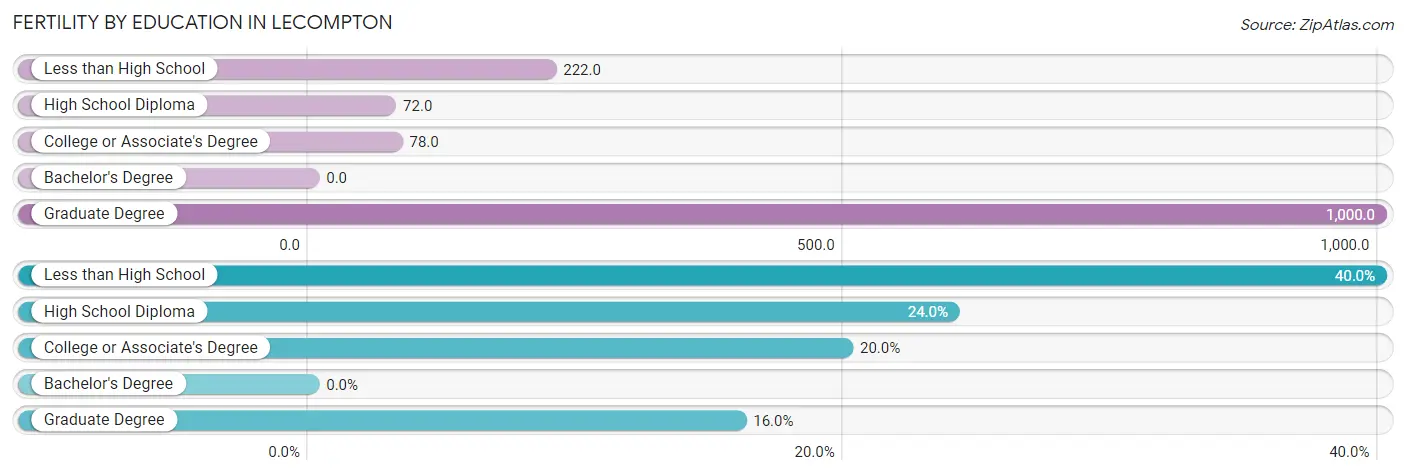
| Educational Attainment | Women with Births | Births / 1,000 Women |
| Less than High School | 10 (40.0%) | 222.0 |
| High School Diploma | 6 (24.0%) | 72.0 |
| College or Associate's Degree | 5 (20.0%) | 78.0 |
| Bachelor's Degree | 0 (0.0%) | 0.0 |
| Graduate Degree | 4 (16.0%) | 1,000.0 |
| Total | 25 (100.0%) | 124.0 |
Fertility by Education by Marriage Status in Lecompton
24.0% of women with births in Lecompton are unmarried. Women with the educational attainment of less than high school are most likely to be married with 100.0% of them married at childbirth, while women with the educational attainment of high school diploma are least likely to be married with 100.0% of them unmarried at childbirth.
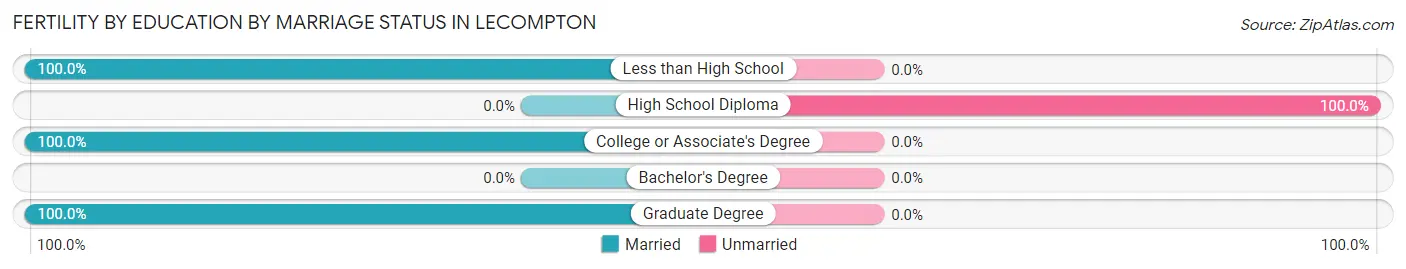
| Educational Attainment | Married | Unmarried |
| Less than High School | 10 (100.0%) | 0 (0.0%) |
| High School Diploma | 0 (0.0%) | 6 (100.0%) |
| College or Associate's Degree | 5 (100.0%) | 0 (0.0%) |
| Bachelor's Degree | 0 (0.0%) | 0 (0.0%) |
| Graduate Degree | 4 (100.0%) | 0 (0.0%) |
| Total | 19 (76.0%) | 6 (24.0%) |
Employment Characteristics in Lecompton
Employment by Class of Employer in Lecompton
Among the 462 employed individuals in Lecompton, private company employees (366 | 79.2%), local government employees (37 | 8.0%), and state government employees (21 | 4.5%) make up the most common classes of employment.
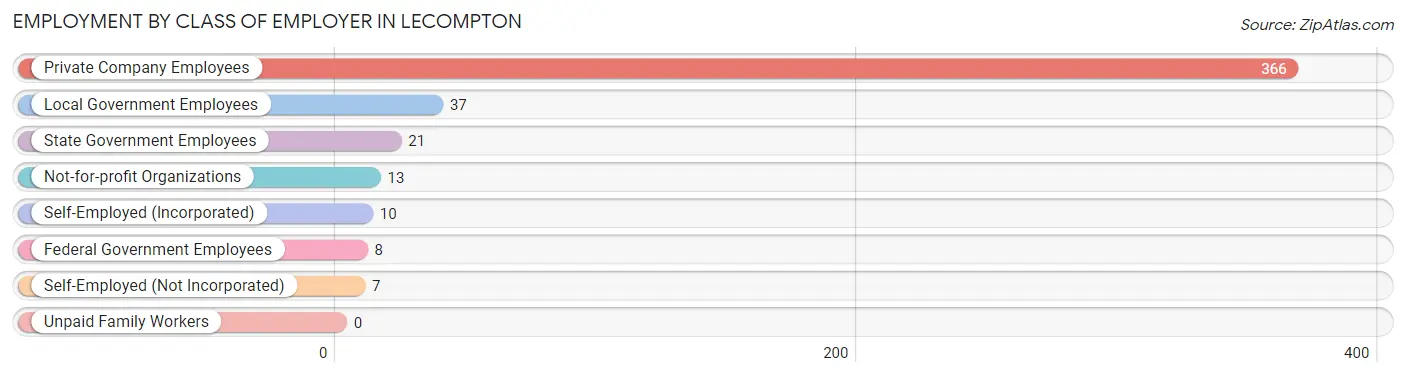
| Employer Class | # Employees | % Employees |
| Private Company Employees | 366 | 79.2% |
| Self-Employed (Incorporated) | 10 | 2.2% |
| Self-Employed (Not Incorporated) | 7 | 1.5% |
| Not-for-profit Organizations | 13 | 2.8% |
| Local Government Employees | 37 | 8.0% |
| State Government Employees | 21 | 4.5% |
| Federal Government Employees | 8 | 1.7% |
| Unpaid Family Workers | 0 | 0.0% |
| Total | 462 | 100.0% |
Employment Status by Age in Lecompton
According to the labor force statistics for Lecompton, out of the total population over 16 years of age (656), 75.3% or 494 individuals are in the labor force, with 5.3% or 26 of them unemployed. The age group with the highest labor force participation rate is 25 to 29 years, with 100.0% or 24 individuals in the labor force. Within the labor force, the 35 to 44 years age range has the highest percentage of unemployed individuals, with 19.2% or 14 of them being unemployed.
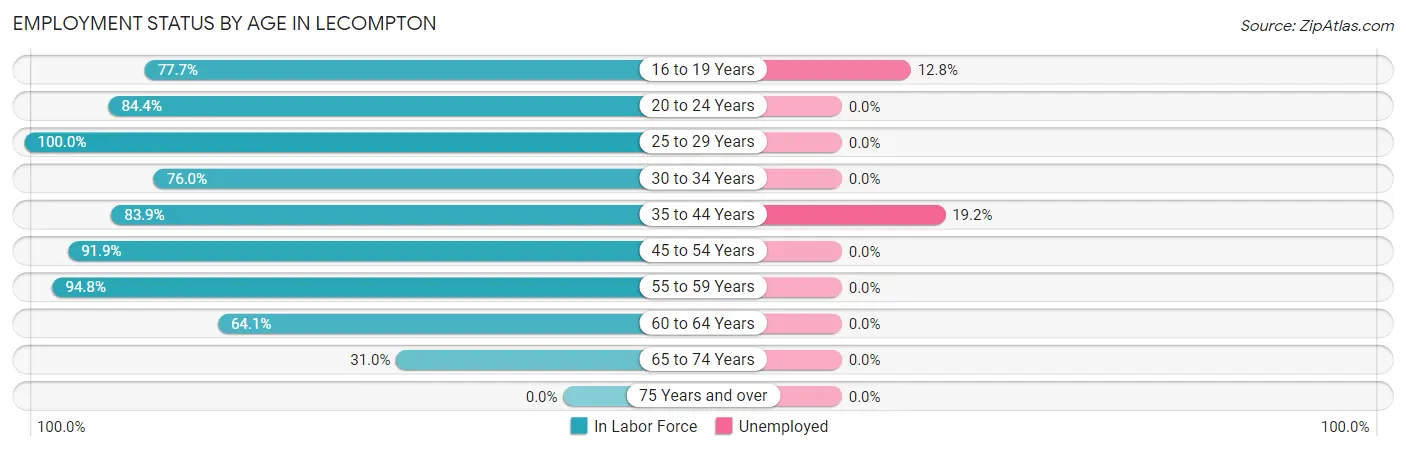
| Age Bracket | In Labor Force | Unemployed |
| 16 to 19 Years | 94 (77.7%) | 12 (12.8%) |
| 20 to 24 Years | 27 (84.4%) | 0 (0.0%) |
| 25 to 29 Years | 24 (100.0%) | 0 (0.0%) |
| 30 to 34 Years | 38 (76.0%) | 0 (0.0%) |
| 35 to 44 Years | 73 (83.9%) | 14 (19.2%) |
| 45 to 54 Years | 102 (91.9%) | 0 (0.0%) |
| 55 to 59 Years | 73 (94.8%) | 0 (0.0%) |
| 60 to 64 Years | 50 (64.1%) | 0 (0.0%) |
| 65 to 74 Years | 13 (31.0%) | 0 (0.0%) |
| 75 Years and over | 0 (0.0%) | 0 (0.0%) |
| Total | 494 (75.3%) | 26 (5.3%) |
Employment Status by Educational Attainment in Lecompton
According to labor force statistics for Lecompton, 84.3% of individuals (360) out of the total population between 25 and 64 years of age (427) are in the labor force, with 3.9% or 14 of them being unemployed. The group with the highest labor force participation rate are those with the educational attainment of less than high school, with 100.0% or 31 individuals in the labor force. Within the labor force, individuals with less than high school education have the highest percentage of unemployment, with 45.2% or 14 of them being unemployed.
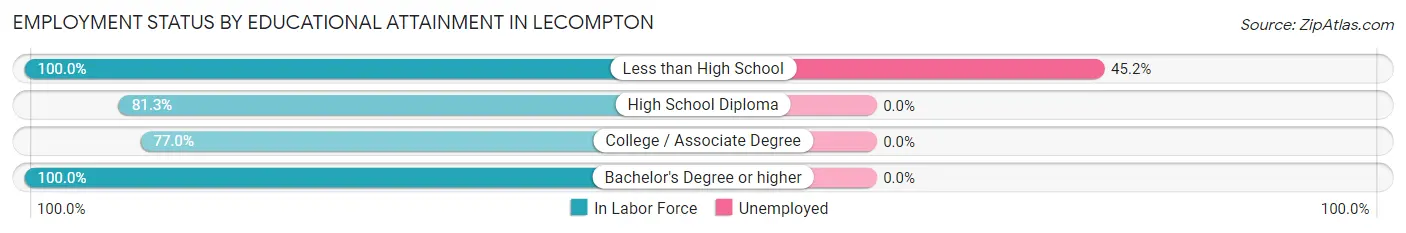
| Educational Attainment | In Labor Force | Unemployed |
| Less than High School | 31 (100.0%) | 14 (45.2%) |
| High School Diploma | 157 (81.3%) | 0 (0.0%) |
| College / Associate Degree | 104 (77.0%) | 0 (0.0%) |
| Bachelor's Degree or higher | 68 (100.0%) | 0 (0.0%) |
| Total | 360 (84.3%) | 17 (3.9%) |
Employment Occupations by Sex in Lecompton
Management, Business, Science and Arts Occupations
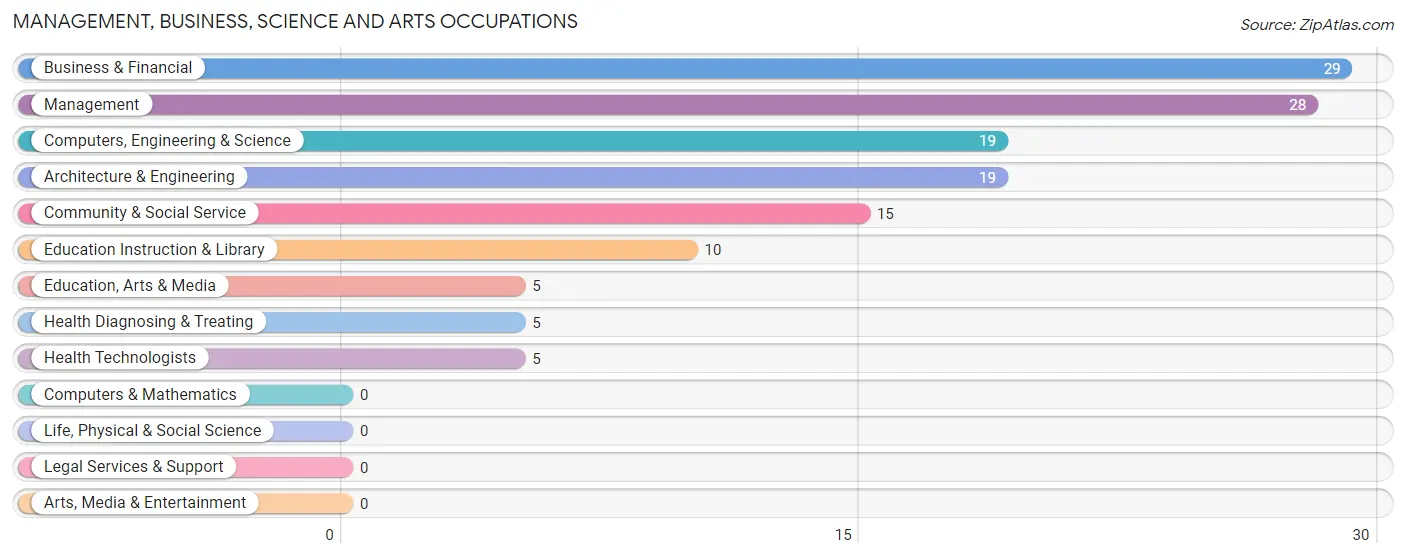
The most common Management, Business, Science and Arts occupations in Lecompton are Business & Financial (29 | 6.2%), Management (28 | 6.0%), Computers, Engineering & Science (19 | 4.1%), Architecture & Engineering (19 | 4.1%), and Community & Social Service (15 | 3.2%).
Management, Business, Science and Arts Occupations by Sex
Within the Management, Business, Science and Arts occupations in Lecompton, the most male-oriented occupations are Computers, Engineering & Science (100.0%), Architecture & Engineering (100.0%), and Community & Social Service (40.0%), while the most female-oriented occupations are Health Diagnosing & Treating (100.0%), Health Technologists (100.0%), and Business & Financial (93.1%).
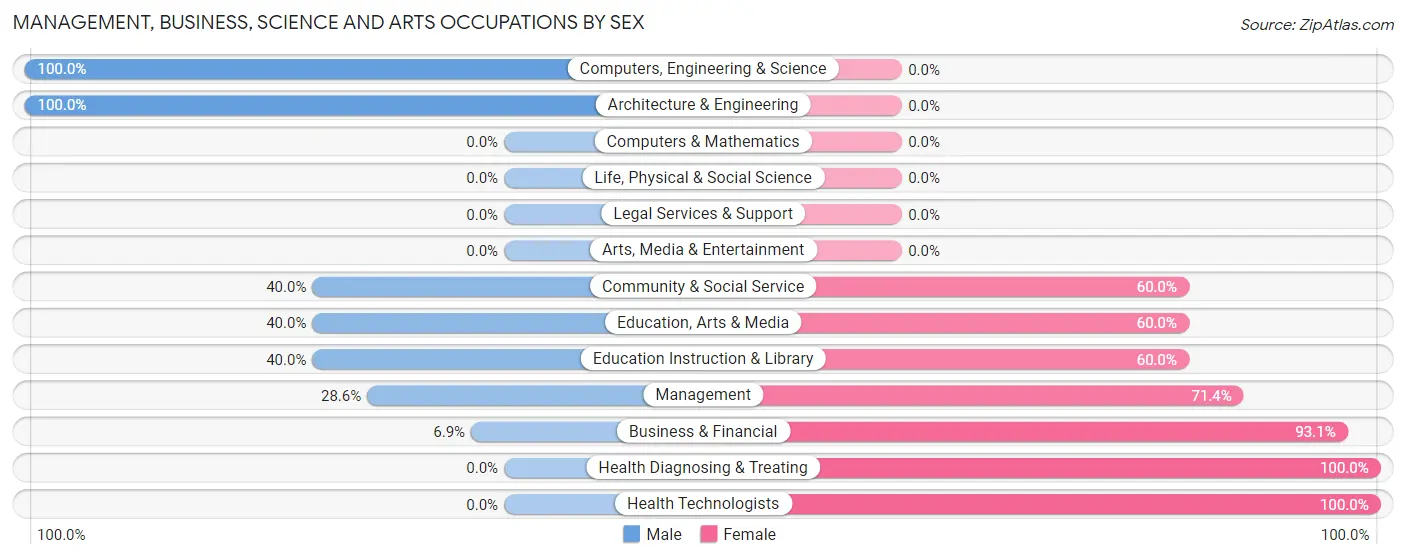
| Occupation | Male | Female |
| Management | 8 (28.6%) | 20 (71.4%) |
| Business & Financial | 2 (6.9%) | 27 (93.1%) |
| Computers, Engineering & Science | 19 (100.0%) | 0 (0.0%) |
| Computers & Mathematics | 0 (0.0%) | 0 (0.0%) |
| Architecture & Engineering | 19 (100.0%) | 0 (0.0%) |
| Life, Physical & Social Science | 0 (0.0%) | 0 (0.0%) |
| Community & Social Service | 6 (40.0%) | 9 (60.0%) |
| Education, Arts & Media | 2 (40.0%) | 3 (60.0%) |
| Legal Services & Support | 0 (0.0%) | 0 (0.0%) |
| Education Instruction & Library | 4 (40.0%) | 6 (60.0%) |
| Arts, Media & Entertainment | 0 (0.0%) | 0 (0.0%) |
| Health Diagnosing & Treating | 0 (0.0%) | 5 (100.0%) |
| Health Technologists | 0 (0.0%) | 5 (100.0%) |
| Total (Category) | 35 (36.5%) | 61 (63.5%) |
| Total (Overall) | 238 (50.8%) | 230 (49.1%) |
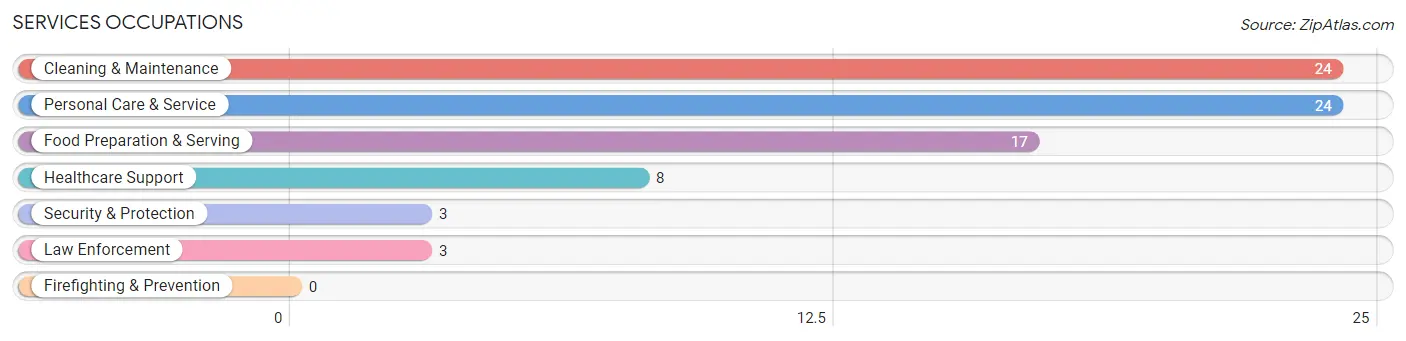
Services Occupations
The most common Services occupations in Lecompton are Cleaning & Maintenance (24 | 5.1%), Personal Care & Service (24 | 5.1%), Food Preparation & Serving (17 | 3.6%), Healthcare Support (8 | 1.7%), and Security & Protection (3 | 0.6%).
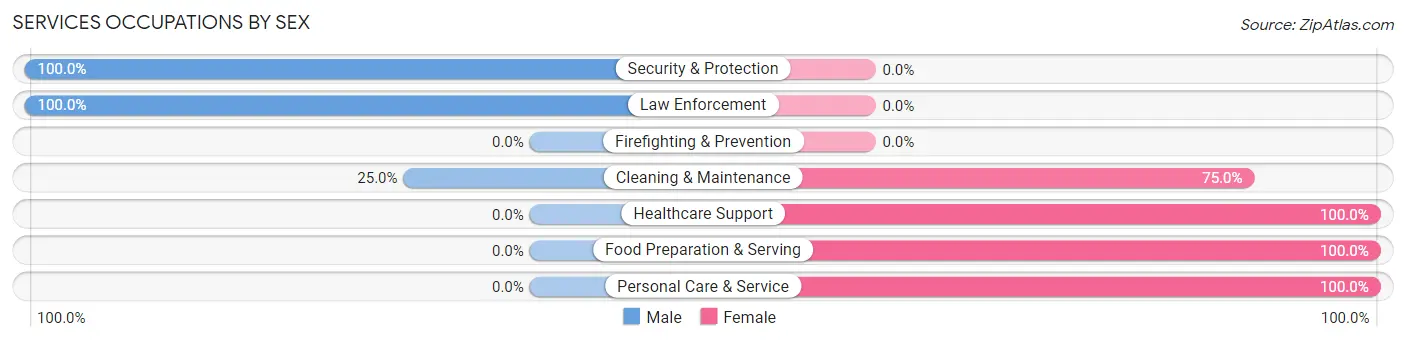
Services Occupations by Sex
Within the Services occupations in Lecompton, the most male-oriented occupations are Security & Protection (100.0%), Law Enforcement (100.0%), and Cleaning & Maintenance (25.0%), while the most female-oriented occupations are Healthcare Support (100.0%), Food Preparation & Serving (100.0%), and Personal Care & Service (100.0%).
| Occupation | Male | Female |
| Healthcare Support | 0 (0.0%) | 8 (100.0%) |
| Security & Protection | 3 (100.0%) | 0 (0.0%) |
| Firefighting & Prevention | 0 (0.0%) | 0 (0.0%) |
| Law Enforcement | 3 (100.0%) | 0 (0.0%) |
| Food Preparation & Serving | 0 (0.0%) | 17 (100.0%) |
| Cleaning & Maintenance | 6 (25.0%) | 18 (75.0%) |
| Personal Care & Service | 0 (0.0%) | 24 (100.0%) |
| Total (Category) | 9 (11.8%) | 67 (88.2%) |
| Total (Overall) | 238 (50.8%) | 230 (49.1%) |
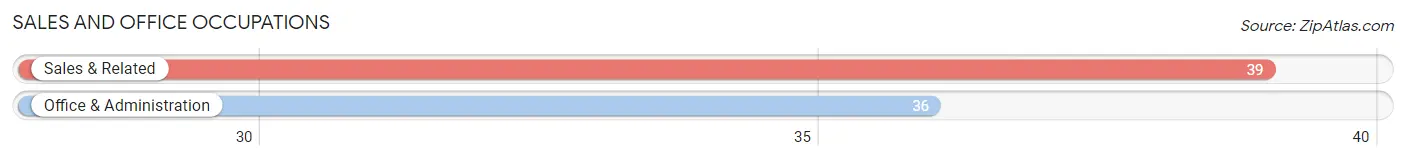
Sales and Office Occupations
The most common Sales and Office occupations in Lecompton are Sales & Related (39 | 8.3%), and Office & Administration (36 | 7.7%).
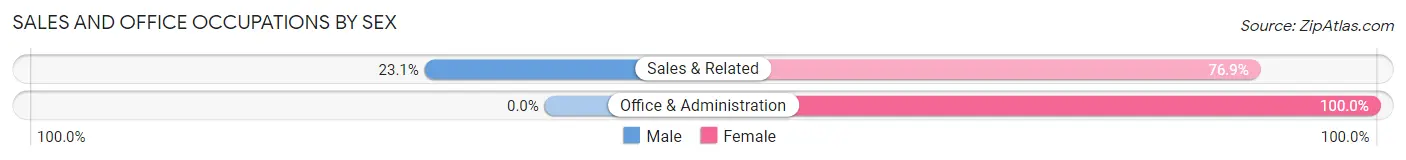
Sales and Office Occupations by Sex
| Occupation | Male | Female |
| Sales & Related | 9 (23.1%) | 30 (76.9%) |
| Office & Administration | 0 (0.0%) | 36 (100.0%) |
| Total (Category) | 9 (12.0%) | 66 (88.0%) |
| Total (Overall) | 238 (50.8%) | 230 (49.1%) |
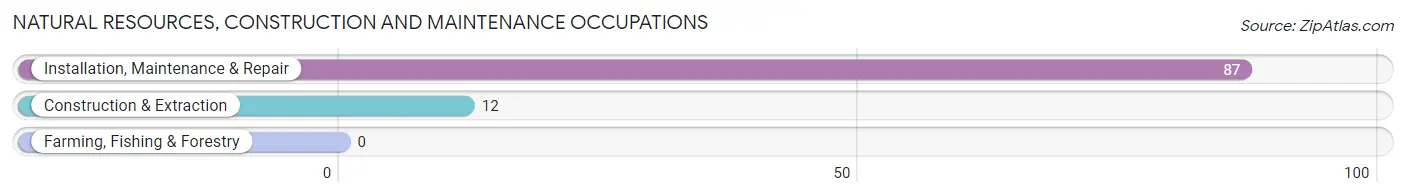
Natural Resources, Construction and Maintenance Occupations
The most common Natural Resources, Construction and Maintenance occupations in Lecompton are Installation, Maintenance & Repair (87 | 18.6%), and Construction & Extraction (12 | 2.6%).
Natural Resources, Construction and Maintenance Occupations by Sex
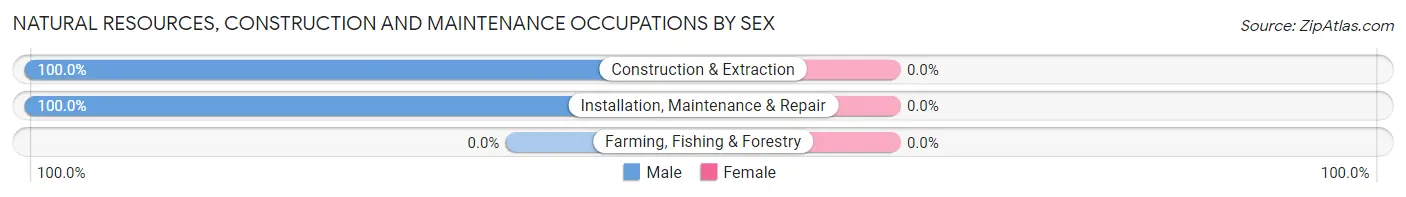
| Occupation | Male | Female |
| Farming, Fishing & Forestry | 0 (0.0%) | 0 (0.0%) |
| Construction & Extraction | 12 (100.0%) | 0 (0.0%) |
| Installation, Maintenance & Repair | 87 (100.0%) | 0 (0.0%) |
| Total (Category) | 99 (100.0%) | 0 (0.0%) |
| Total (Overall) | 238 (50.8%) | 230 (49.1%) |
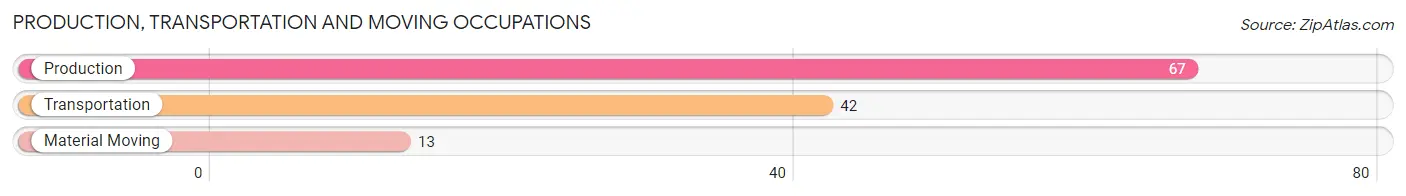
Production, Transportation and Moving Occupations
The most common Production, Transportation and Moving occupations in Lecompton are Production (67 | 14.3%), Transportation (42 | 9.0%), and Material Moving (13 | 2.8%).
Production, Transportation and Moving Occupations by Sex
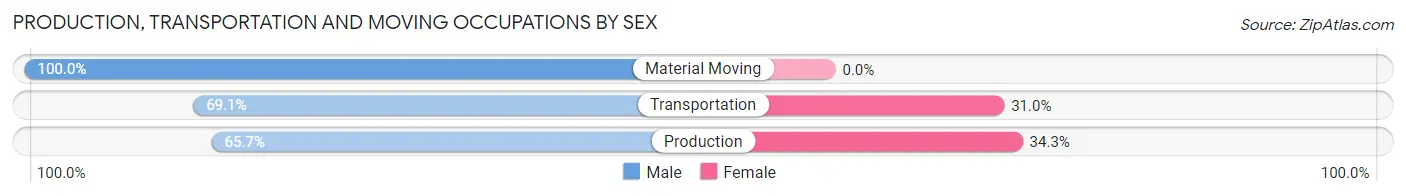
| Occupation | Male | Female |
| Production | 44 (65.7%) | 23 (34.3%) |
| Transportation | 29 (69.1%) | 13 (30.9%) |
| Material Moving | 13 (100.0%) | 0 (0.0%) |
| Total (Category) | 86 (70.5%) | 36 (29.5%) |
| Total (Overall) | 238 (50.8%) | 230 (49.1%) |
Employment Industries by Sex in Lecompton
Employment Industries in Lecompton
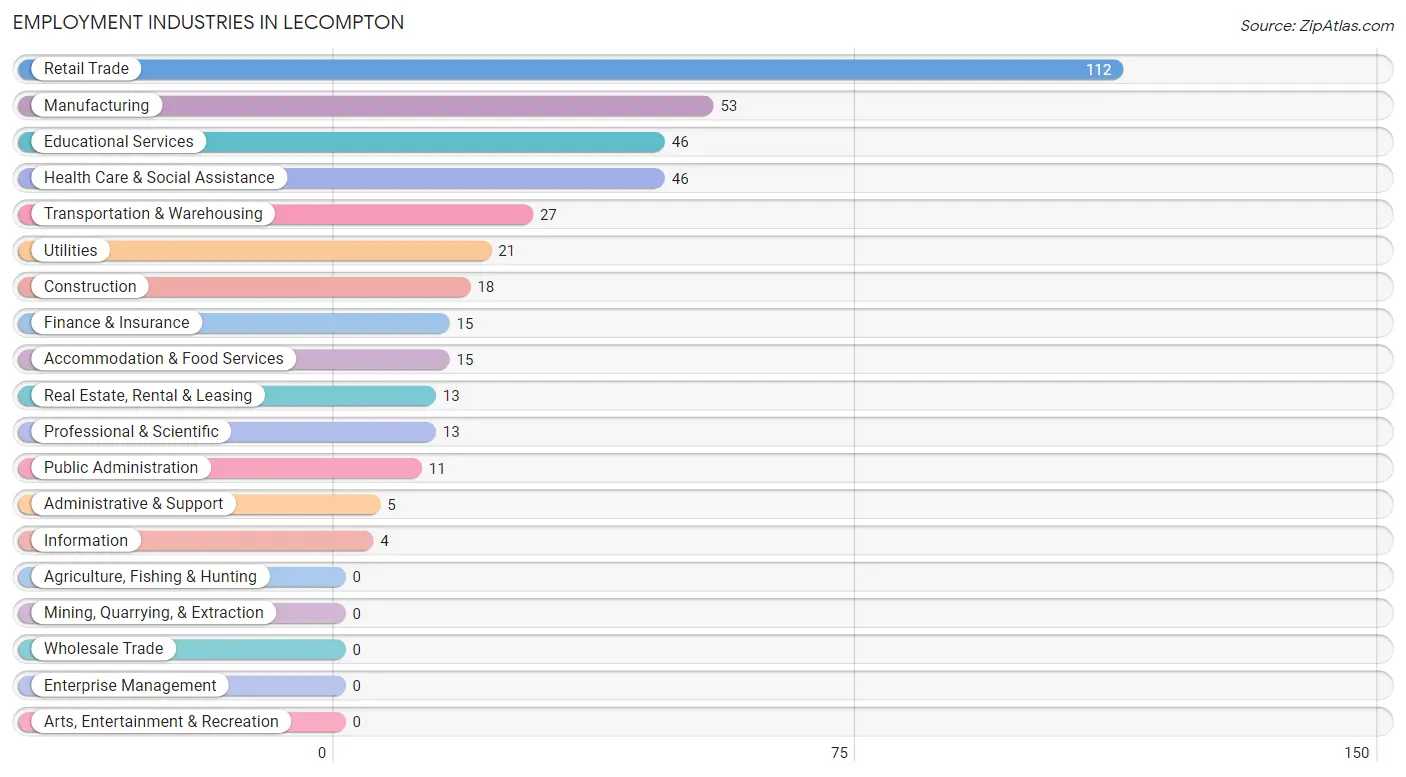
The major employment industries in Lecompton include Retail Trade (112 | 23.9%), Manufacturing (53 | 11.3%), Educational Services (46 | 9.8%), Health Care & Social Assistance (46 | 9.8%), and Transportation & Warehousing (27 | 5.8%).
Employment Industries by Sex in Lecompton
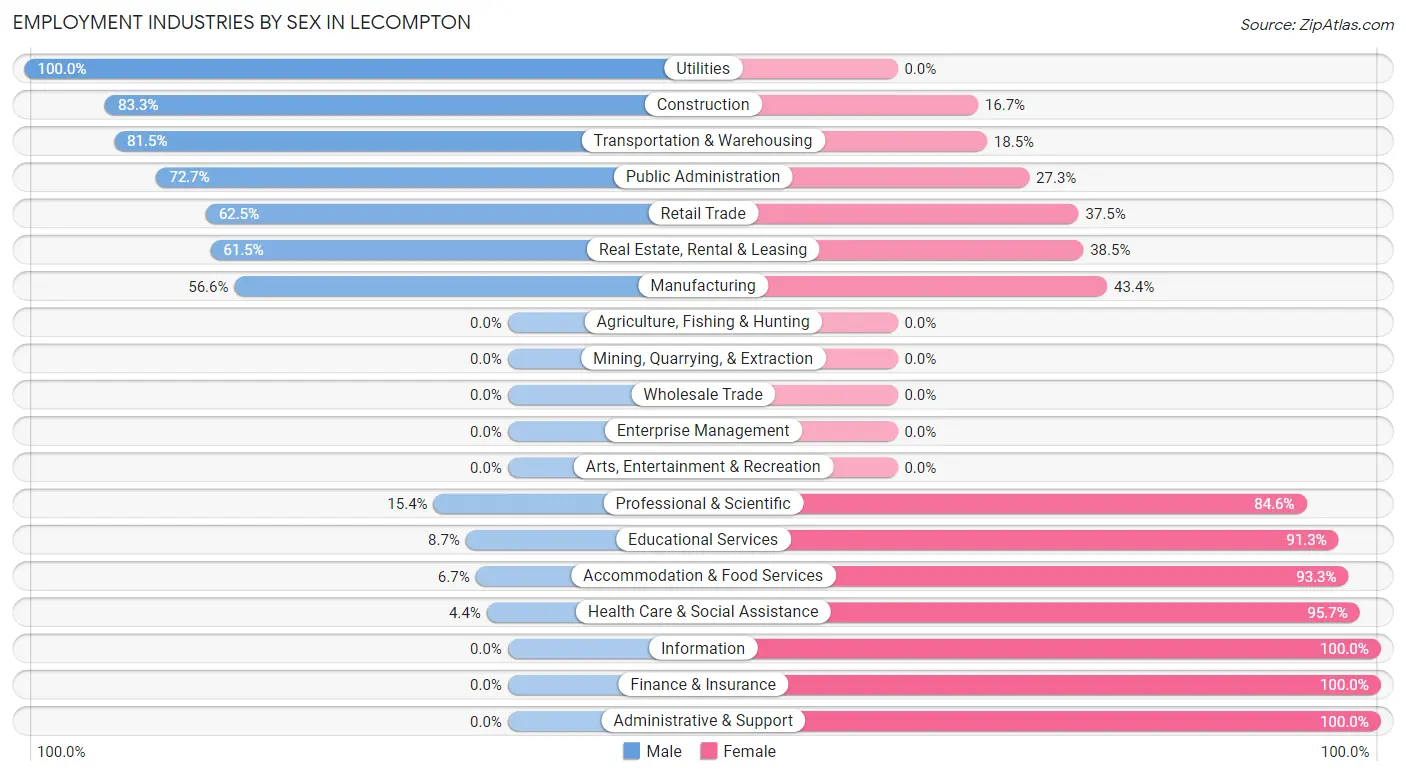
The Lecompton industries that see more men than women are Utilities (100.0%), Construction (83.3%), and Transportation & Warehousing (81.5%), whereas the industries that tend to have a higher number of women are Information (100.0%), Finance & Insurance (100.0%), and Administrative & Support (100.0%).
| Industry | Male | Female |
| Agriculture, Fishing & Hunting | 0 (0.0%) | 0 (0.0%) |
| Mining, Quarrying, & Extraction | 0 (0.0%) | 0 (0.0%) |
| Construction | 15 (83.3%) | 3 (16.7%) |
| Manufacturing | 30 (56.6%) | 23 (43.4%) |
| Wholesale Trade | 0 (0.0%) | 0 (0.0%) |
| Retail Trade | 70 (62.5%) | 42 (37.5%) |
| Transportation & Warehousing | 22 (81.5%) | 5 (18.5%) |
| Utilities | 21 (100.0%) | 0 (0.0%) |
| Information | 0 (0.0%) | 4 (100.0%) |
| Finance & Insurance | 0 (0.0%) | 15 (100.0%) |
| Real Estate, Rental & Leasing | 8 (61.5%) | 5 (38.5%) |
| Professional & Scientific | 2 (15.4%) | 11 (84.6%) |
| Enterprise Management | 0 (0.0%) | 0 (0.0%) |
| Administrative & Support | 0 (0.0%) | 5 (100.0%) |
| Educational Services | 4 (8.7%) | 42 (91.3%) |
| Health Care & Social Assistance | 2 (4.3%) | 44 (95.7%) |
| Arts, Entertainment & Recreation | 0 (0.0%) | 0 (0.0%) |
| Accommodation & Food Services | 1 (6.7%) | 14 (93.3%) |
| Public Administration | 8 (72.7%) | 3 (27.3%) |
| Total | 238 (50.8%) | 230 (49.1%) |
Education in Lecompton
School Enrollment in Lecompton
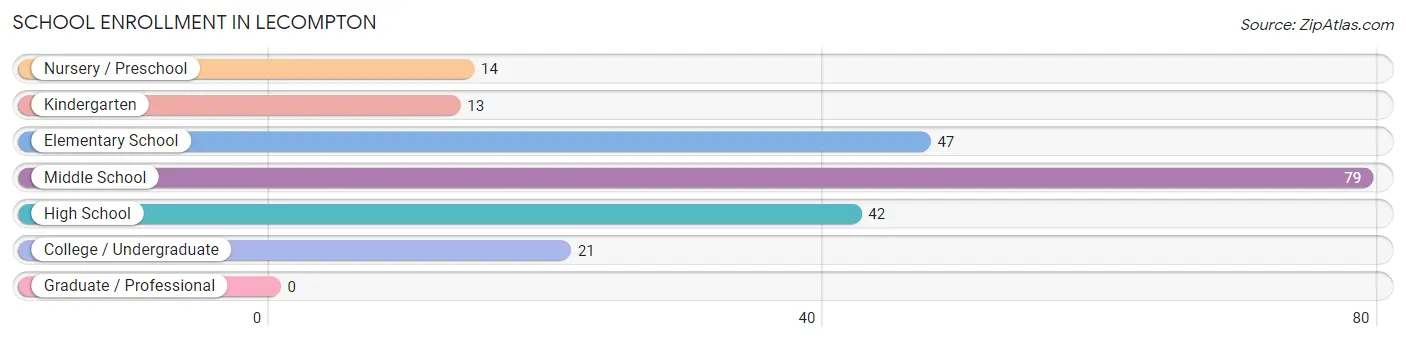
The most common levels of schooling among the 216 students in Lecompton are middle school (79 | 36.6%), elementary school (47 | 21.8%), and high school (42 | 19.4%).
| School Level | # Students | % Students |
| Nursery / Preschool | 14 | 6.5% |
| Kindergarten | 13 | 6.0% |
| Elementary School | 47 | 21.8% |
| Middle School | 79 | 36.6% |
| High School | 42 | 19.4% |
| College / Undergraduate | 21 | 9.7% |
| Graduate / Professional | 0 | 0.0% |
| Total | 216 | 100.0% |
School Enrollment by Age by Funding Source in Lecompton
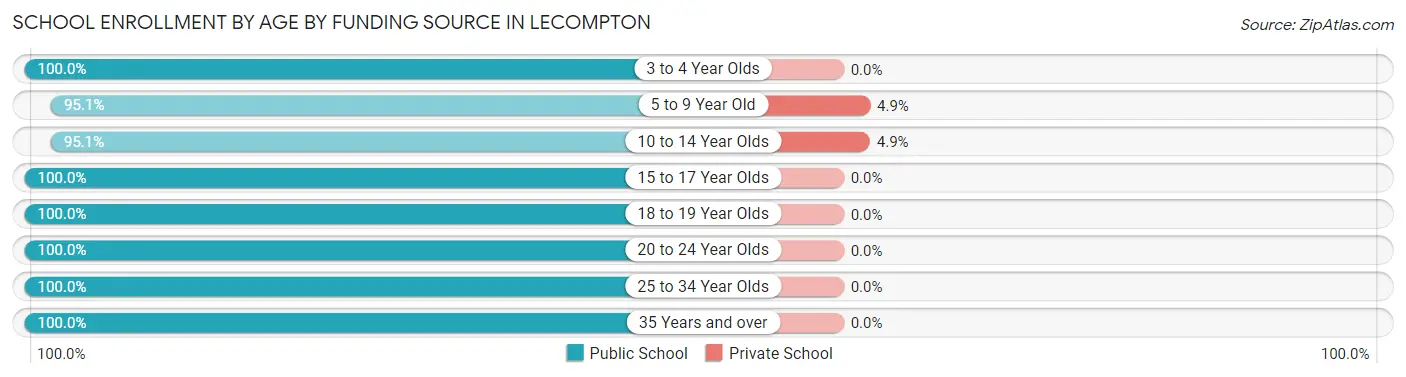
Out of a total of 216 students who are enrolled in schools in Lecompton, 7 (3.2%) attend a private institution, while the remaining 209 (96.8%) are enrolled in public schools. The age group of 5 to 9 year old has the highest likelihood of being enrolled in private schools, with 3 (4.9% in the age bracket) enrolled. Conversely, the age group of 3 to 4 year olds has the lowest likelihood of being enrolled in a private school, with 12 (100.0% in the age bracket) attending a public institution.
| Age Bracket | Public School | Private School |
| 3 to 4 Year Olds | 12 (100.0%) | 0 (0.0%) |
| 5 to 9 Year Old | 58 (95.1%) | 3 (4.9%) |
| 10 to 14 Year Olds | 78 (95.1%) | 4 (4.9%) |
| 15 to 17 Year Olds | 38 (100.0%) | 0 (0.0%) |
| 18 to 19 Year Olds | 2 (100.0%) | 0 (0.0%) |
| 20 to 24 Year Olds | 13 (100.0%) | 0 (0.0%) |
| 25 to 34 Year Olds | 1 (100.0%) | 0 (0.0%) |
| 35 Years and over | 7 (100.0%) | 0 (0.0%) |
| Total | 209 (96.8%) | 7 (3.2%) |
Educational Attainment by Field of Study in Lecompton
Business (23 | 25.6%), engineering (16 | 17.8%), science & technology (16 | 17.8%), education (14 | 15.6%), and literature & languages (7 | 7.8%) are the most common fields of study among 90 individuals in Lecompton who have obtained a bachelor's degree or higher.
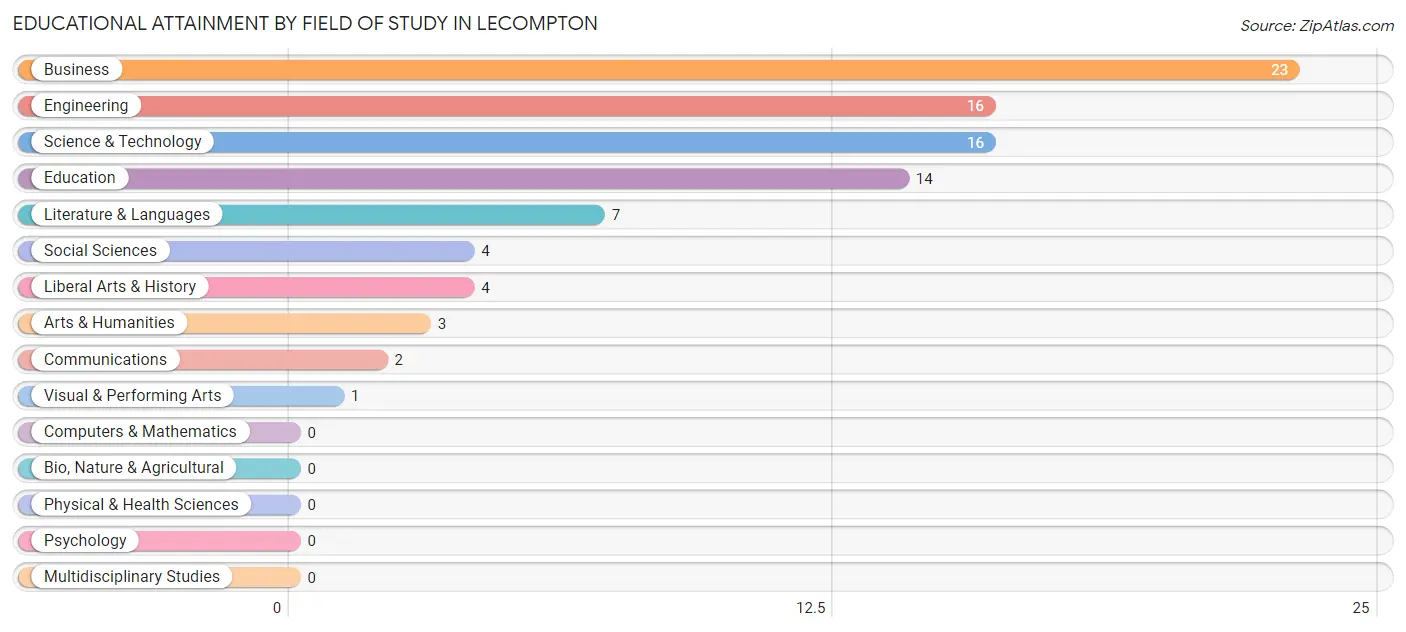
| Field of Study | # Graduates | % Graduates |
| Computers & Mathematics | 0 | 0.0% |
| Bio, Nature & Agricultural | 0 | 0.0% |
| Physical & Health Sciences | 0 | 0.0% |
| Psychology | 0 | 0.0% |
| Social Sciences | 4 | 4.4% |
| Engineering | 16 | 17.8% |
| Multidisciplinary Studies | 0 | 0.0% |
| Science & Technology | 16 | 17.8% |
| Business | 23 | 25.6% |
| Education | 14 | 15.6% |
| Literature & Languages | 7 | 7.8% |
| Liberal Arts & History | 4 | 4.4% |
| Visual & Performing Arts | 1 | 1.1% |
| Communications | 2 | 2.2% |
| Arts & Humanities | 3 | 3.3% |
| Total | 90 | 100.0% |
Transportation & Commute in Lecompton
Vehicle Availability by Sex in Lecompton
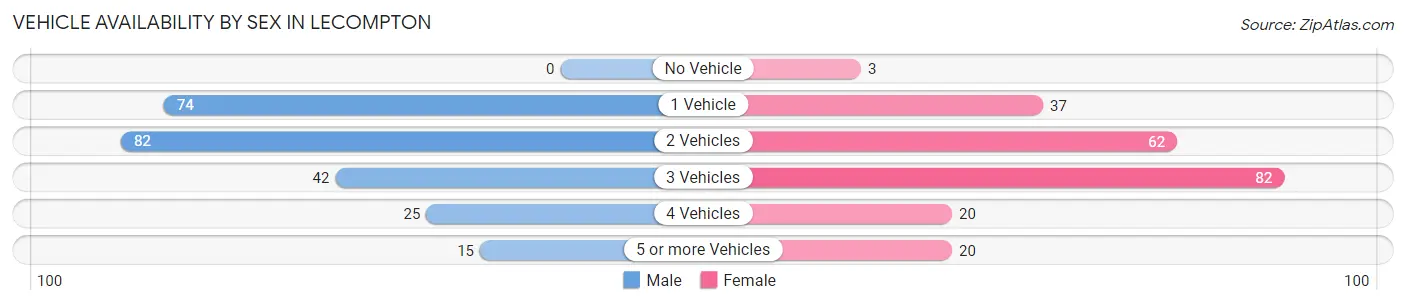
The most prevalent vehicle ownership categories in Lecompton are males with 2 vehicles (82, accounting for 34.4%) and females with 2 vehicles (62, making up 36.6%).
| Vehicles Available | Male | Female |
| No Vehicle | 0 (0.0%) | 3 (1.3%) |
| 1 Vehicle | 74 (31.1%) | 37 (16.5%) |
| 2 Vehicles | 82 (34.4%) | 62 (27.7%) |
| 3 Vehicles | 42 (17.6%) | 82 (36.6%) |
| 4 Vehicles | 25 (10.5%) | 20 (8.9%) |
| 5 or more Vehicles | 15 (6.3%) | 20 (8.9%) |
| Total | 238 (100.0%) | 224 (100.0%) |
Commute Time in Lecompton
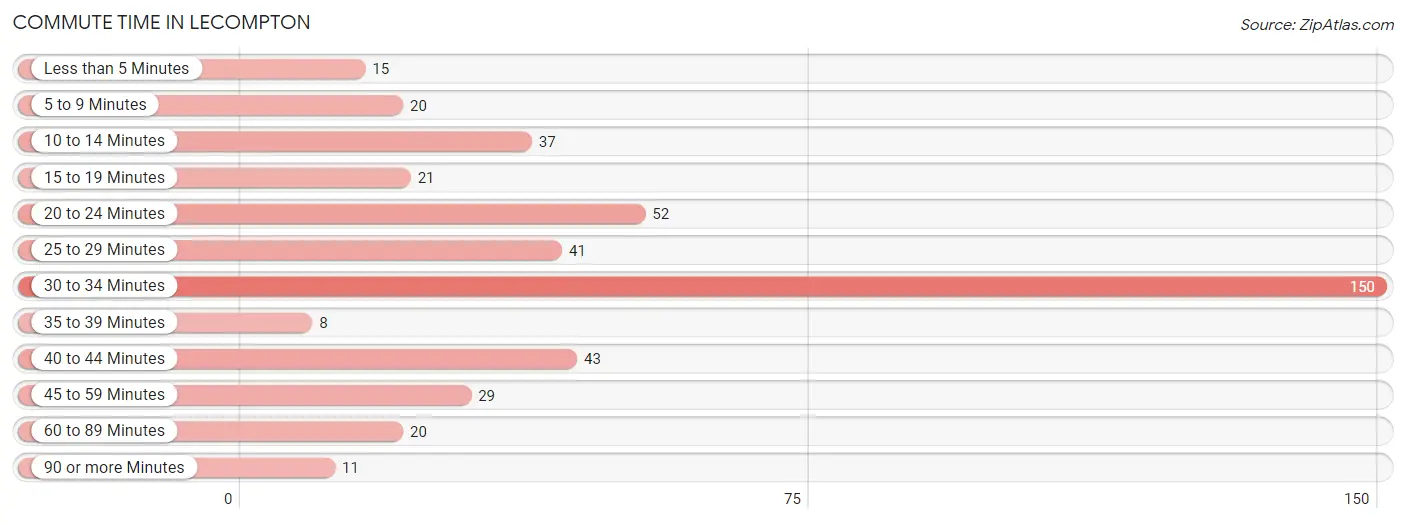
The most frequently occuring commute durations in Lecompton are 30 to 34 minutes (150 commuters, 33.6%), 20 to 24 minutes (52 commuters, 11.6%), and 40 to 44 minutes (43 commuters, 9.6%).
| Commute Time | # Commuters | % Commuters |
| Less than 5 Minutes | 15 | 3.4% |
| 5 to 9 Minutes | 20 | 4.5% |
| 10 to 14 Minutes | 37 | 8.3% |
| 15 to 19 Minutes | 21 | 4.7% |
| 20 to 24 Minutes | 52 | 11.6% |
| 25 to 29 Minutes | 41 | 9.2% |
| 30 to 34 Minutes | 150 | 33.6% |
| 35 to 39 Minutes | 8 | 1.8% |
| 40 to 44 Minutes | 43 | 9.6% |
| 45 to 59 Minutes | 29 | 6.5% |
| 60 to 89 Minutes | 20 | 4.5% |
| 90 or more Minutes | 11 | 2.5% |
Commute Time by Sex in Lecompton
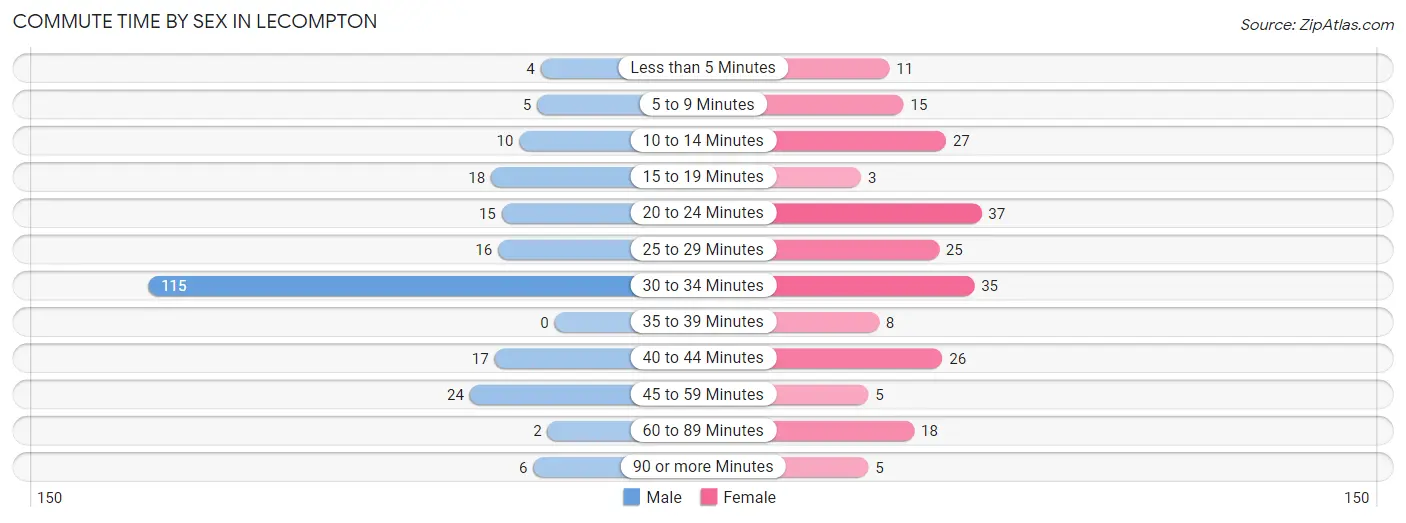
The most common commute times in Lecompton are 30 to 34 minutes (115 commuters, 49.6%) for males and 20 to 24 minutes (37 commuters, 17.2%) for females.
| Commute Time | Male | Female |
| Less than 5 Minutes | 4 (1.7%) | 11 (5.1%) |
| 5 to 9 Minutes | 5 (2.2%) | 15 (7.0%) |
| 10 to 14 Minutes | 10 (4.3%) | 27 (12.6%) |
| 15 to 19 Minutes | 18 (7.8%) | 3 (1.4%) |
| 20 to 24 Minutes | 15 (6.5%) | 37 (17.2%) |
| 25 to 29 Minutes | 16 (6.9%) | 25 (11.6%) |
| 30 to 34 Minutes | 115 (49.6%) | 35 (16.3%) |
| 35 to 39 Minutes | 0 (0.0%) | 8 (3.7%) |
| 40 to 44 Minutes | 17 (7.3%) | 26 (12.1%) |
| 45 to 59 Minutes | 24 (10.3%) | 5 (2.3%) |
| 60 to 89 Minutes | 2 (0.9%) | 18 (8.4%) |
| 90 or more Minutes | 6 (2.6%) | 5 (2.3%) |
Time of Departure to Work by Sex in Lecompton
The most frequent times of departure to work in Lecompton are 11:00 AM to 11:59 AM (63, 27.2%) for males and 7:30 AM to 7:59 AM (58, 27.0%) for females.
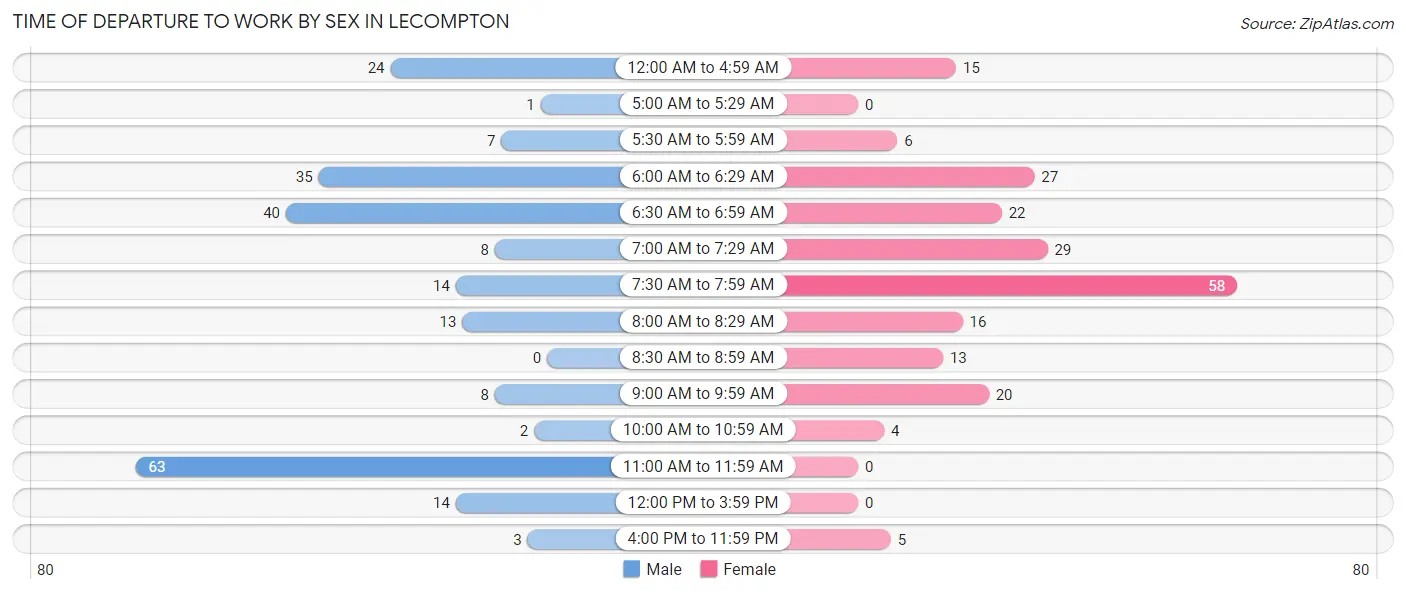
| Time of Departure | Male | Female |
| 12:00 AM to 4:59 AM | 24 (10.3%) | 15 (7.0%) |
| 5:00 AM to 5:29 AM | 1 (0.4%) | 0 (0.0%) |
| 5:30 AM to 5:59 AM | 7 (3.0%) | 6 (2.8%) |
| 6:00 AM to 6:29 AM | 35 (15.1%) | 27 (12.6%) |
| 6:30 AM to 6:59 AM | 40 (17.2%) | 22 (10.2%) |
| 7:00 AM to 7:29 AM | 8 (3.5%) | 29 (13.5%) |
| 7:30 AM to 7:59 AM | 14 (6.0%) | 58 (27.0%) |
| 8:00 AM to 8:29 AM | 13 (5.6%) | 16 (7.4%) |
| 8:30 AM to 8:59 AM | 0 (0.0%) | 13 (6.0%) |
| 9:00 AM to 9:59 AM | 8 (3.5%) | 20 (9.3%) |
| 10:00 AM to 10:59 AM | 2 (0.9%) | 4 (1.9%) |
| 11:00 AM to 11:59 AM | 63 (27.2%) | 0 (0.0%) |
| 12:00 PM to 3:59 PM | 14 (6.0%) | 0 (0.0%) |
| 4:00 PM to 11:59 PM | 3 (1.3%) | 5 (2.3%) |
| Total | 232 (100.0%) | 215 (100.0%) |
Housing Occupancy in Lecompton
Occupancy by Ownership in Lecompton
Of the total 272 dwellings in Lecompton, owner-occupied units account for 222 (81.6%), while renter-occupied units make up 50 (18.4%).
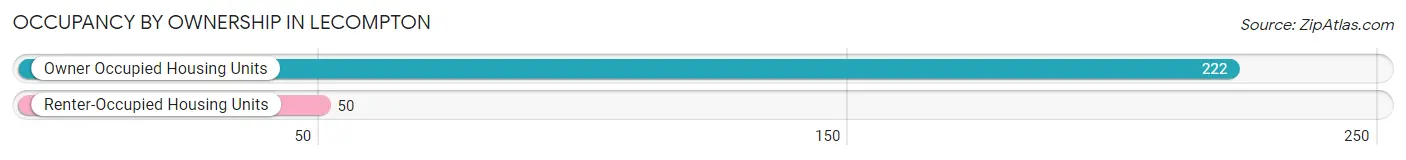
| Occupancy | # Housing Units | % Housing Units |
| Owner Occupied Housing Units | 222 | 81.6% |
| Renter-Occupied Housing Units | 50 | 18.4% |
| Total Occupied Housing Units | 272 | 100.0% |
Occupancy by Household Size in Lecompton
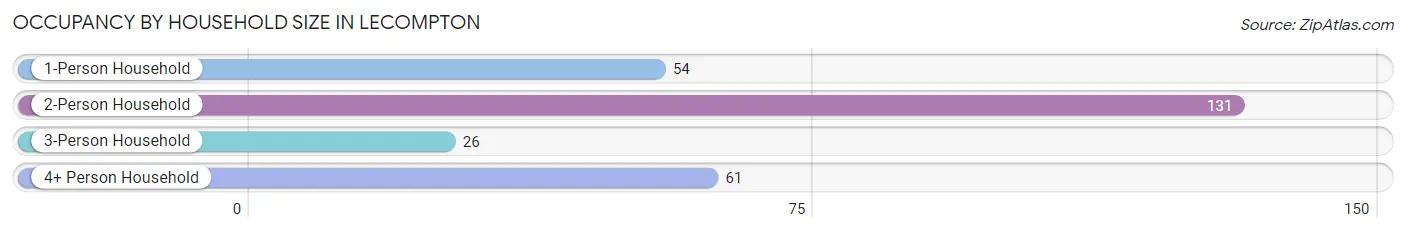
| Household Size | # Housing Units | % Housing Units |
| 1-Person Household | 54 | 19.9% |
| 2-Person Household | 131 | 48.2% |
| 3-Person Household | 26 | 9.6% |
| 4+ Person Household | 61 | 22.4% |
| Total Housing Units | 272 | 100.0% |
Occupancy by Ownership by Household Size in Lecompton
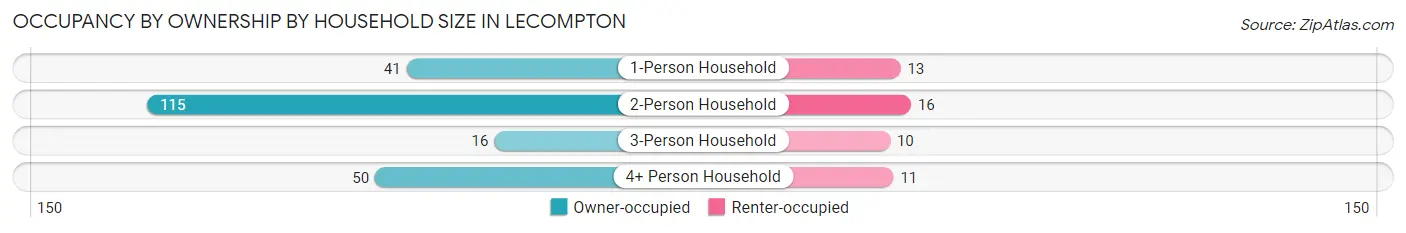
| Household Size | Owner-occupied | Renter-occupied |
| 1-Person Household | 41 (75.9%) | 13 (24.1%) |
| 2-Person Household | 115 (87.8%) | 16 (12.2%) |
| 3-Person Household | 16 (61.5%) | 10 (38.5%) |
| 4+ Person Household | 50 (82.0%) | 11 (18.0%) |
| Total Housing Units | 222 (81.6%) | 50 (18.4%) |
Occupancy by Educational Attainment in Lecompton
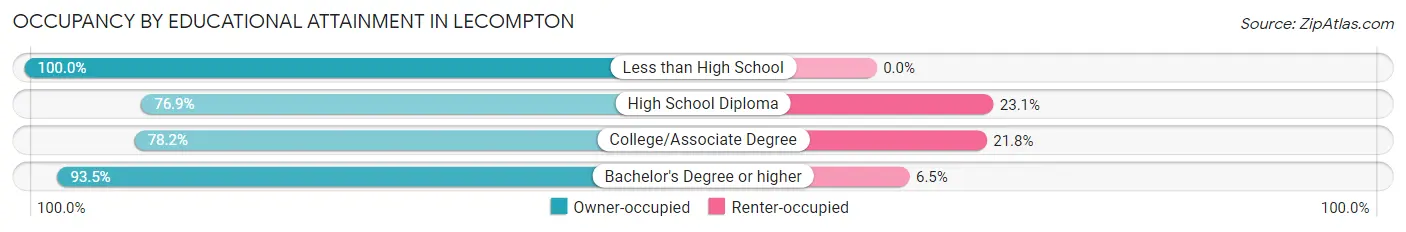
| Household Size | Owner-occupied | Renter-occupied |
| Less than High School | 18 (100.0%) | 0 (0.0%) |
| High School Diploma | 93 (76.9%) | 28 (23.1%) |
| College/Associate Degree | 68 (78.2%) | 19 (21.8%) |
| Bachelor's Degree or higher | 43 (93.5%) | 3 (6.5%) |
Occupancy by Age of Householder in Lecompton
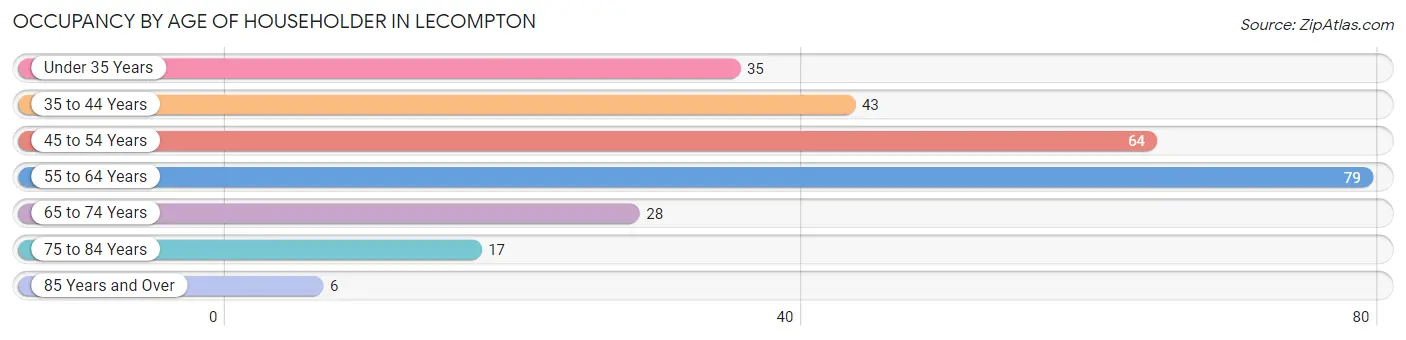
| Age Bracket | # Households | % Households |
| Under 35 Years | 35 | 12.9% |
| 35 to 44 Years | 43 | 15.8% |
| 45 to 54 Years | 64 | 23.5% |
| 55 to 64 Years | 79 | 29.0% |
| 65 to 74 Years | 28 | 10.3% |
| 75 to 84 Years | 17 | 6.2% |
| 85 Years and Over | 6 | 2.2% |
| Total | 272 | 100.0% |
Housing Finances in Lecompton
Median Income by Occupancy in Lecompton
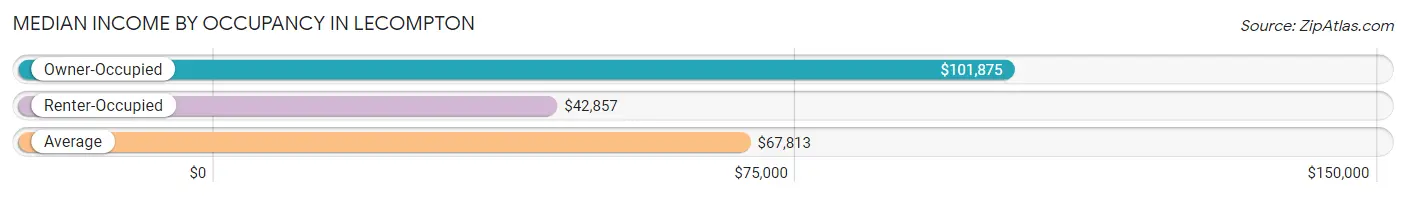
| Occupancy Type | # Households | Median Income |
| Owner-Occupied | 222 (81.6%) | $101,875 |
| Renter-Occupied | 50 (18.4%) | $42,857 |
| Average | 272 (100.0%) | $67,813 |
Occupancy by Householder Income Bracket in Lecompton
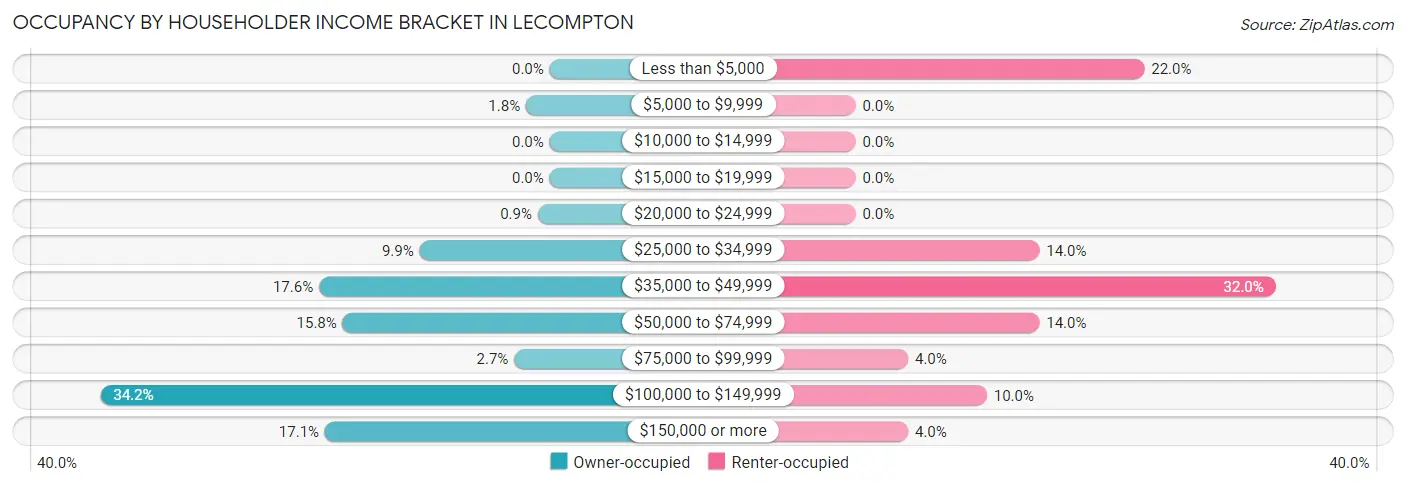
| Income Bracket | Owner-occupied | Renter-occupied |
| Less than $5,000 | 0 (0.0%) | 11 (22.0%) |
| $5,000 to $9,999 | 4 (1.8%) | 0 (0.0%) |
| $10,000 to $14,999 | 0 (0.0%) | 0 (0.0%) |
| $15,000 to $19,999 | 0 (0.0%) | 0 (0.0%) |
| $20,000 to $24,999 | 2 (0.9%) | 0 (0.0%) |
| $25,000 to $34,999 | 22 (9.9%) | 7 (14.0%) |
| $35,000 to $49,999 | 39 (17.6%) | 16 (32.0%) |
| $50,000 to $74,999 | 35 (15.8%) | 7 (14.0%) |
| $75,000 to $99,999 | 6 (2.7%) | 2 (4.0%) |
| $100,000 to $149,999 | 76 (34.2%) | 5 (10.0%) |
| $150,000 or more | 38 (17.1%) | 2 (4.0%) |
| Total | 222 (100.0%) | 50 (100.0%) |
Monthly Housing Cost Tiers in Lecompton
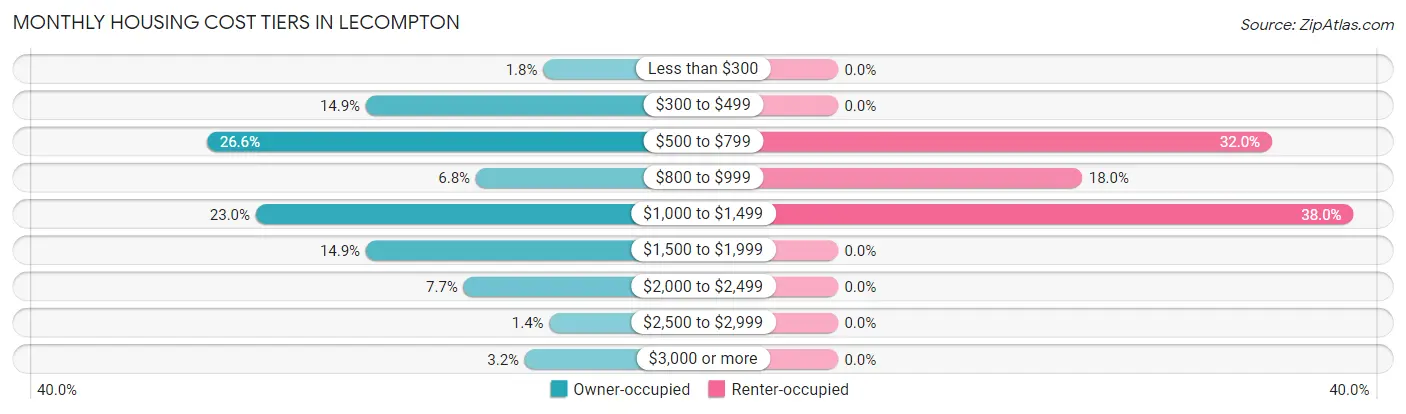
| Monthly Cost | Owner-occupied | Renter-occupied |
| Less than $300 | 4 (1.8%) | 0 (0.0%) |
| $300 to $499 | 33 (14.9%) | 0 (0.0%) |
| $500 to $799 | 59 (26.6%) | 16 (32.0%) |
| $800 to $999 | 15 (6.8%) | 9 (18.0%) |
| $1,000 to $1,499 | 51 (23.0%) | 19 (38.0%) |
| $1,500 to $1,999 | 33 (14.9%) | 0 (0.0%) |
| $2,000 to $2,499 | 17 (7.7%) | 0 (0.0%) |
| $2,500 to $2,999 | 3 (1.3%) | 0 (0.0%) |
| $3,000 or more | 7 (3.2%) | 0 (0.0%) |
| Total | 222 (100.0%) | 50 (100.0%) |
Physical Housing Characteristics in Lecompton
Housing Structures in Lecompton
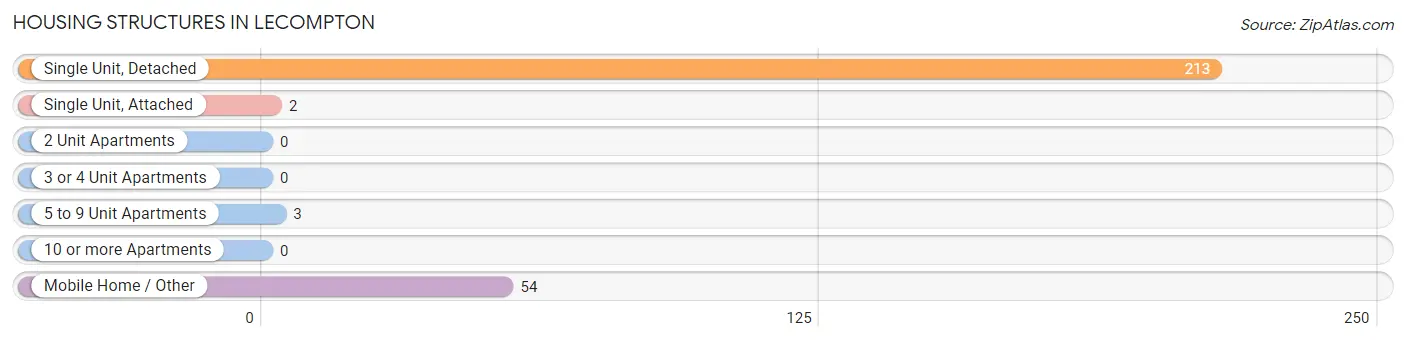
| Structure Type | # Housing Units | % Housing Units |
| Single Unit, Detached | 213 | 78.3% |
| Single Unit, Attached | 2 | 0.7% |
| 2 Unit Apartments | 0 | 0.0% |
| 3 or 4 Unit Apartments | 0 | 0.0% |
| 5 to 9 Unit Apartments | 3 | 1.1% |
| 10 or more Apartments | 0 | 0.0% |
| Mobile Home / Other | 54 | 19.9% |
| Total | 272 | 100.0% |
Housing Structures by Occupancy in Lecompton
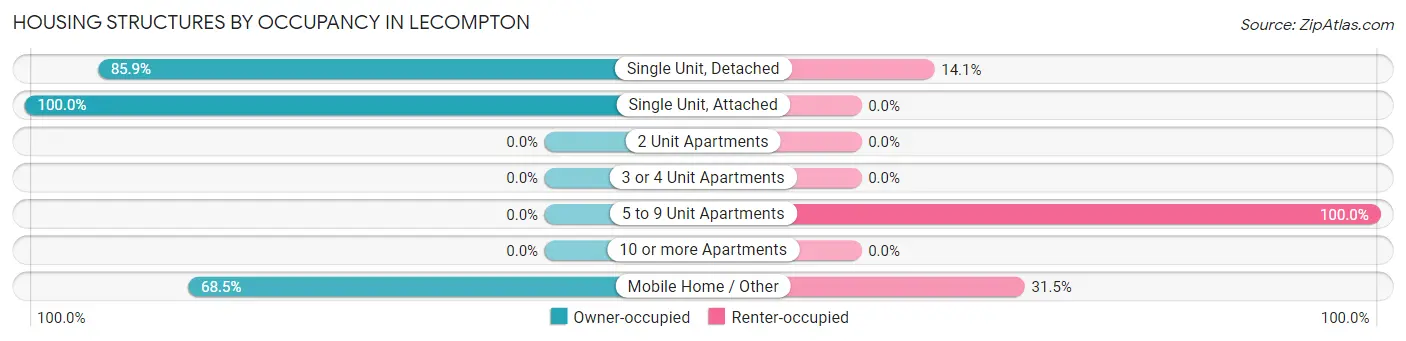
| Structure Type | Owner-occupied | Renter-occupied |
| Single Unit, Detached | 183 (85.9%) | 30 (14.1%) |
| Single Unit, Attached | 2 (100.0%) | 0 (0.0%) |
| 2 Unit Apartments | 0 (0.0%) | 0 (0.0%) |
| 3 or 4 Unit Apartments | 0 (0.0%) | 0 (0.0%) |
| 5 to 9 Unit Apartments | 0 (0.0%) | 3 (100.0%) |
| 10 or more Apartments | 0 (0.0%) | 0 (0.0%) |
| Mobile Home / Other | 37 (68.5%) | 17 (31.5%) |
| Total | 222 (81.6%) | 50 (18.4%) |
Housing Structures by Number of Rooms in Lecompton
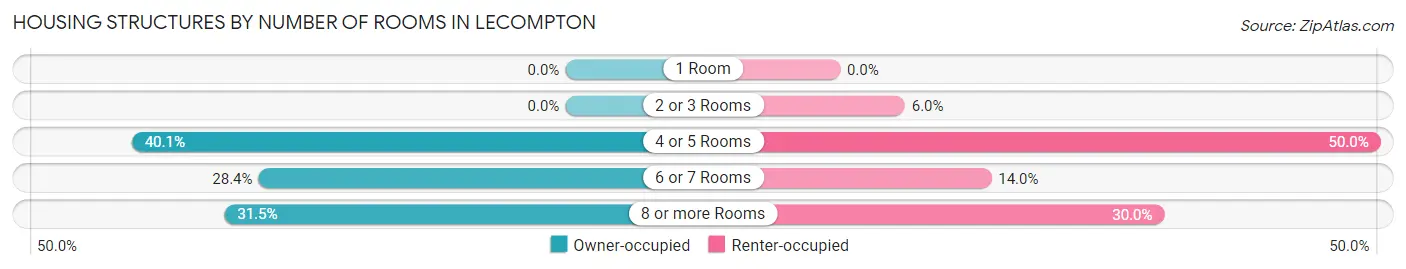
| Number of Rooms | Owner-occupied | Renter-occupied |
| 1 Room | 0 (0.0%) | 0 (0.0%) |
| 2 or 3 Rooms | 0 (0.0%) | 3 (6.0%) |
| 4 or 5 Rooms | 89 (40.1%) | 25 (50.0%) |
| 6 or 7 Rooms | 63 (28.4%) | 7 (14.0%) |
| 8 or more Rooms | 70 (31.5%) | 15 (30.0%) |
| Total | 222 (100.0%) | 50 (100.0%) |
Housing Structure by Heating Type in Lecompton
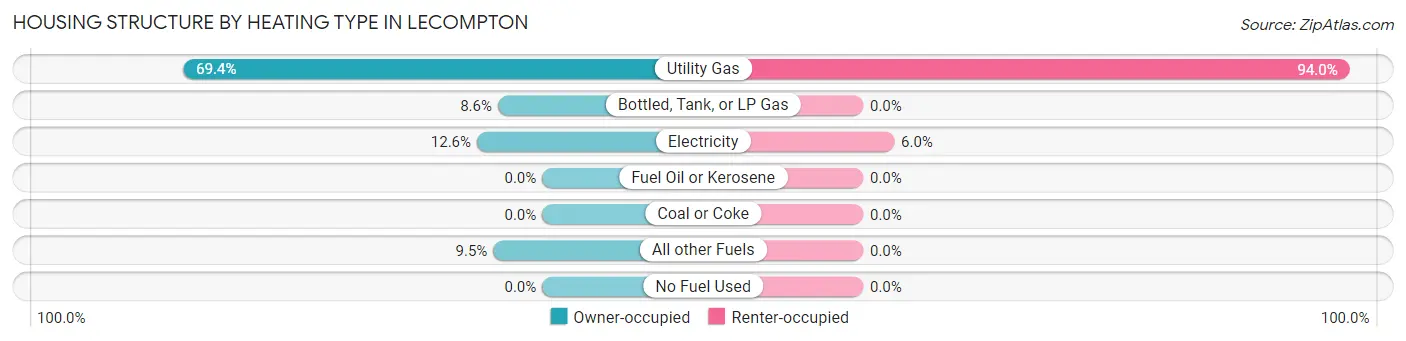
| Heating Type | Owner-occupied | Renter-occupied |
| Utility Gas | 154 (69.4%) | 47 (94.0%) |
| Bottled, Tank, or LP Gas | 19 (8.6%) | 0 (0.0%) |
| Electricity | 28 (12.6%) | 3 (6.0%) |
| Fuel Oil or Kerosene | 0 (0.0%) | 0 (0.0%) |
| Coal or Coke | 0 (0.0%) | 0 (0.0%) |
| All other Fuels | 21 (9.5%) | 0 (0.0%) |
| No Fuel Used | 0 (0.0%) | 0 (0.0%) |
| Total | 222 (100.0%) | 50 (100.0%) |
Household Vehicle Usage in Lecompton
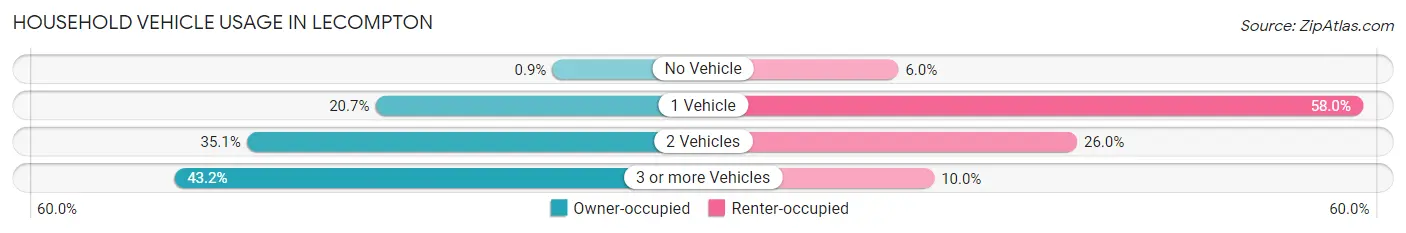
| Vehicles per Household | Owner-occupied | Renter-occupied |
| No Vehicle | 2 (0.9%) | 3 (6.0%) |
| 1 Vehicle | 46 (20.7%) | 29 (58.0%) |
| 2 Vehicles | 78 (35.1%) | 13 (26.0%) |
| 3 or more Vehicles | 96 (43.2%) | 5 (10.0%) |
| Total | 222 (100.0%) | 50 (100.0%) |
Real Estate & Mortgages in Lecompton
Real Estate and Mortgage Overview in Lecompton
| Characteristic | Without Mortgage | With Mortgage |
| Housing Units | 90 | 132 |
| Median Property Value | $102,200 | $207,500 |
| Median Household Income | $61,429 | $34 |
| Monthly Housing Costs | $580 | $7 |
| Real Estate Taxes | $1,984 | $5 |
Property Value by Mortgage Status in Lecompton
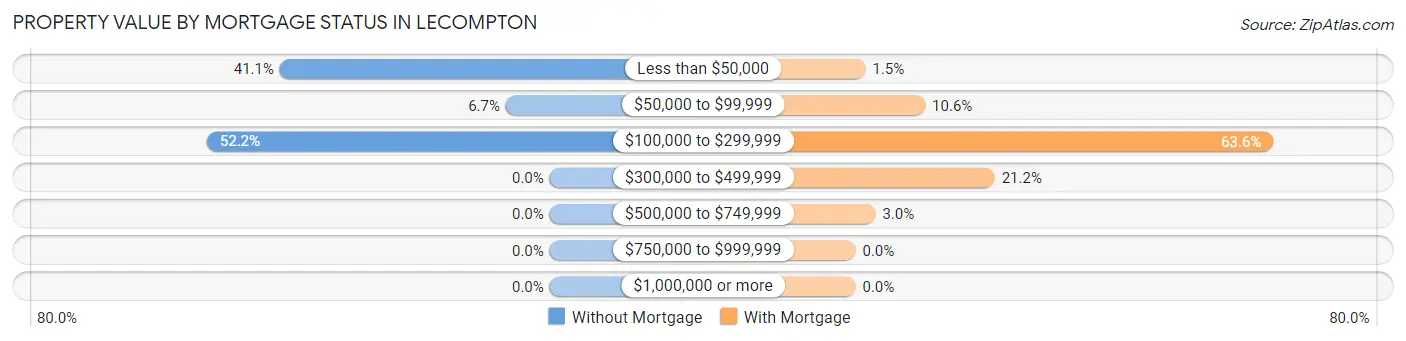
| Property Value | Without Mortgage | With Mortgage |
| Less than $50,000 | 37 (41.1%) | 2 (1.5%) |
| $50,000 to $99,999 | 6 (6.7%) | 14 (10.6%) |
| $100,000 to $299,999 | 47 (52.2%) | 84 (63.6%) |
| $300,000 to $499,999 | 0 (0.0%) | 28 (21.2%) |
| $500,000 to $749,999 | 0 (0.0%) | 4 (3.0%) |
| $750,000 to $999,999 | 0 (0.0%) | 0 (0.0%) |
| $1,000,000 or more | 0 (0.0%) | 0 (0.0%) |
| Total | 90 (100.0%) | 132 (100.0%) |
Household Income by Mortgage Status in Lecompton
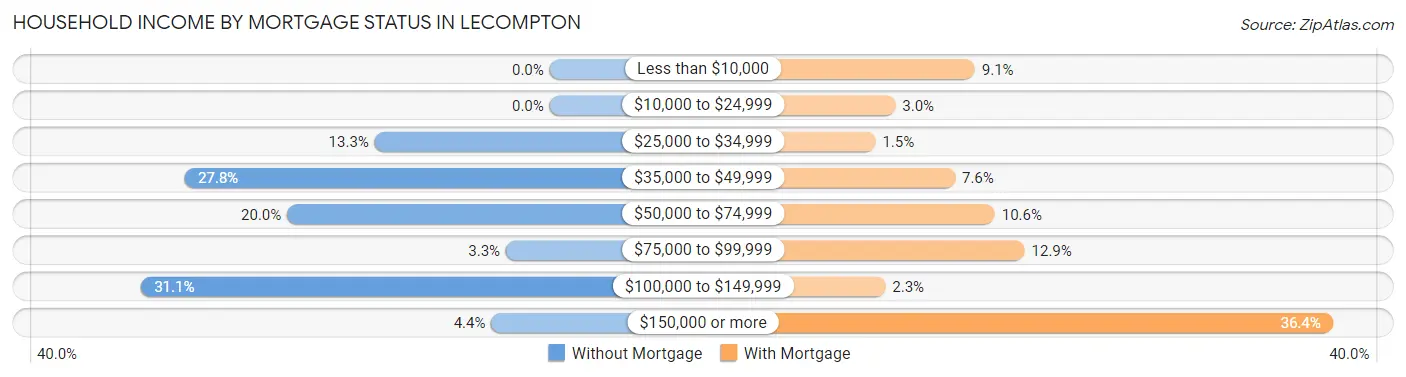
| Household Income | Without Mortgage | With Mortgage |
| Less than $10,000 | 0 (0.0%) | 12 (9.1%) |
| $10,000 to $24,999 | 0 (0.0%) | 4 (3.0%) |
| $25,000 to $34,999 | 12 (13.3%) | 2 (1.5%) |
| $35,000 to $49,999 | 25 (27.8%) | 10 (7.6%) |
| $50,000 to $74,999 | 18 (20.0%) | 14 (10.6%) |
| $75,000 to $99,999 | 3 (3.3%) | 17 (12.9%) |
| $100,000 to $149,999 | 28 (31.1%) | 3 (2.3%) |
| $150,000 or more | 4 (4.4%) | 48 (36.4%) |
| Total | 90 (100.0%) | 132 (100.0%) |
Property Value to Household Income Ratio in Lecompton
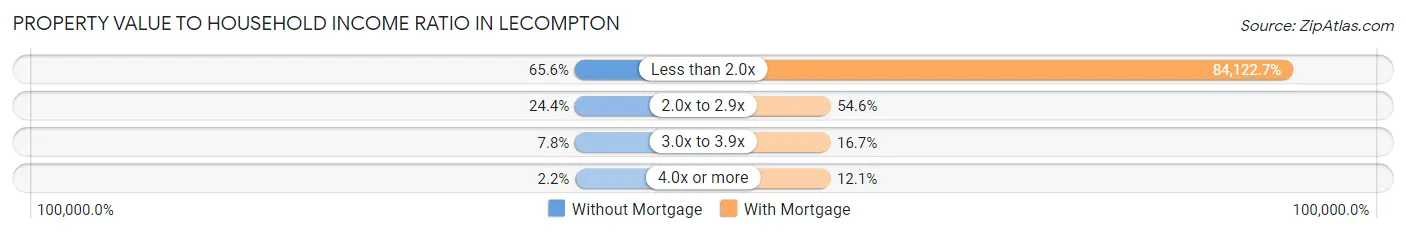
| Value-to-Income Ratio | Without Mortgage | With Mortgage |
| Less than 2.0x | 59 (65.6%) | 111,042 (84,122.7%) |
| 2.0x to 2.9x | 22 (24.4%) | 72 (54.5%) |
| 3.0x to 3.9x | 7 (7.8%) | 22 (16.7%) |
| 4.0x or more | 2 (2.2%) | 16 (12.1%) |
| Total | 90 (100.0%) | 132 (100.0%) |
Real Estate Taxes by Mortgage Status in Lecompton
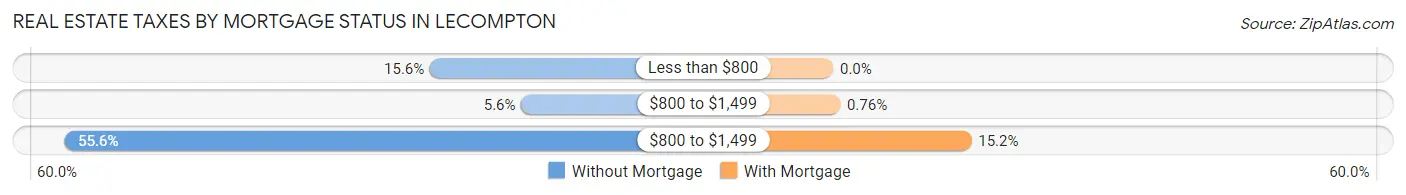
| Property Taxes | Without Mortgage | With Mortgage |
| Less than $800 | 14 (15.6%) | 0 (0.0%) |
| $800 to $1,499 | 5 (5.6%) | 1 (0.8%) |
| $800 to $1,499 | 50 (55.6%) | 20 (15.1%) |
| Total | 90 (100.0%) | 132 (100.0%) |
Health & Disability in Lecompton
Health Insurance Coverage by Age in Lecompton
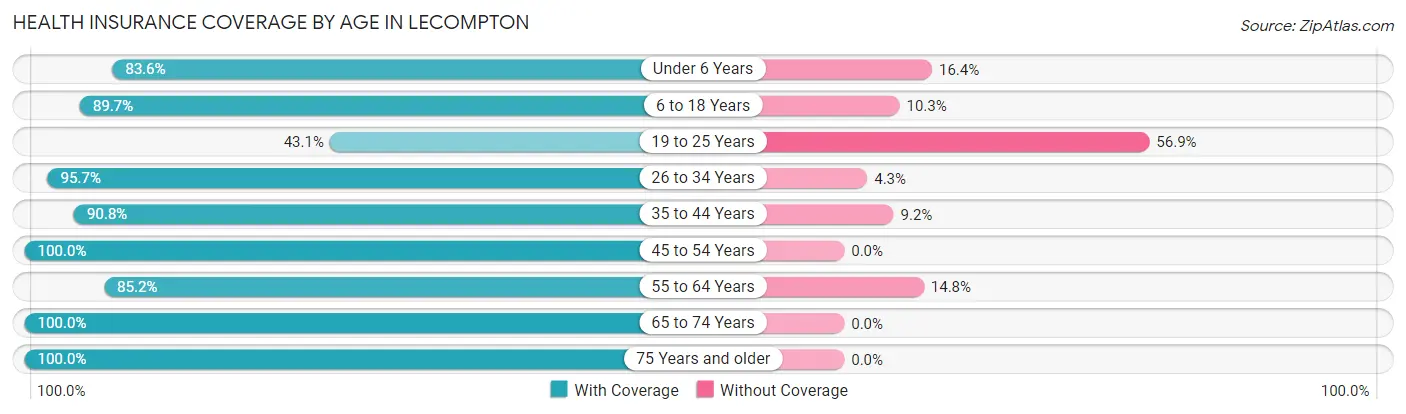
| Age Bracket | With Coverage | Without Coverage |
| Under 6 Years | 46 (83.6%) | 9 (16.4%) |
| 6 to 18 Years | 174 (89.7%) | 20 (10.3%) |
| 19 to 25 Years | 50 (43.1%) | 66 (56.9%) |
| 26 to 34 Years | 67 (95.7%) | 3 (4.3%) |
| 35 to 44 Years | 79 (90.8%) | 8 (9.2%) |
| 45 to 54 Years | 111 (100.0%) | 0 (0.0%) |
| 55 to 64 Years | 132 (85.2%) | 23 (14.8%) |
| 65 to 74 Years | 42 (100.0%) | 0 (0.0%) |
| 75 Years and older | 34 (100.0%) | 0 (0.0%) |
| Total | 735 (85.1%) | 129 (14.9%) |
Health Insurance Coverage by Citizenship Status in Lecompton
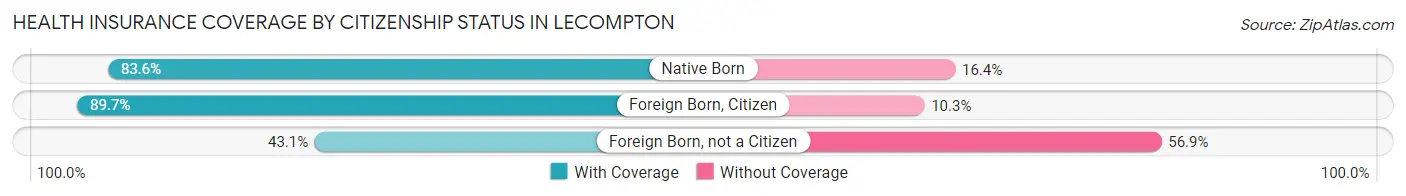
| Citizenship Status | With Coverage | Without Coverage |
| Native Born | 46 (83.6%) | 9 (16.4%) |
| Foreign Born, Citizen | 174 (89.7%) | 20 (10.3%) |
| Foreign Born, not a Citizen | 50 (43.1%) | 66 (56.9%) |
Health Insurance Coverage by Household Income in Lecompton
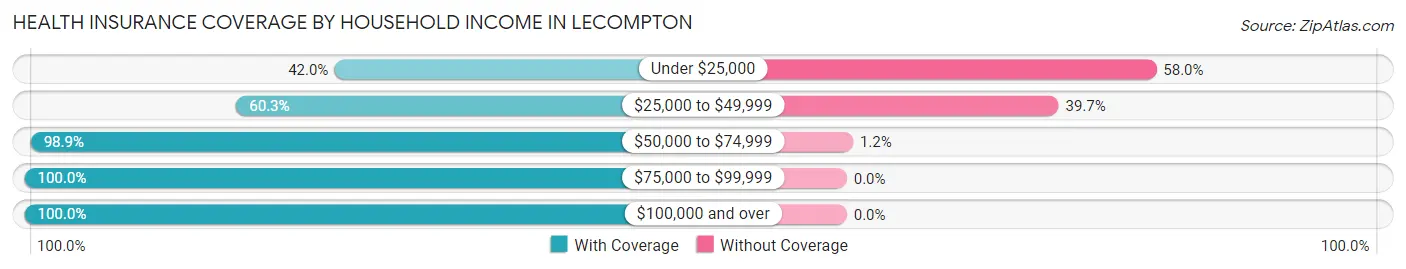
| Household Income | With Coverage | Without Coverage |
| Under $25,000 | 21 (42.0%) | 29 (58.0%) |
| $25,000 to $49,999 | 149 (60.3%) | 98 (39.7%) |
| $50,000 to $74,999 | 172 (98.9%) | 2 (1.1%) |
| $75,000 to $99,999 | 21 (100.0%) | 0 (0.0%) |
| $100,000 and over | 372 (100.0%) | 0 (0.0%) |
Public vs Private Health Insurance Coverage by Age in Lecompton
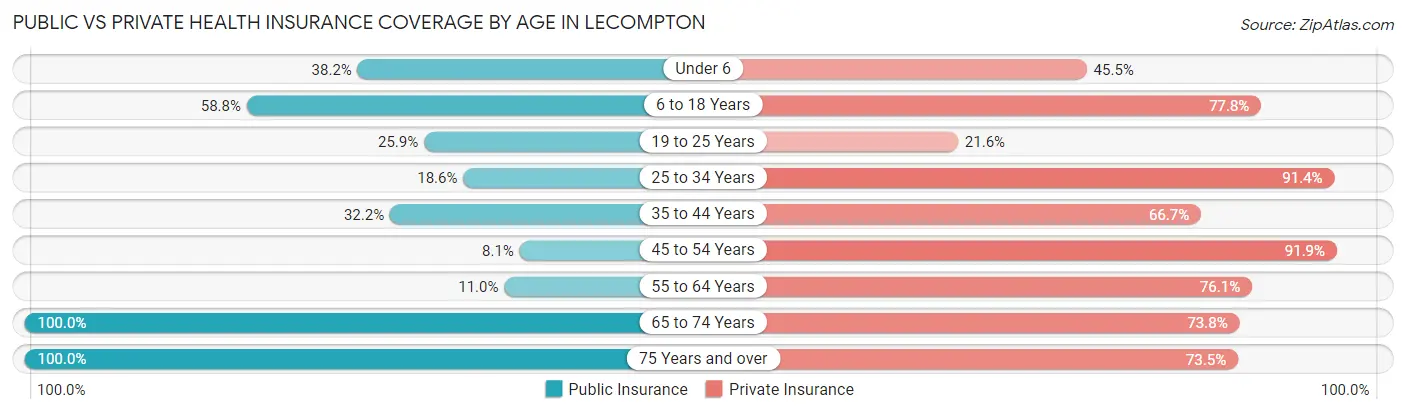
| Age Bracket | Public Insurance | Private Insurance |
| Under 6 | 21 (38.2%) | 25 (45.5%) |
| 6 to 18 Years | 114 (58.8%) | 151 (77.8%) |
| 19 to 25 Years | 30 (25.9%) | 25 (21.5%) |
| 25 to 34 Years | 13 (18.6%) | 64 (91.4%) |
| 35 to 44 Years | 28 (32.2%) | 58 (66.7%) |
| 45 to 54 Years | 9 (8.1%) | 102 (91.9%) |
| 55 to 64 Years | 17 (11.0%) | 118 (76.1%) |
| 65 to 74 Years | 42 (100.0%) | 31 (73.8%) |
| 75 Years and over | 34 (100.0%) | 25 (73.5%) |
| Total | 308 (35.6%) | 599 (69.3%) |
Disability Status by Sex by Age in Lecompton
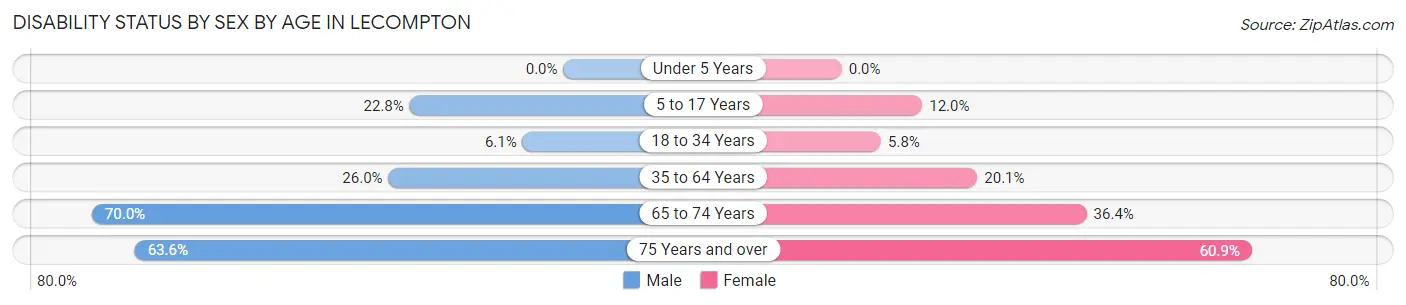
| Age Bracket | Male | Female |
| Under 5 Years | 0 (0.0%) | 0 (0.0%) |
| 5 to 17 Years | 21 (22.8%) | 11 (12.0%) |
| 18 to 34 Years | 6 (6.1%) | 6 (5.8%) |
| 35 to 64 Years | 53 (26.0%) | 30 (20.1%) |
| 65 to 74 Years | 14 (70.0%) | 8 (36.4%) |
| 75 Years and over | 7 (63.6%) | 14 (60.9%) |
Disability Class by Sex by Age in Lecompton
Disability Class: Hearing Difficulty
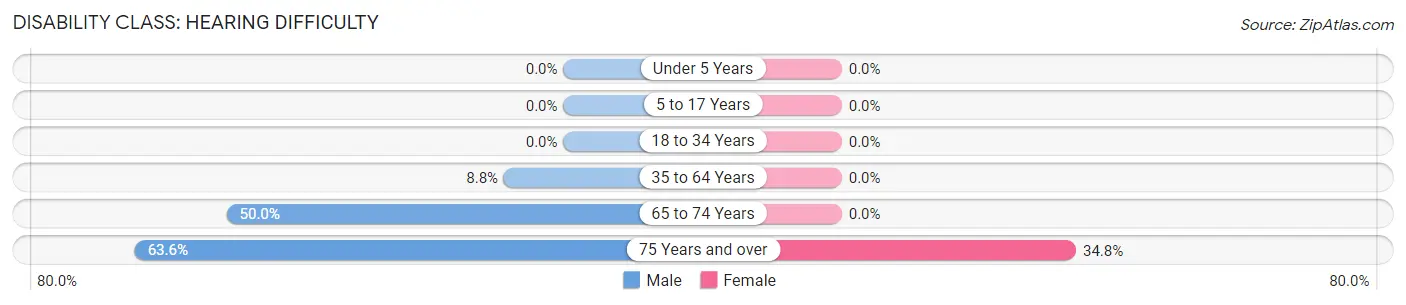
| Age Bracket | Male | Female |
| Under 5 Years | 0 (0.0%) | 0 (0.0%) |
| 5 to 17 Years | 0 (0.0%) | 0 (0.0%) |
| 18 to 34 Years | 0 (0.0%) | 0 (0.0%) |
| 35 to 64 Years | 18 (8.8%) | 0 (0.0%) |
| 65 to 74 Years | 10 (50.0%) | 0 (0.0%) |
| 75 Years and over | 7 (63.6%) | 8 (34.8%) |
Disability Class: Vision Difficulty
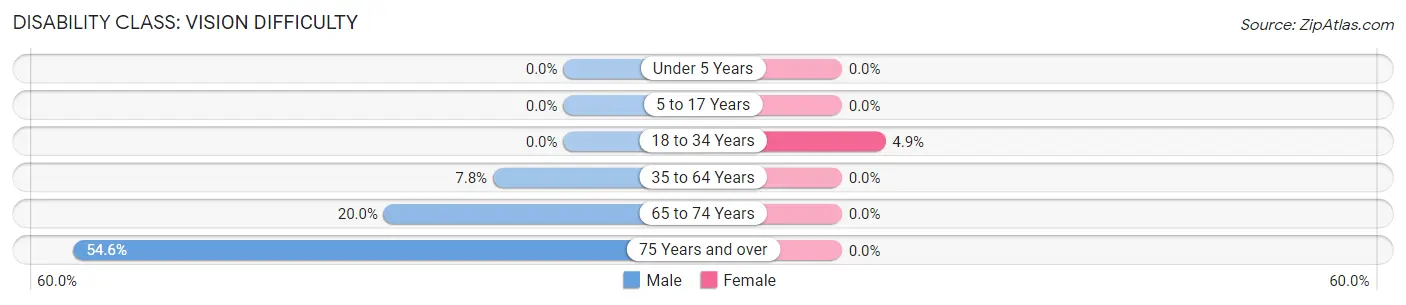
| Age Bracket | Male | Female |
| Under 5 Years | 0 (0.0%) | 0 (0.0%) |
| 5 to 17 Years | 0 (0.0%) | 0 (0.0%) |
| 18 to 34 Years | 0 (0.0%) | 5 (4.9%) |
| 35 to 64 Years | 16 (7.8%) | 0 (0.0%) |
| 65 to 74 Years | 4 (20.0%) | 0 (0.0%) |
| 75 Years and over | 6 (54.5%) | 0 (0.0%) |
Disability Class: Cognitive Difficulty
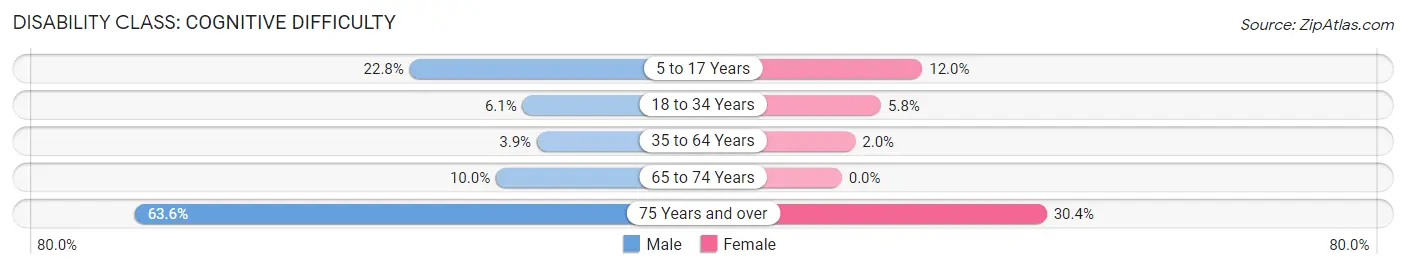
| Age Bracket | Male | Female |
| 5 to 17 Years | 21 (22.8%) | 11 (12.0%) |
| 18 to 34 Years | 6 (6.1%) | 6 (5.8%) |
| 35 to 64 Years | 8 (3.9%) | 3 (2.0%) |
| 65 to 74 Years | 2 (10.0%) | 0 (0.0%) |
| 75 Years and over | 7 (63.6%) | 7 (30.4%) |
Disability Class: Ambulatory Difficulty
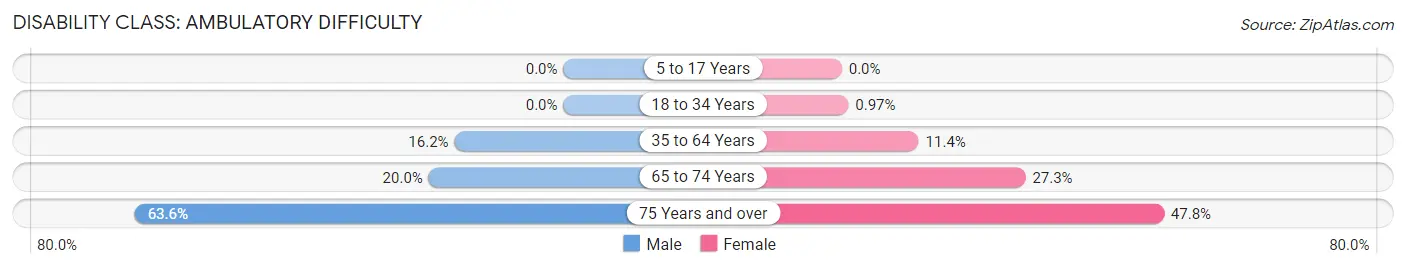
| Age Bracket | Male | Female |
| 5 to 17 Years | 0 (0.0%) | 0 (0.0%) |
| 18 to 34 Years | 0 (0.0%) | 1 (1.0%) |
| 35 to 64 Years | 33 (16.2%) | 17 (11.4%) |
| 65 to 74 Years | 4 (20.0%) | 6 (27.3%) |
| 75 Years and over | 7 (63.6%) | 11 (47.8%) |
Disability Class: Self-Care Difficulty
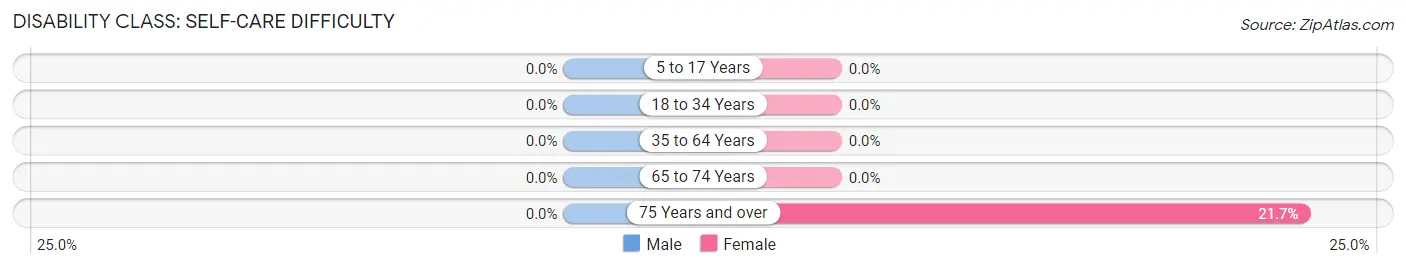
| Age Bracket | Male | Female |
| 5 to 17 Years | 0 (0.0%) | 0 (0.0%) |
| 18 to 34 Years | 0 (0.0%) | 0 (0.0%) |
| 35 to 64 Years | 0 (0.0%) | 0 (0.0%) |
| 65 to 74 Years | 0 (0.0%) | 0 (0.0%) |
| 75 Years and over | 0 (0.0%) | 5 (21.7%) |
Technology Access in Lecompton
Computing Device Access in Lecompton
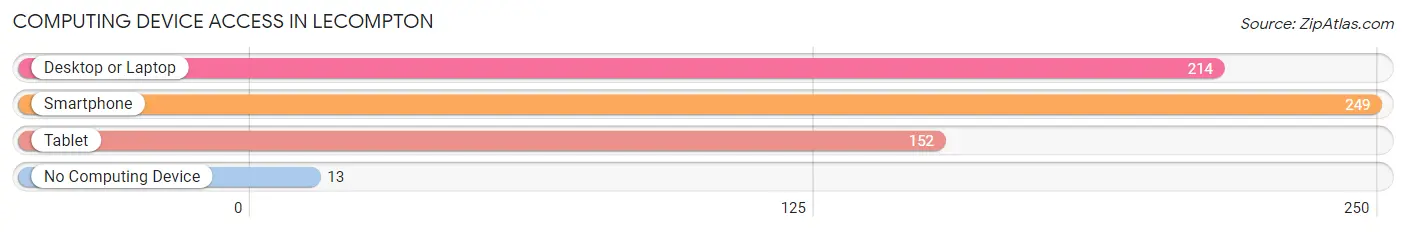
| Device Type | # Households | % Households |
| Desktop or Laptop | 214 | 78.7% |
| Smartphone | 249 | 91.5% |
| Tablet | 152 | 55.9% |
| No Computing Device | 13 | 4.8% |
| Total | 272 | 100.0% |
Internet Access in Lecompton
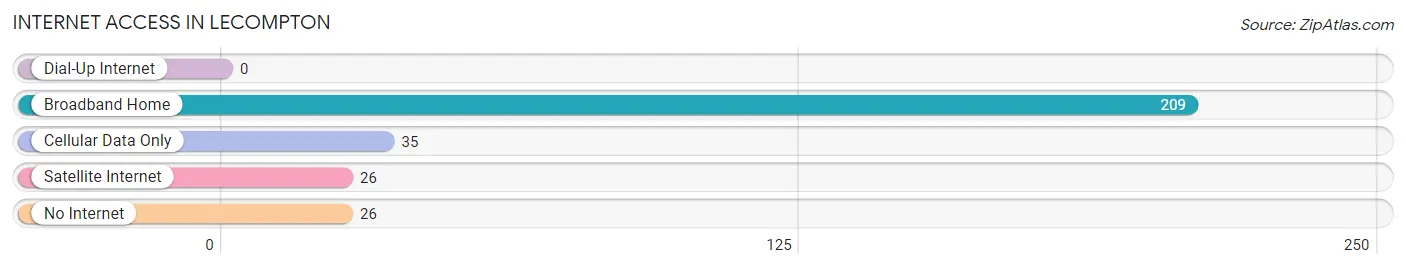
| Internet Type | # Households | % Households |
| Dial-Up Internet | 0 | 0.0% |
| Broadband Home | 209 | 76.8% |
| Cellular Data Only | 35 | 12.9% |
| Satellite Internet | 26 | 9.6% |
| No Internet | 26 | 9.6% |
| Total | 272 | 100.0% |
Lecompton Summary
Lecompton, Kansas is a small town located in Douglas County, Kansas, United States. It is situated on the banks of the Kansas River, about 15 miles west of Lawrence. The population was 645 at the 2010 census.
History
Lecompton was founded in 1854 by a group of settlers from Ohio, led by James M. Winchell. The town was named after the nearby Lecompte Creek, which was named after a French-Canadian trapper who had lived in the area. The town quickly became a center of pro-slavery politics in the Kansas Territory, and was the capital of the short-lived pro-slavery government of Kansas from 1855 to 1861. During this period, the town was the site of the Lecompton Constitution, a document that proposed the admission of Kansas as a slave state. The document was rejected by Congress, and the town's pro-slavery government was eventually overthrown by anti-slavery forces.
After the Civil War, Lecompton became a center of agriculture and industry. The town was home to several flour mills, a brickyard, a sawmill, and a furniture factory. The town also had a number of churches, including the First Presbyterian Church, which was founded in 1867.
Geography
Lecompton is located at 38°59'25" North, 95°30'45" West (38.990278, -95.5125). According to the United States Census Bureau, the town has a total area of 0.7 square miles (1.8 km2), all of it land.
Economy
The economy of Lecompton is largely based on agriculture and tourism. The town is home to several small businesses, including a grocery store, a hardware store, and a restaurant. The town also has a number of antique stores and art galleries.
Tourism is an important part of the local economy. The town is home to the Territorial Capital Museum, which is dedicated to the history of the town and the Kansas Territory. The museum is housed in the former home of James M. Winchell, the founder of Lecompton. The town is also home to the Lecompton Historical Society, which operates a number of historic sites in the area.
Demographics
As of the census of 2010, there were 645 people, 256 households, and 166 families residing in the town. The population density was 917.9 people per square mile (354.3/km2). There were 279 housing units at an average density of 397.1 per square mile (153.3/km2). The racial makeup of the town was 95.2% White, 0.2% African American, 0.9% Native American, 0.2% Asian, 0.2% Pacific Islander, 1.2% from other races, and 2.1% from two or more races. Hispanic or Latino of any race were 3.7% of the population.
There were 256 households, out of which 28.5% had children under the age of 18 living with them, 48.4% were married couples living together, 10.2% had a female householder with no husband present, and 36.7% were non-families. 32.8% of all households were made up of individuals, and 15.6% had someone living alone who was 65 years of age or older. The average household size was 2.35 and the average family size was 2.97.
In the town, the population was spread out, with 24.2% under the age of 18, 7.2% from 18 to 24, 24.2% from 25 to 44, 25.2% from 45 to 64, and 19.2% who were 65 years of age or older. The median age was 40 years. For every 100 females, there were 91.2 males. For every 100 females age 18 and over, there were 87.2 males.
The median income for a household in the town was $35,000, and the median income for a family was $41,250. Males had a median income of $30,000 versus $21,250 for females. The per capita income for the town was $17,845. About 8.2% of families and 10.2% of the population were below the poverty line, including 14.3% of those under age 18 and 8.3% of those age 65 or over.
Common Questions
What is Per Capita Income in Lecompton?
Per Capita income in Lecompton is $30,719.
What is the Median Family Income in Lecompton?
Median Family Income in Lecompton is $103,750.
What is the Median Household income in Lecompton?
Median Household Income in Lecompton is $67,813.
What is Income or Wage Gap in Lecompton?
Income or Wage Gap in Lecompton is 22.5%.
Women in Lecompton earn 77.5 cents for every dollar earned by a man.
What is Inequality or Gini Index in Lecompton?
Inequality or Gini Index in Lecompton is 0.38.
What is the Total Population of Lecompton?
Total Population of Lecompton is 864.
What is the Total Male Population of Lecompton?
Total Male Population of Lecompton is 440.
What is the Total Female Population of Lecompton?
Total Female Population of Lecompton is 424.
What is the Ratio of Males per 100 Females in Lecompton?
There are 103.77 Males per 100 Females in Lecompton.
What is the Ratio of Females per 100 Males in Lecompton?
There are 96.36 Females per 100 Males in Lecompton.
What is the Median Population Age in Lecompton?
Median Population Age in Lecompton is 34.0 Years.
What is the Average Family Size in Lecompton
Average Family Size in Lecompton is 3.7 People.
What is the Average Household Size in Lecompton
Average Household Size in Lecompton is 3.2 People.
How Large is the Labor Force in Lecompton?
There are 494 People in the Labor Forcein in Lecompton.
What is the Percentage of People in the Labor Force in Lecompton?
75.3% of People are in the Labor Force in Lecompton.
What is the Unemployment Rate in Lecompton?
Unemployment Rate in Lecompton is 5.3%.