Zip Codes with the Highest Percentage of Population Employed in Architecture & Engineering in Wichita, KS
RELATED REPORTS & OPTIONS
Architecture & Engineering
Wichita
Compare Zip Codes
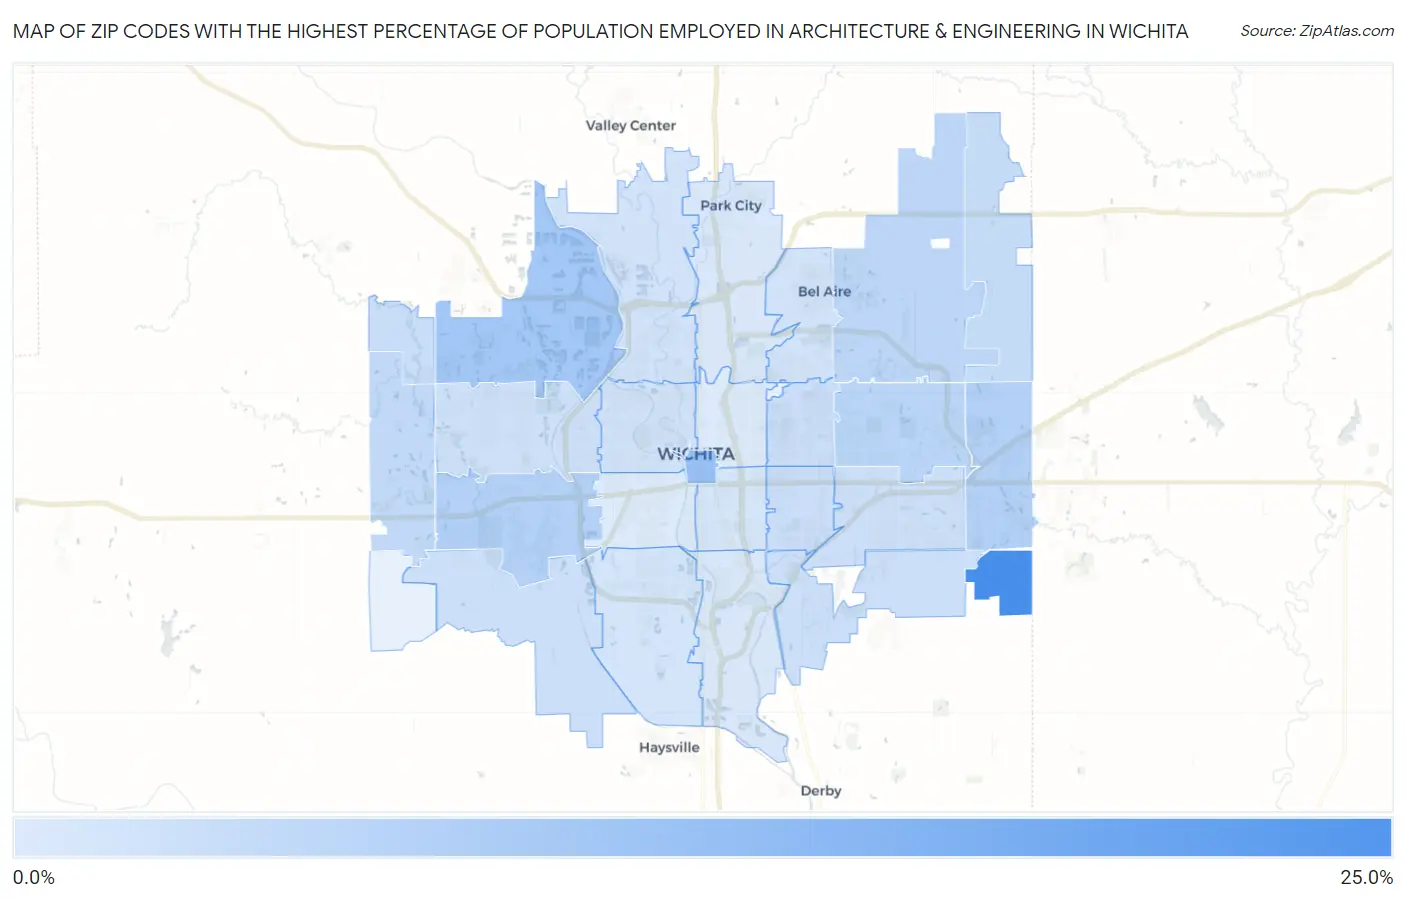
Map of Zip Codes with the Highest Percentage of Population Employed in Architecture & Engineering in Wichita
0.26%
22.0%
Zip Codes with the Highest Percentage of Population Employed in Architecture & Engineering in Wichita, KS
| Zip Code | % Employed | vs State | vs National | |
| 1. | 67232 | 22.0% | 2.0%(+20.0)#4 | 2.1%(+19.9)#85 |
| 2. | 67202 | 9.8% | 2.0%(+7.80)#7 | 2.1%(+7.70)#354 |
| 3. | 67205 | 8.1% | 2.0%(+6.07)#14 | 2.1%(+5.96)#550 |
| 4. | 67209 | 5.9% | 2.0%(+3.88)#27 | 2.1%(+3.77)#1,117 |
| 5. | 67230 | 5.8% | 2.0%(+3.79)#30 | 2.1%(+3.68)#1,165 |
| 6. | 67206 | 5.0% | 2.0%(+2.94)#38 | 2.1%(+2.83)#1,681 |
| 7. | 67226 | 4.6% | 2.0%(+2.59)#42 | 2.1%(+2.48)#1,998 |
| 8. | 67235 | 4.1% | 2.0%(+2.02)#54 | 2.1%(+1.92)#2,673 |
| 9. | 67228 | 3.3% | 2.0%(+1.24)#75 | 2.1%(+1.14)#4,240 |
| 10. | 67223 | 3.2% | 2.0%(+1.11)#79 | 2.1%(+1.00)#4,601 |
| 11. | 67208 | 2.7% | 2.0%(+0.694)#101 | 2.1%(+0.586)#6,018 |
| 12. | 67218 | 2.6% | 2.0%(+0.518)#112 | 2.1%(+0.411)#6,747 |
| 13. | 67215 | 2.5% | 2.0%(+0.479)#118 | 2.1%(+0.372)#6,907 |
| 14. | 67207 | 2.4% | 2.0%(+0.381)#123 | 2.1%(+0.273)#7,364 |
| 15. | 67210 | 2.4% | 2.0%(+0.336)#125 | 2.1%(+0.228)#7,581 |
| 16. | 67212 | 2.2% | 2.0%(+0.112)#143 | 2.1%(+0.005)#8,729 |
| 17. | 67203 | 1.9% | 2.0%(-0.120)#168 | 2.1%(-0.228)#10,098 |
| 18. | 67220 | 1.8% | 2.0%(-0.240)#175 | 2.1%(-0.347)#10,810 |
| 19. | 67204 | 1.7% | 2.0%(-0.328)#186 | 2.1%(-0.436)#11,400 |
| 20. | 67217 | 1.5% | 2.0%(-0.589)#226 | 2.1%(-0.697)#13,218 |
| 21. | 67211 | 1.2% | 2.0%(-0.844)#250 | 2.1%(-0.952)#15,098 |
| 22. | 67216 | 0.95% | 2.0%(-1.09)#289 | 2.1%(-1.20)#16,968 |
| 23. | 67219 | 0.79% | 2.0%(-1.25)#309 | 2.1%(-1.36)#18,182 |
| 24. | 67213 | 0.39% | 2.0%(-1.65)#368 | 2.1%(-1.76)#21,023 |
| 25. | 67214 | 0.26% | 2.0%(-1.78)#385 | 2.1%(-1.89)#21,771 |
1
Common Questions
What are the Top 10 Zip Codes with the Highest Percentage of Population Employed in Architecture & Engineering in Wichita, KS?
Top 10 Zip Codes with the Highest Percentage of Population Employed in Architecture & Engineering in Wichita, KS are:
What zip code has the Highest Percentage of Population Employed in Architecture & Engineering in Wichita, KS?
67232 has the Highest Percentage of Population Employed in Architecture & Engineering in Wichita, KS with 22.0%.
What is the Percentage of Population Employed in Architecture & Engineering in Wichita, KS?
Percentage of Population Employed in Architecture & Engineering in Wichita is 2.7%.
What is the Percentage of Population Employed in Architecture & Engineering in Kansas?
Percentage of Population Employed in Architecture & Engineering in Kansas is 2.0%.
What is the Percentage of Population Employed in Architecture & Engineering in the United States?
Percentage of Population Employed in Architecture & Engineering in the United States is 2.1%.