Franklin, KS Map & Demographics
Franklin Map
Franklin Overview
$19,613
PER CAPITA INCOME
$57,400
AVG FAMILY INCOME
$56,450
AVG HOUSEHOLD INCOME
0.37
INEQUALITY / GINI INDEX
774
TOTAL POPULATION
377
MALE POPULATION
397
FEMALE POPULATION
94.96
MALES / 100 FEMALES
105.31
FEMALES / 100 MALES
24.0
MEDIAN AGE
3.7
AVG FAMILY SIZE
3.5
AVG HOUSEHOLD SIZE
419
LABOR FORCE [ PEOPLE ]
77.7%
PERCENT IN LABOR FORCE
8.6%
UNEMPLOYMENT RATE
Franklin Zip Codes
Franklin Area Codes
Income in Franklin
Income Overview in Franklin
Per Capita Income in Franklin is $19,613, while median incomes of families and households are $57,400 and $56,450 respectively.
| Characteristic | Number | Measure |
| Per Capita Income | 774 | $19,613 |
| Median Family Income | 204 | $57,400 |
| Mean Family Income | 204 | $56,261 |
| Median Household Income | 223 | $56,450 |
| Mean Household Income | 223 | $52,491 |
| Income Deficit | 204 | $0 |
| Wage / Income Gap (%) | 774 | 0.00% |
| Wage / Income Gap ($) | 774 | 100.00¢ per $1 |
| Gini / Inequality Index | 774 | 0.37 |
Earnings by Sex in Franklin
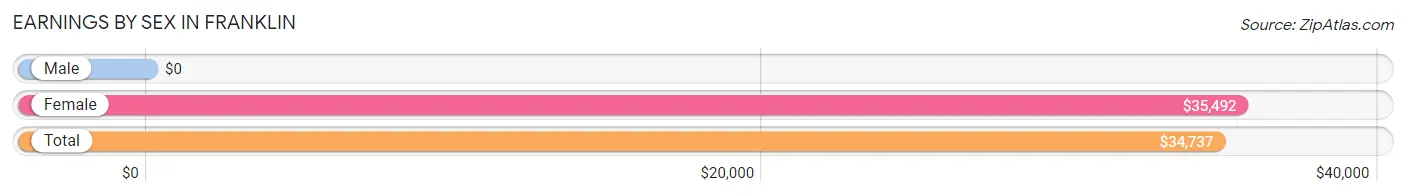
| Sex | Number | Average Earnings |
| Male | 249 (58.2%) | $0 |
| Female | 179 (41.8%) | $35,492 |
| Total | 428 (100.0%) | $34,737 |
Earnings by Sex by Income Bracket in Franklin
The most common earnings brackets in Franklin are $45,000 to $49,999 for men (88 | 35.3%) and $12,500 to $14,999 for women (56 | 31.3%).
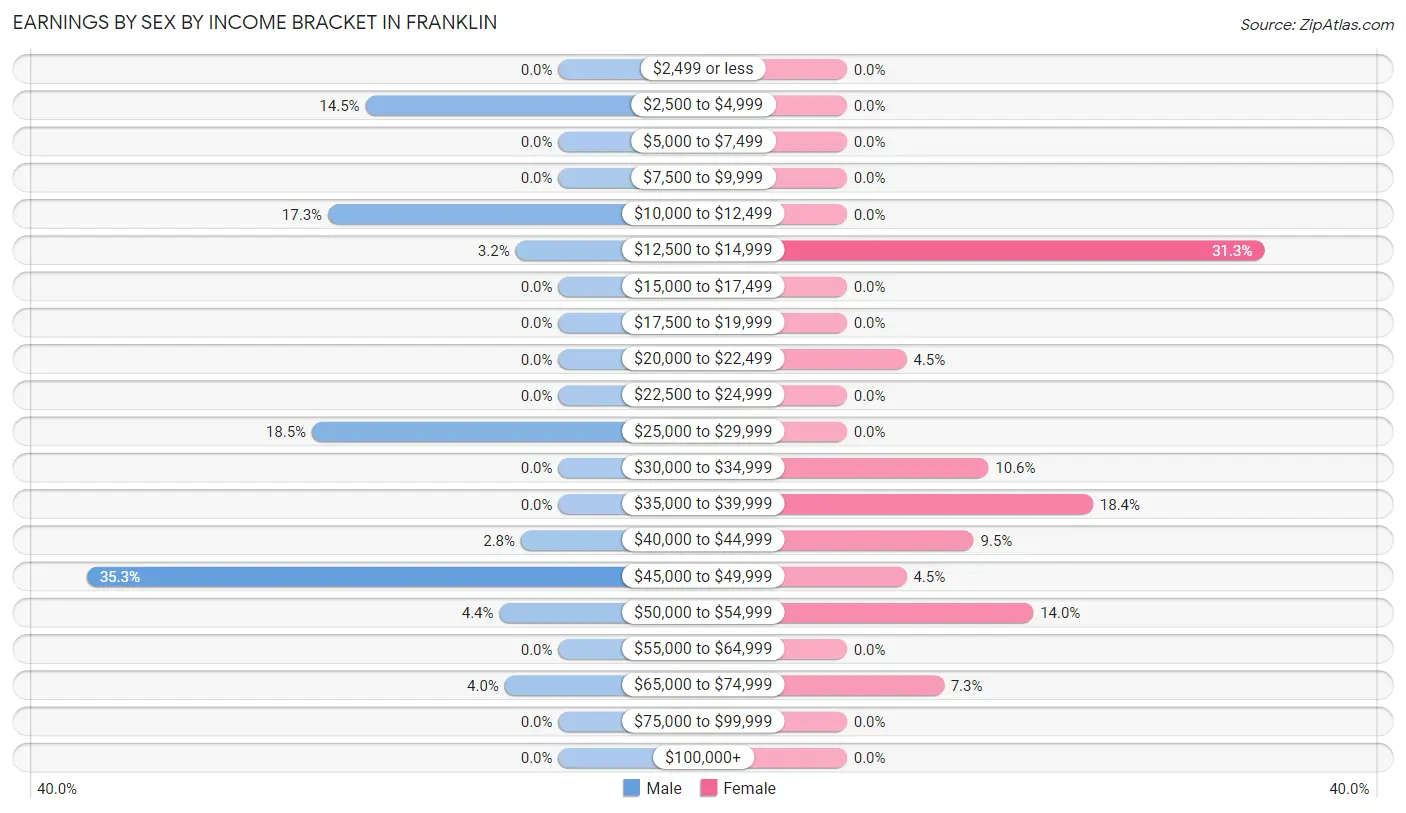
| Income | Male | Female |
| $2,499 or less | 0 (0.0%) | 0 (0.0%) |
| $2,500 to $4,999 | 36 (14.5%) | 0 (0.0%) |
| $5,000 to $7,499 | 0 (0.0%) | 0 (0.0%) |
| $7,500 to $9,999 | 0 (0.0%) | 0 (0.0%) |
| $10,000 to $12,499 | 43 (17.3%) | 0 (0.0%) |
| $12,500 to $14,999 | 8 (3.2%) | 56 (31.3%) |
| $15,000 to $17,499 | 0 (0.0%) | 0 (0.0%) |
| $17,500 to $19,999 | 0 (0.0%) | 0 (0.0%) |
| $20,000 to $22,499 | 0 (0.0%) | 8 (4.5%) |
| $22,500 to $24,999 | 0 (0.0%) | 0 (0.0%) |
| $25,000 to $29,999 | 46 (18.5%) | 0 (0.0%) |
| $30,000 to $34,999 | 0 (0.0%) | 19 (10.6%) |
| $35,000 to $39,999 | 0 (0.0%) | 33 (18.4%) |
| $40,000 to $44,999 | 7 (2.8%) | 17 (9.5%) |
| $45,000 to $49,999 | 88 (35.3%) | 8 (4.5%) |
| $50,000 to $54,999 | 11 (4.4%) | 25 (14.0%) |
| $55,000 to $64,999 | 0 (0.0%) | 0 (0.0%) |
| $65,000 to $74,999 | 10 (4.0%) | 13 (7.3%) |
| $75,000 to $99,999 | 0 (0.0%) | 0 (0.0%) |
| $100,000+ | 0 (0.0%) | 0 (0.0%) |
| Total | 249 (100.0%) | 179 (100.0%) |
Earnings by Sex by Educational Attainment in Franklin
Average earnings in Franklin are $28,560 for men and $34,737 for women, a difference of 17.8%. Men with an educational attainment of college or associate's degree enjoy the highest average annual earnings of $40,536, while those with high school diploma education earn the least with $11,773. Women with an educational attainment of high school diploma earn the most with the average annual earnings of $45,938, while those with bachelor's degree education have the smallest earnings of $36,458.
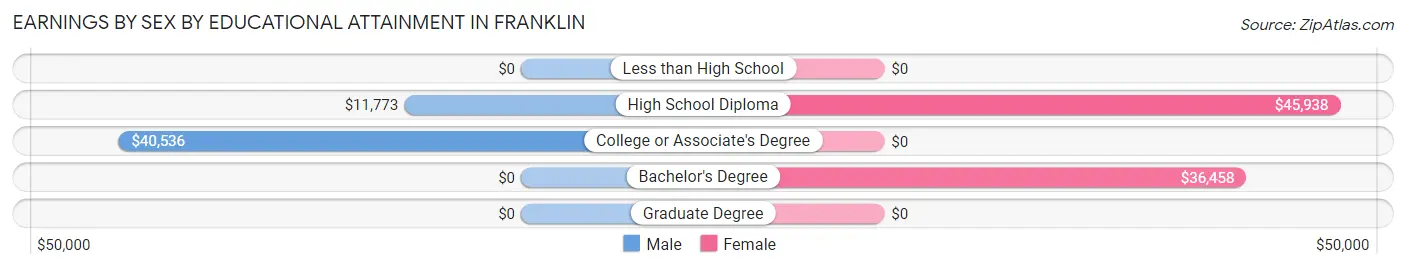
| Educational Attainment | Male Income | Female Income |
| Less than High School | - | - |
| High School Diploma | $11,773 | $45,938 |
| College or Associate's Degree | $40,536 | $0 |
| Bachelor's Degree | - | - |
| Graduate Degree | - | - |
| Total | $28,560 | $34,737 |
Family Income in Franklin
Family Income Brackets in Franklin
According to the Franklin family income data, there are 95 families falling into the $50,000 to $74,999 income range, which is the most common income bracket and makes up 46.6% of all families.
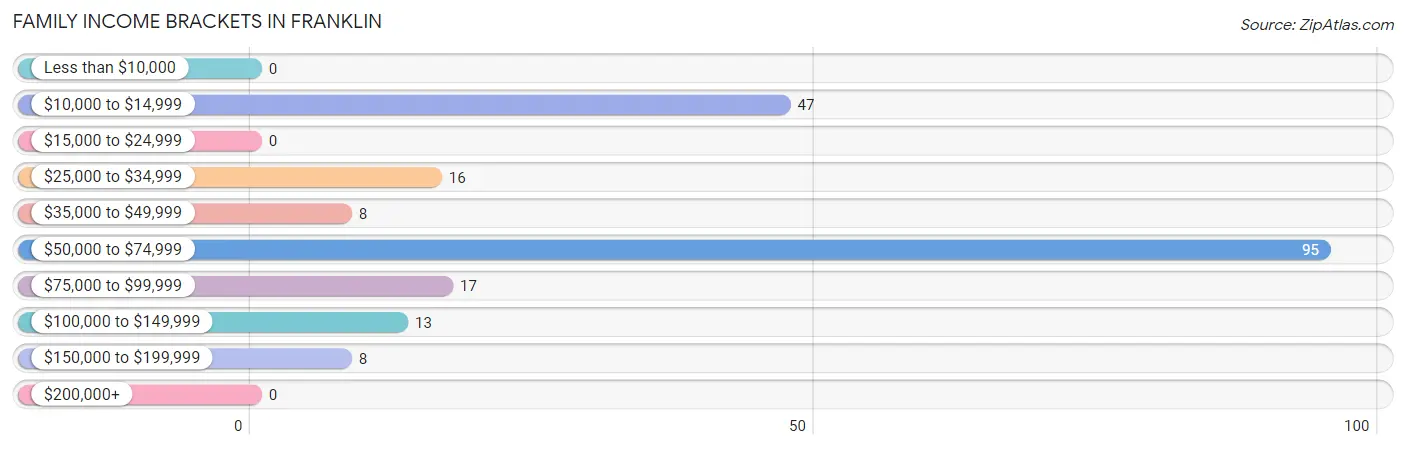
| Income Bracket | # Families | % Families |
| Less than $10,000 | 0 | 0.0% |
| $10,000 to $14,999 | 47 | 23.0% |
| $15,000 to $24,999 | 0 | 0.0% |
| $25,000 to $34,999 | 16 | 7.8% |
| $35,000 to $49,999 | 8 | 3.9% |
| $50,000 to $74,999 | 95 | 46.6% |
| $75,000 to $99,999 | 17 | 8.3% |
| $100,000 to $149,999 | 13 | 6.4% |
| $150,000 to $199,999 | 8 | 3.9% |
| $200,000+ | 0 | 0.0% |
Family Income by Famaliy Size in Franklin
2-person families (109 | 53.4%) account for the highest median family income in Franklin with $60,708 per family, while 2-person families (109 | 53.4%) have the highest median income of $30,354 per family member.
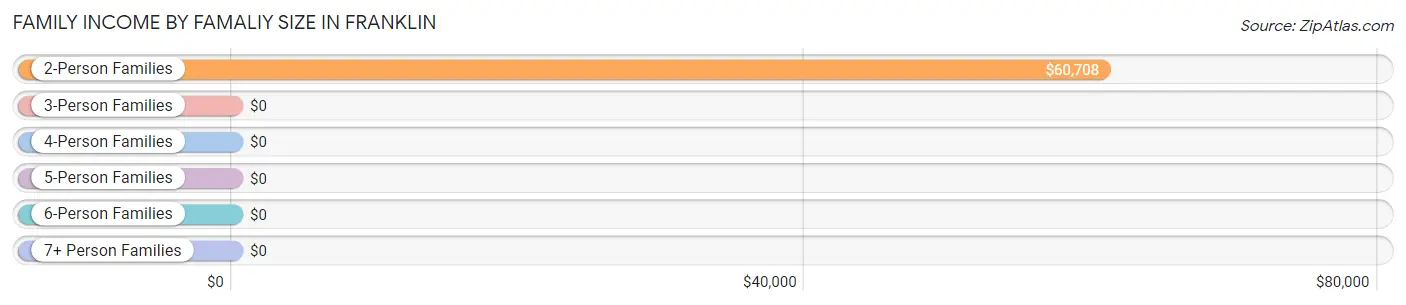
| Income Bracket | # Families | Median Income |
| 2-Person Families | 109 (53.4%) | $60,708 |
| 3-Person Families | 24 (11.8%) | $0 |
| 4-Person Families | 48 (23.5%) | $0 |
| 5-Person Families | 13 (6.4%) | $0 |
| 6-Person Families | 0 (0.0%) | $0 |
| 7+ Person Families | 10 (4.9%) | $0 |
| Total | 204 (100.0%) | $57,400 |
Family Income by Number of Earners in Franklin
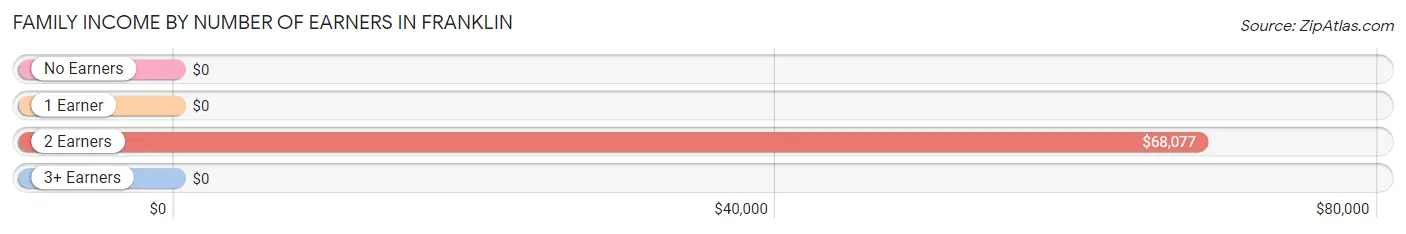
| Number of Earners | # Families | Median Income |
| No Earners | 6 (2.9%) | $0 |
| 1 Earner | 82 (40.2%) | $0 |
| 2 Earners | 116 (56.9%) | $68,077 |
| 3+ Earners | 0 (0.0%) | $0 |
| Total | 204 (100.0%) | $57,400 |
Household Income in Franklin
Household Income Brackets in Franklin
With 95 households falling in the category, the $50,000 to $74,999 income range is the most frequent in Franklin, accounting for 42.6% of all households.
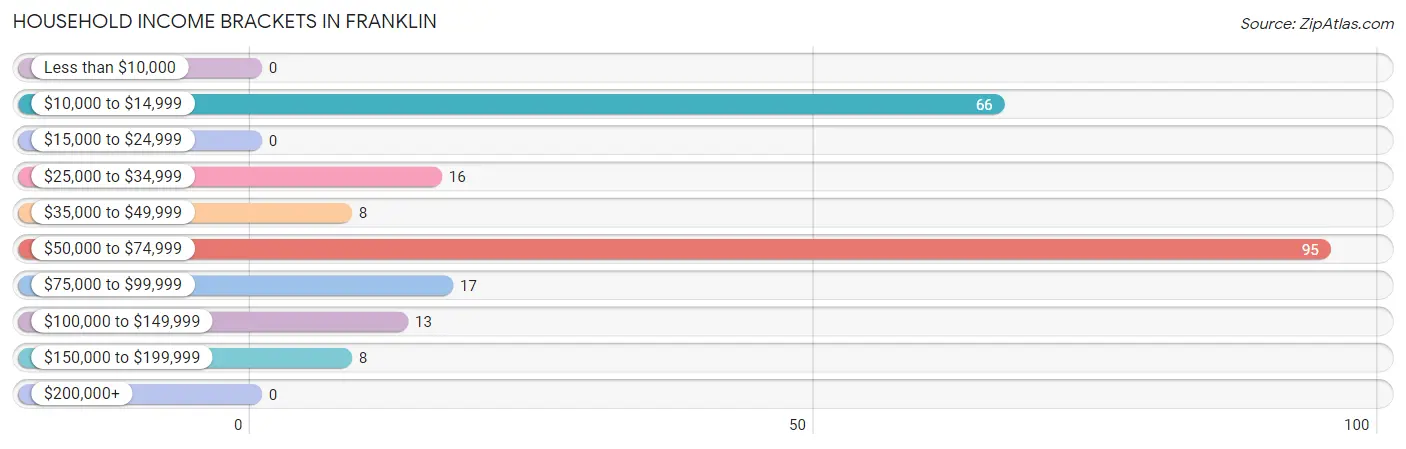
| Income Bracket | # Households | % Households |
| Less than $10,000 | 0 | 0.0% |
| $10,000 to $14,999 | 66 | 29.6% |
| $15,000 to $24,999 | 0 | 0.0% |
| $25,000 to $34,999 | 16 | 7.2% |
| $35,000 to $49,999 | 8 | 3.6% |
| $50,000 to $74,999 | 95 | 42.6% |
| $75,000 to $99,999 | 17 | 7.6% |
| $100,000 to $149,999 | 13 | 5.8% |
| $150,000 to $199,999 | 8 | 3.6% |
| $200,000+ | 0 | 0.0% |
Household Income by Householder Age in Franklin
The median household income in Franklin is $56,450, with the highest median household income of $60,500 found in the 45 to 64 years age bracket for the primary householder. A total of 114 households (51.1%) fall into this category. Meanwhile, the 15 to 24 years age bracket for the primary householder has the lowest median household income of $0, with 17 households (7.6%) in this group.
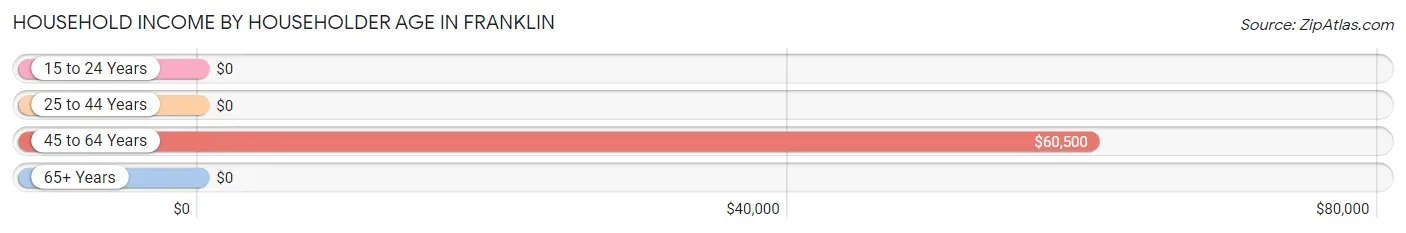
| Income Bracket | # Households | Median Income |
| 15 to 24 Years | 17 (7.6%) | $0 |
| 25 to 44 Years | 84 (37.7%) | $0 |
| 45 to 64 Years | 114 (51.1%) | $60,500 |
| 65+ Years | 8 (3.6%) | $0 |
| Total | 223 (100.0%) | $56,450 |
Poverty in Franklin
Income Below Poverty by Sex and Age in Franklin
With 31.8% poverty level for males and 49.1% for females among the residents of Franklin, 25 to 34 year old males and 6 to 11 year old females are the most vulnerable to poverty, with 43 males (100.0%) and 40 females (100.0%) in their respective age groups living below the poverty level.
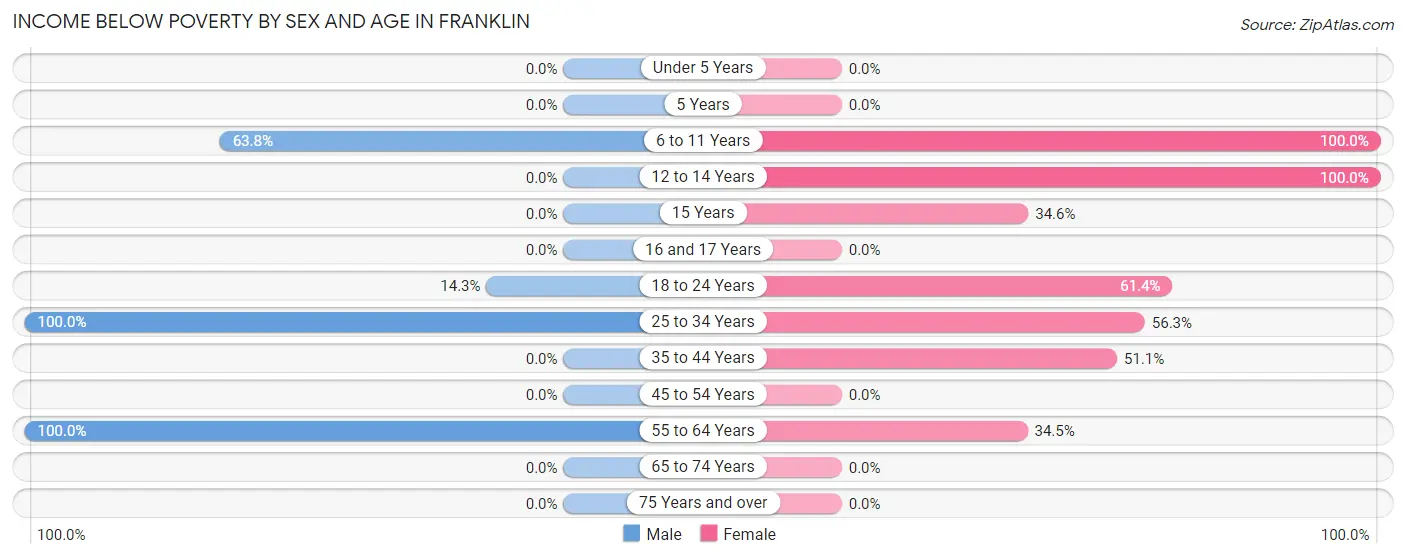
| Age Bracket | Male | Female |
| Under 5 Years | 0 (0.0%) | 0 (0.0%) |
| 5 Years | 0 (0.0%) | 0 (0.0%) |
| 6 to 11 Years | 44 (63.8%) | 40 (100.0%) |
| 12 to 14 Years | 0 (0.0%) | 43 (100.0%) |
| 15 Years | 0 (0.0%) | 9 (34.6%) |
| 16 and 17 Years | 0 (0.0%) | 0 (0.0%) |
| 18 to 24 Years | 18 (14.3%) | 27 (61.4%) |
| 25 to 34 Years | 43 (100.0%) | 9 (56.2%) |
| 35 to 44 Years | 0 (0.0%) | 47 (51.1%) |
| 45 to 54 Years | 0 (0.0%) | 0 (0.0%) |
| 55 to 64 Years | 15 (100.0%) | 20 (34.5%) |
| 65 to 74 Years | 0 (0.0%) | 0 (0.0%) |
| 75 Years and over | 0 (0.0%) | 0 (0.0%) |
| Total | 120 (31.8%) | 195 (49.1%) |
Income Above Poverty by Sex and Age in Franklin
According to the poverty statistics in Franklin, males aged 12 to 14 years and females aged under 5 years are the age groups that are most secure financially, with 100.0% of males and 100.0% of females in these age groups living above the poverty line.
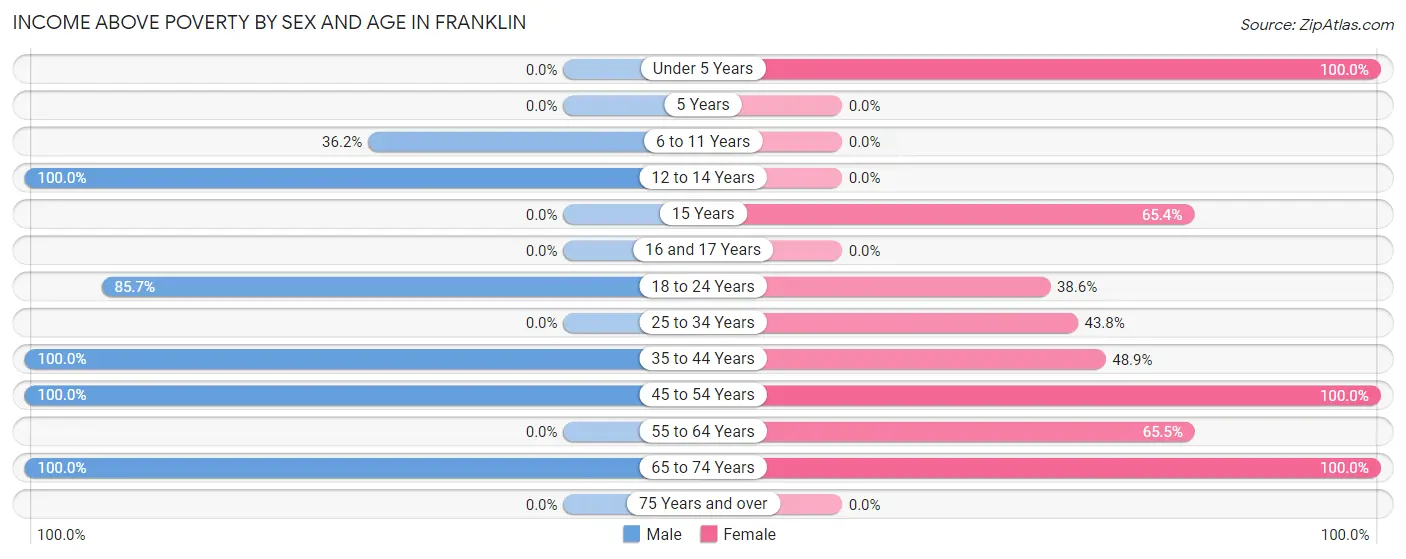
| Age Bracket | Male | Female |
| Under 5 Years | 0 (0.0%) | 32 (100.0%) |
| 5 Years | 0 (0.0%) | 0 (0.0%) |
| 6 to 11 Years | 25 (36.2%) | 0 (0.0%) |
| 12 to 14 Years | 25 (100.0%) | 0 (0.0%) |
| 15 Years | 0 (0.0%) | 17 (65.4%) |
| 16 and 17 Years | 0 (0.0%) | 0 (0.0%) |
| 18 to 24 Years | 108 (85.7%) | 17 (38.6%) |
| 25 to 34 Years | 0 (0.0%) | 7 (43.8%) |
| 35 to 44 Years | 37 (100.0%) | 45 (48.9%) |
| 45 to 54 Years | 53 (100.0%) | 39 (100.0%) |
| 55 to 64 Years | 0 (0.0%) | 38 (65.5%) |
| 65 to 74 Years | 9 (100.0%) | 7 (100.0%) |
| 75 Years and over | 0 (0.0%) | 0 (0.0%) |
| Total | 257 (68.2%) | 202 (50.9%) |
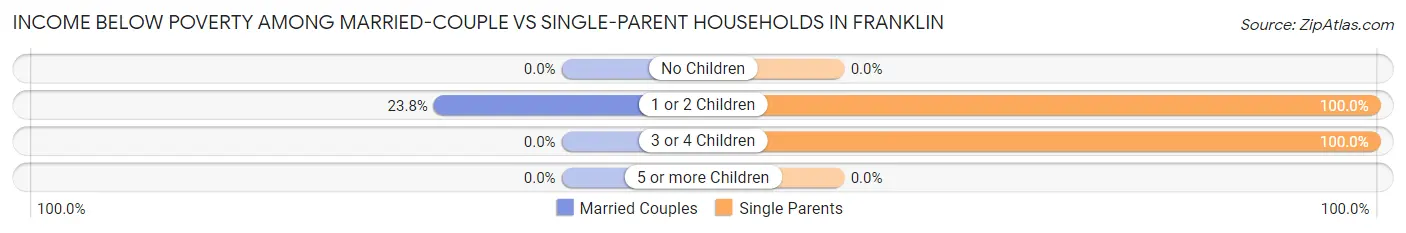
Income Below Poverty Among Married-Couple Families in Franklin
The poverty statistics for married-couple families in Franklin show that 8.2% or 10 of the total 122 families live below the poverty line. Families with 1 or 2 children have the highest poverty rate of 23.8%, comprising of 10 families. On the other hand, families with no children have the lowest poverty rate of 0.0%, which includes 0 families.
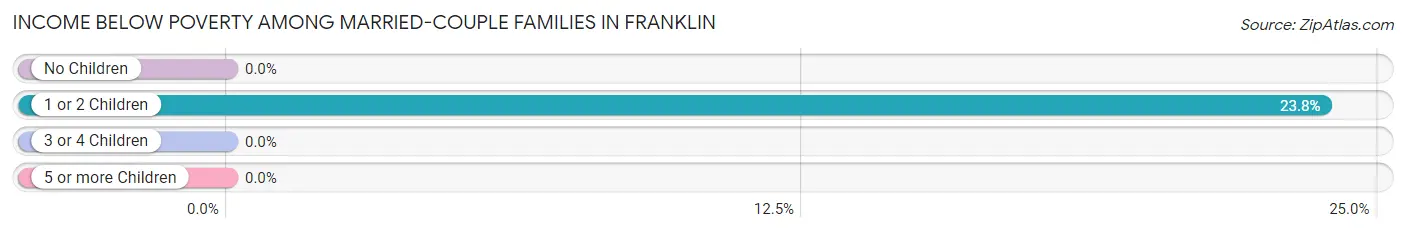
| Children | Above Poverty | Below Poverty |
| No Children | 67 (100.0%) | 0 (0.0%) |
| 1 or 2 Children | 32 (76.2%) | 10 (23.8%) |
| 3 or 4 Children | 13 (100.0%) | 0 (0.0%) |
| 5 or more Children | 0 (0.0%) | 0 (0.0%) |
| Total | 112 (91.8%) | 10 (8.2%) |
Income Below Poverty Among Single-Parent Households in Franklin
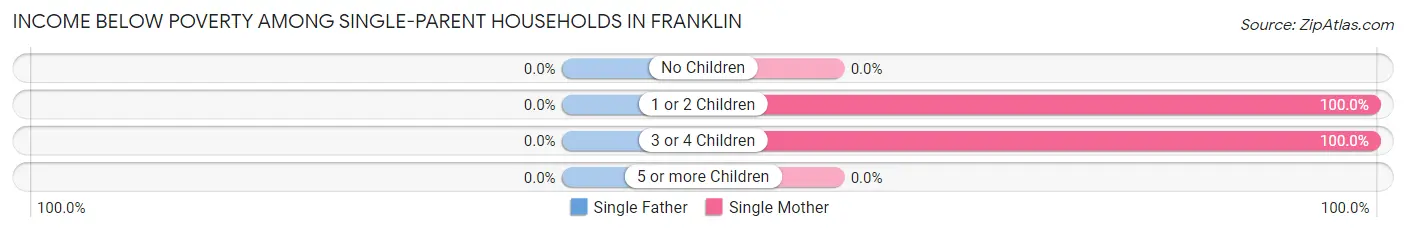
| Children | Single Father | Single Mother |
| No Children | 0 (0.0%) | 0 (0.0%) |
| 1 or 2 Children | 0 (0.0%) | 7 (100.0%) |
| 3 or 4 Children | 0 (0.0%) | 40 (100.0%) |
| 5 or more Children | 0 (0.0%) | 0 (0.0%) |
| Total | 0 (0.0%) | 47 (57.3%) |
Income Below Poverty Among Married-Couple vs Single-Parent Households in Franklin
The poverty data for Franklin shows that 10 of the married-couple family households (8.2%) and 47 of the single-parent households (57.3%) are living below the poverty level. Within the married-couple family households, those with 1 or 2 children have the highest poverty rate, with 10 households (23.8%) falling below the poverty line. Among the single-parent households, those with 1 or 2 children have the highest poverty rate, with 7 household (100.0%) living below poverty.
| Children | Married-Couple Families | Single-Parent Households |
| No Children | 0 (0.0%) | 0 (0.0%) |
| 1 or 2 Children | 10 (23.8%) | 7 (100.0%) |
| 3 or 4 Children | 0 (0.0%) | 40 (100.0%) |
| 5 or more Children | 0 (0.0%) | 0 (0.0%) |
| Total | 10 (8.2%) | 47 (57.3%) |
Race in Franklin
The most populous races in Franklin are White / Caucasian (767 | 99.1%), and Two or more Races (7 | 0.9%).
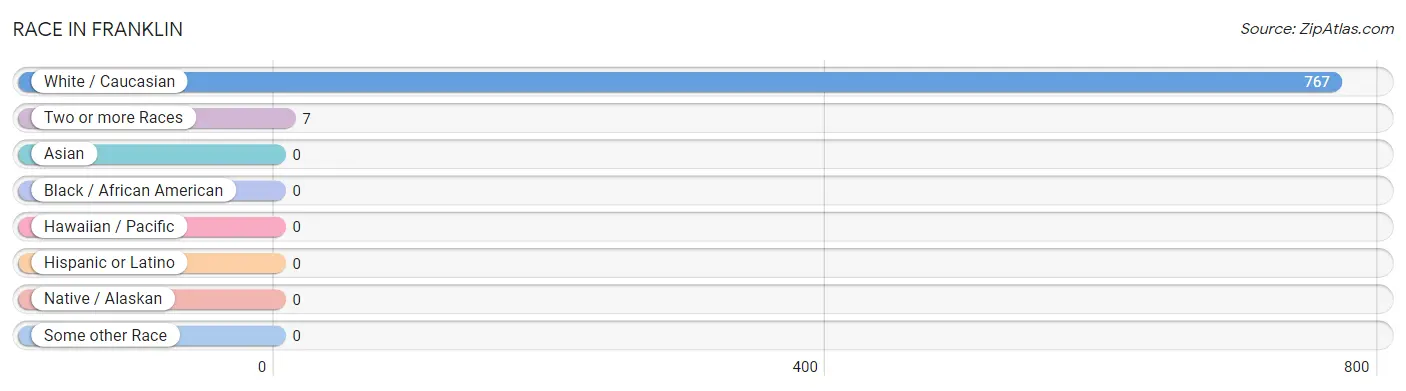
| Race | # Population | % Population |
| Asian | 0 | 0.0% |
| Black / African American | 0 | 0.0% |
| Hawaiian / Pacific | 0 | 0.0% |
| Hispanic or Latino | 0 | 0.0% |
| Native / Alaskan | 0 | 0.0% |
| White / Caucasian | 767 | 99.1% |
| Two or more Races | 7 | 0.9% |
| Some other Race | 0 | 0.0% |
| Total | 774 | 100.0% |
Ancestry in Franklin
The most populous ancestries reported in Franklin are German (174 | 22.5%), Italian (120 | 15.5%), Scottish (115 | 14.9%), Irish (65 | 8.4%), and English (60 | 7.7%), together accounting for 69.0% of all Franklin residents.
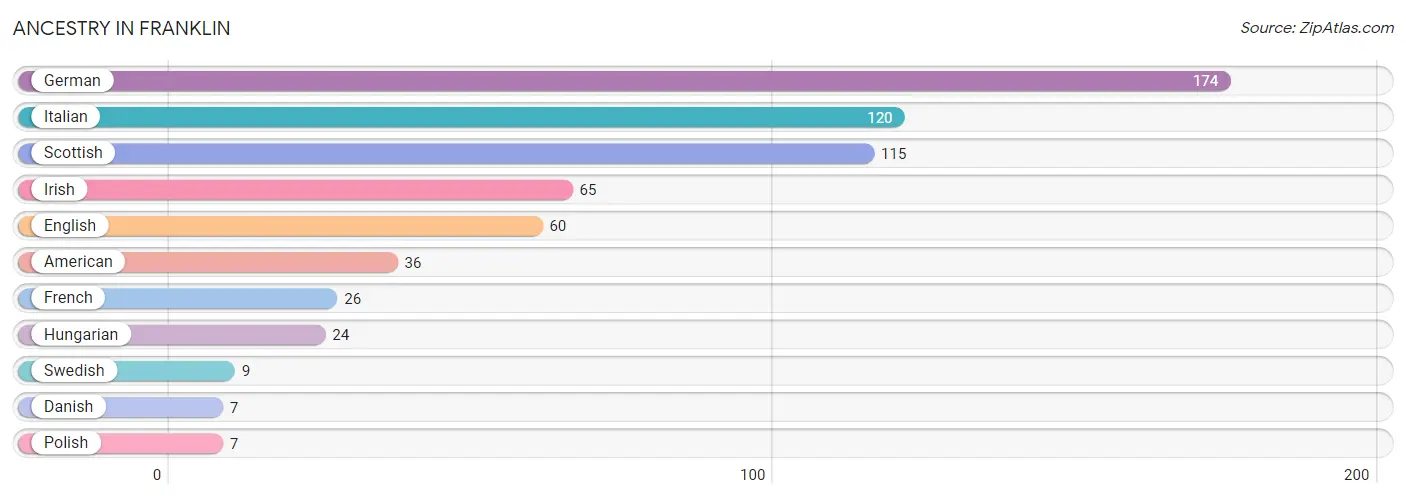
| Ancestry | # Population | % Population |
| American | 36 | 4.6% |
| Danish | 7 | 0.9% |
| English | 60 | 7.7% |
| French | 26 | 3.4% |
| German | 174 | 22.5% |
| Hungarian | 24 | 3.1% |
| Irish | 65 | 8.4% |
| Italian | 120 | 15.5% |
| Polish | 7 | 0.9% |
| Scottish | 115 | 14.9% |
| Swedish | 9 | 1.2% | View All 11 Rows |
Immigrants in Franklin

| Immigration Origin | # Population | % Population | View All 0 Rows |
Sex and Age in Franklin
Sex and Age in Franklin
The most populous age groups in Franklin are 20 to 24 Years (108 | 28.6%) for men and 10 to 14 Years (76 | 19.1%) for women.
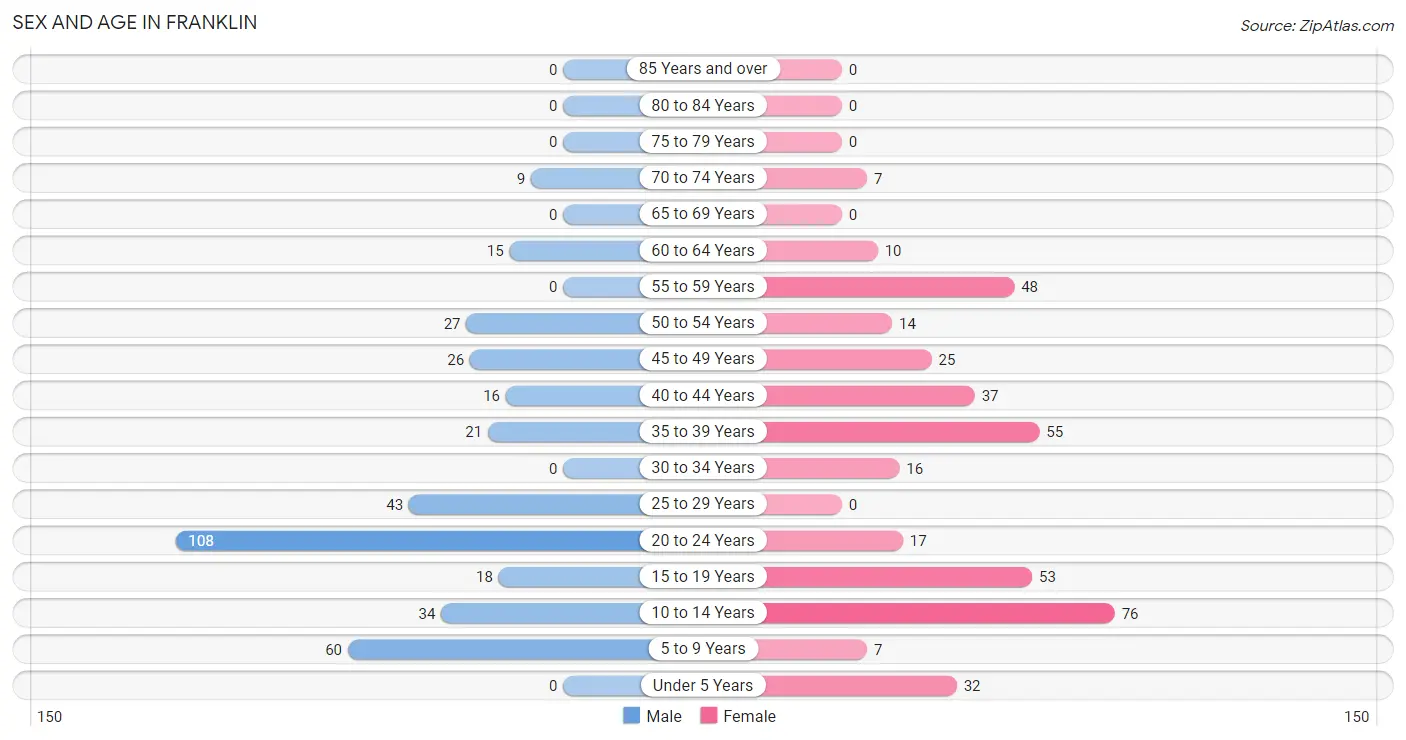
| Age Bracket | Male | Female |
| Under 5 Years | 0 (0.0%) | 32 (8.1%) |
| 5 to 9 Years | 60 (15.9%) | 7 (1.8%) |
| 10 to 14 Years | 34 (9.0%) | 76 (19.1%) |
| 15 to 19 Years | 18 (4.8%) | 53 (13.4%) |
| 20 to 24 Years | 108 (28.6%) | 17 (4.3%) |
| 25 to 29 Years | 43 (11.4%) | 0 (0.0%) |
| 30 to 34 Years | 0 (0.0%) | 16 (4.0%) |
| 35 to 39 Years | 21 (5.6%) | 55 (13.9%) |
| 40 to 44 Years | 16 (4.2%) | 37 (9.3%) |
| 45 to 49 Years | 26 (6.9%) | 25 (6.3%) |
| 50 to 54 Years | 27 (7.2%) | 14 (3.5%) |
| 55 to 59 Years | 0 (0.0%) | 48 (12.1%) |
| 60 to 64 Years | 15 (4.0%) | 10 (2.5%) |
| 65 to 69 Years | 0 (0.0%) | 0 (0.0%) |
| 70 to 74 Years | 9 (2.4%) | 7 (1.8%) |
| 75 to 79 Years | 0 (0.0%) | 0 (0.0%) |
| 80 to 84 Years | 0 (0.0%) | 0 (0.0%) |
| 85 Years and over | 0 (0.0%) | 0 (0.0%) |
| Total | 377 (100.0%) | 397 (100.0%) |
Families and Households in Franklin
Median Family Size in Franklin
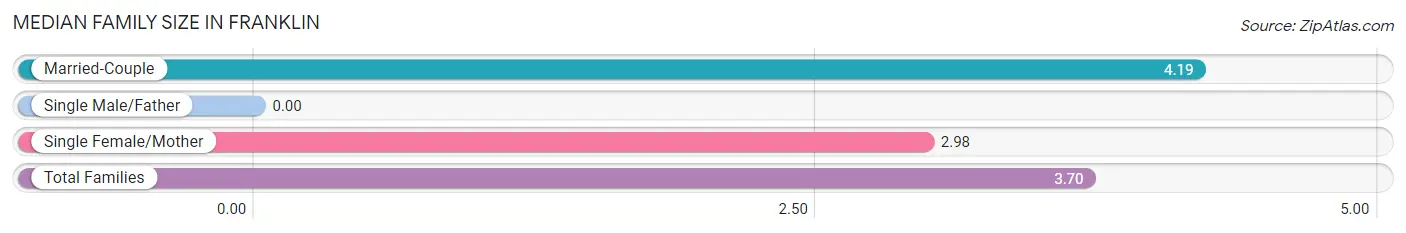
| Family Type | # Families | Family Size |
| Married-Couple | 122 (59.8%) | 4.19 |
| Single Male/Father | 0 (0.0%) | - |
| Single Female/Mother | 82 (40.2%) | 2.98 |
| Total Families | 204 (100.0%) | 3.70 |
Median Household Size in Franklin
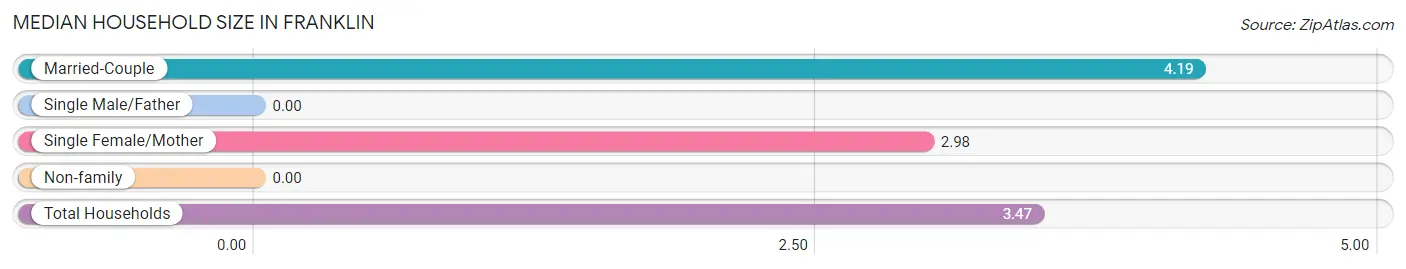
| Household Type | # Households | Household Size |
| Married-Couple | 122 (54.7%) | 4.19 |
| Single Male/Father | 0 (0.0%) | - |
| Single Female/Mother | 82 (36.8%) | 2.98 |
| Non-family | 19 (8.5%) | - |
| Total Households | 223 (100.0%) | 3.47 |
Household Size by Marriage Status in Franklin
Out of a total of 223 households in Franklin, 204 (91.5%) are family households, while 19 (8.5%) are nonfamily households. The most numerous type of family households are 2-person households, comprising 109, and the most common type of nonfamily households are 1-person households, comprising 19.
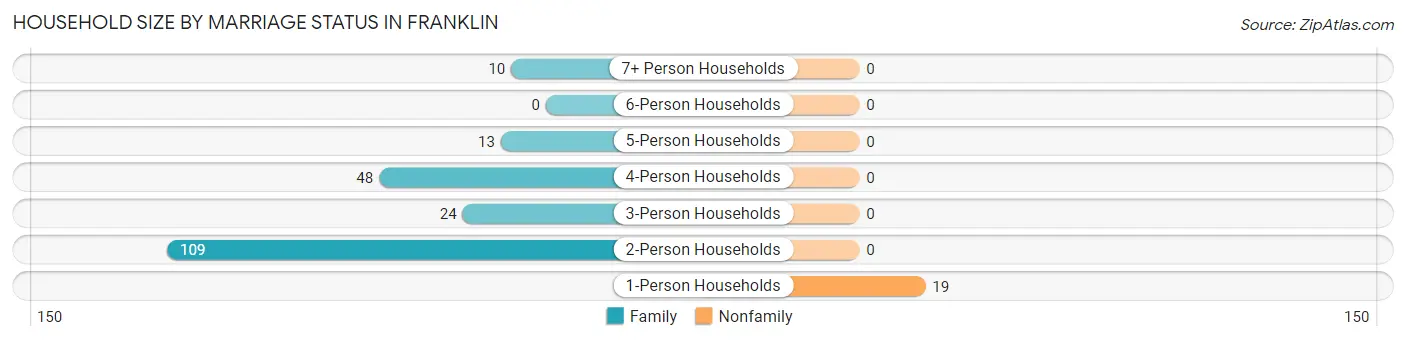
| Household Size | Family Households | Nonfamily Households |
| 1-Person Households | - | 19 (8.5%) |
| 2-Person Households | 109 (48.9%) | 0 (0.0%) |
| 3-Person Households | 24 (10.8%) | 0 (0.0%) |
| 4-Person Households | 48 (21.5%) | 0 (0.0%) |
| 5-Person Households | 13 (5.8%) | 0 (0.0%) |
| 6-Person Households | 0 (0.0%) | 0 (0.0%) |
| 7+ Person Households | 10 (4.5%) | 0 (0.0%) |
| Total | 204 (91.5%) | 19 (8.5%) |
Female Fertility in Franklin
Fertility by Age in Franklin
| Age Bracket | Women with Births | Births / 1,000 Women |
| 15 to 19 years | 0 (0.0%) | 0.0 |
| 20 to 34 years | 0 (0.0%) | 0.0 |
| 35 to 50 years | 0 (0.0%) | 0.0 |
| Total | 0 (0.0%) | 0.0 |
Fertility by Age by Marriage Status in Franklin
| Age Bracket | Married | Unmarried |
| 15 to 19 years | 0 (0.0%) | 0 (0.0%) |
| 20 to 34 years | 0 (0.0%) | 0 (0.0%) |
| 35 to 50 years | 0 (0.0%) | 0 (0.0%) |
| Total | 0 (0.0%) | 0 (0.0%) |
Fertility by Education in Franklin
| Educational Attainment | Women with Births | Births / 1,000 Women |
| Less than High School | 0 (0.0%) | 0.0 |
| High School Diploma | 0 (0.0%) | 0.0 |
| College or Associate's Degree | 0 (0.0%) | 0.0 |
| Bachelor's Degree | 0 (0.0%) | 0.0 |
| Graduate Degree | 0 (0.0%) | 0.0 |
| Total | 0 (0.0%) | 0.0 |
Fertility by Education by Marriage Status in Franklin
| Educational Attainment | Married | Unmarried |
| Less than High School | 0 (0.0%) | 0 (0.0%) |
| High School Diploma | 0 (0.0%) | 0 (0.0%) |
| College or Associate's Degree | 0 (0.0%) | 0 (0.0%) |
| Bachelor's Degree | 0 (0.0%) | 0 (0.0%) |
| Graduate Degree | 0 (0.0%) | 0 (0.0%) |
| Total | 0 (0.0%) | 0 (0.0%) |
Employment Characteristics in Franklin
Employment by Class of Employer in Franklin
Among the 383 employed individuals in Franklin, private company employees (232 | 60.6%), local government employees (81 | 21.1%), and state government employees (26 | 6.8%) make up the most common classes of employment.
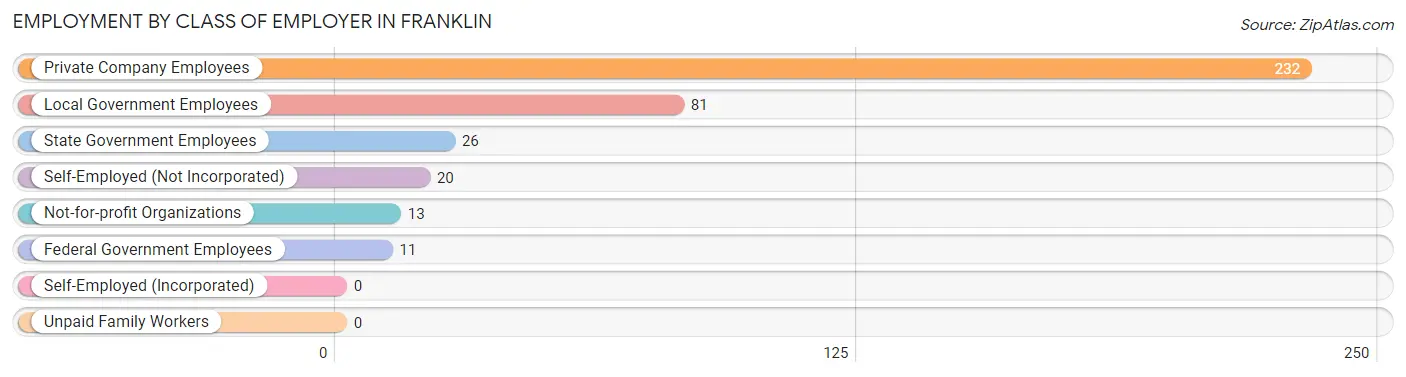
| Employer Class | # Employees | % Employees |
| Private Company Employees | 232 | 60.6% |
| Self-Employed (Incorporated) | 0 | 0.0% |
| Self-Employed (Not Incorporated) | 20 | 5.2% |
| Not-for-profit Organizations | 13 | 3.4% |
| Local Government Employees | 81 | 21.1% |
| State Government Employees | 26 | 6.8% |
| Federal Government Employees | 11 | 2.9% |
| Unpaid Family Workers | 0 | 0.0% |
| Total | 383 | 100.0% |
Employment Status by Age in Franklin
According to the labor force statistics for Franklin, out of the total population over 16 years of age (539), 77.7% or 419 individuals are in the labor force, with 8.6% or 36 of them unemployed. The age group with the highest labor force participation rate is 20 to 24 years, with 100.0% or 125 individuals in the labor force. Within the labor force, the 20 to 24 years age range has the highest percentage of unemployed individuals, with 28.8% or 36 of them being unemployed.
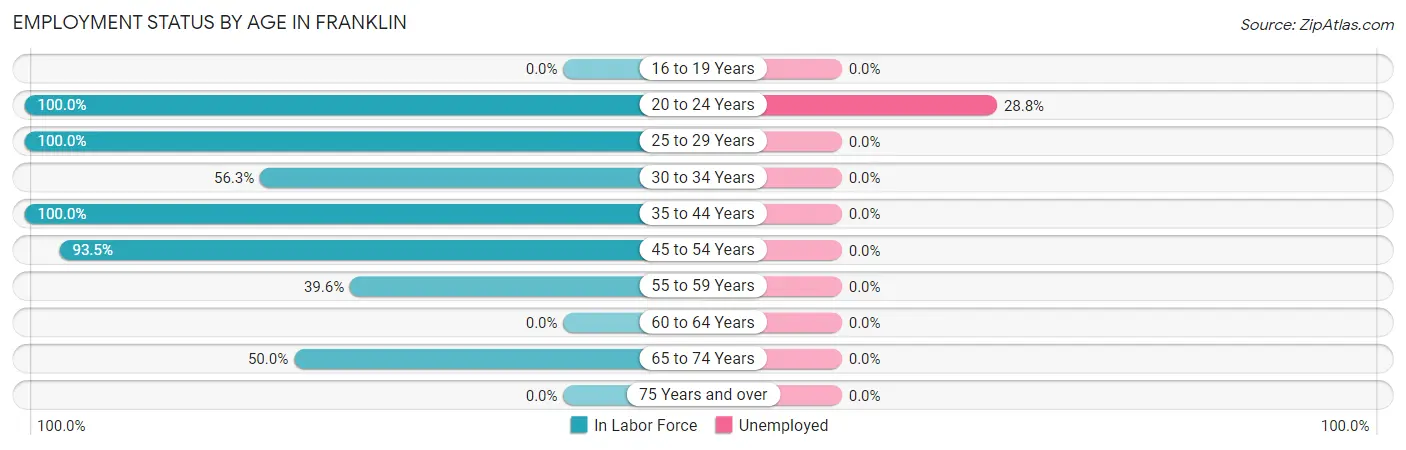
| Age Bracket | In Labor Force | Unemployed |
| 16 to 19 Years | 0 (0.0%) | 0 (0.0%) |
| 20 to 24 Years | 125 (100.0%) | 36 (28.8%) |
| 25 to 29 Years | 43 (100.0%) | 0 (0.0%) |
| 30 to 34 Years | 9 (56.3%) | 0 (0.0%) |
| 35 to 44 Years | 129 (100.0%) | 0 (0.0%) |
| 45 to 54 Years | 86 (93.5%) | 0 (0.0%) |
| 55 to 59 Years | 19 (39.6%) | 0 (0.0%) |
| 60 to 64 Years | 0 (0.0%) | 0 (0.0%) |
| 65 to 74 Years | 8 (50.0%) | 0 (0.0%) |
| 75 Years and over | 0 (0.0%) | 0 (0.0%) |
| Total | 419 (77.7%) | 36 (8.6%) |
Employment Status by Educational Attainment in Franklin
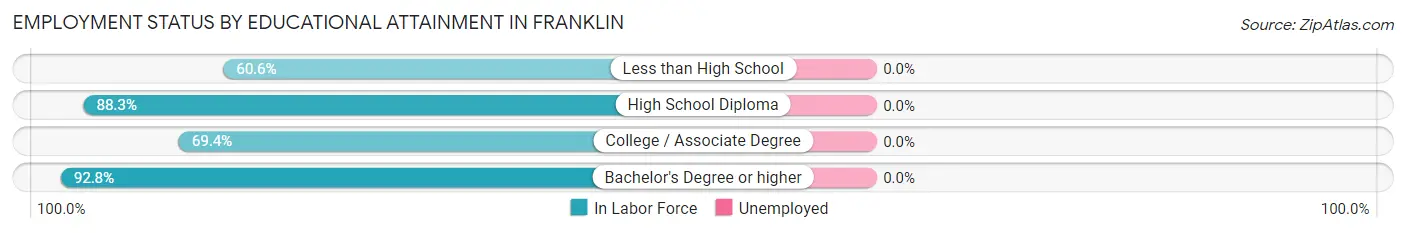
| Educational Attainment | In Labor Force | Unemployed |
| Less than High School | 40 (60.6%) | 0 (0.0%) |
| High School Diploma | 113 (88.3%) | 0 (0.0%) |
| College / Associate Degree | 43 (69.4%) | 0 (0.0%) |
| Bachelor's Degree or higher | 90 (92.8%) | 0 (0.0%) |
| Total | 286 (81.0%) | 0 (0.0%) |
Employment Occupations by Sex in Franklin
Management, Business, Science and Arts Occupations
The most common Management, Business, Science and Arts occupations in Franklin are Community & Social Service (93 | 24.3%), Education Instruction & Library (93 | 24.3%), Health Diagnosing & Treating (37 | 9.7%), Management (20 | 5.2%), and Computers, Engineering & Science (16 | 4.2%).
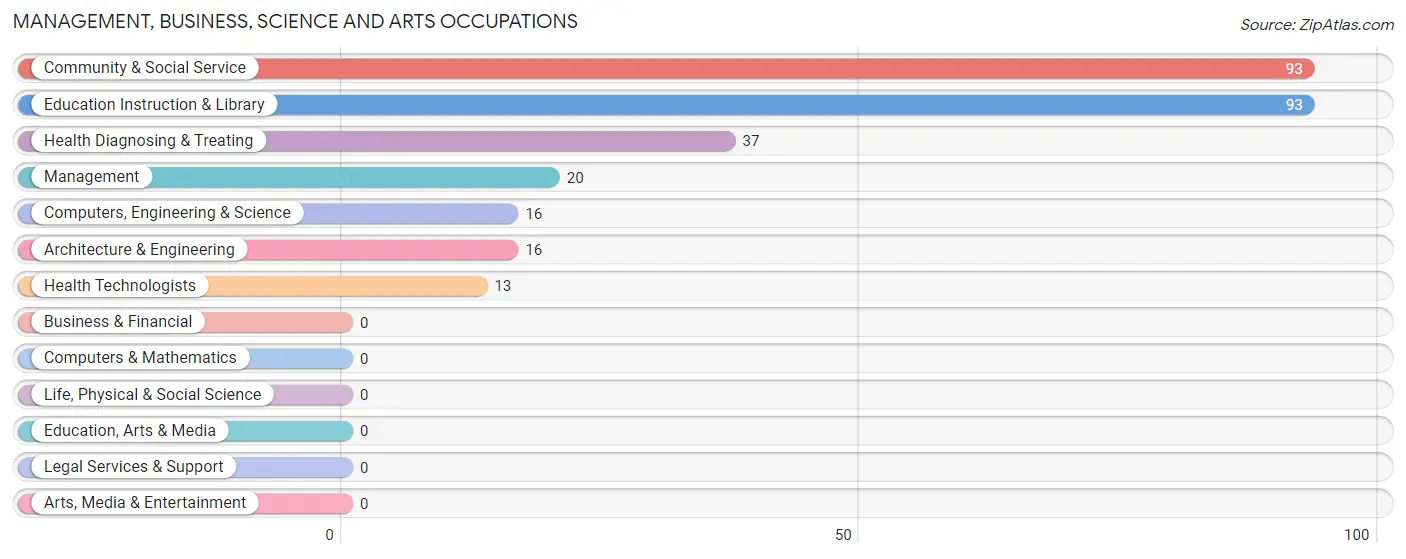
Management, Business, Science and Arts Occupations by Sex
Within the Management, Business, Science and Arts occupations in Franklin, the most male-oriented occupations are Management (100.0%), Computers, Engineering & Science (100.0%), and Architecture & Engineering (100.0%), while the most female-oriented occupations are Health Diagnosing & Treating (100.0%), Health Technologists (100.0%), and Community & Social Service (60.2%).
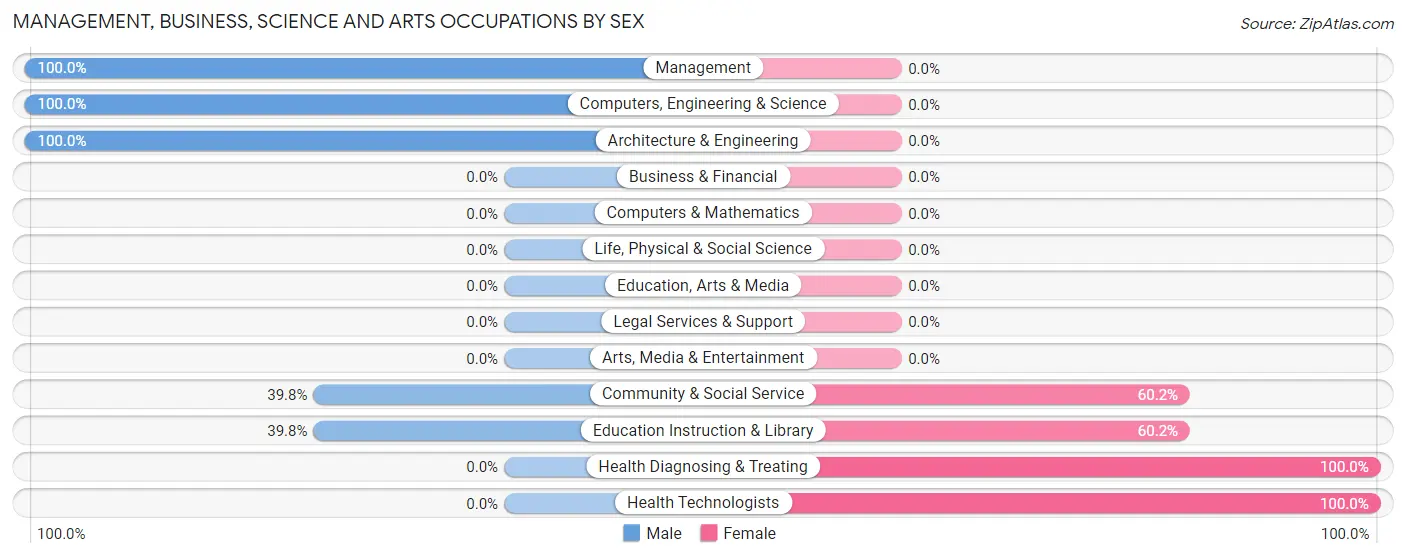
| Occupation | Male | Female |
| Management | 20 (100.0%) | 0 (0.0%) |
| Business & Financial | 0 (0.0%) | 0 (0.0%) |
| Computers, Engineering & Science | 16 (100.0%) | 0 (0.0%) |
| Computers & Mathematics | 0 (0.0%) | 0 (0.0%) |
| Architecture & Engineering | 16 (100.0%) | 0 (0.0%) |
| Life, Physical & Social Science | 0 (0.0%) | 0 (0.0%) |
| Community & Social Service | 37 (39.8%) | 56 (60.2%) |
| Education, Arts & Media | 0 (0.0%) | 0 (0.0%) |
| Legal Services & Support | 0 (0.0%) | 0 (0.0%) |
| Education Instruction & Library | 37 (39.8%) | 56 (60.2%) |
| Arts, Media & Entertainment | 0 (0.0%) | 0 (0.0%) |
| Health Diagnosing & Treating | 0 (0.0%) | 37 (100.0%) |
| Health Technologists | 0 (0.0%) | 13 (100.0%) |
| Total (Category) | 73 (44.0%) | 93 (56.0%) |
| Total (Overall) | 213 (55.6%) | 170 (44.4%) |
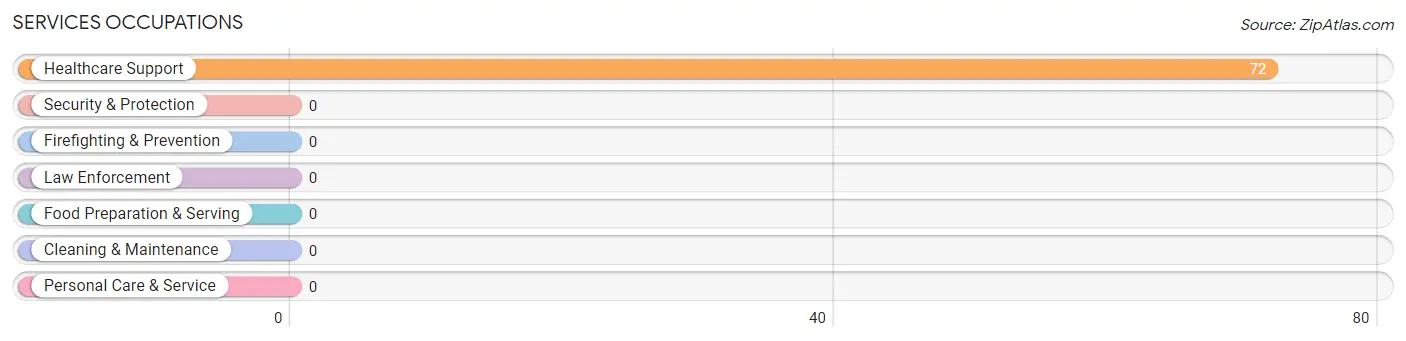
Services Occupations
The most common Services occupations in Franklin are , and Healthcare Support (72 | 18.8%).
Services Occupations by Sex
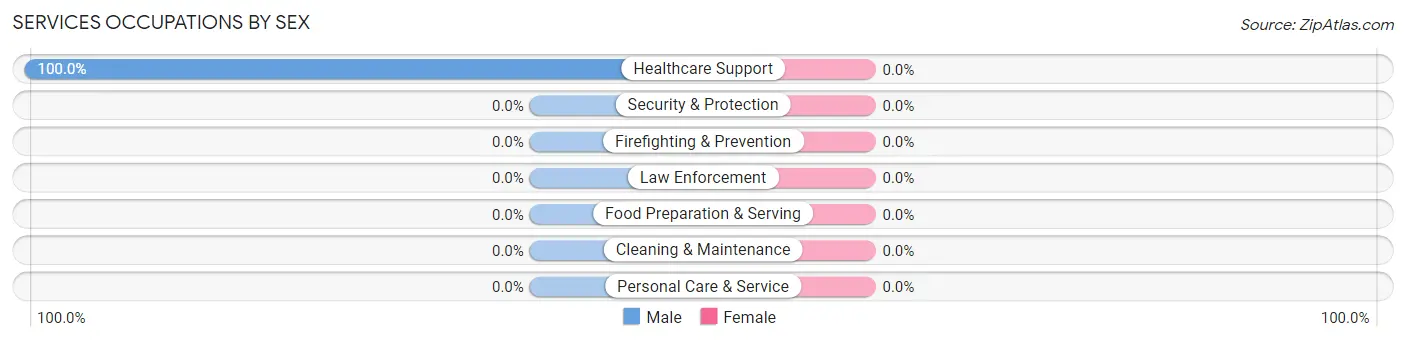
| Occupation | Male | Female |
| Healthcare Support | 72 (100.0%) | 0 (0.0%) |
| Security & Protection | 0 (0.0%) | 0 (0.0%) |
| Firefighting & Prevention | 0 (0.0%) | 0 (0.0%) |
| Law Enforcement | 0 (0.0%) | 0 (0.0%) |
| Food Preparation & Serving | 0 (0.0%) | 0 (0.0%) |
| Cleaning & Maintenance | 0 (0.0%) | 0 (0.0%) |
| Personal Care & Service | 0 (0.0%) | 0 (0.0%) |
| Total (Category) | 72 (100.0%) | 0 (0.0%) |
| Total (Overall) | 213 (55.6%) | 170 (44.4%) |
Sales and Office Occupations
The most common Sales and Office occupations in Franklin are , and Office & Administration (69 | 18.0%).
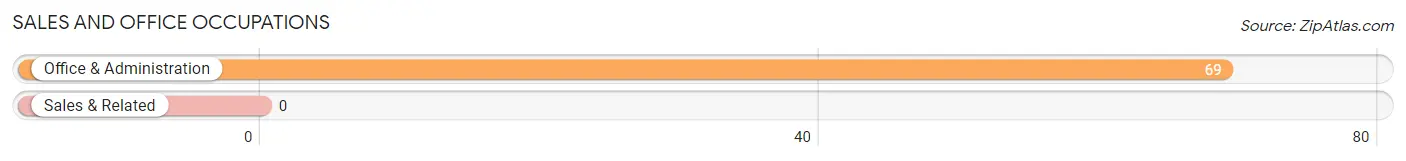
Sales and Office Occupations by Sex
| Occupation | Male | Female |
| Sales & Related | 0 (0.0%) | 0 (0.0%) |
| Office & Administration | 0 (0.0%) | 69 (100.0%) |
| Total (Category) | 0 (0.0%) | 69 (100.0%) |
| Total (Overall) | 213 (55.6%) | 170 (44.4%) |
Natural Resources, Construction and Maintenance Occupations
The most common Natural Resources, Construction and Maintenance occupations in Franklin are Installation, Maintenance & Repair (10 | 2.6%), and Construction & Extraction (8 | 2.1%).
Natural Resources, Construction and Maintenance Occupations by Sex
| Occupation | Male | Female |
| Farming, Fishing & Forestry | 0 (0.0%) | 0 (0.0%) |
| Construction & Extraction | 8 (100.0%) | 0 (0.0%) |
| Installation, Maintenance & Repair | 10 (100.0%) | 0 (0.0%) |
| Total (Category) | 18 (100.0%) | 0 (0.0%) |
| Total (Overall) | 213 (55.6%) | 170 (44.4%) |
Production, Transportation and Moving Occupations
The most common Production, Transportation and Moving occupations in Franklin are , and Production (58 | 15.1%).
Production, Transportation and Moving Occupations by Sex
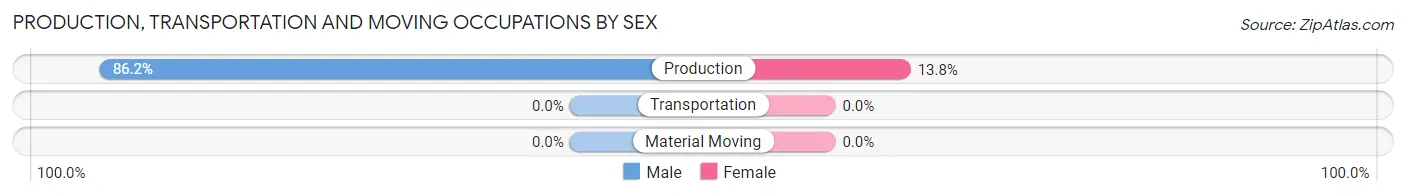
| Occupation | Male | Female |
| Production | 50 (86.2%) | 8 (13.8%) |
| Transportation | 0 (0.0%) | 0 (0.0%) |
| Material Moving | 0 (0.0%) | 0 (0.0%) |
| Total (Category) | 50 (86.2%) | 8 (13.8%) |
| Total (Overall) | 213 (55.6%) | 170 (44.4%) |
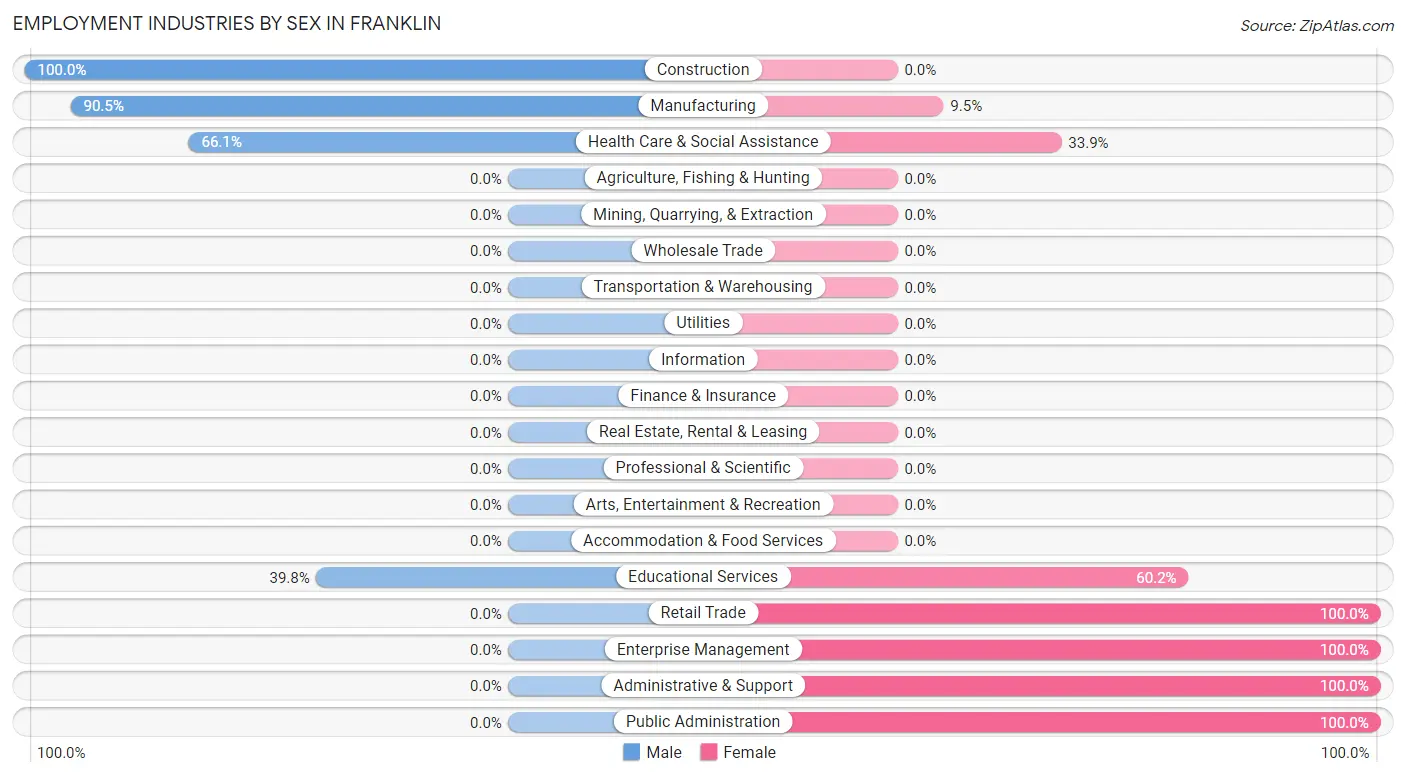
Employment Industries by Sex in Franklin
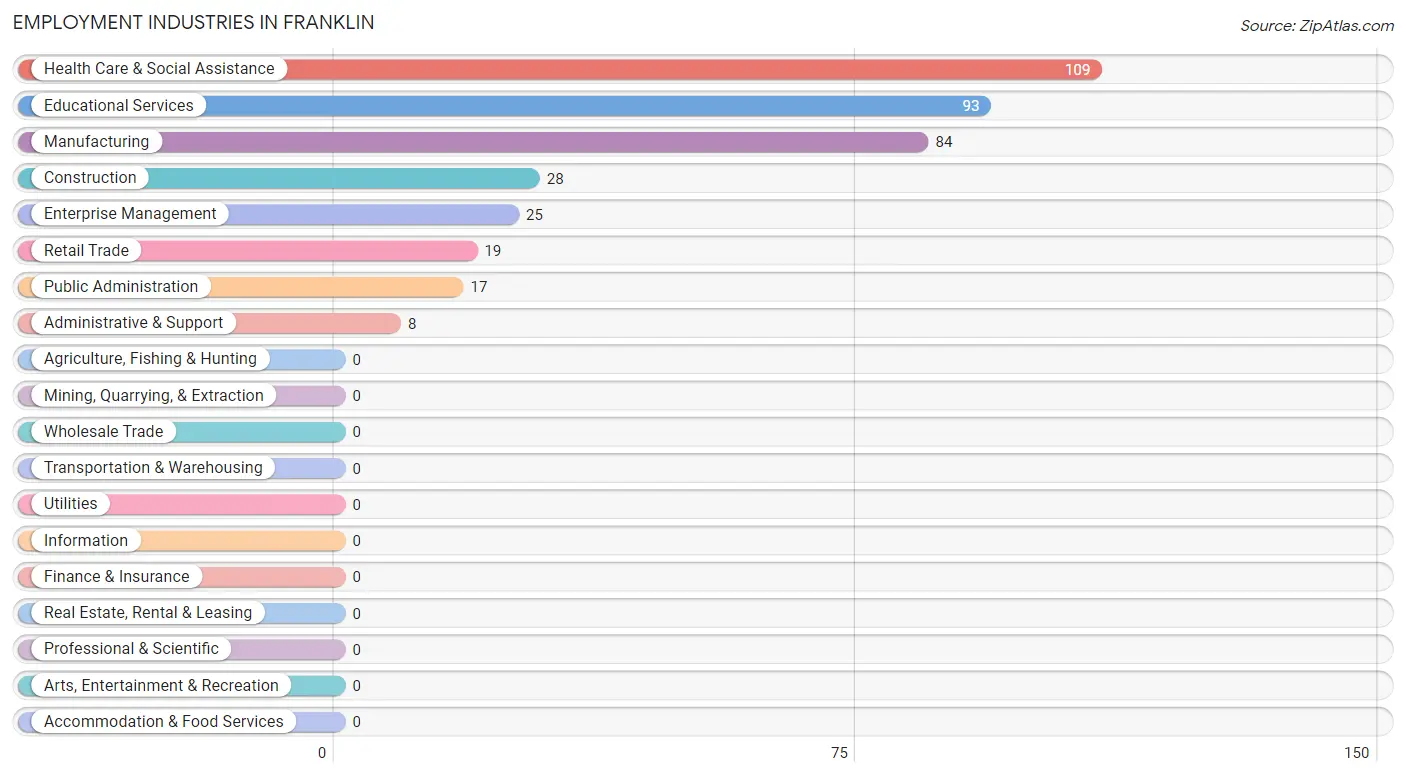
Employment Industries in Franklin
The major employment industries in Franklin include Health Care & Social Assistance (109 | 28.5%), Educational Services (93 | 24.3%), Manufacturing (84 | 21.9%), Construction (28 | 7.3%), and Enterprise Management (25 | 6.5%).
Employment Industries by Sex in Franklin
The Franklin industries that see more men than women are Construction (100.0%), Manufacturing (90.5%), and Health Care & Social Assistance (66.1%), whereas the industries that tend to have a higher number of women are Retail Trade (100.0%), Enterprise Management (100.0%), and Administrative & Support (100.0%).
| Industry | Male | Female |
| Agriculture, Fishing & Hunting | 0 (0.0%) | 0 (0.0%) |
| Mining, Quarrying, & Extraction | 0 (0.0%) | 0 (0.0%) |
| Construction | 28 (100.0%) | 0 (0.0%) |
| Manufacturing | 76 (90.5%) | 8 (9.5%) |
| Wholesale Trade | 0 (0.0%) | 0 (0.0%) |
| Retail Trade | 0 (0.0%) | 19 (100.0%) |
| Transportation & Warehousing | 0 (0.0%) | 0 (0.0%) |
| Utilities | 0 (0.0%) | 0 (0.0%) |
| Information | 0 (0.0%) | 0 (0.0%) |
| Finance & Insurance | 0 (0.0%) | 0 (0.0%) |
| Real Estate, Rental & Leasing | 0 (0.0%) | 0 (0.0%) |
| Professional & Scientific | 0 (0.0%) | 0 (0.0%) |
| Enterprise Management | 0 (0.0%) | 25 (100.0%) |
| Administrative & Support | 0 (0.0%) | 8 (100.0%) |
| Educational Services | 37 (39.8%) | 56 (60.2%) |
| Health Care & Social Assistance | 72 (66.1%) | 37 (33.9%) |
| Arts, Entertainment & Recreation | 0 (0.0%) | 0 (0.0%) |
| Accommodation & Food Services | 0 (0.0%) | 0 (0.0%) |
| Public Administration | 0 (0.0%) | 17 (100.0%) |
| Total | 213 (55.6%) | 170 (44.4%) |
Education in Franklin
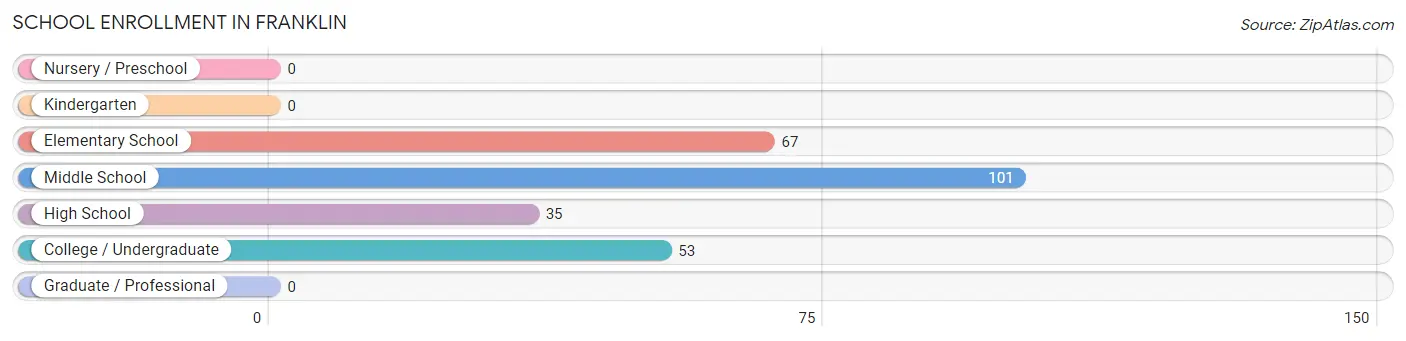
School Enrollment in Franklin
The most common levels of schooling among the 256 students in Franklin are middle school (101 | 39.5%), elementary school (67 | 26.2%), and college / undergraduate (53 | 20.7%).
| School Level | # Students | % Students |
| Nursery / Preschool | 0 | 0.0% |
| Kindergarten | 0 | 0.0% |
| Elementary School | 67 | 26.2% |
| Middle School | 101 | 39.5% |
| High School | 35 | 13.7% |
| College / Undergraduate | 53 | 20.7% |
| Graduate / Professional | 0 | 0.0% |
| Total | 256 | 100.0% |
School Enrollment by Age by Funding Source in Franklin
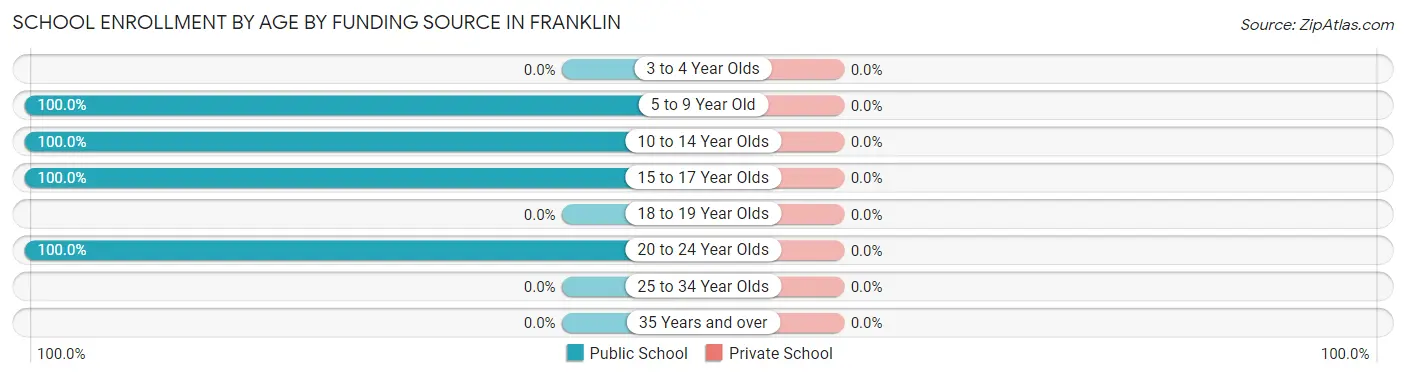
| Age Bracket | Public School | Private School |
| 3 to 4 Year Olds | 0 (0.0%) | 0 (0.0%) |
| 5 to 9 Year Old | 67 (100.0%) | 0 (0.0%) |
| 10 to 14 Year Olds | 110 (100.0%) | 0 (0.0%) |
| 15 to 17 Year Olds | 26 (100.0%) | 0 (0.0%) |
| 18 to 19 Year Olds | 0 (0.0%) | 0 (0.0%) |
| 20 to 24 Year Olds | 53 (100.0%) | 0 (0.0%) |
| 25 to 34 Year Olds | 0 (0.0%) | 0 (0.0%) |
| 35 Years and over | 0 (0.0%) | 0 (0.0%) |
| Total | 256 (100.0%) | 0 (0.0%) |
Educational Attainment by Field of Study in Franklin
Liberal arts & history (57 | 58.8%), education (16 | 16.5%), science & technology (13 | 13.4%), and literature & languages (11 | 11.3%) are the most common fields of study among 97 individuals in Franklin who have obtained a bachelor's degree or higher.
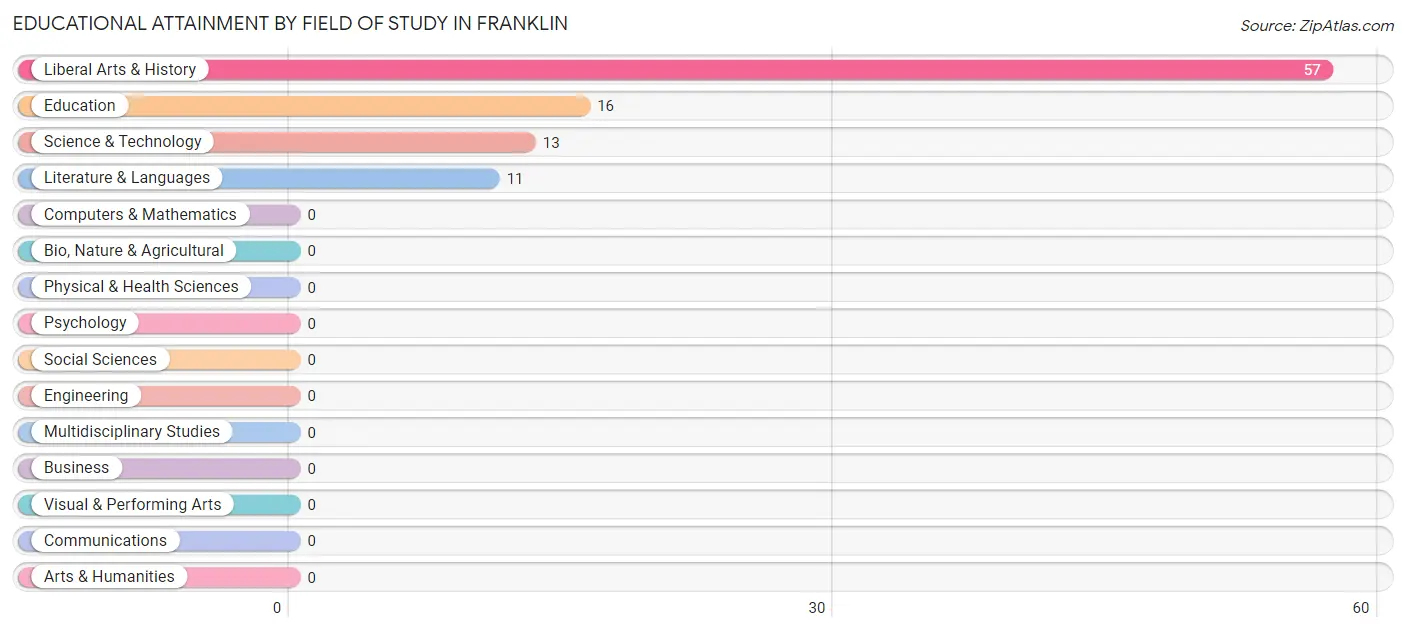
| Field of Study | # Graduates | % Graduates |
| Computers & Mathematics | 0 | 0.0% |
| Bio, Nature & Agricultural | 0 | 0.0% |
| Physical & Health Sciences | 0 | 0.0% |
| Psychology | 0 | 0.0% |
| Social Sciences | 0 | 0.0% |
| Engineering | 0 | 0.0% |
| Multidisciplinary Studies | 0 | 0.0% |
| Science & Technology | 13 | 13.4% |
| Business | 0 | 0.0% |
| Education | 16 | 16.5% |
| Literature & Languages | 11 | 11.3% |
| Liberal Arts & History | 57 | 58.8% |
| Visual & Performing Arts | 0 | 0.0% |
| Communications | 0 | 0.0% |
| Arts & Humanities | 0 | 0.0% |
| Total | 97 | 100.0% |
Transportation & Commute in Franklin
Vehicle Availability by Sex in Franklin
The most prevalent vehicle ownership categories in Franklin are males with 2 vehicles (136, accounting for 63.8%) and females with 2 vehicles (93, making up 80.0%).
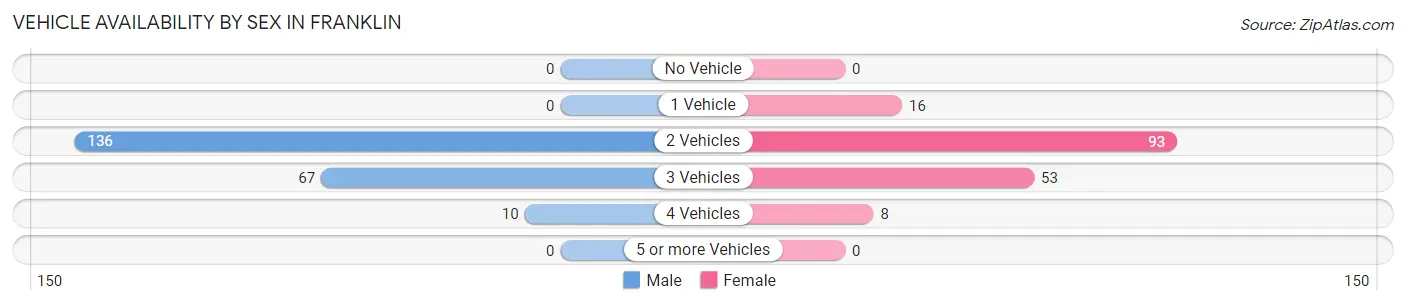
| Vehicles Available | Male | Female |
| No Vehicle | 0 (0.0%) | 0 (0.0%) |
| 1 Vehicle | 0 (0.0%) | 16 (9.4%) |
| 2 Vehicles | 136 (63.8%) | 93 (54.7%) |
| 3 Vehicles | 67 (31.5%) | 53 (31.2%) |
| 4 Vehicles | 10 (4.7%) | 8 (4.7%) |
| 5 or more Vehicles | 0 (0.0%) | 0 (0.0%) |
| Total | 213 (100.0%) | 170 (100.0%) |
Commute Time in Franklin
The most frequently occuring commute durations in Franklin are 5 to 9 minutes (174 commuters, 47.0%), 10 to 14 minutes (83 commuters, 22.4%), and 15 to 19 minutes (40 commuters, 10.8%).
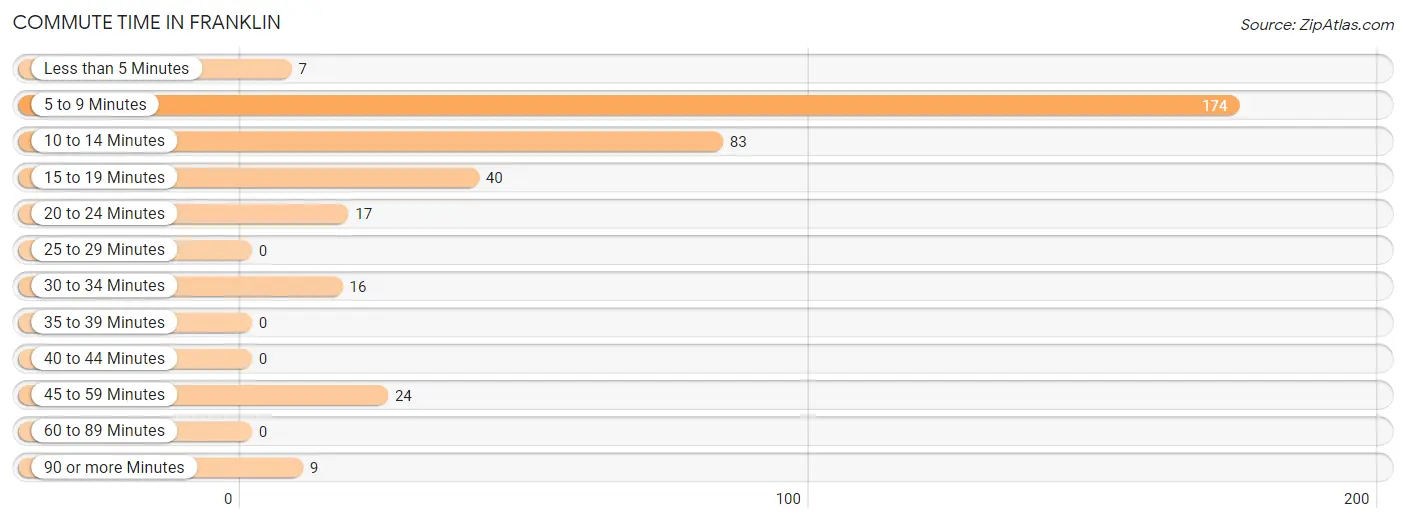
| Commute Time | # Commuters | % Commuters |
| Less than 5 Minutes | 7 | 1.9% |
| 5 to 9 Minutes | 174 | 47.0% |
| 10 to 14 Minutes | 83 | 22.4% |
| 15 to 19 Minutes | 40 | 10.8% |
| 20 to 24 Minutes | 17 | 4.6% |
| 25 to 29 Minutes | 0 | 0.0% |
| 30 to 34 Minutes | 16 | 4.3% |
| 35 to 39 Minutes | 0 | 0.0% |
| 40 to 44 Minutes | 0 | 0.0% |
| 45 to 59 Minutes | 24 | 6.5% |
| 60 to 89 Minutes | 0 | 0.0% |
| 90 or more Minutes | 9 | 2.4% |
Commute Time by Sex in Franklin
The most common commute times in Franklin are 5 to 9 minutes (126 commuters, 59.2%) for males and 5 to 9 minutes (48 commuters, 30.6%) for females.
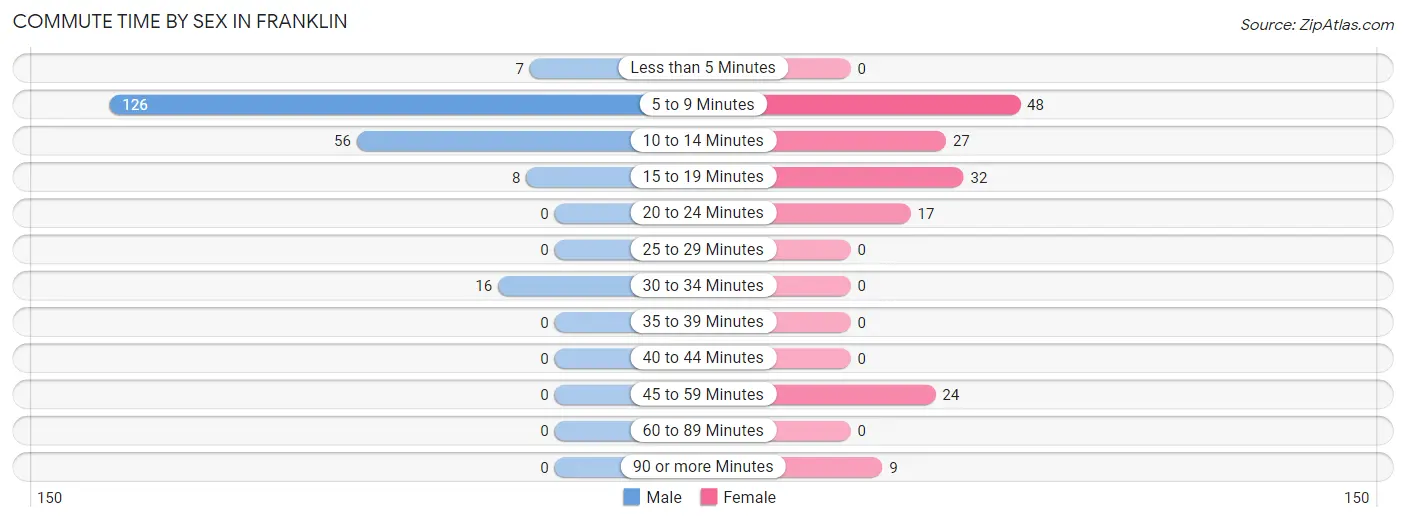
| Commute Time | Male | Female |
| Less than 5 Minutes | 7 (3.3%) | 0 (0.0%) |
| 5 to 9 Minutes | 126 (59.2%) | 48 (30.6%) |
| 10 to 14 Minutes | 56 (26.3%) | 27 (17.2%) |
| 15 to 19 Minutes | 8 (3.8%) | 32 (20.4%) |
| 20 to 24 Minutes | 0 (0.0%) | 17 (10.8%) |
| 25 to 29 Minutes | 0 (0.0%) | 0 (0.0%) |
| 30 to 34 Minutes | 16 (7.5%) | 0 (0.0%) |
| 35 to 39 Minutes | 0 (0.0%) | 0 (0.0%) |
| 40 to 44 Minutes | 0 (0.0%) | 0 (0.0%) |
| 45 to 59 Minutes | 0 (0.0%) | 24 (15.3%) |
| 60 to 89 Minutes | 0 (0.0%) | 0 (0.0%) |
| 90 or more Minutes | 0 (0.0%) | 9 (5.7%) |
Time of Departure to Work by Sex in Franklin
The most frequent times of departure to work in Franklin are 8:30 AM to 8:59 AM (115, 54.0%) for males and 8:00 AM to 8:29 AM (48, 30.6%) for females.
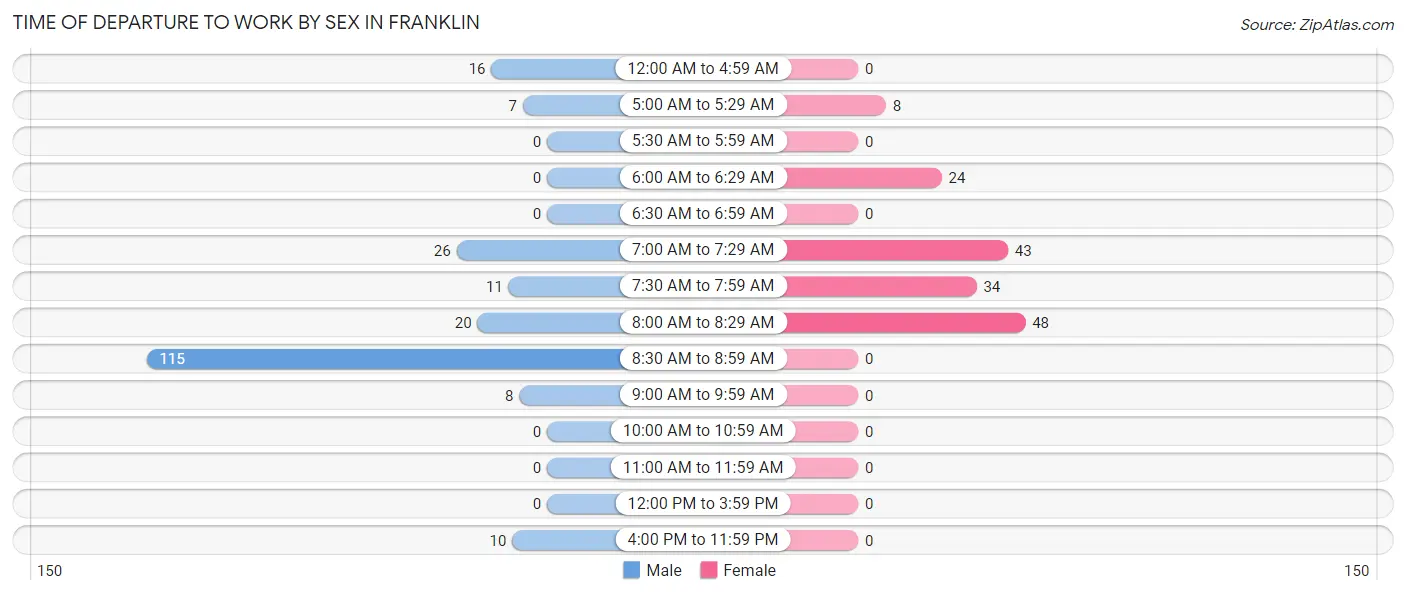
| Time of Departure | Male | Female |
| 12:00 AM to 4:59 AM | 16 (7.5%) | 0 (0.0%) |
| 5:00 AM to 5:29 AM | 7 (3.3%) | 8 (5.1%) |
| 5:30 AM to 5:59 AM | 0 (0.0%) | 0 (0.0%) |
| 6:00 AM to 6:29 AM | 0 (0.0%) | 24 (15.3%) |
| 6:30 AM to 6:59 AM | 0 (0.0%) | 0 (0.0%) |
| 7:00 AM to 7:29 AM | 26 (12.2%) | 43 (27.4%) |
| 7:30 AM to 7:59 AM | 11 (5.2%) | 34 (21.7%) |
| 8:00 AM to 8:29 AM | 20 (9.4%) | 48 (30.6%) |
| 8:30 AM to 8:59 AM | 115 (54.0%) | 0 (0.0%) |
| 9:00 AM to 9:59 AM | 8 (3.8%) | 0 (0.0%) |
| 10:00 AM to 10:59 AM | 0 (0.0%) | 0 (0.0%) |
| 11:00 AM to 11:59 AM | 0 (0.0%) | 0 (0.0%) |
| 12:00 PM to 3:59 PM | 0 (0.0%) | 0 (0.0%) |
| 4:00 PM to 11:59 PM | 10 (4.7%) | 0 (0.0%) |
| Total | 213 (100.0%) | 157 (100.0%) |
Housing Occupancy in Franklin
Occupancy by Ownership in Franklin
Of the total 223 dwellings in Franklin, owner-occupied units account for 172 (77.1%), while renter-occupied units make up 51 (22.9%).
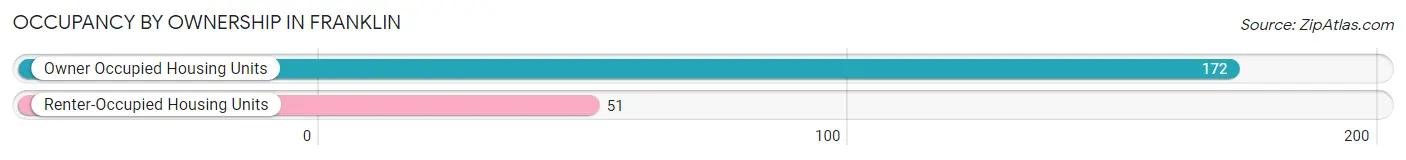
| Occupancy | # Housing Units | % Housing Units |
| Owner Occupied Housing Units | 172 | 77.1% |
| Renter-Occupied Housing Units | 51 | 22.9% |
| Total Occupied Housing Units | 223 | 100.0% |
Occupancy by Household Size in Franklin
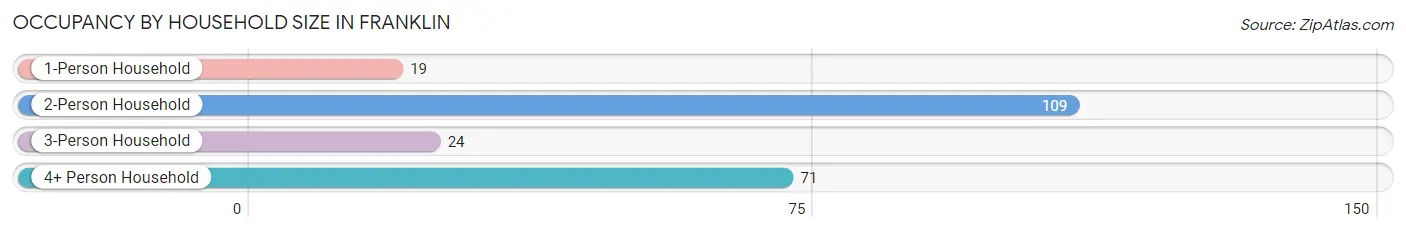
| Household Size | # Housing Units | % Housing Units |
| 1-Person Household | 19 | 8.5% |
| 2-Person Household | 109 | 48.9% |
| 3-Person Household | 24 | 10.8% |
| 4+ Person Household | 71 | 31.8% |
| Total Housing Units | 223 | 100.0% |
Occupancy by Ownership by Household Size in Franklin
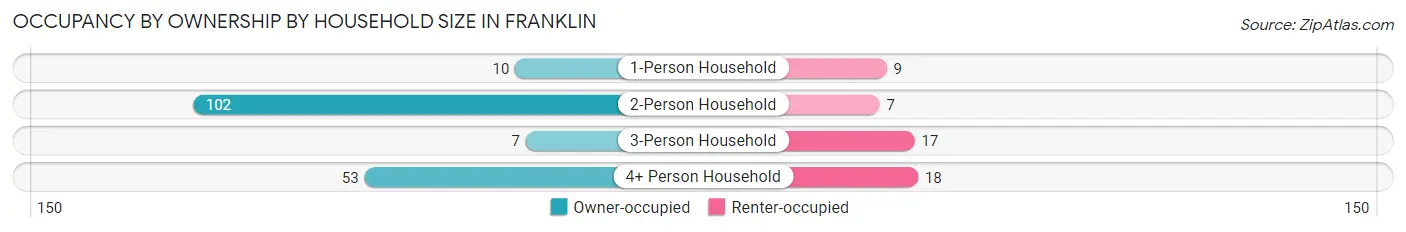
| Household Size | Owner-occupied | Renter-occupied |
| 1-Person Household | 10 (52.6%) | 9 (47.4%) |
| 2-Person Household | 102 (93.6%) | 7 (6.4%) |
| 3-Person Household | 7 (29.2%) | 17 (70.8%) |
| 4+ Person Household | 53 (74.7%) | 18 (25.4%) |
| Total Housing Units | 172 (77.1%) | 51 (22.9%) |
Occupancy by Educational Attainment in Franklin
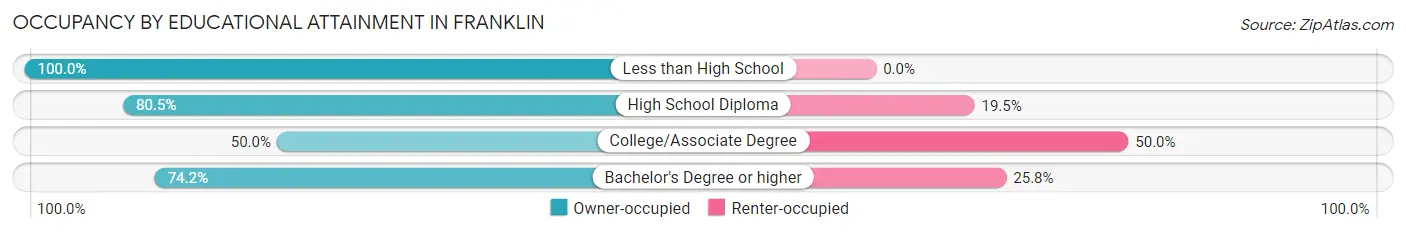
| Household Size | Owner-occupied | Renter-occupied |
| Less than High School | 66 (100.0%) | 0 (0.0%) |
| High School Diploma | 33 (80.5%) | 8 (19.5%) |
| College/Associate Degree | 27 (50.0%) | 27 (50.0%) |
| Bachelor's Degree or higher | 46 (74.2%) | 16 (25.8%) |
Occupancy by Age of Householder in Franklin
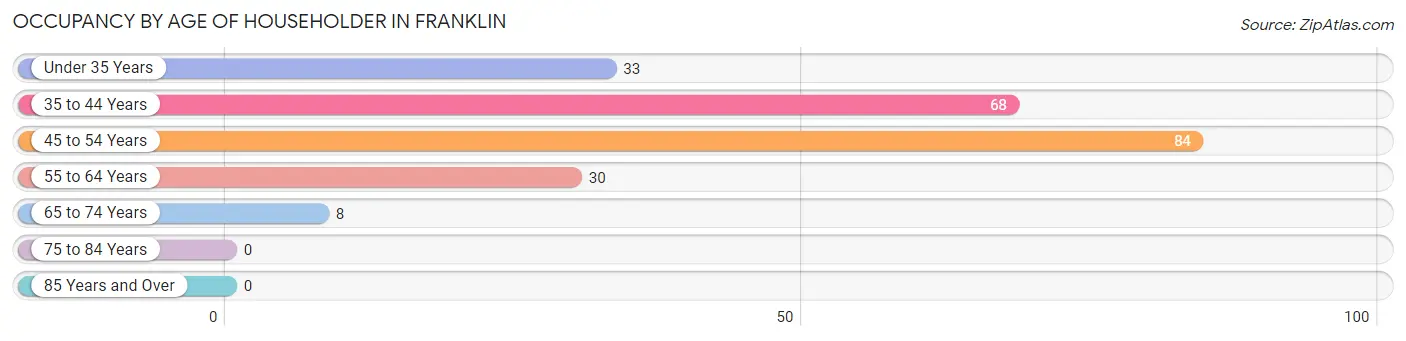
| Age Bracket | # Households | % Households |
| Under 35 Years | 33 | 14.8% |
| 35 to 44 Years | 68 | 30.5% |
| 45 to 54 Years | 84 | 37.7% |
| 55 to 64 Years | 30 | 13.5% |
| 65 to 74 Years | 8 | 3.6% |
| 75 to 84 Years | 0 | 0.0% |
| 85 Years and Over | 0 | 0.0% |
| Total | 223 | 100.0% |
Housing Finances in Franklin
Median Income by Occupancy in Franklin
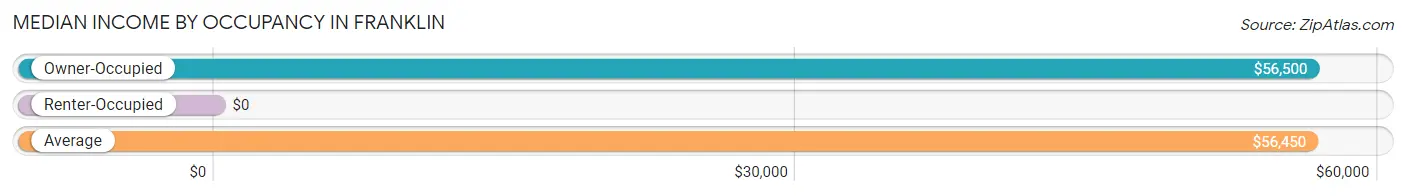
| Occupancy Type | # Households | Median Income |
| Owner-Occupied | 172 (77.1%) | $56,500 |
| Renter-Occupied | 51 (22.9%) | $0 |
| Average | 223 (100.0%) | $56,450 |
Occupancy by Householder Income Bracket in Franklin
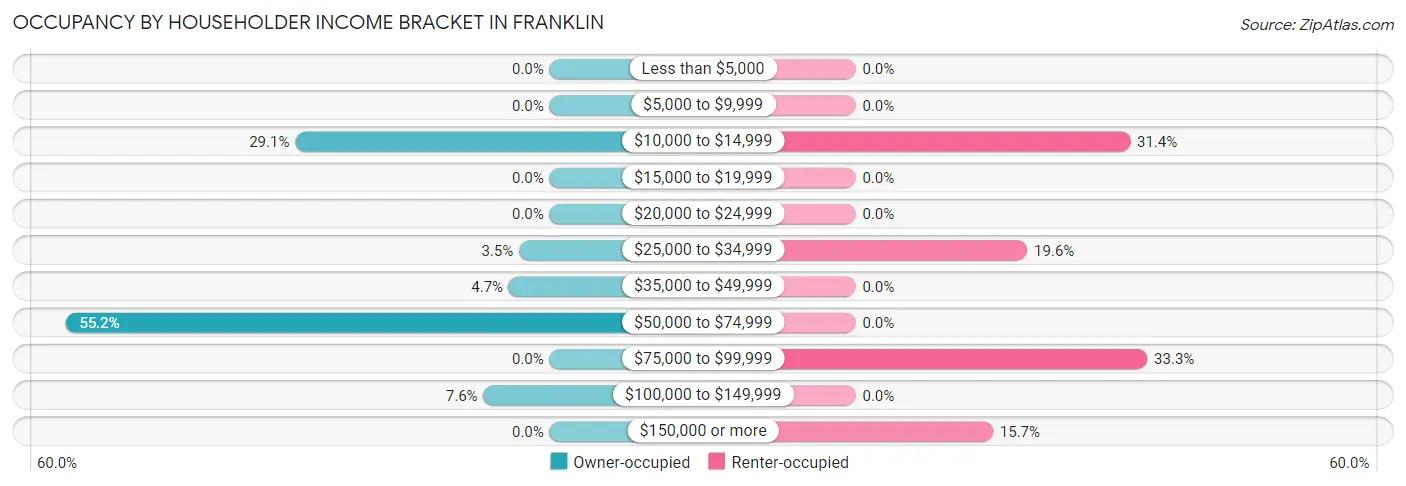
| Income Bracket | Owner-occupied | Renter-occupied |
| Less than $5,000 | 0 (0.0%) | 0 (0.0%) |
| $5,000 to $9,999 | 0 (0.0%) | 0 (0.0%) |
| $10,000 to $14,999 | 50 (29.1%) | 16 (31.4%) |
| $15,000 to $19,999 | 0 (0.0%) | 0 (0.0%) |
| $20,000 to $24,999 | 0 (0.0%) | 0 (0.0%) |
| $25,000 to $34,999 | 6 (3.5%) | 10 (19.6%) |
| $35,000 to $49,999 | 8 (4.6%) | 0 (0.0%) |
| $50,000 to $74,999 | 95 (55.2%) | 0 (0.0%) |
| $75,000 to $99,999 | 0 (0.0%) | 17 (33.3%) |
| $100,000 to $149,999 | 13 (7.6%) | 0 (0.0%) |
| $150,000 or more | 0 (0.0%) | 8 (15.7%) |
| Total | 172 (100.0%) | 51 (100.0%) |
Monthly Housing Cost Tiers in Franklin
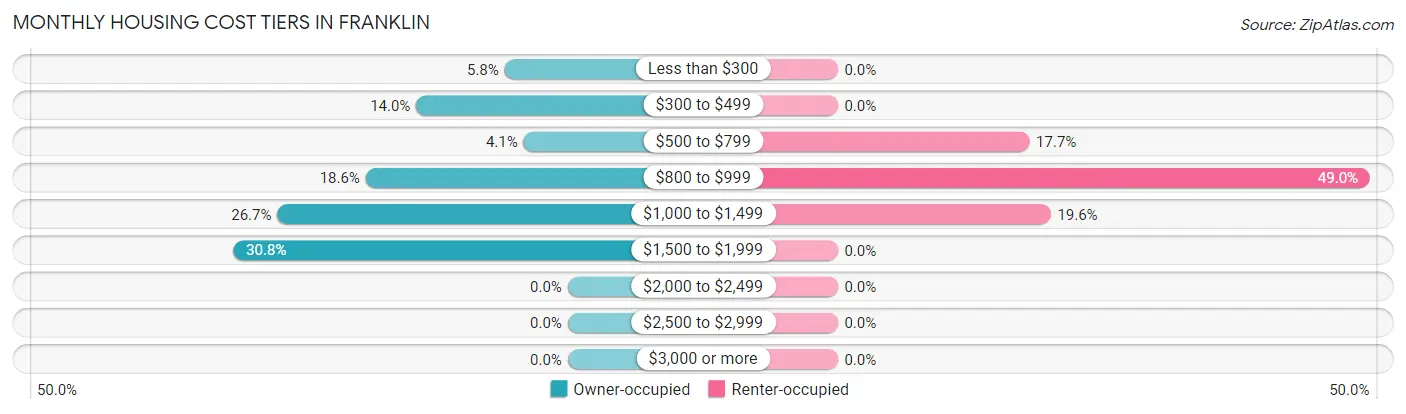
| Monthly Cost | Owner-occupied | Renter-occupied |
| Less than $300 | 10 (5.8%) | 0 (0.0%) |
| $300 to $499 | 24 (14.0%) | 0 (0.0%) |
| $500 to $799 | 7 (4.1%) | 9 (17.6%) |
| $800 to $999 | 32 (18.6%) | 25 (49.0%) |
| $1,000 to $1,499 | 46 (26.7%) | 10 (19.6%) |
| $1,500 to $1,999 | 53 (30.8%) | 0 (0.0%) |
| $2,000 to $2,499 | 0 (0.0%) | 0 (0.0%) |
| $2,500 to $2,999 | 0 (0.0%) | 0 (0.0%) |
| $3,000 or more | 0 (0.0%) | 0 (0.0%) |
| Total | 172 (100.0%) | 51 (100.0%) |
Physical Housing Characteristics in Franklin
Housing Structures in Franklin
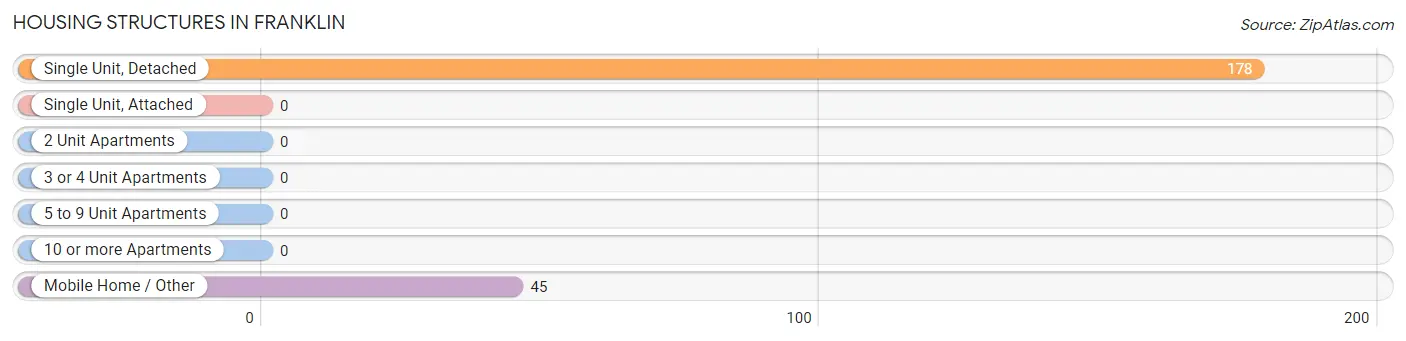
| Structure Type | # Housing Units | % Housing Units |
| Single Unit, Detached | 178 | 79.8% |
| Single Unit, Attached | 0 | 0.0% |
| 2 Unit Apartments | 0 | 0.0% |
| 3 or 4 Unit Apartments | 0 | 0.0% |
| 5 to 9 Unit Apartments | 0 | 0.0% |
| 10 or more Apartments | 0 | 0.0% |
| Mobile Home / Other | 45 | 20.2% |
| Total | 223 | 100.0% |
Housing Structures by Occupancy in Franklin
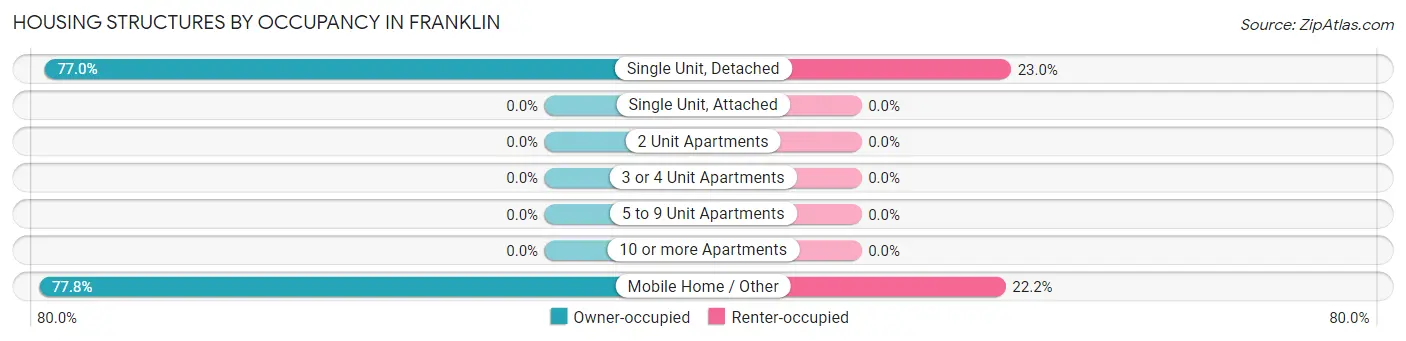
| Structure Type | Owner-occupied | Renter-occupied |
| Single Unit, Detached | 137 (77.0%) | 41 (23.0%) |
| Single Unit, Attached | 0 (0.0%) | 0 (0.0%) |
| 2 Unit Apartments | 0 (0.0%) | 0 (0.0%) |
| 3 or 4 Unit Apartments | 0 (0.0%) | 0 (0.0%) |
| 5 to 9 Unit Apartments | 0 (0.0%) | 0 (0.0%) |
| 10 or more Apartments | 0 (0.0%) | 0 (0.0%) |
| Mobile Home / Other | 35 (77.8%) | 10 (22.2%) |
| Total | 172 (77.1%) | 51 (22.9%) |
Housing Structures by Number of Rooms in Franklin
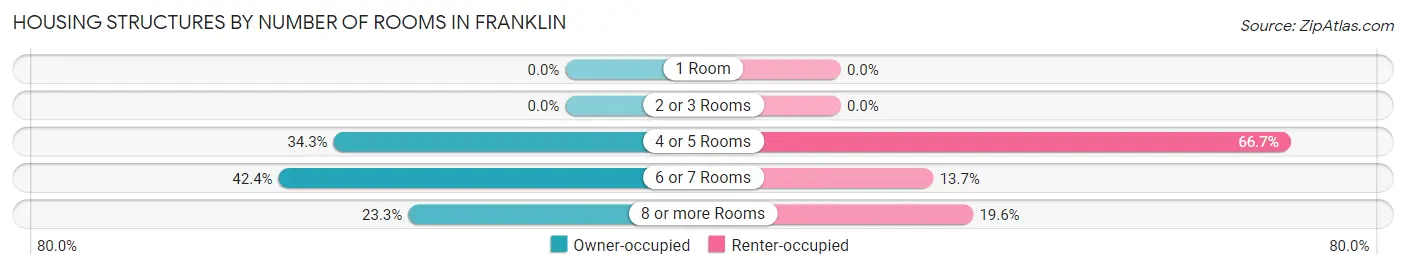
| Number of Rooms | Owner-occupied | Renter-occupied |
| 1 Room | 0 (0.0%) | 0 (0.0%) |
| 2 or 3 Rooms | 0 (0.0%) | 0 (0.0%) |
| 4 or 5 Rooms | 59 (34.3%) | 34 (66.7%) |
| 6 or 7 Rooms | 73 (42.4%) | 7 (13.7%) |
| 8 or more Rooms | 40 (23.3%) | 10 (19.6%) |
| Total | 172 (100.0%) | 51 (100.0%) |
Housing Structure by Heating Type in Franklin
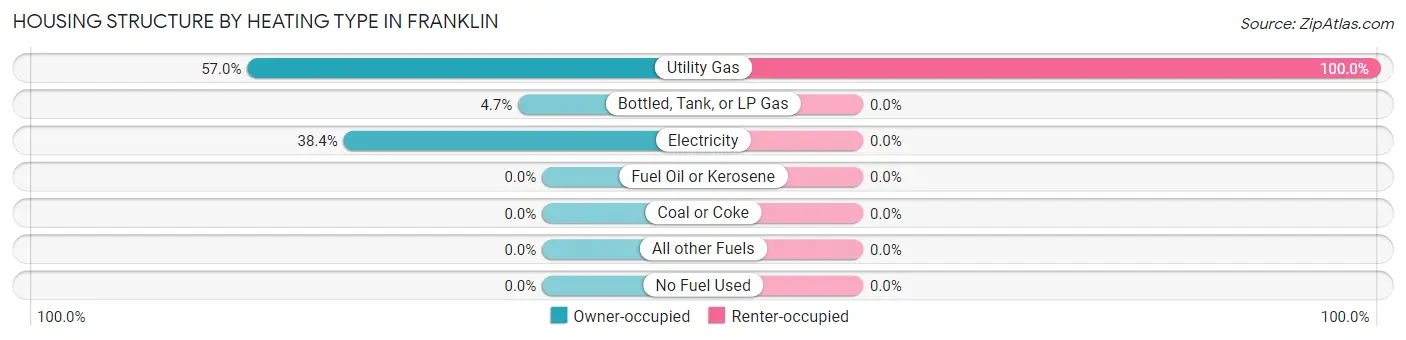
| Heating Type | Owner-occupied | Renter-occupied |
| Utility Gas | 98 (57.0%) | 51 (100.0%) |
| Bottled, Tank, or LP Gas | 8 (4.6%) | 0 (0.0%) |
| Electricity | 66 (38.4%) | 0 (0.0%) |
| Fuel Oil or Kerosene | 0 (0.0%) | 0 (0.0%) |
| Coal or Coke | 0 (0.0%) | 0 (0.0%) |
| All other Fuels | 0 (0.0%) | 0 (0.0%) |
| No Fuel Used | 0 (0.0%) | 0 (0.0%) |
| Total | 172 (100.0%) | 51 (100.0%) |
Household Vehicle Usage in Franklin
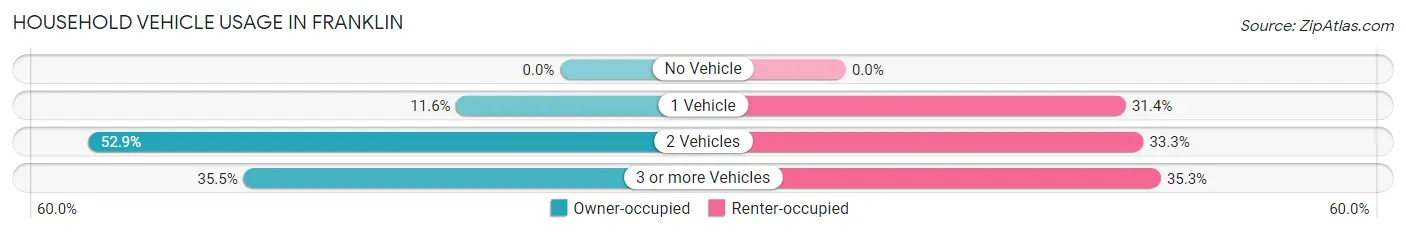
| Vehicles per Household | Owner-occupied | Renter-occupied |
| No Vehicle | 0 (0.0%) | 0 (0.0%) |
| 1 Vehicle | 20 (11.6%) | 16 (31.4%) |
| 2 Vehicles | 91 (52.9%) | 17 (33.3%) |
| 3 or more Vehicles | 61 (35.5%) | 18 (35.3%) |
| Total | 172 (100.0%) | 51 (100.0%) |
Real Estate & Mortgages in Franklin
Real Estate and Mortgage Overview in Franklin
| Characteristic | Without Mortgage | With Mortgage |
| Housing Units | 34 | 138 |
| Median Property Value | - | - |
| Median Household Income | $35,313 | $0 |
| Monthly Housing Costs | $406 | $0 |
| Real Estate Taxes | - | - |
Property Value by Mortgage Status in Franklin
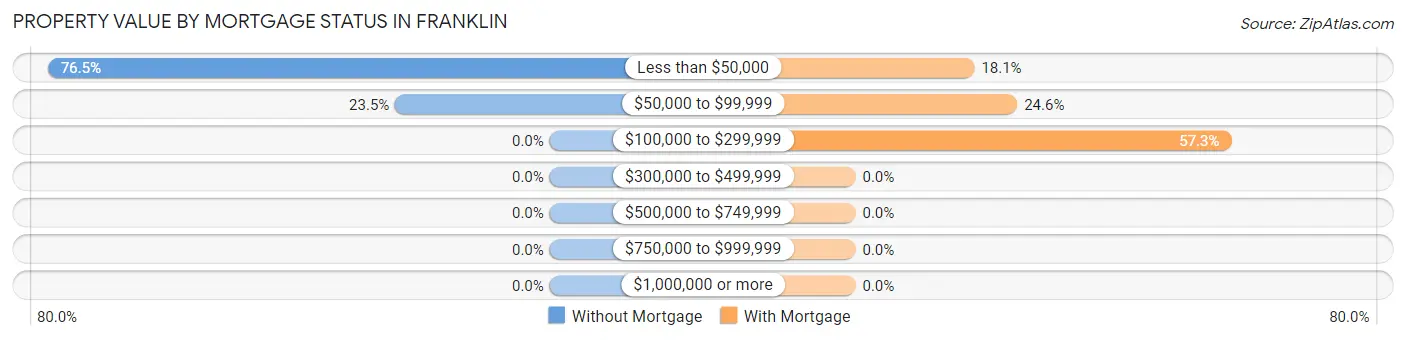
| Property Value | Without Mortgage | With Mortgage |
| Less than $50,000 | 26 (76.5%) | 25 (18.1%) |
| $50,000 to $99,999 | 8 (23.5%) | 34 (24.6%) |
| $100,000 to $299,999 | 0 (0.0%) | 79 (57.3%) |
| $300,000 to $499,999 | 0 (0.0%) | 0 (0.0%) |
| $500,000 to $749,999 | 0 (0.0%) | 0 (0.0%) |
| $750,000 to $999,999 | 0 (0.0%) | 0 (0.0%) |
| $1,000,000 or more | 0 (0.0%) | 0 (0.0%) |
| Total | 34 (100.0%) | 138 (100.0%) |
Household Income by Mortgage Status in Franklin
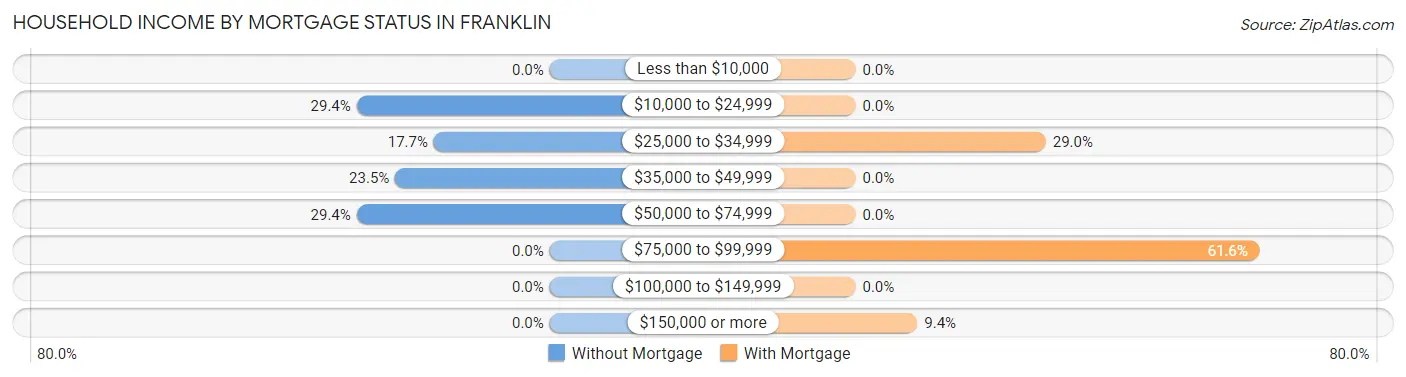
| Household Income | Without Mortgage | With Mortgage |
| Less than $10,000 | 0 (0.0%) | 0 (0.0%) |
| $10,000 to $24,999 | 10 (29.4%) | 0 (0.0%) |
| $25,000 to $34,999 | 6 (17.6%) | 40 (29.0%) |
| $35,000 to $49,999 | 8 (23.5%) | 0 (0.0%) |
| $50,000 to $74,999 | 10 (29.4%) | 0 (0.0%) |
| $75,000 to $99,999 | 0 (0.0%) | 85 (61.6%) |
| $100,000 to $149,999 | 0 (0.0%) | 0 (0.0%) |
| $150,000 or more | 0 (0.0%) | 13 (9.4%) |
| Total | 34 (100.0%) | 138 (100.0%) |
Property Value to Household Income Ratio in Franklin
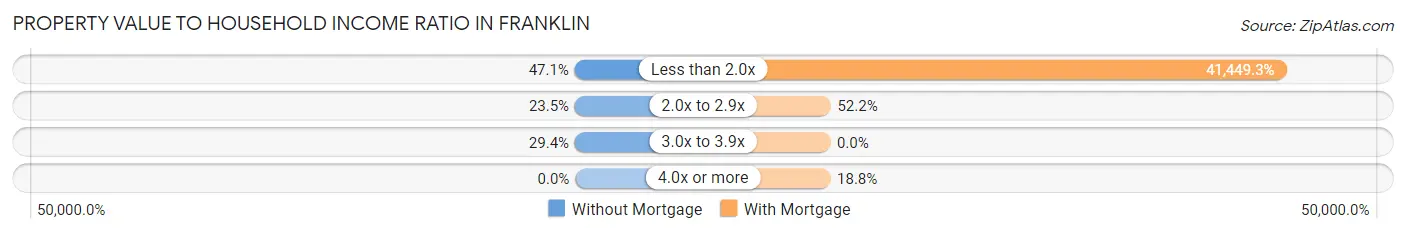
| Value-to-Income Ratio | Without Mortgage | With Mortgage |
| Less than 2.0x | 16 (47.1%) | 57,200 (41,449.3%) |
| 2.0x to 2.9x | 8 (23.5%) | 72 (52.2%) |
| 3.0x to 3.9x | 10 (29.4%) | 0 (0.0%) |
| 4.0x or more | 0 (0.0%) | 26 (18.8%) |
| Total | 34 (100.0%) | 138 (100.0%) |
Real Estate Taxes by Mortgage Status in Franklin
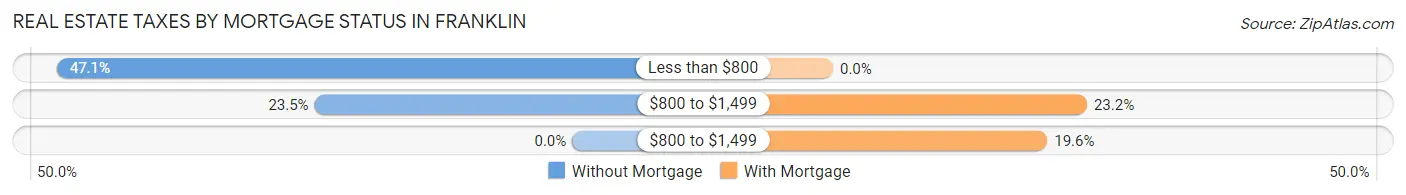
| Property Taxes | Without Mortgage | With Mortgage |
| Less than $800 | 16 (47.1%) | 0 (0.0%) |
| $800 to $1,499 | 8 (23.5%) | 32 (23.2%) |
| $800 to $1,499 | 0 (0.0%) | 27 (19.6%) |
| Total | 34 (100.0%) | 138 (100.0%) |
Health & Disability in Franklin
Health Insurance Coverage by Age in Franklin
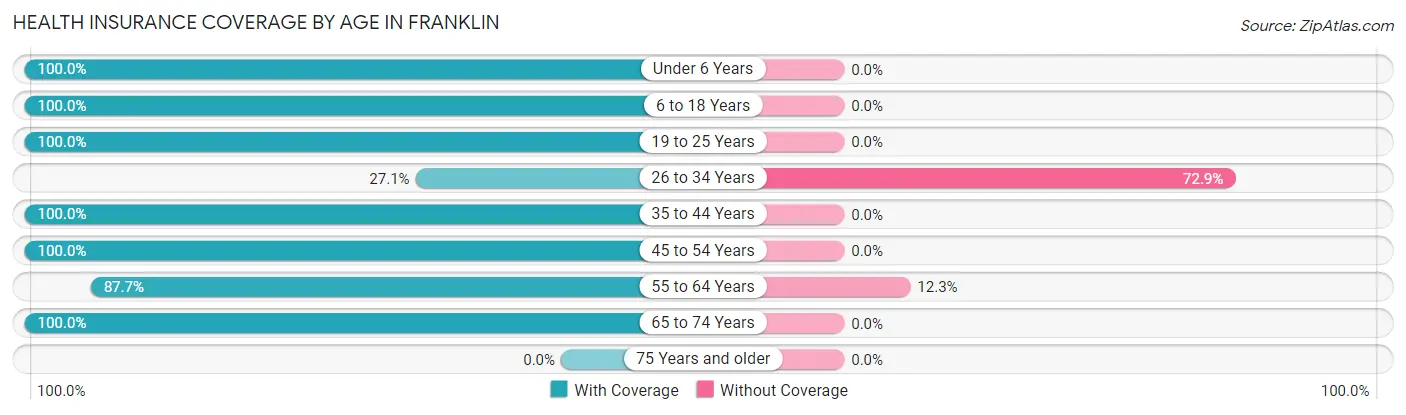
| Age Bracket | With Coverage | Without Coverage |
| Under 6 Years | 32 (100.0%) | 0 (0.0%) |
| 6 to 18 Years | 230 (100.0%) | 0 (0.0%) |
| 19 to 25 Years | 143 (100.0%) | 0 (0.0%) |
| 26 to 34 Years | 16 (27.1%) | 43 (72.9%) |
| 35 to 44 Years | 129 (100.0%) | 0 (0.0%) |
| 45 to 54 Years | 92 (100.0%) | 0 (0.0%) |
| 55 to 64 Years | 64 (87.7%) | 9 (12.3%) |
| 65 to 74 Years | 16 (100.0%) | 0 (0.0%) |
| 75 Years and older | 0 (0.0%) | 0 (0.0%) |
| Total | 722 (93.3%) | 52 (6.7%) |
Health Insurance Coverage by Citizenship Status in Franklin
| Citizenship Status | With Coverage | Without Coverage |
| Native Born | 32 (100.0%) | 0 (0.0%) |
| Foreign Born, Citizen | 230 (100.0%) | 0 (0.0%) |
| Foreign Born, not a Citizen | 143 (100.0%) | 0 (0.0%) |
Health Insurance Coverage by Household Income in Franklin
| Household Income | With Coverage | Without Coverage |
| Under $25,000 | 183 (100.0%) | 0 (0.0%) |
| $25,000 to $49,999 | 111 (72.1%) | 43 (27.9%) |
| $50,000 to $74,999 | 202 (95.7%) | 9 (4.3%) |
| $75,000 to $99,999 | 112 (100.0%) | 0 (0.0%) |
| $100,000 and over | 114 (100.0%) | 0 (0.0%) |
Public vs Private Health Insurance Coverage by Age in Franklin
| Age Bracket | Public Insurance | Private Insurance |
| Under 6 | 9 (28.1%) | 23 (71.9%) |
| 6 to 18 Years | 71 (30.9%) | 177 (77.0%) |
| 19 to 25 Years | 18 (12.6%) | 125 (87.4%) |
| 25 to 34 Years | 0 (0.0%) | 16 (27.1%) |
| 35 to 44 Years | 25 (19.4%) | 129 (100.0%) |
| 45 to 54 Years | 6 (6.5%) | 86 (93.5%) |
| 55 to 64 Years | 45 (61.6%) | 29 (39.7%) |
| 65 to 74 Years | 16 (100.0%) | 1 (6.2%) |
| 75 Years and over | 0 (0.0%) | 0 (0.0%) |
| Total | 190 (24.5%) | 586 (75.7%) |
Disability Status by Sex by Age in Franklin
| Age Bracket | Male | Female |
| Under 5 Years | 0 (0.0%) | 0 (0.0%) |
| 5 to 17 Years | 0 (0.0%) | 0 (0.0%) |
| 18 to 34 Years | 18 (10.6%) | 36 (60.0%) |
| 35 to 64 Years | 15 (14.3%) | 45 (23.8%) |
| 65 to 74 Years | 0 (0.0%) | 0 (0.0%) |
| 75 Years and over | 0 (0.0%) | 0 (0.0%) |
Disability Class by Sex by Age in Franklin
Disability Class: Hearing Difficulty
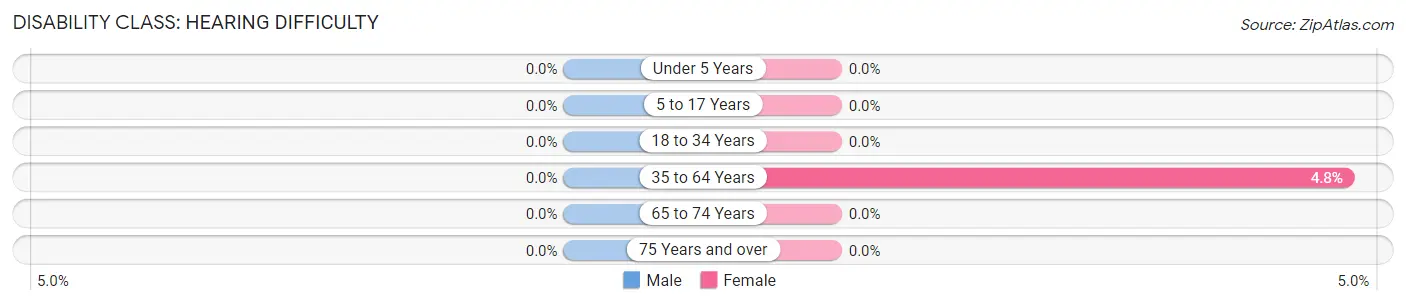
| Age Bracket | Male | Female |
| Under 5 Years | 0 (0.0%) | 0 (0.0%) |
| 5 to 17 Years | 0 (0.0%) | 0 (0.0%) |
| 18 to 34 Years | 0 (0.0%) | 0 (0.0%) |
| 35 to 64 Years | 0 (0.0%) | 9 (4.8%) |
| 65 to 74 Years | 0 (0.0%) | 0 (0.0%) |
| 75 Years and over | 0 (0.0%) | 0 (0.0%) |
Disability Class: Vision Difficulty
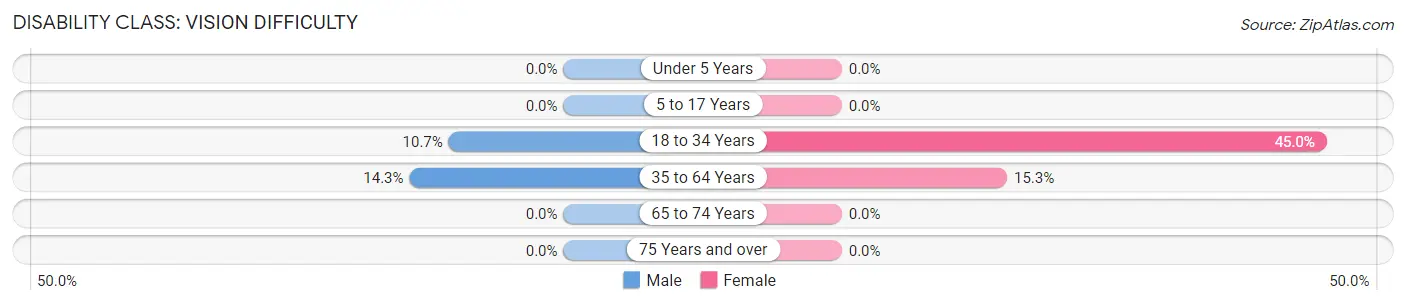
| Age Bracket | Male | Female |
| Under 5 Years | 0 (0.0%) | 0 (0.0%) |
| 5 to 17 Years | 0 (0.0%) | 0 (0.0%) |
| 18 to 34 Years | 18 (10.6%) | 27 (45.0%) |
| 35 to 64 Years | 15 (14.3%) | 29 (15.3%) |
| 65 to 74 Years | 0 (0.0%) | 0 (0.0%) |
| 75 Years and over | 0 (0.0%) | 0 (0.0%) |
Disability Class: Cognitive Difficulty
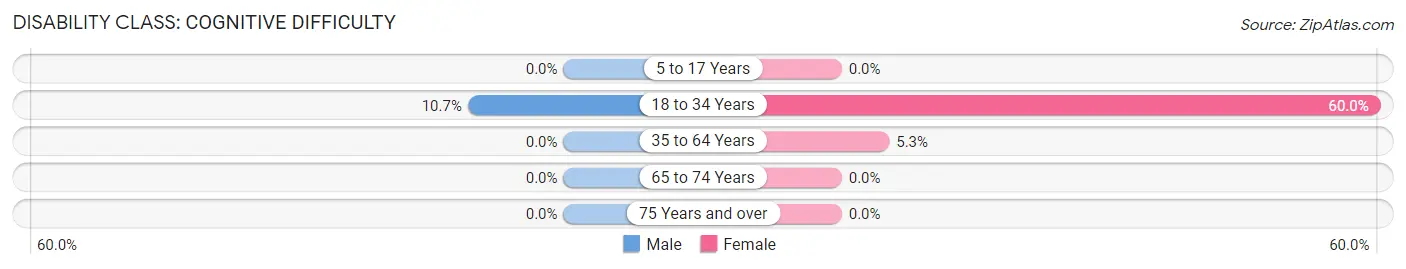
| Age Bracket | Male | Female |
| 5 to 17 Years | 0 (0.0%) | 0 (0.0%) |
| 18 to 34 Years | 18 (10.6%) | 36 (60.0%) |
| 35 to 64 Years | 0 (0.0%) | 10 (5.3%) |
| 65 to 74 Years | 0 (0.0%) | 0 (0.0%) |
| 75 Years and over | 0 (0.0%) | 0 (0.0%) |
Disability Class: Ambulatory Difficulty
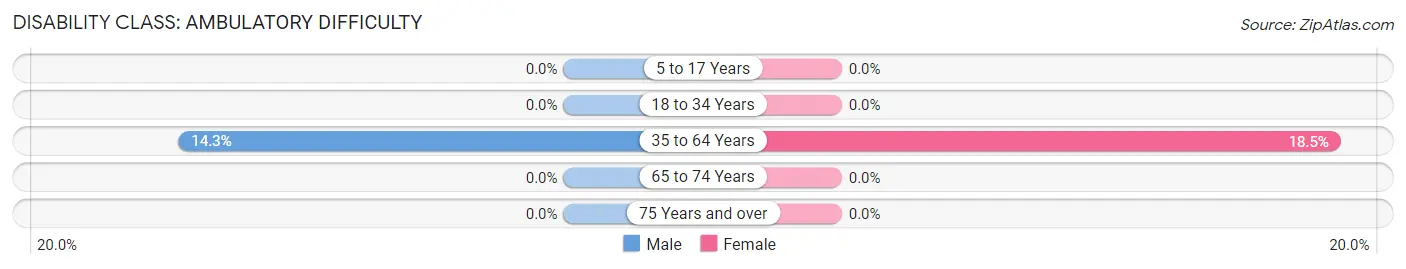
| Age Bracket | Male | Female |
| 5 to 17 Years | 0 (0.0%) | 0 (0.0%) |
| 18 to 34 Years | 0 (0.0%) | 0 (0.0%) |
| 35 to 64 Years | 15 (14.3%) | 35 (18.5%) |
| 65 to 74 Years | 0 (0.0%) | 0 (0.0%) |
| 75 Years and over | 0 (0.0%) | 0 (0.0%) |
Disability Class: Self-Care Difficulty
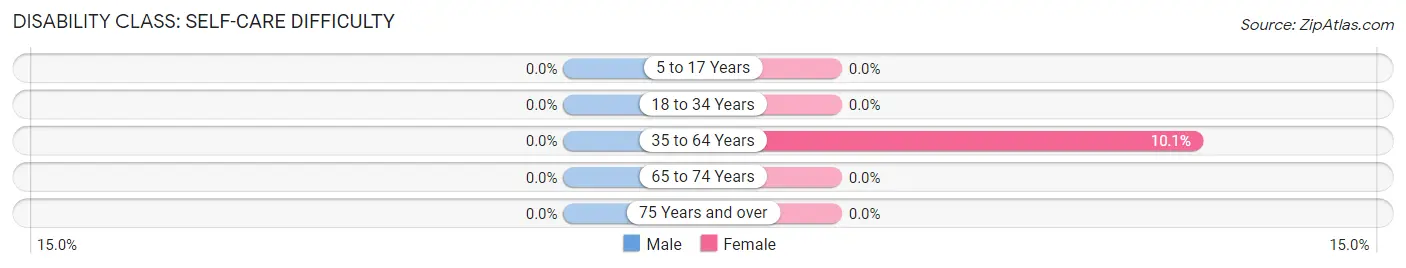
| Age Bracket | Male | Female |
| 5 to 17 Years | 0 (0.0%) | 0 (0.0%) |
| 18 to 34 Years | 0 (0.0%) | 0 (0.0%) |
| 35 to 64 Years | 0 (0.0%) | 19 (10.1%) |
| 65 to 74 Years | 0 (0.0%) | 0 (0.0%) |
| 75 Years and over | 0 (0.0%) | 0 (0.0%) |
Technology Access in Franklin
Computing Device Access in Franklin
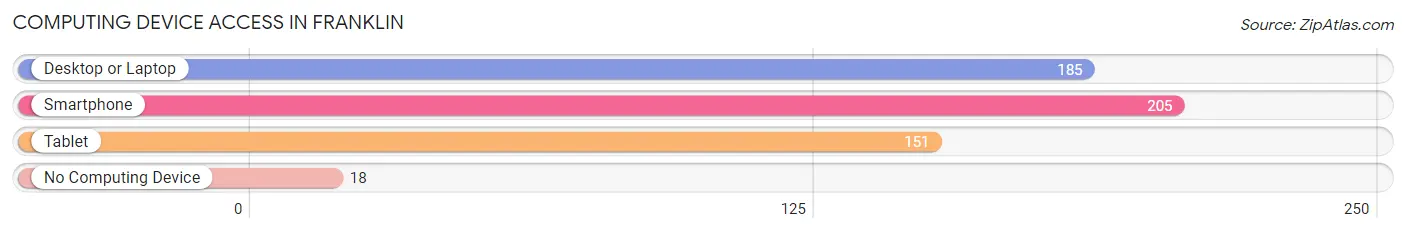
| Device Type | # Households | % Households |
| Desktop or Laptop | 185 | 83.0% |
| Smartphone | 205 | 91.9% |
| Tablet | 151 | 67.7% |
| No Computing Device | 18 | 8.1% |
| Total | 223 | 100.0% |
Internet Access in Franklin
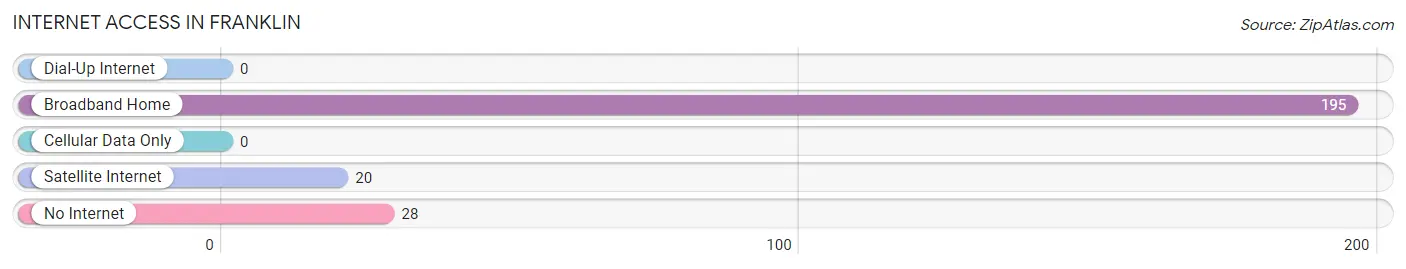
| Internet Type | # Households | % Households |
| Dial-Up Internet | 0 | 0.0% |
| Broadband Home | 195 | 87.4% |
| Cellular Data Only | 0 | 0.0% |
| Satellite Internet | 20 | 9.0% |
| No Internet | 28 | 12.6% |
| Total | 223 | 100.0% |
Franklin Summary
Franklin, Kansas is a small city located in the eastern part of the state, in the county of Franklin. It is situated on the banks of the Marais des Cygnes River, and is part of the Kansas City metropolitan area. The city has a population of approximately 1,400 people, and is the county seat of Franklin County.
History
Franklin was founded in 1854 by a group of settlers from Ohio, led by William Franklin. The town was named after William Franklin, and was originally intended to be a trading post for the local Native American tribes. The town quickly grew, and by 1859, it had become the county seat of Franklin County.
In the late 19th century, Franklin was a bustling center of commerce, with a variety of businesses, including a flour mill, a sawmill, a blacksmith shop, and a hotel. The town also had a newspaper, the Franklin Herald, which was published from 1871 to 1876.
In the early 20th century, Franklin experienced a period of decline, as the railroad bypassed the town and the local economy shifted away from agriculture. However, in the 1950s, the town began to experience a resurgence, as new businesses and industries moved into the area.
Geography
Franklin is located in the eastern part of Kansas, in Franklin County. It is situated on the banks of the Marais des Cygnes River, and is part of the Kansas City metropolitan area. The city has a total area of 1.2 square miles, all of which is land.
The climate in Franklin is characterized by hot, humid summers and cold, dry winters. The average annual temperature is around 54°F, and the average annual precipitation is around 37 inches.
Economy
The economy of Franklin is largely based on agriculture and manufacturing. The city is home to several large agricultural operations, including a dairy farm, a hog farm, and a poultry farm. The city also has several manufacturing plants, including a plastics factory and a metal fabrication plant.
In addition to agriculture and manufacturing, Franklin also has a thriving retail sector. The city is home to several small businesses, including restaurants, shops, and other services.
Demographics
As of the 2010 census, the population of Franklin was 1,400. The racial makeup of the city was 95.3% White, 0.7% African American, 0.7% Native American, 0.3% Asian, 0.1% Pacific Islander, and 2.0% from other races. Hispanic or Latino of any race were 2.3% of the population.
The median household income in Franklin was $41,250, and the median family income was $50,000. The per capita income was $20,845. About 11.3% of the population was below the poverty line.
Conclusion
Franklin, Kansas is a small city located in the eastern part of the state, in the county of Franklin. It is situated on the banks of the Marais des Cygnes River, and is part of the Kansas City metropolitan area. The city has a population of approximately 1,400 people, and is the county seat of Franklin County. The economy of Franklin is largely based on agriculture and manufacturing, and the city is home to several small businesses. The racial makeup of the city is predominantly White, with a small percentage of African American, Native American, Asian, and Pacific Islander residents. The median household income in Franklin is $41,250, and the per capita income is $20,845.
Common Questions
What is Per Capita Income in Franklin?
Per Capita income in Franklin is $19,613.
What is the Median Family Income in Franklin?
Median Family Income in Franklin is $57,400.
What is the Median Household income in Franklin?
Median Household Income in Franklin is $56,450.
What is Inequality or Gini Index in Franklin?
Inequality or Gini Index in Franklin is 0.37.
What is the Total Population of Franklin?
Total Population of Franklin is 774.
What is the Total Male Population of Franklin?
Total Male Population of Franklin is 377.
What is the Total Female Population of Franklin?
Total Female Population of Franklin is 397.
What is the Ratio of Males per 100 Females in Franklin?
There are 94.96 Males per 100 Females in Franklin.
What is the Ratio of Females per 100 Males in Franklin?
There are 105.31 Females per 100 Males in Franklin.
What is the Median Population Age in Franklin?
Median Population Age in Franklin is 24.0 Years.
What is the Average Family Size in Franklin
Average Family Size in Franklin is 3.7 People.
What is the Average Household Size in Franklin
Average Household Size in Franklin is 3.5 People.
How Large is the Labor Force in Franklin?
There are 419 People in the Labor Forcein in Franklin.
What is the Percentage of People in the Labor Force in Franklin?
77.7% of People are in the Labor Force in Franklin.
What is the Unemployment Rate in Franklin?
Unemployment Rate in Franklin is 8.6%.