Zip Codes with the Highest Percentage of Population Employed in Architecture & Engineering in Leawood, KS
RELATED REPORTS & OPTIONS
Architecture & Engineering
Leawood
Compare Zip Codes
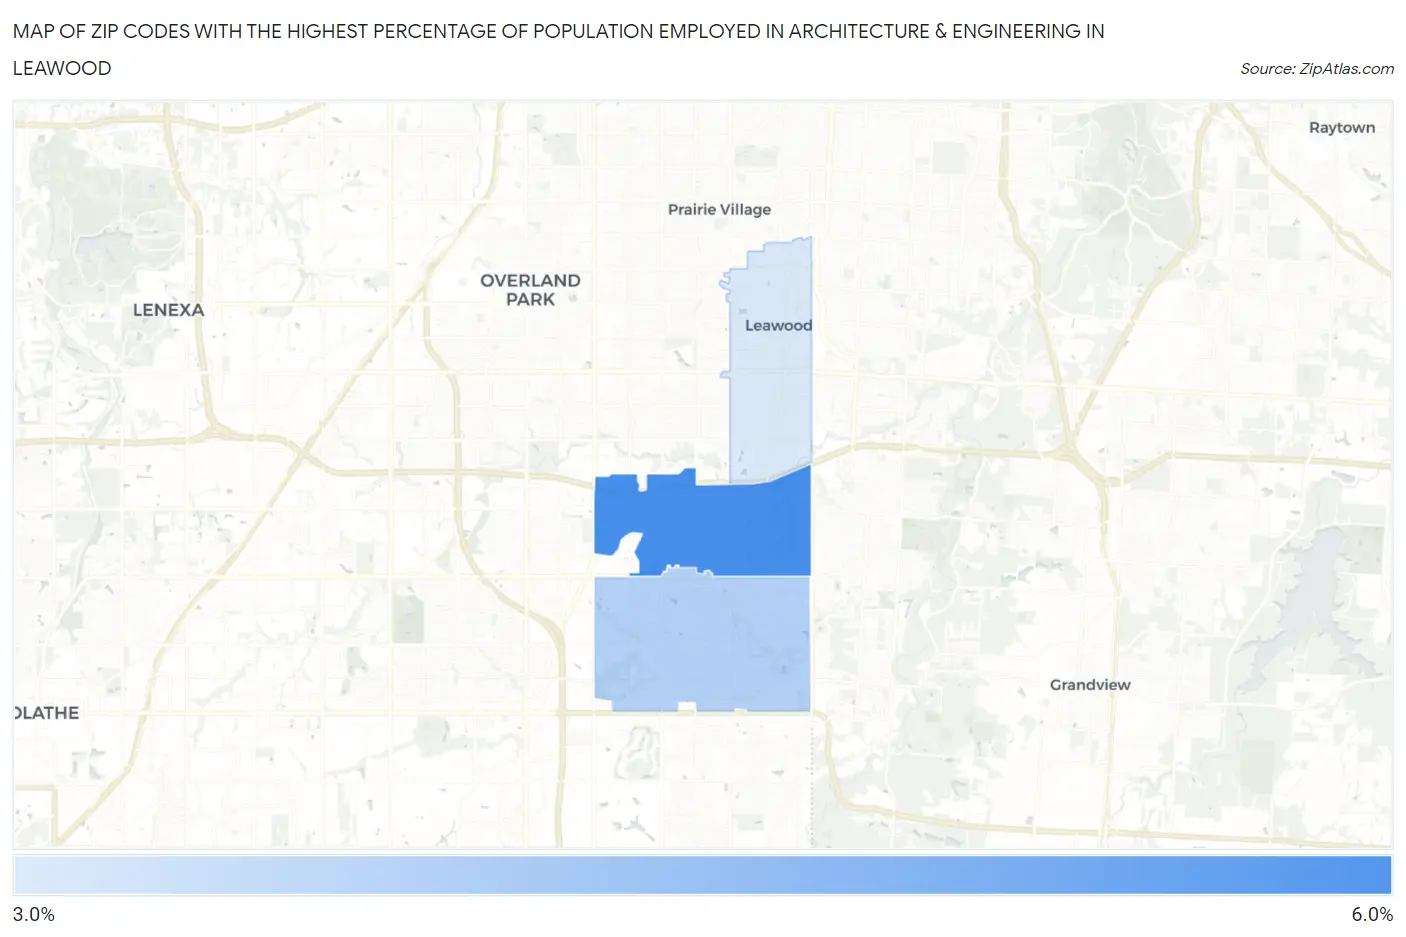
Map of Zip Codes with the Highest Percentage of Population Employed in Architecture & Engineering in Leawood
3.3%
5.4%
Zip Codes with the Highest Percentage of Population Employed in Architecture & Engineering in Leawood, KS
| Zip Code | % Employed | vs State | vs National | |
| 1. | 66211 | 5.4% | 2.0%(+3.32)#33 | 2.1%(+3.22)#1,409 |
| 2. | 66209 | 3.9% | 2.0%(+1.86)#58 | 2.1%(+1.75)#2,939 |
| 3. | 66206 | 3.3% | 2.0%(+1.29)#72 | 2.1%(+1.18)#4,115 |
1
Common Questions
What are the Top Zip Codes with the Highest Percentage of Population Employed in Architecture & Engineering in Leawood, KS?
Top Zip Codes with the Highest Percentage of Population Employed in Architecture & Engineering in Leawood, KS are:
What zip code has the Highest Percentage of Population Employed in Architecture & Engineering in Leawood, KS?
66211 has the Highest Percentage of Population Employed in Architecture & Engineering in Leawood, KS with 5.4%.
What is the Percentage of Population Employed in Architecture & Engineering in Leawood, KS?
Percentage of Population Employed in Architecture & Engineering in Leawood is 3.2%.
What is the Percentage of Population Employed in Architecture & Engineering in Kansas?
Percentage of Population Employed in Architecture & Engineering in Kansas is 2.0%.
What is the Percentage of Population Employed in Architecture & Engineering in the United States?
Percentage of Population Employed in Architecture & Engineering in the United States is 2.1%.