Ukrainian Male Disability
COMPARE
Ukrainian
Select to Compare
Male Disability
Ukrainian Male Disability
11.5%
DISABILITY | MALES
10.6/ 100
METRIC RATING
206th/ 347
METRIC RANK
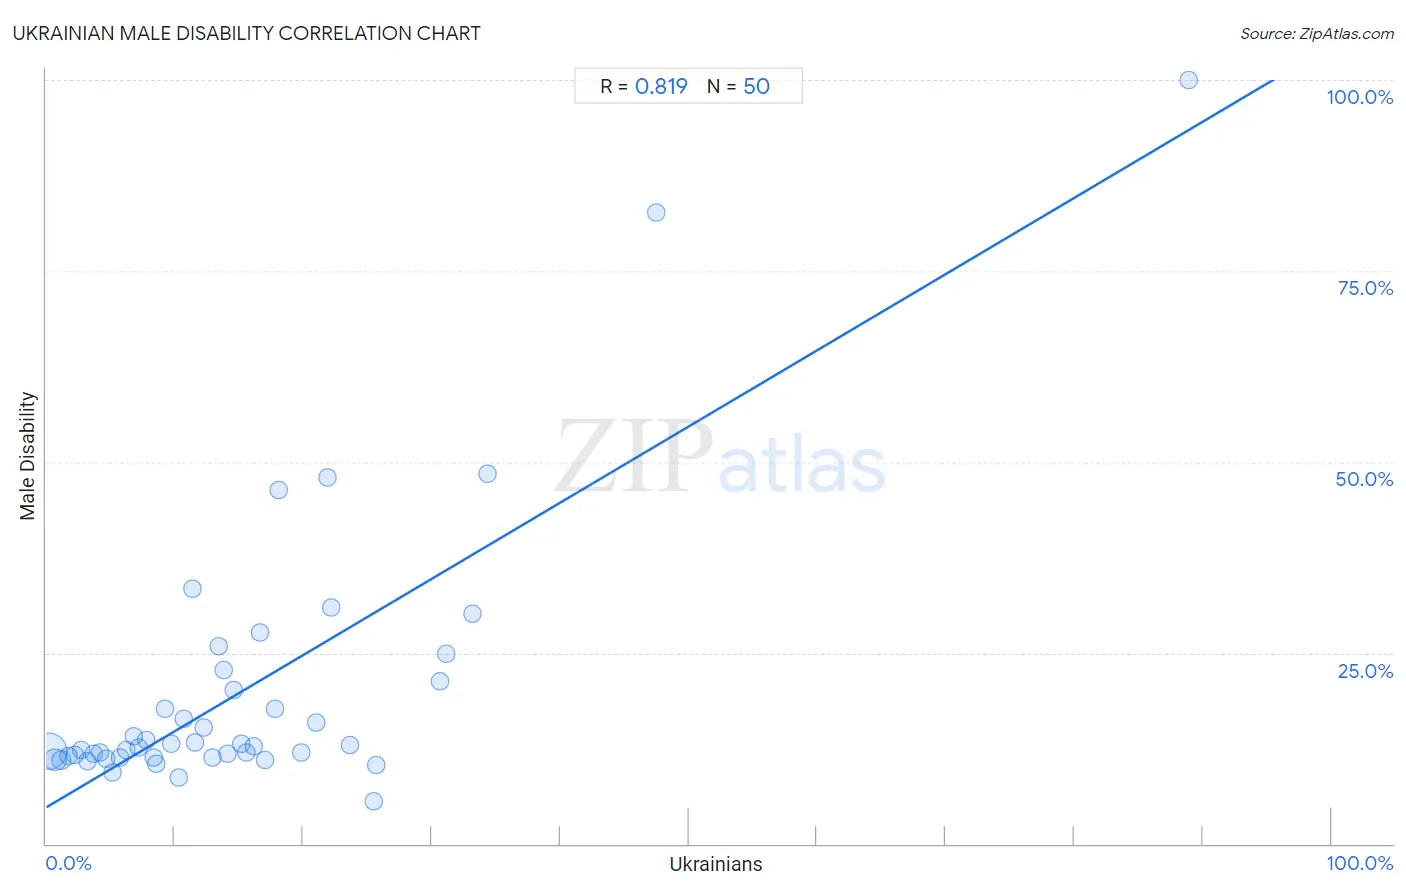
Ukrainian Male Disability Correlation Chart
The statistical analysis conducted on geographies consisting of 448,602,749 people shows a very strong positive correlation between the proportion of Ukrainians and percentage of males with a disability in the United States with a correlation coefficient (R) of 0.819 and weighted average of 11.5%. On average, for every 1% (one percent) increase in Ukrainians within a typical geography, there is an increase of 1.00% in percentage of males with a disability.
It is essential to understand that the correlation between the percentage of Ukrainians and percentage of males with a disability does not imply a direct cause-and-effect relationship. It remains uncertain whether the presence of Ukrainians influences an upward or downward trend in the level of percentage of males with a disability within an area, or if Ukrainians simply ended up residing in those areas with higher or lower levels of percentage of males with a disability due to other factors.
Demographics Similar to Ukrainians by Male Disability
In terms of male disability, the demographic groups most similar to Ukrainians are Immigrants from Cambodia (11.5%, a difference of 0.010%), Serbian (11.5%, a difference of 0.010%), Jamaican (11.5%, a difference of 0.030%), Immigrants from Somalia (11.5%, a difference of 0.030%), and Icelander (11.6%, a difference of 0.070%).
| Demographics | Rating | Rank | Male Disability |
| Lebanese | 15.4 /100 | #199 | Poor 11.5% |
| Immigrants from Iraq | 13.0 /100 | #200 | Poor 11.5% |
| Immigrants from Panama | 13.0 /100 | #201 | Poor 11.5% |
| Immigrants from Mexico | 12.6 /100 | #202 | Poor 11.5% |
| Jamaicans | 10.9 /100 | #203 | Poor 11.5% |
| Immigrants from Cambodia | 10.8 /100 | #204 | Poor 11.5% |
| Serbians | 10.7 /100 | #205 | Poor 11.5% |
| Ukrainians | 10.6 /100 | #206 | Poor 11.5% |
| Immigrants from Somalia | 10.4 /100 | #207 | Poor 11.5% |
| Icelanders | 10.1 /100 | #208 | Poor 11.6% |
| Spanish American Indians | 10.1 /100 | #209 | Poor 11.6% |
| Ute | 9.4 /100 | #210 | Tragic 11.6% |
| Immigrants from Thailand | 8.4 /100 | #211 | Tragic 11.6% |
| Immigrants from Scotland | 8.2 /100 | #212 | Tragic 11.6% |
| Mexican American Indians | 7.8 /100 | #213 | Tragic 11.6% |
Ukrainian Male Disability Correlation Summary
| Measurement | Ukrainian Data | Male Disability Data |
| Minimum | 0.19% | 5.6% |
| Maximum | 88.9% | 100.0% |
| Range | 88.7% | 94.4% |
| Mean | 15.3% | 20.0% |
| Median | 12.6% | 12.8% |
| Interquartile 25% (IQ1) | 6.2% | 11.3% |
| Interquartile 75% (IQ3) | 19.9% | 21.2% |
| Interquartile Range (IQR) | 13.6% | 9.9% |
| Standard Deviation (Sample) | 14.6% | 17.8% |
| Standard Deviation (Population) | 14.5% | 17.6% |
Correlation Details
| Ukrainian Percentile | Sample Size | Male Disability |
[ 0.0% - 0.5% ] 0.19% | 334,740,488 | 12.0% |
[ 0.5% - 1.0% ] 0.70% | 78,129,910 | 11.0% |
[ 1.0% - 1.5% ] 1.19% | 19,140,147 | 11.0% |
[ 1.5% - 2.0% ] 1.73% | 7,981,341 | 11.5% |
[ 2.0% - 2.5% ] 2.24% | 2,928,353 | 11.6% |
[ 2.5% - 3.0% ] 2.70% | 2,330,207 | 12.3% |
[ 3.0% - 3.5% ] 3.25% | 708,150 | 10.8% |
[ 3.5% - 4.0% ] 3.73% | 801,951 | 11.7% |
[ 4.0% - 4.5% ] 4.19% | 381,368 | 12.0% |
[ 4.5% - 5.0% ] 4.68% | 385,028 | 11.1% |
[ 5.0% - 5.5% ] 5.19% | 142,408 | 9.3% |
[ 5.5% - 6.0% ] 5.76% | 306,035 | 11.2% |
[ 6.0% - 6.5% ] 6.20% | 146,668 | 12.3% |
[ 6.5% - 7.0% ] 6.82% | 104,697 | 14.1% |
[ 7.0% - 7.5% ] 7.17% | 74,972 | 12.6% |
[ 7.5% - 8.0% ] 7.81% | 8,620 | 13.5% |
[ 8.0% - 8.5% ] 8.37% | 87,306 | 11.3% |
[ 8.5% - 9.0% ] 8.56% | 55,679 | 10.4% |
[ 9.0% - 9.5% ] 9.23% | 12,603 | 17.6% |
[ 9.5% - 10.0% ] 9.71% | 11,564 | 13.0% |
[ 10.0% - 10.5% ] 10.30% | 7,030 | 8.7% |
[ 10.5% - 11.0% ] 10.73% | 5,078 | 16.4% |
[ 11.0% - 11.5% ] 11.36% | 546 | 33.4% |
[ 11.5% - 12.0% ] 11.61% | 85,934 | 13.3% |
[ 12.0% - 12.5% ] 12.22% | 2,569 | 15.2% |
[ 12.5% - 13.0% ] 12.89% | 2,079 | 11.2% |
[ 13.0% - 13.5% ] 13.38% | 3,566 | 25.8% |
[ 13.5% - 14.0% ] 13.78% | 312 | 22.7% |
[ 14.0% - 14.5% ] 14.06% | 2,027 | 11.8% |
[ 14.5% - 15.0% ] 14.58% | 1,365 | 20.1% |
[ 15.0% - 15.5% ] 15.13% | 998 | 13.1% |
[ 15.5% - 16.0% ] 15.58% | 1,348 | 12.0% |
[ 16.0% - 16.5% ] 16.17% | 3,031 | 12.7% |
[ 16.5% - 17.0% ] 16.60% | 476 | 27.6% |
[ 17.0% - 17.5% ] 17.06% | 598 | 11.0% |
[ 17.5% - 18.0% ] 17.78% | 478 | 17.8% |
[ 18.0% - 18.5% ] 18.08% | 968 | 46.4% |
[ 19.5% - 20.0% ] 19.85% | 1,355 | 12.0% |
[ 20.5% - 21.0% ] 21.00% | 581 | 15.9% |
[ 21.5% - 22.0% ] 21.84% | 87 | 48.0% |
[ 22.0% - 22.5% ] 22.16% | 388 | 31.0% |
[ 23.5% - 24.0% ] 23.67% | 300 | 12.8% |
[ 25.0% - 25.5% ] 25.46% | 491 | 5.6% |
[ 25.5% - 26.0% ] 25.65% | 382 | 10.3% |
[ 30.5% - 31.0% ] 30.60% | 974 | 21.2% |
[ 31.0% - 31.5% ] 31.13% | 257 | 24.8% |
[ 33.0% - 33.5% ] 33.14% | 1,536 | 30.1% |
[ 34.0% - 34.5% ] 34.38% | 64 | 48.5% |
[ 47.0% - 47.5% ] 47.43% | 409 | 82.6% |
[ 88.5% - 89.0% ] 88.89% | 27 | 100.0% |