Ukrainian 1 or more Vehicles in Household
COMPARE
Ukrainian
Select to Compare
1 or more Vehicles in Household
Ukrainian 1 or more Vehicles in Household
89.6%
1+ VEHICLES AVAILABLE
42.4/ 100
METRIC RATING
182nd/ 347
METRIC RANK
Ukrainian 1 or more Vehicles in Household Correlation Chart
The statistical analysis conducted on geographies consisting of 448,299,681 people shows a mild positive correlation between the proportion of Ukrainians and percentage of households with 1 or more vehicles available in the United States with a correlation coefficient (R) of 0.345 and weighted average of 89.6%. On average, for every 1% (one percent) increase in Ukrainians within a typical geography, there is an increase of 0.14% in percentage of households with 1 or more vehicles available.
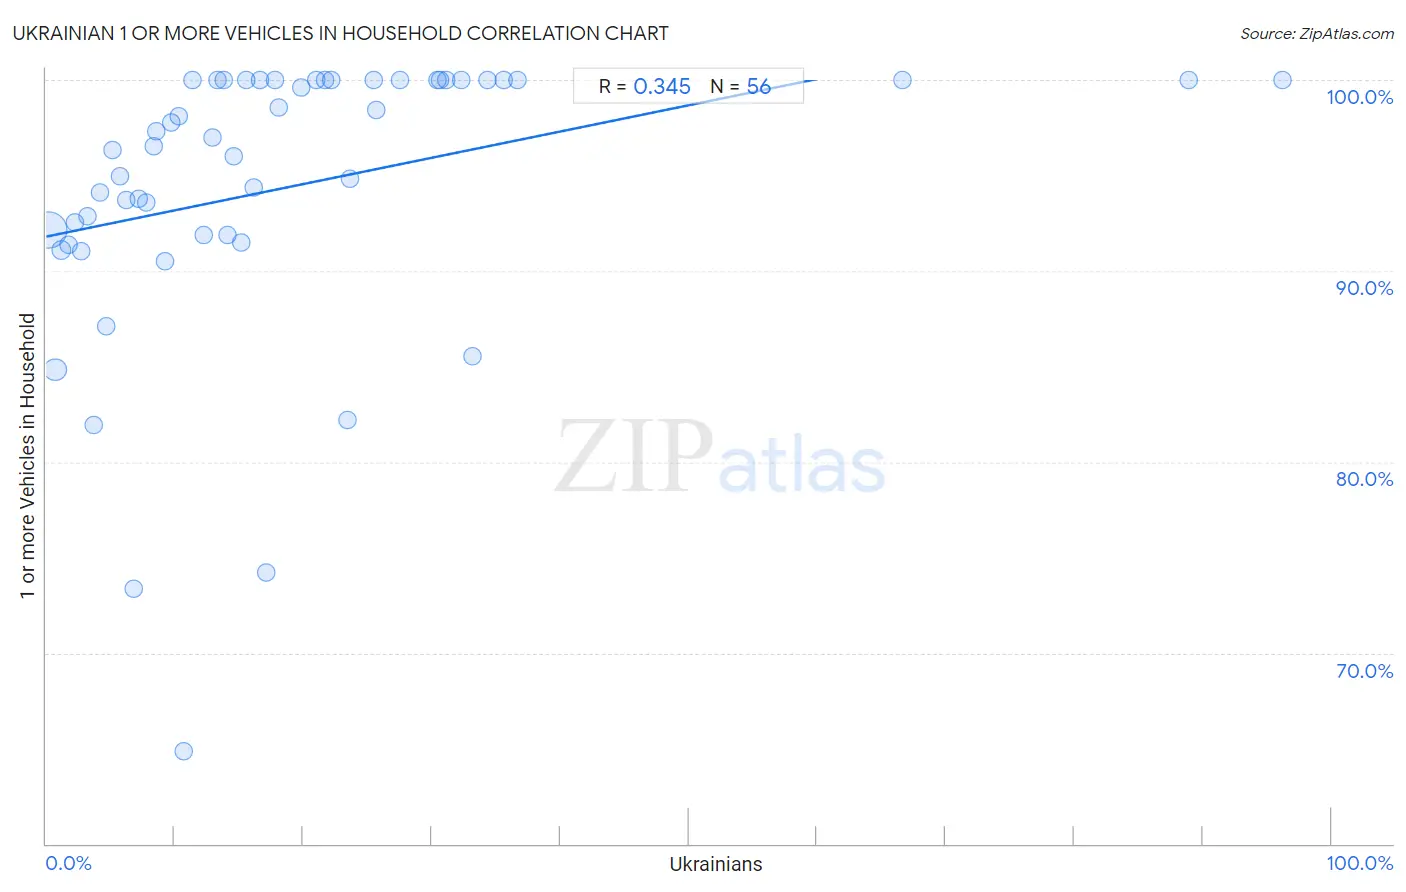
It is essential to understand that the correlation between the percentage of Ukrainians and percentage of households with 1 or more vehicles available does not imply a direct cause-and-effect relationship. It remains uncertain whether the presence of Ukrainians influences an upward or downward trend in the level of percentage of households with 1 or more vehicles available within an area, or if Ukrainians simply ended up residing in those areas with higher or lower levels of percentage of households with 1 or more vehicles available due to other factors.
Demographics Similar to Ukrainians by 1 or more Vehicles in Household
In terms of 1 or more vehicles in household, the demographic groups most similar to Ukrainians are Immigrants from Ethiopia (89.6%, a difference of 0.0%), Arab (89.6%, a difference of 0.010%), Ethiopian (89.6%, a difference of 0.020%), Immigrants from El Salvador (89.6%, a difference of 0.030%), and German Russian (89.6%, a difference of 0.030%).
| Demographics | Rating | Rank | 1 or more Vehicles in Household |
| Immigrants from Burma/Myanmar | 47.6 /100 | #175 | Average 89.7% |
| Immigrants from Sudan | 47.1 /100 | #176 | Average 89.7% |
| Hmong | 45.8 /100 | #177 | Average 89.6% |
| Immigrants from El Salvador | 44.1 /100 | #178 | Average 89.6% |
| German Russians | 44.0 /100 | #179 | Average 89.6% |
| Arabs | 43.3 /100 | #180 | Average 89.6% |
| Immigrants from Ethiopia | 42.5 /100 | #181 | Average 89.6% |
| Ukrainians | 42.4 /100 | #182 | Average 89.6% |
| Ethiopians | 41.2 /100 | #183 | Average 89.6% |
| Immigrants from Bulgaria | 40.7 /100 | #184 | Average 89.6% |
| Immigrants from Brazil | 40.1 /100 | #185 | Average 89.6% |
| Pueblo | 39.9 /100 | #186 | Fair 89.6% |
| South Americans | 39.6 /100 | #187 | Fair 89.5% |
| Immigrants from Nepal | 38.9 /100 | #188 | Fair 89.5% |
| Carpatho Rusyns | 37.8 /100 | #189 | Fair 89.5% |
Ukrainian 1 or more Vehicles in Household Correlation Summary
| Measurement | Ukrainian Data | 1 or more Vehicles in Household Data |
| Minimum | 0.19% | 64.9% |
| Maximum | 96.2% | 100.0% |
| Range | 96.0% | 35.1% |
| Mean | 18.8% | 94.4% |
| Median | 14.3% | 96.8% |
| Interquartile 25% (IQ1) | 7.0% | 91.9% |
| Interquartile 75% (IQ3) | 24.6% | 100.0% |
| Interquartile Range (IQR) | 17.6% | 8.1% |
| Standard Deviation (Sample) | 18.8% | 7.5% |
| Standard Deviation (Population) | 18.7% | 7.4% |
Correlation Details
| Ukrainian Percentile | Sample Size | 1 or more Vehicles in Household |
[ 0.0% - 0.5% ] 0.19% | 334,579,161 | 92.1% |
[ 0.5% - 1.0% ] 0.70% | 78,085,501 | 84.8% |
[ 1.0% - 1.5% ] 1.19% | 19,131,456 | 91.1% |
[ 1.5% - 2.0% ] 1.73% | 7,973,129 | 91.4% |
[ 2.0% - 2.5% ] 2.24% | 2,925,915 | 92.6% |
[ 2.5% - 3.0% ] 2.70% | 2,331,273 | 91.0% |
[ 3.0% - 3.5% ] 3.25% | 708,223 | 92.9% |
[ 3.5% - 4.0% ] 3.73% | 803,017 | 81.9% |
[ 4.0% - 4.5% ] 4.20% | 383,232 | 94.1% |
[ 4.5% - 5.0% ] 4.68% | 384,758 | 87.1% |
[ 5.0% - 5.5% ] 5.19% | 142,408 | 96.3% |
[ 5.5% - 6.0% ] 5.76% | 306,107 | 95.0% |
[ 6.0% - 6.5% ] 6.20% | 146,822 | 93.7% |
[ 6.5% - 7.0% ] 6.82% | 105,360 | 73.3% |
[ 7.0% - 7.5% ] 7.17% | 75,107 | 93.8% |
[ 7.5% - 8.0% ] 7.81% | 8,711 | 93.6% |
[ 8.0% - 8.5% ] 8.37% | 88,117 | 96.5% |
[ 8.5% - 9.0% ] 8.56% | 56,963 | 97.3% |
[ 9.0% - 9.5% ] 9.23% | 12,603 | 90.5% |
[ 9.5% - 10.0% ] 9.71% | 11,564 | 97.8% |
[ 10.0% - 10.5% ] 10.30% | 7,030 | 98.1% |
[ 10.5% - 11.0% ] 10.73% | 5,078 | 64.9% |
[ 11.0% - 11.5% ] 11.36% | 546 | 100.0% |
[ 12.0% - 12.5% ] 12.22% | 2,626 | 91.9% |
[ 12.5% - 13.0% ] 12.89% | 2,079 | 97.0% |
[ 13.0% - 13.5% ] 13.37% | 3,589 | 100.0% |
[ 13.5% - 14.0% ] 13.78% | 312 | 100.0% |
[ 14.0% - 14.5% ] 14.07% | 2,097 | 91.9% |
[ 14.5% - 15.0% ] 14.58% | 1,365 | 96.0% |
[ 15.0% - 15.5% ] 15.15% | 1,096 | 91.5% |
[ 15.5% - 16.0% ] 15.58% | 1,348 | 100.0% |
[ 16.0% - 16.5% ] 16.17% | 3,031 | 94.4% |
[ 16.5% - 17.0% ] 16.60% | 476 | 100.0% |
[ 17.0% - 17.5% ] 17.10% | 690 | 74.2% |
[ 17.5% - 18.0% ] 17.78% | 478 | 100.0% |
[ 18.0% - 18.5% ] 18.08% | 1,023 | 98.5% |
[ 19.5% - 20.0% ] 19.85% | 1,355 | 99.6% |
[ 20.5% - 21.0% ] 21.00% | 581 | 100.0% |
[ 21.5% - 22.0% ] 21.69% | 166 | 100.0% |
[ 22.0% - 22.5% ] 22.16% | 388 | 100.0% |
[ 23.0% - 23.5% ] 23.42% | 222 | 82.2% |
[ 23.5% - 24.0% ] 23.67% | 300 | 94.8% |
[ 25.0% - 25.5% ] 25.46% | 491 | 100.0% |
[ 25.5% - 26.0% ] 25.65% | 382 | 98.4% |
[ 27.0% - 27.5% ] 27.50% | 40 | 100.0% |
[ 30.0% - 30.5% ] 30.43% | 46 | 100.0% |
[ 30.5% - 31.0% ] 30.60% | 974 | 100.0% |
[ 31.0% - 31.5% ] 31.13% | 257 | 100.0% |
[ 32.0% - 32.5% ] 32.26% | 155 | 100.0% |
[ 33.0% - 33.5% ] 33.14% | 1,536 | 85.5% |
[ 34.0% - 34.5% ] 34.38% | 64 | 100.0% |
[ 35.5% - 36.0% ] 35.59% | 281 | 100.0% |
[ 36.5% - 37.0% ] 36.67% | 30 | 100.0% |
[ 66.5% - 67.0% ] 66.67% | 42 | 100.0% |
[ 88.5% - 89.0% ] 88.89% | 27 | 100.0% |
[ 96.0% - 96.5% ] 96.23% | 53 | 100.0% |