Syrian vs Immigrants from Bosnia and Herzegovina Wage/Income Gap
COMPARE
Syrian
Immigrants from Bosnia and Herzegovina
Wage/Income Gap
Wage/Income Gap Comparison
Syrians
Immigrants from Bosnia and Herzegovina
27.6%
WAGE/INCOME GAP
1.4/ 100
METRIC RATING
263rd/ 347
METRIC RANK
24.8%
WAGE/INCOME GAP
90.1/ 100
METRIC RATING
138th/ 347
METRIC RANK
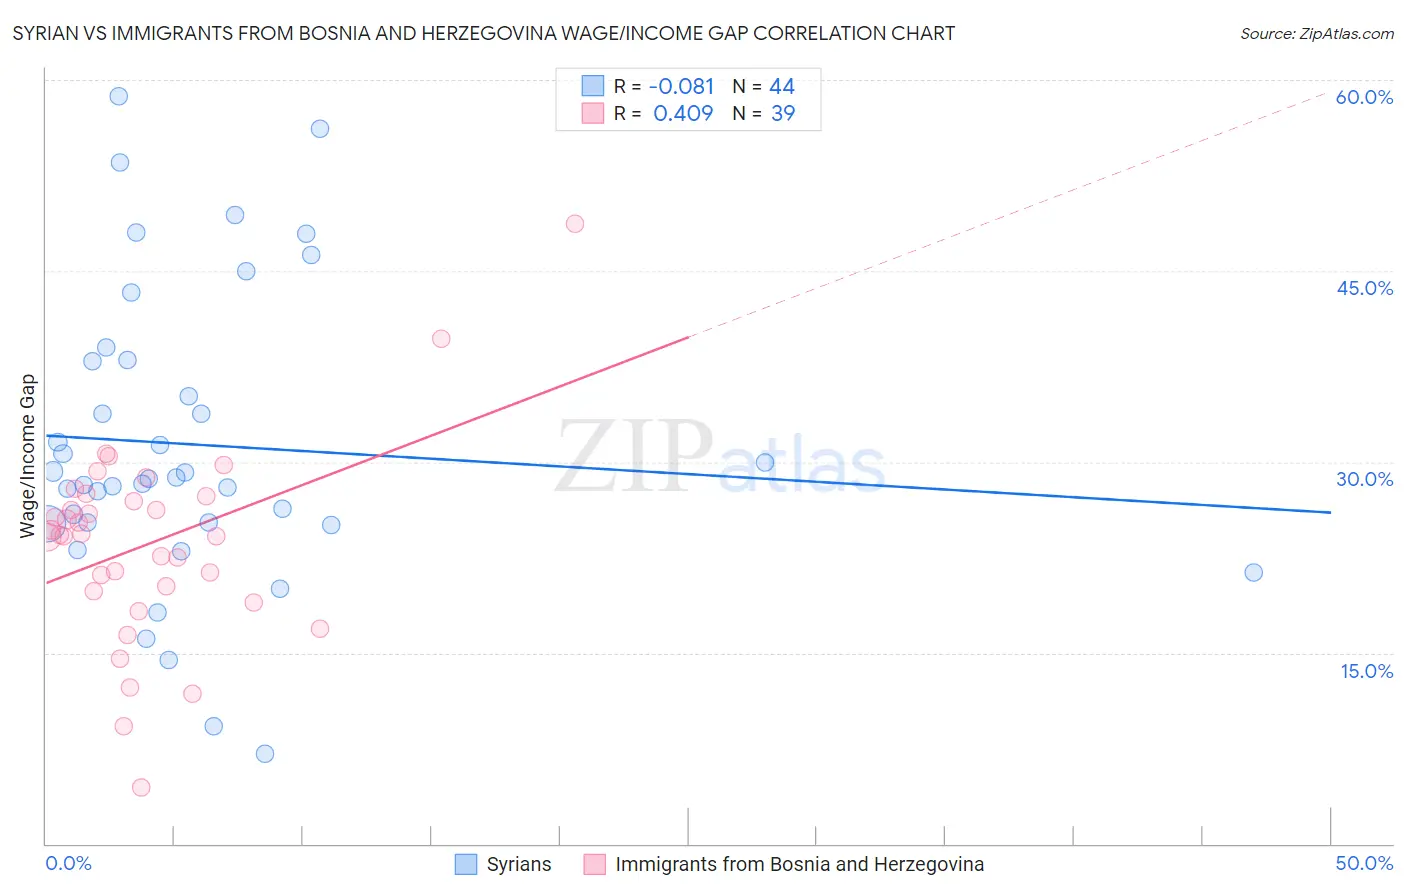
Syrian vs Immigrants from Bosnia and Herzegovina Wage/Income Gap Correlation Chart
The statistical analysis conducted on geographies consisting of 266,238,667 people shows a slight negative correlation between the proportion of Syrians and wage/income gap percentage in the United States with a correlation coefficient (R) of -0.081 and weighted average of 27.6%. Similarly, the statistical analysis conducted on geographies consisting of 156,794,982 people shows a moderate positive correlation between the proportion of Immigrants from Bosnia and Herzegovina and wage/income gap percentage in the United States with a correlation coefficient (R) of 0.409 and weighted average of 24.8%, a difference of 11.0%.
Wage/Income Gap Correlation Summary
| Measurement | Syrian | Immigrants from Bosnia and Herzegovina |
| Minimum | 7.1% | 4.5% |
| Maximum | 58.7% | 48.7% |
| Range | 51.6% | 44.3% |
| Mean | 31.3% | 23.6% |
| Median | 28.7% | 24.2% |
| Interquartile 25% (IQ1) | 25.2% | 19.9% |
| Interquartile 75% (IQ3) | 38.0% | 27.3% |
| Interquartile Range (IQR) | 12.8% | 7.4% |
| Standard Deviation (Sample) | 11.7% | 7.8% |
| Standard Deviation (Population) | 11.6% | 7.7% |
Similar Demographics by Wage/Income Gap
Demographics Similar to Syrians by Wage/Income Gap
In terms of wage/income gap, the demographic groups most similar to Syrians are Immigrants from Lebanon (27.5%, a difference of 0.090%), Immigrants from Germany (27.5%, a difference of 0.10%), Tongan (27.5%, a difference of 0.37%), Icelander (27.5%, a difference of 0.38%), and Immigrants from Switzerland (27.7%, a difference of 0.45%).
| Demographics | Rating | Rank | Wage/Income Gap |
| Cherokee | 1.9 /100 | #256 | Tragic 27.4% |
| Luxembourgers | 1.9 /100 | #257 | Tragic 27.4% |
| Slavs | 1.8 /100 | #258 | Tragic 27.4% |
| Icelanders | 1.8 /100 | #259 | Tragic 27.5% |
| Tongans | 1.7 /100 | #260 | Tragic 27.5% |
| Immigrants | Germany | 1.5 /100 | #261 | Tragic 27.5% |
| Immigrants | Lebanon | 1.5 /100 | #262 | Tragic 27.5% |
| Syrians | 1.4 /100 | #263 | Tragic 27.6% |
| Immigrants | Switzerland | 1.0 /100 | #264 | Tragic 27.7% |
| Serbians | 1.0 /100 | #265 | Tragic 27.7% |
| Hmong | 1.0 /100 | #266 | Tragic 27.7% |
| Turks | 1.0 /100 | #267 | Tragic 27.7% |
| New Zealanders | 1.0 /100 | #268 | Tragic 27.7% |
| Potawatomi | 0.9 /100 | #269 | Tragic 27.7% |
| Immigrants | Western Europe | 0.9 /100 | #270 | Tragic 27.8% |
Demographics Similar to Immigrants from Bosnia and Herzegovina by Wage/Income Gap
In terms of wage/income gap, the demographic groups most similar to Immigrants from Bosnia and Herzegovina are Hispanic or Latino (24.9%, a difference of 0.11%), Immigrants from Nepal (24.9%, a difference of 0.14%), Hawaiian (24.9%, a difference of 0.15%), Immigrants from South Eastern Asia (24.8%, a difference of 0.16%), and Armenian (24.8%, a difference of 0.25%).
| Demographics | Rating | Rank | Wage/Income Gap |
| Immigrants | Philippines | 93.0 /100 | #131 | Exceptional 24.7% |
| Immigrants | Costa Rica | 92.4 /100 | #132 | Exceptional 24.7% |
| Colombians | 92.4 /100 | #133 | Exceptional 24.7% |
| Mexican American Indians | 92.2 /100 | #134 | Exceptional 24.7% |
| South American Indians | 92.0 /100 | #135 | Exceptional 24.7% |
| Armenians | 91.3 /100 | #136 | Exceptional 24.8% |
| Immigrants | South Eastern Asia | 90.9 /100 | #137 | Exceptional 24.8% |
| Immigrants | Bosnia and Herzegovina | 90.1 /100 | #138 | Exceptional 24.8% |
| Hispanics or Latinos | 89.5 /100 | #139 | Excellent 24.9% |
| Immigrants | Nepal | 89.3 /100 | #140 | Excellent 24.9% |
| Hawaiians | 89.3 /100 | #141 | Excellent 24.9% |
| Afghans | 88.1 /100 | #142 | Excellent 24.9% |
| Immigrants | Uganda | 88.0 /100 | #143 | Excellent 24.9% |
| Chippewa | 86.9 /100 | #144 | Excellent 25.0% |
| Comanche | 85.2 /100 | #145 | Excellent 25.0% |