Syrian vs Immigrants from Grenada Wage/Income Gap
COMPARE
Syrian
Immigrants from Grenada
Wage/Income Gap
Wage/Income Gap Comparison
Syrians
Immigrants from Grenada
27.6%
WAGE/INCOME GAP
1.4/ 100
METRIC RATING
263rd/ 347
METRIC RANK
16.2%
WAGE/INCOME GAP
100.0/ 100
METRIC RATING
1st/ 347
METRIC RANK
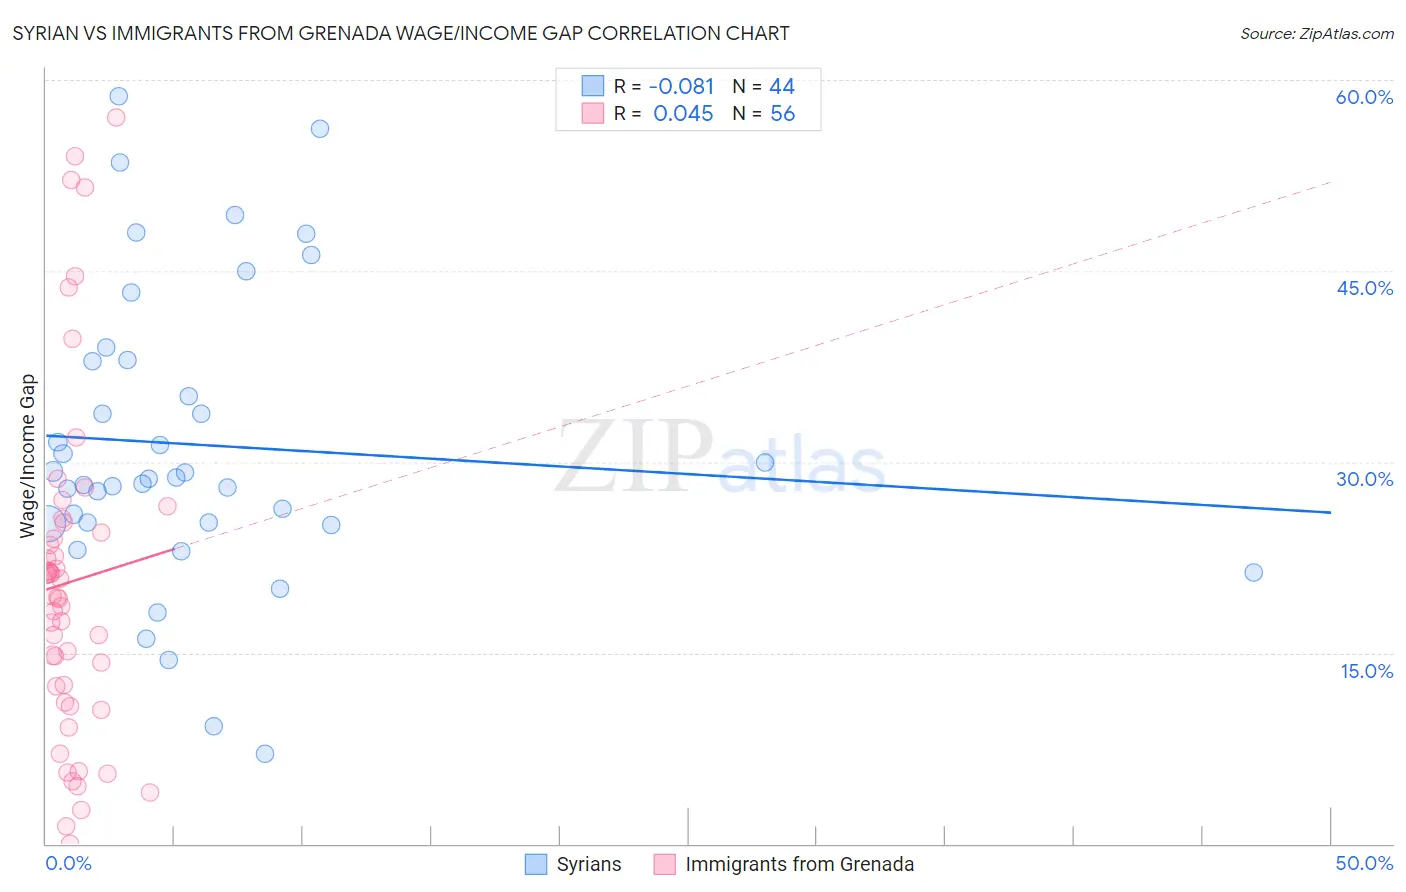
Syrian vs Immigrants from Grenada Wage/Income Gap Correlation Chart
The statistical analysis conducted on geographies consisting of 266,238,667 people shows a slight negative correlation between the proportion of Syrians and wage/income gap percentage in the United States with a correlation coefficient (R) of -0.081 and weighted average of 27.6%. Similarly, the statistical analysis conducted on geographies consisting of 67,191,325 people shows no correlation between the proportion of Immigrants from Grenada and wage/income gap percentage in the United States with a correlation coefficient (R) of 0.045 and weighted average of 16.2%, a difference of 70.5%.
Wage/Income Gap Correlation Summary
| Measurement | Syrian | Immigrants from Grenada |
| Minimum | 7.1% | 0.0034% |
| Maximum | 58.7% | 57.0% |
| Range | 51.6% | 57.0% |
| Mean | 31.3% | 20.6% |
| Median | 28.7% | 19.4% |
| Interquartile 25% (IQ1) | 25.2% | 11.7% |
| Interquartile 75% (IQ3) | 38.0% | 24.9% |
| Interquartile Range (IQR) | 12.8% | 13.1% |
| Standard Deviation (Sample) | 11.7% | 13.3% |
| Standard Deviation (Population) | 11.6% | 13.2% |
Similar Demographics by Wage/Income Gap
Demographics Similar to Syrians by Wage/Income Gap
In terms of wage/income gap, the demographic groups most similar to Syrians are Immigrants from Lebanon (27.5%, a difference of 0.090%), Immigrants from Germany (27.5%, a difference of 0.10%), Tongan (27.5%, a difference of 0.37%), Icelander (27.5%, a difference of 0.38%), and Immigrants from Switzerland (27.7%, a difference of 0.45%).
| Demographics | Rating | Rank | Wage/Income Gap |
| Cherokee | 1.9 /100 | #256 | Tragic 27.4% |
| Luxembourgers | 1.9 /100 | #257 | Tragic 27.4% |
| Slavs | 1.8 /100 | #258 | Tragic 27.4% |
| Icelanders | 1.8 /100 | #259 | Tragic 27.5% |
| Tongans | 1.7 /100 | #260 | Tragic 27.5% |
| Immigrants | Germany | 1.5 /100 | #261 | Tragic 27.5% |
| Immigrants | Lebanon | 1.5 /100 | #262 | Tragic 27.5% |
| Syrians | 1.4 /100 | #263 | Tragic 27.6% |
| Immigrants | Switzerland | 1.0 /100 | #264 | Tragic 27.7% |
| Serbians | 1.0 /100 | #265 | Tragic 27.7% |
| Hmong | 1.0 /100 | #266 | Tragic 27.7% |
| Turks | 1.0 /100 | #267 | Tragic 27.7% |
| New Zealanders | 1.0 /100 | #268 | Tragic 27.7% |
| Potawatomi | 0.9 /100 | #269 | Tragic 27.7% |
| Immigrants | Western Europe | 0.9 /100 | #270 | Tragic 27.8% |
Demographics Similar to Immigrants from Grenada by Wage/Income Gap
In terms of wage/income gap, the demographic groups most similar to Immigrants from Grenada are Immigrants from St. Vincent and the Grenadines (16.4%, a difference of 1.5%), Immigrants from Barbados (17.8%, a difference of 10.3%), British West Indian (18.0%, a difference of 11.4%), Guyanese (18.3%, a difference of 13.2%), and Immigrants from Guyana (18.4%, a difference of 13.5%).
| Demographics | Rating | Rank | Wage/Income Gap |
| Immigrants | Grenada | 100.0 /100 | #1 | Exceptional 16.2% |
| Immigrants | St. Vincent and the Grenadines | 100.0 /100 | #2 | Exceptional 16.4% |
| Immigrants | Barbados | 100.0 /100 | #3 | Exceptional 17.8% |
| British West Indians | 100.0 /100 | #4 | Exceptional 18.0% |
| Guyanese | 100.0 /100 | #5 | Exceptional 18.3% |
| Immigrants | Guyana | 100.0 /100 | #6 | Exceptional 18.4% |
| Puerto Ricans | 100.0 /100 | #7 | Exceptional 18.7% |
| Immigrants | Jamaica | 100.0 /100 | #8 | Exceptional 18.8% |
| Barbadians | 100.0 /100 | #9 | Exceptional 19.0% |
| Crow | 100.0 /100 | #10 | Exceptional 19.1% |
| Immigrants | Haiti | 100.0 /100 | #11 | Exceptional 19.2% |
| Immigrants | West Indies | 100.0 /100 | #12 | Exceptional 19.2% |
| Trinidadians and Tobagonians | 100.0 /100 | #13 | Exceptional 19.3% |
| Immigrants | Trinidad and Tobago | 100.0 /100 | #14 | Exceptional 19.3% |
| West Indians | 100.0 /100 | #15 | Exceptional 19.6% |