Puget Sound Salish 2 or more Vehicles in Household
COMPARE
Puget Sound Salish
Select to Compare
2 or more Vehicles in Household
Puget Sound Salish 2 or more Vehicles in Household
62.1%
2+ VEHICLES AVAILABLE
100.0/ 100
METRIC RATING
7th/ 347
METRIC RANK
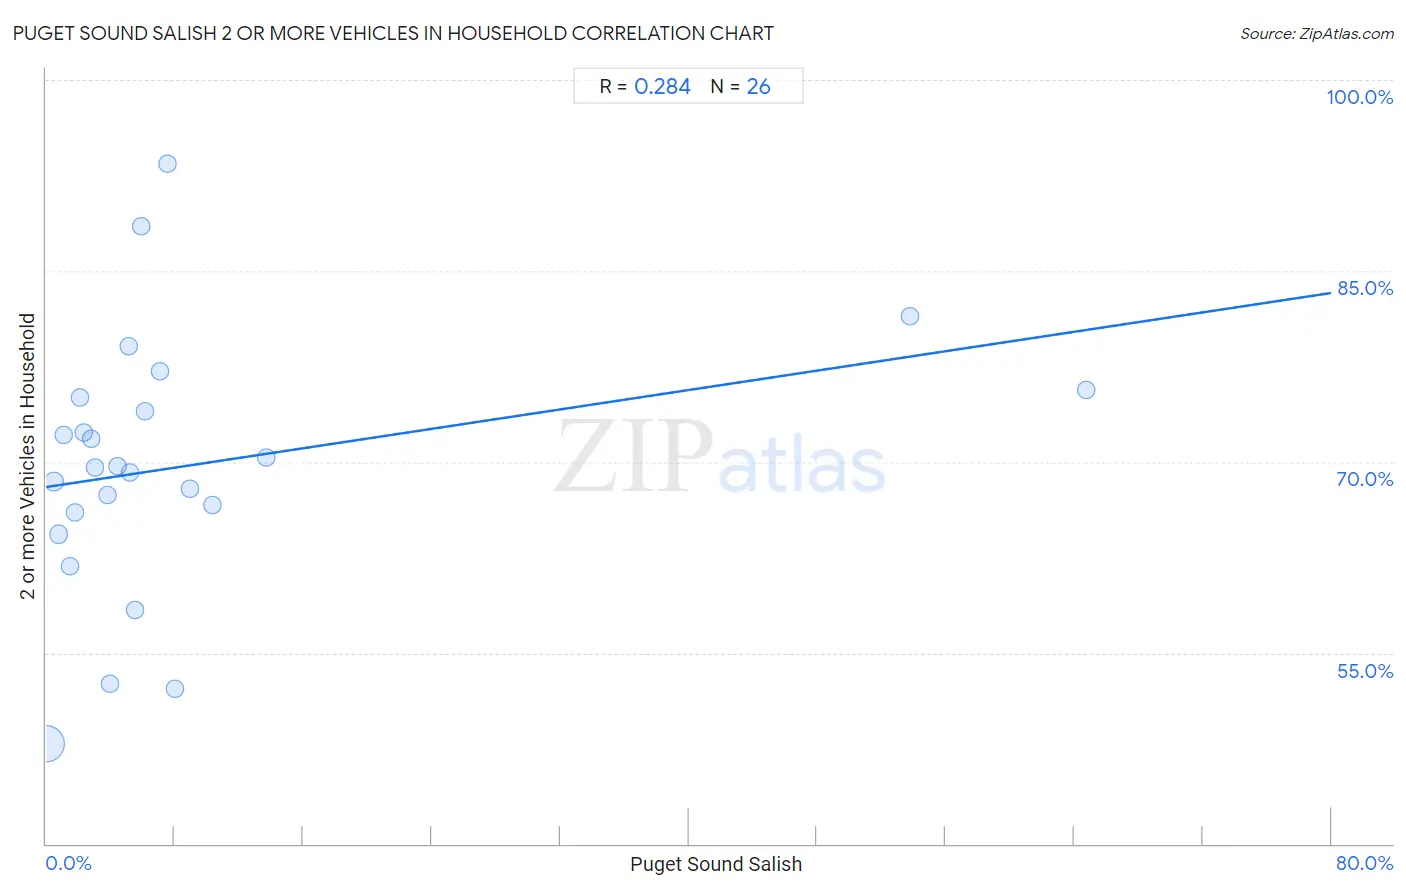
Puget Sound Salish 2 or more Vehicles in Household Correlation Chart
The statistical analysis conducted on geographies consisting of 46,155,865 people shows a weak positive correlation between the proportion of Puget Sound Salish and percentage of households with 2 or more vehicles available in the United States with a correlation coefficient (R) of 0.284 and weighted average of 62.1%. On average, for every 1% (one percent) increase in Puget Sound Salish within a typical geography, there is an increase of 0.19% in percentage of households with 2 or more vehicles available.
It is essential to understand that the correlation between the percentage of Puget Sound Salish and percentage of households with 2 or more vehicles available does not imply a direct cause-and-effect relationship. It remains uncertain whether the presence of Puget Sound Salish influences an upward or downward trend in the level of percentage of households with 2 or more vehicles available within an area, or if Puget Sound Salish simply ended up residing in those areas with higher or lower levels of percentage of households with 2 or more vehicles available due to other factors.
Demographics Similar to Puget Sound Salish by 2 or more Vehicles in Household
In terms of 2 or more vehicles in household, the demographic groups most similar to Puget Sound Salish are Scandinavian (62.1%, a difference of 0.060%), English (61.9%, a difference of 0.27%), Swedish (61.8%, a difference of 0.34%), Immigrants from Fiji (62.3%, a difference of 0.40%), and Mexican (61.7%, a difference of 0.62%).
| Demographics | Rating | Rank | 2 or more Vehicles in Household |
| Yakama | 100.0 /100 | #1 | Exceptional 64.9% |
| Tongans | 100.0 /100 | #2 | Exceptional 63.5% |
| Danes | 100.0 /100 | #3 | Exceptional 63.3% |
| Norwegians | 100.0 /100 | #4 | Exceptional 62.8% |
| Immigrants from Fiji | 100.0 /100 | #5 | Exceptional 62.3% |
| Scandinavians | 100.0 /100 | #6 | Exceptional 62.1% |
| Puget Sound Salish | 100.0 /100 | #7 | Exceptional 62.1% |
| English | 100.0 /100 | #8 | Exceptional 61.9% |
| Swedes | 100.0 /100 | #9 | Exceptional 61.8% |
| Mexicans | 100.0 /100 | #10 | Exceptional 61.7% |
| Dutch | 100.0 /100 | #11 | Exceptional 61.6% |
| Germans | 100.0 /100 | #12 | Exceptional 61.6% |
| Samoans | 100.0 /100 | #13 | Exceptional 61.5% |
| Czechs | 100.0 /100 | #14 | Exceptional 61.5% |
| Nepalese | 100.0 /100 | #15 | Exceptional 61.4% |
Puget Sound Salish 2 or more Vehicles in Household Correlation Summary
| Measurement | Puget Sound Salish Data | 2 or more Vehicles in Household Data |
| Minimum | 0.031% | 47.8% |
| Maximum | 64.8% | 93.4% |
| Range | 64.7% | 45.6% |
| Mean | 8.9% | 69.7% |
| Median | 4.8% | 69.6% |
| Interquartile 25% (IQ1) | 2.1% | 66.0% |
| Interquartile 75% (IQ3) | 7.6% | 75.0% |
| Interquartile Range (IQR) | 5.5% | 9.0% |
| Standard Deviation (Sample) | 15.3% | 10.3% |
| Standard Deviation (Population) | 15.0% | 10.1% |
Correlation Details
| Puget Sound Salish Percentile | Sample Size | 2 or more Vehicles in Household |
[ 0.0% - 0.5% ] 0.031% | 43,380,400 | 47.8% |
[ 0.0% - 0.5% ] 0.48% | 1,435,750 | 68.5% |
[ 0.5% - 1.0% ] 0.75% | 629,731 | 64.3% |
[ 1.0% - 1.5% ] 1.07% | 226,804 | 72.1% |
[ 1.5% - 2.0% ] 1.51% | 123,816 | 61.8% |
[ 1.5% - 2.0% ] 1.81% | 133,095 | 66.0% |
[ 2.0% - 2.5% ] 2.08% | 67,849 | 75.0% |
[ 2.0% - 2.5% ] 2.35% | 19,733 | 72.3% |
[ 2.5% - 3.0% ] 2.81% | 37,065 | 71.8% |
[ 3.0% - 3.5% ] 3.03% | 44,850 | 69.5% |
[ 3.5% - 4.0% ] 3.77% | 2,040 | 67.4% |
[ 3.5% - 4.0% ] 3.95% | 734 | 52.6% |
[ 4.0% - 4.5% ] 4.44% | 2,185 | 69.6% |
[ 5.0% - 5.5% ] 5.14% | 2,041 | 79.1% |
[ 5.0% - 5.5% ] 5.24% | 1,413 | 69.1% |
[ 5.5% - 6.0% ] 5.56% | 90 | 58.3% |
[ 5.5% - 6.0% ] 5.91% | 237 | 88.5% |
[ 6.0% - 6.5% ] 6.18% | 3,284 | 74.0% |
[ 7.0% - 7.5% ] 7.09% | 30,376 | 77.1% |
[ 7.5% - 8.0% ] 7.56% | 119 | 93.4% |
[ 8.0% - 8.5% ] 8.00% | 1,000 | 52.1% |
[ 8.5% - 9.0% ] 8.96% | 3,203 | 67.9% |
[ 10.0% - 10.5% ] 10.33% | 4,329 | 66.6% |
[ 13.5% - 14.0% ] 13.67% | 4,484 | 70.3% |
[ 53.5% - 54.0% ] 53.79% | 593 | 81.4% |
[ 64.5% - 65.0% ] 64.75% | 644 | 75.7% |