Puget Sound Salish Disability Age Under 5
COMPARE
Puget Sound Salish
Select to Compare
Disability Age Under 5
Puget Sound Salish Disability Age Under 5
0.97%
DISABILITY | AGE UNDER 5
100.0/ 100
METRIC RATING
19th/ 347
METRIC RANK
Puget Sound Salish Disability Age Under 5 Correlation Chart
The statistical analysis conducted on geographies consisting of 36,173,931 people shows a weak positive correlation between the proportion of Puget Sound Salish and percentage of population with a disability under the age of 5 in the United States with a correlation coefficient (R) of 0.201 and weighted average of 0.97%. On average, for every 1% (one percent) increase in Puget Sound Salish within a typical geography, there is an increase of 0.073% in percentage of population with a disability under the age of 5.
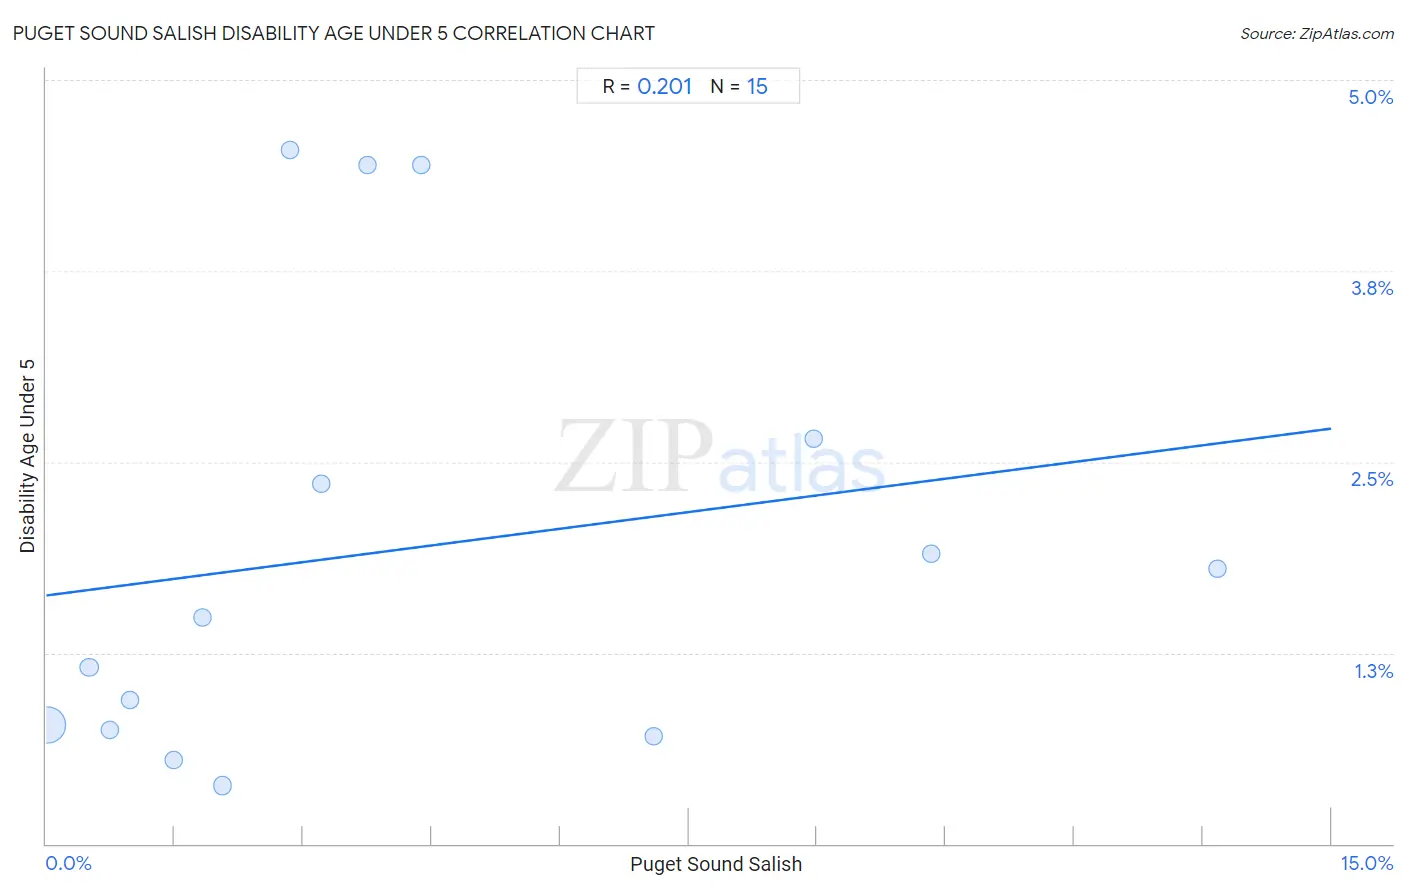
It is essential to understand that the correlation between the percentage of Puget Sound Salish and percentage of population with a disability under the age of 5 does not imply a direct cause-and-effect relationship. It remains uncertain whether the presence of Puget Sound Salish influences an upward or downward trend in the level of percentage of population with a disability under the age of 5 within an area, or if Puget Sound Salish simply ended up residing in those areas with higher or lower levels of percentage of population with a disability under the age of 5 due to other factors.
Demographics Similar to Puget Sound Salish by Disability Age Under 5
In terms of disability age under 5, the demographic groups most similar to Puget Sound Salish are Nepalese (0.97%, a difference of 0.10%), Immigrants from Barbados (0.97%, a difference of 0.37%), Immigrants from China (0.96%, a difference of 0.95%), Immigrants from Israel (0.96%, a difference of 1.4%), and British West Indian (0.99%, a difference of 1.9%).
| Demographics | Rating | Rank | Disability Age Under 5 |
| Immigrants from Grenada | 100.0 /100 | #12 | Exceptional 0.94% |
| Soviet Union | 100.0 /100 | #13 | Exceptional 0.95% |
| Yuman | 100.0 /100 | #14 | Exceptional 0.95% |
| Immigrants from Hong Kong | 100.0 /100 | #15 | Exceptional 0.95% |
| Immigrants from Israel | 100.0 /100 | #16 | Exceptional 0.96% |
| Immigrants from China | 100.0 /100 | #17 | Exceptional 0.96% |
| Immigrants from Barbados | 100.0 /100 | #18 | Exceptional 0.97% |
| Puget Sound Salish | 100.0 /100 | #19 | Exceptional 0.97% |
| Nepalese | 100.0 /100 | #20 | Exceptional 0.97% |
| British West Indians | 100.0 /100 | #21 | Exceptional 0.99% |
| Immigrants from Iran | 100.0 /100 | #22 | Exceptional 1.00% |
| Yakama | 100.0 /100 | #23 | Exceptional 1.00% |
| Indians (Asian) | 100.0 /100 | #24 | Exceptional 1.0% |
| Immigrants from Micronesia | 100.0 /100 | #25 | Exceptional 1.0% |
| Immigrants from Taiwan | 100.0 /100 | #26 | Exceptional 1.0% |
Puget Sound Salish Disability Age Under 5 Correlation Summary
| Measurement | Puget Sound Salish Data | Disability Age Under 5 Data |
| Minimum | 0.020% | 0.38% |
| Maximum | 13.7% | 4.5% |
| Range | 13.7% | 4.2% |
| Mean | 4.1% | 1.9% |
| Median | 2.8% | 1.5% |
| Interquartile 25% (IQ1) | 0.97% | 0.75% |
| Interquartile 75% (IQ3) | 7.1% | 2.7% |
| Interquartile Range (IQR) | 6.1% | 1.9% |
| Standard Deviation (Sample) | 4.1% | 1.5% |
| Standard Deviation (Population) | 3.9% | 1.4% |
Correlation Details
| Puget Sound Salish Percentile | Sample Size | Disability Age Under 5 |
[ 0.0% - 0.5% ] 0.020% | 34,818,484 | 0.78% |
[ 0.5% - 1.0% ] 0.50% | 649,097 | 1.2% |
[ 0.5% - 1.0% ] 0.74% | 434,824 | 0.75% |
[ 0.5% - 1.0% ] 0.97% | 25,757 | 0.94% |
[ 1.0% - 1.5% ] 1.49% | 37,445 | 0.55% |
[ 1.5% - 2.0% ] 1.83% | 103,600 | 1.5% |
[ 2.0% - 2.5% ] 2.06% | 54,232 | 0.38% |
[ 2.5% - 3.0% ] 2.84% | 352 | 4.5% |
[ 3.0% - 3.5% ] 3.21% | 6,080 | 2.4% |
[ 3.5% - 4.0% ] 3.75% | 959 | 4.4% |
[ 4.0% - 4.5% ] 4.37% | 823 | 4.4% |
[ 7.0% - 7.5% ] 7.09% | 30,262 | 0.70% |
[ 8.5% - 9.0% ] 8.96% | 3,203 | 2.7% |
[ 10.0% - 10.5% ] 10.33% | 4,329 | 1.9% |
[ 13.5% - 14.0% ] 13.67% | 4,484 | 1.8% |