Nigerian 2 or more Vehicles in Household
COMPARE
Nigerian
Select to Compare
2 or more Vehicles in Household
Nigerian 2 or more Vehicles in Household
52.8%
2+ VEHICLES AVAILABLE
0.9/ 100
METRIC RATING
253rd/ 347
METRIC RANK
Nigerian 2 or more Vehicles in Household Correlation Chart
The statistical analysis conducted on geographies consisting of 332,498,440 people shows a poor negative correlation between the proportion of Nigerians and percentage of households with 2 or more vehicles available in the United States with a correlation coefficient (R) of -0.108 and weighted average of 52.8%. On average, for every 1% (one percent) increase in Nigerians within a typical geography, there is a decrease of 0.21% in percentage of households with 2 or more vehicles available.
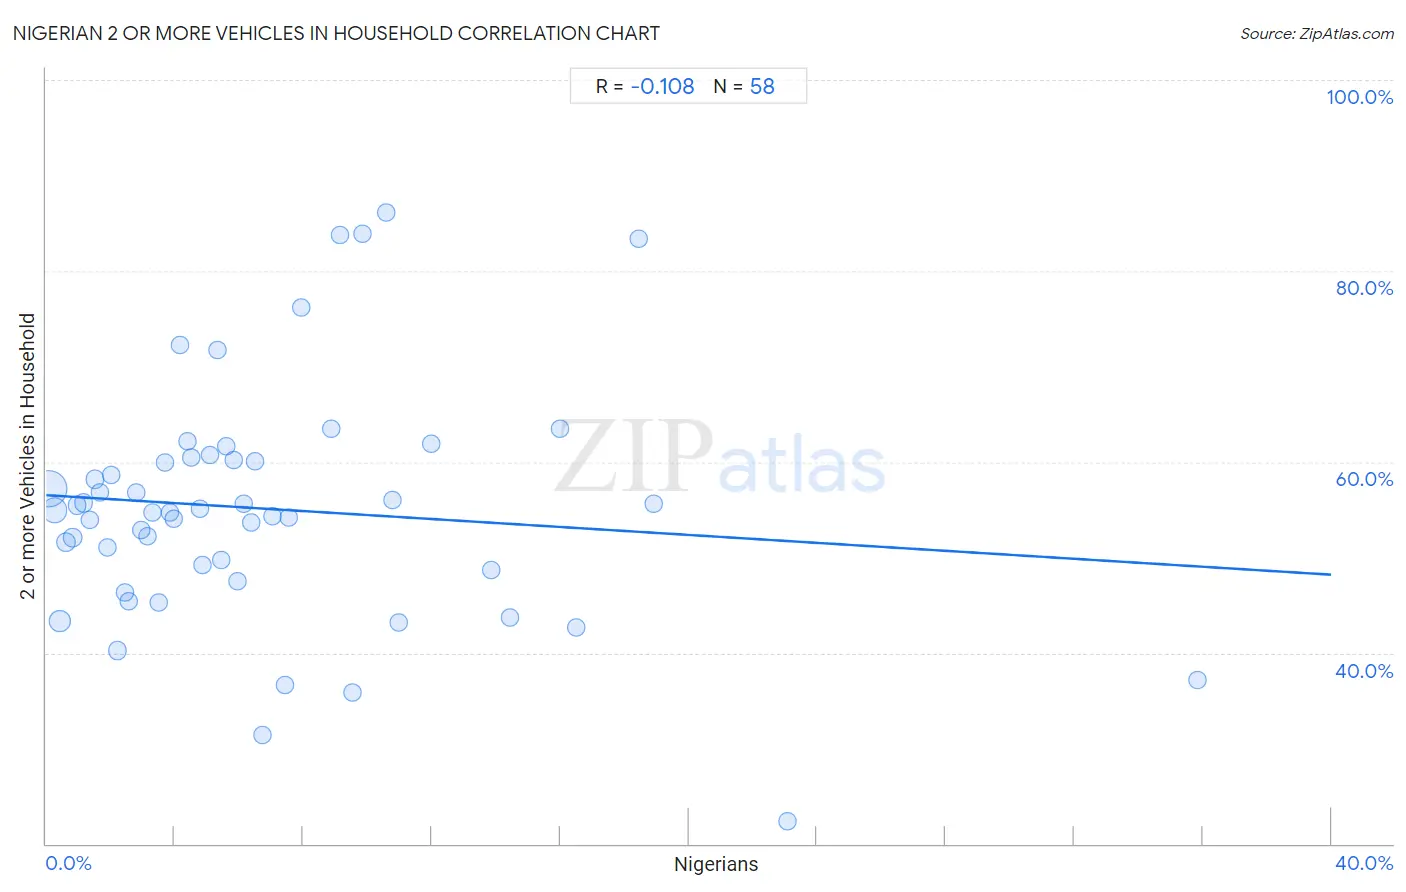
It is essential to understand that the correlation between the percentage of Nigerians and percentage of households with 2 or more vehicles available does not imply a direct cause-and-effect relationship. It remains uncertain whether the presence of Nigerians influences an upward or downward trend in the level of percentage of households with 2 or more vehicles available within an area, or if Nigerians simply ended up residing in those areas with higher or lower levels of percentage of households with 2 or more vehicles available due to other factors.
Demographics Similar to Nigerians by 2 or more Vehicles in Household
In terms of 2 or more vehicles in household, the demographic groups most similar to Nigerians are Immigrants from Portugal (52.8%, a difference of 0.050%), Immigrants from Sudan (52.8%, a difference of 0.060%), Immigrants from Brazil (52.8%, a difference of 0.10%), Mongolian (52.8%, a difference of 0.10%), and Colombian (52.9%, a difference of 0.15%).
| Demographics | Rating | Rank | 2 or more Vehicles in Household |
| Immigrants from Nigeria | 1.2 /100 | #246 | Tragic 52.9% |
| Sierra Leoneans | 1.2 /100 | #247 | Tragic 52.9% |
| Colombians | 1.1 /100 | #248 | Tragic 52.9% |
| Immigrants from Brazil | 1.0 /100 | #249 | Tragic 52.8% |
| Mongolians | 1.0 /100 | #250 | Tragic 52.8% |
| Immigrants from Sudan | 1.0 /100 | #251 | Tragic 52.8% |
| Immigrants from Portugal | 1.0 /100 | #252 | Tragic 52.8% |
| Nigerians | 0.9 /100 | #253 | Tragic 52.8% |
| Immigrants from Malaysia | 0.8 /100 | #254 | Tragic 52.7% |
| Uruguayans | 0.7 /100 | #255 | Tragic 52.7% |
| Immigrants from Eritrea | 0.7 /100 | #256 | Tragic 52.6% |
| Immigrants from Hong Kong | 0.6 /100 | #257 | Tragic 52.6% |
| Central American Indians | 0.6 /100 | #258 | Tragic 52.5% |
| Alsatians | 0.6 /100 | #259 | Tragic 52.5% |
| Immigrants from Bahamas | 0.5 /100 | #260 | Tragic 52.5% |
Nigerian 2 or more Vehicles in Household Correlation Summary
| Measurement | Nigerian Data | 2 or more Vehicles in Household Data |
| Minimum | 0.080% | 22.3% |
| Maximum | 35.8% | 86.1% |
| Range | 35.7% | 63.8% |
| Mean | 6.9% | 55.1% |
| Median | 5.2% | 54.8% |
| Interquartile 25% (IQ1) | 2.6% | 48.7% |
| Interquartile 75% (IQ3) | 9.1% | 60.2% |
| Interquartile Range (IQR) | 6.6% | 11.5% |
| Standard Deviation (Sample) | 6.4% | 12.4% |
| Standard Deviation (Population) | 6.4% | 12.3% |
Correlation Details
| Nigerian Percentile | Sample Size | 2 or more Vehicles in Household |
[ 0.0% - 0.5% ] 0.080% | 178,193,370 | 57.2% |
[ 0.0% - 0.5% ] 0.25% | 65,665,828 | 54.9% |
[ 0.0% - 0.5% ] 0.42% | 38,770,376 | 43.3% |
[ 0.5% - 1.0% ] 0.61% | 17,209,963 | 51.6% |
[ 0.5% - 1.0% ] 0.81% | 9,183,047 | 52.0% |
[ 0.5% - 1.0% ] 0.96% | 7,772,095 | 55.5% |
[ 1.0% - 1.5% ] 1.17% | 3,807,964 | 55.7% |
[ 1.0% - 1.5% ] 1.34% | 2,893,308 | 54.0% |
[ 1.5% - 2.0% ] 1.53% | 1,312,985 | 58.2% |
[ 1.5% - 2.0% ] 1.69% | 1,323,774 | 56.9% |
[ 1.5% - 2.0% ] 1.90% | 827,158 | 51.1% |
[ 2.0% - 2.5% ] 2.04% | 808,329 | 58.6% |
[ 2.0% - 2.5% ] 2.22% | 795,469 | 40.2% |
[ 2.0% - 2.5% ] 2.43% | 615,058 | 46.4% |
[ 2.5% - 3.0% ] 2.59% | 324,855 | 45.4% |
[ 2.5% - 3.0% ] 2.79% | 201,517 | 56.8% |
[ 2.5% - 3.0% ] 2.95% | 298,237 | 52.8% |
[ 3.0% - 3.5% ] 3.14% | 220,517 | 52.2% |
[ 3.0% - 3.5% ] 3.32% | 194,173 | 54.7% |
[ 3.0% - 3.5% ] 3.49% | 207,368 | 45.3% |
[ 3.5% - 4.0% ] 3.68% | 141,870 | 59.9% |
[ 3.5% - 4.0% ] 3.86% | 81,445 | 54.8% |
[ 3.5% - 4.0% ] 3.98% | 184,387 | 54.0% |
[ 4.0% - 4.5% ] 4.18% | 205,786 | 72.3% |
[ 4.0% - 4.5% ] 4.41% | 68,599 | 62.2% |
[ 4.5% - 5.0% ] 4.50% | 92,098 | 60.4% |
[ 4.5% - 5.0% ] 4.79% | 92,124 | 55.1% |
[ 4.5% - 5.0% ] 4.88% | 182,400 | 49.2% |
[ 5.0% - 5.5% ] 5.08% | 1,575 | 60.7% |
[ 5.0% - 5.5% ] 5.31% | 43,686 | 71.7% |
[ 5.0% - 5.5% ] 5.44% | 97,100 | 49.8% |
[ 5.5% - 6.0% ] 5.60% | 110,099 | 61.6% |
[ 5.5% - 6.0% ] 5.82% | 70,078 | 60.2% |
[ 5.5% - 6.0% ] 5.95% | 70,197 | 47.5% |
[ 6.0% - 6.5% ] 6.15% | 26,141 | 55.6% |
[ 6.0% - 6.5% ] 6.37% | 8,205 | 53.6% |
[ 6.5% - 7.0% ] 6.51% | 123,135 | 60.1% |
[ 6.5% - 7.0% ] 6.75% | 47,967 | 31.4% |
[ 7.0% - 7.5% ] 7.05% | 723 | 54.3% |
[ 7.0% - 7.5% ] 7.41% | 526 | 36.6% |
[ 7.5% - 8.0% ] 7.56% | 55,876 | 54.2% |
[ 7.5% - 8.0% ] 7.95% | 667 | 76.1% |
[ 8.5% - 9.0% ] 8.88% | 116,587 | 63.4% |
[ 9.0% - 9.5% ] 9.15% | 2,351 | 83.7% |
[ 9.5% - 10.0% ] 9.54% | 12,487 | 35.8% |
[ 9.5% - 10.0% ] 9.83% | 2,299 | 83.9% |
[ 10.5% - 11.0% ] 10.58% | 4,375 | 86.1% |
[ 10.5% - 11.0% ] 10.78% | 1,382 | 56.0% |
[ 10.5% - 11.0% ] 10.97% | 1,030 | 43.1% |
[ 12.0% - 12.5% ] 12.00% | 1,875 | 61.9% |
[ 13.5% - 14.0% ] 13.85% | 13,192 | 48.7% |
[ 14.0% - 14.5% ] 14.44% | 2,348 | 43.7% |
[ 15.5% - 16.0% ] 15.99% | 3,914 | 63.5% |
[ 16.0% - 16.5% ] 16.48% | 182 | 42.6% |
[ 18.0% - 18.5% ] 18.45% | 737 | 83.4% |
[ 18.5% - 19.0% ] 18.91% | 5,331 | 55.6% |
[ 23.0% - 23.5% ] 23.08% | 208 | 22.3% |
[ 35.5% - 36.0% ] 35.82% | 67 | 37.1% |