Nigerian Disability
COMPARE
Nigerian
Select to Compare
Disability
Nigerian Disability
11.5%
DISABILITY
81.3/ 100
METRIC RATING
145th/ 347
METRIC RANK
Nigerian Disability Correlation Chart
The statistical analysis conducted on geographies consisting of 332,745,371 people shows a substantial positive correlation between the proportion of Nigerians and percentage of population with a disability in the United States with a correlation coefficient (R) of 0.564 and weighted average of 11.5%. On average, for every 1% (one percent) increase in Nigerians within a typical geography, there is an increase of 0.52% in percentage of population with a disability.
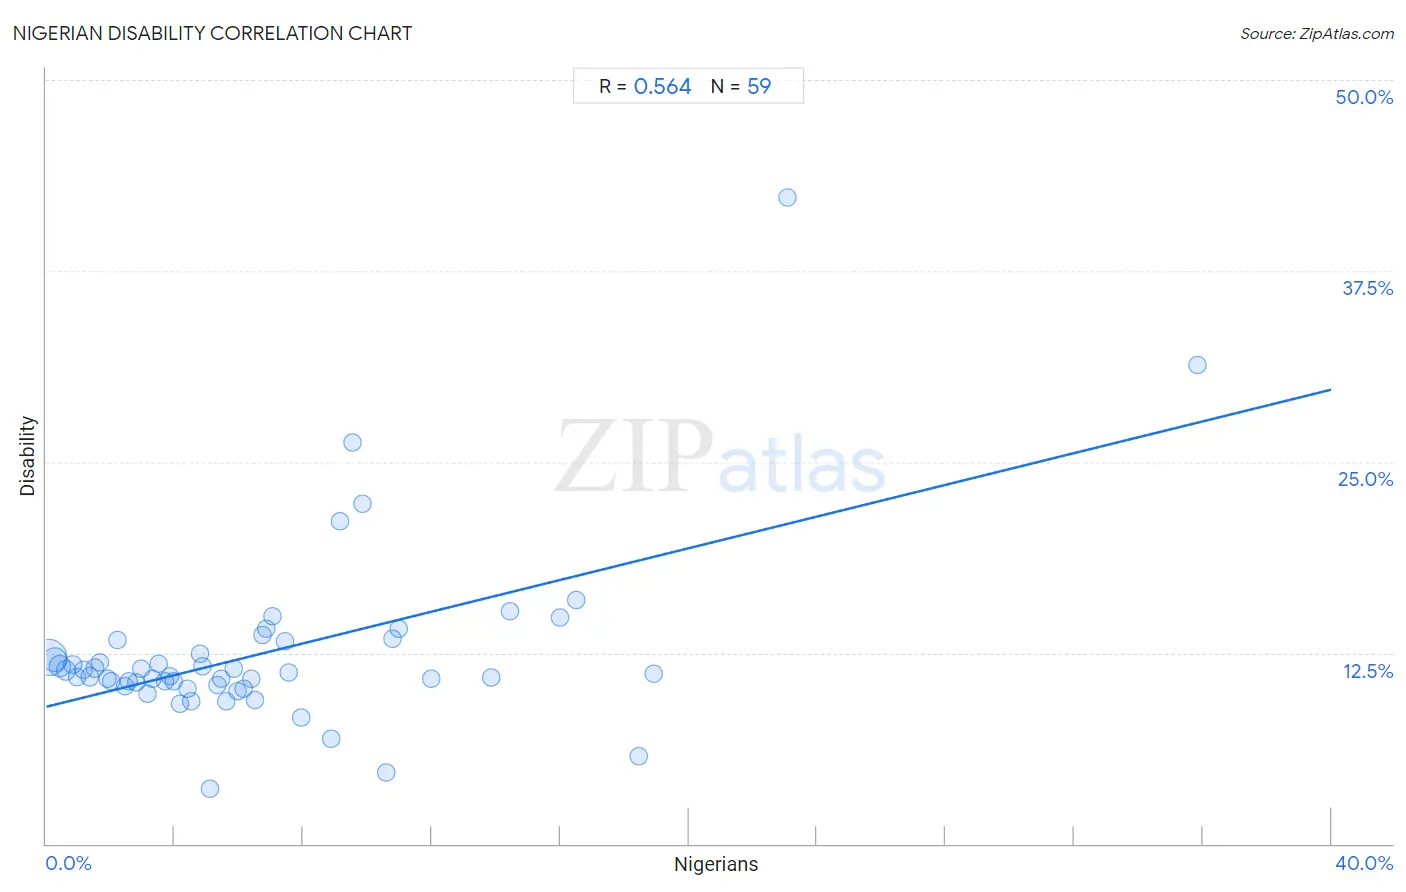
It is essential to understand that the correlation between the percentage of Nigerians and percentage of population with a disability does not imply a direct cause-and-effect relationship. It remains uncertain whether the presence of Nigerians influences an upward or downward trend in the level of percentage of population with a disability within an area, or if Nigerians simply ended up residing in those areas with higher or lower levels of percentage of population with a disability due to other factors.
Demographics Similar to Nigerians by Disability
In terms of disability, the demographic groups most similar to Nigerians are Australian (11.5%, a difference of 0.090%), Moroccan (11.5%, a difference of 0.15%), Immigrants from Hungary (11.5%, a difference of 0.16%), Immigrants from Ukraine (11.5%, a difference of 0.26%), and Sudanese (11.5%, a difference of 0.29%).
| Demographics | Rating | Rank | Disability |
| New Zealanders | 87.0 /100 | #138 | Excellent 11.5% |
| Ghanaians | 87.0 /100 | #139 | Excellent 11.5% |
| Russians | 86.8 /100 | #140 | Excellent 11.5% |
| Immigrants from Grenada | 86.1 /100 | #141 | Excellent 11.5% |
| Immigrants from Sudan | 85.3 /100 | #142 | Excellent 11.5% |
| Moroccans | 83.3 /100 | #143 | Excellent 11.5% |
| Australians | 82.5 /100 | #144 | Excellent 11.5% |
| Nigerians | 81.3 /100 | #145 | Excellent 11.5% |
| Immigrants from Hungary | 79.0 /100 | #146 | Good 11.5% |
| Immigrants from Ukraine | 77.6 /100 | #147 | Good 11.5% |
| Sudanese | 77.1 /100 | #148 | Good 11.5% |
| Immigrants from Norway | 73.2 /100 | #149 | Good 11.6% |
| Romanians | 72.7 /100 | #150 | Good 11.6% |
| Immigrants from Kenya | 72.1 /100 | #151 | Good 11.6% |
| Immigrants from Moldova | 72.0 /100 | #152 | Good 11.6% |
Nigerian Disability Correlation Summary
| Measurement | Nigerian Data | Disability Data |
| Minimum | 0.080% | 3.6% |
| Maximum | 35.8% | 42.3% |
| Range | 35.7% | 38.7% |
| Mean | 6.9% | 12.5% |
| Median | 5.3% | 11.1% |
| Interquartile 25% (IQ1) | 2.6% | 10.4% |
| Interquartile 75% (IQ3) | 9.1% | 13.3% |
| Interquartile Range (IQR) | 6.6% | 2.9% |
| Standard Deviation (Sample) | 6.4% | 5.9% |
| Standard Deviation (Population) | 6.3% | 5.8% |
Correlation Details
| Nigerian Percentile | Sample Size | Disability |
[ 0.0% - 0.5% ] 0.080% | 178,251,185 | 12.2% |
[ 0.0% - 0.5% ] 0.25% | 65,734,669 | 12.0% |
[ 0.0% - 0.5% ] 0.42% | 38,810,040 | 11.6% |
[ 0.5% - 1.0% ] 0.61% | 17,231,535 | 11.4% |
[ 0.5% - 1.0% ] 0.81% | 9,202,613 | 11.7% |
[ 0.5% - 1.0% ] 0.96% | 7,784,300 | 10.9% |
[ 1.0% - 1.5% ] 1.17% | 3,809,481 | 11.4% |
[ 1.0% - 1.5% ] 1.34% | 2,893,835 | 10.9% |
[ 1.5% - 2.0% ] 1.53% | 1,312,699 | 11.5% |
[ 1.5% - 2.0% ] 1.69% | 1,324,559 | 11.8% |
[ 1.5% - 2.0% ] 1.90% | 830,117 | 10.8% |
[ 2.0% - 2.5% ] 2.04% | 810,987 | 10.6% |
[ 2.0% - 2.5% ] 2.22% | 800,480 | 13.3% |
[ 2.0% - 2.5% ] 2.43% | 615,816 | 10.3% |
[ 2.5% - 3.0% ] 2.59% | 324,855 | 10.6% |
[ 2.5% - 3.0% ] 2.79% | 201,271 | 10.6% |
[ 2.5% - 3.0% ] 2.95% | 299,076 | 11.5% |
[ 3.0% - 3.5% ] 3.14% | 220,517 | 9.8% |
[ 3.0% - 3.5% ] 3.32% | 194,173 | 10.8% |
[ 3.0% - 3.5% ] 3.49% | 207,480 | 11.8% |
[ 3.5% - 4.0% ] 3.68% | 141,870 | 10.7% |
[ 3.5% - 4.0% ] 3.86% | 81,445 | 11.0% |
[ 3.5% - 4.0% ] 3.98% | 188,551 | 10.7% |
[ 4.0% - 4.5% ] 4.18% | 205,786 | 9.2% |
[ 4.0% - 4.5% ] 4.41% | 68,599 | 10.2% |
[ 4.5% - 5.0% ] 4.51% | 96,408 | 9.3% |
[ 4.5% - 5.0% ] 4.79% | 92,124 | 12.4% |
[ 4.5% - 5.0% ] 4.88% | 182,400 | 11.6% |
[ 5.0% - 5.5% ] 5.08% | 1,575 | 3.6% |
[ 5.0% - 5.5% ] 5.31% | 43,686 | 10.4% |
[ 5.0% - 5.5% ] 5.44% | 97,100 | 10.8% |
[ 5.5% - 6.0% ] 5.60% | 112,276 | 9.4% |
[ 5.5% - 6.0% ] 5.82% | 70,078 | 11.5% |
[ 5.5% - 6.0% ] 5.95% | 70,197 | 10.0% |
[ 6.0% - 6.5% ] 6.15% | 26,141 | 10.1% |
[ 6.0% - 6.5% ] 6.37% | 8,205 | 10.8% |
[ 6.5% - 7.0% ] 6.51% | 123,135 | 9.5% |
[ 6.5% - 7.0% ] 6.75% | 47,967 | 13.7% |
[ 6.5% - 7.0% ] 6.86% | 1,093 | 14.1% |
[ 7.0% - 7.5% ] 7.06% | 1,317 | 14.9% |
[ 7.0% - 7.5% ] 7.42% | 822 | 13.3% |
[ 7.5% - 8.0% ] 7.56% | 55,876 | 11.2% |
[ 7.5% - 8.0% ] 7.95% | 667 | 8.2% |
[ 8.5% - 9.0% ] 8.88% | 116,587 | 6.9% |
[ 9.0% - 9.5% ] 9.15% | 2,351 | 21.1% |
[ 9.5% - 10.0% ] 9.54% | 12,487 | 26.3% |
[ 9.5% - 10.0% ] 9.83% | 2,299 | 22.2% |
[ 10.5% - 11.0% ] 10.58% | 4,375 | 4.7% |
[ 10.5% - 11.0% ] 10.78% | 1,382 | 13.4% |
[ 10.5% - 11.0% ] 10.97% | 1,030 | 14.1% |
[ 12.0% - 12.5% ] 12.00% | 1,875 | 10.8% |
[ 13.5% - 14.0% ] 13.85% | 13,192 | 10.9% |
[ 14.0% - 14.5% ] 14.44% | 2,348 | 15.2% |
[ 15.5% - 16.0% ] 15.99% | 3,914 | 14.8% |
[ 16.0% - 16.5% ] 16.48% | 182 | 15.9% |
[ 18.0% - 18.5% ] 18.45% | 737 | 5.7% |
[ 18.5% - 19.0% ] 18.91% | 5,331 | 11.1% |
[ 23.0% - 23.5% ] 23.08% | 208 | 42.3% |
[ 35.5% - 36.0% ] 35.82% | 67 | 31.3% |