Immigrants vs Immigrants from Latvia Wage/Income Gap
COMPARE
Immigrants
Immigrants from Latvia
Wage/Income Gap
Wage/Income Gap Comparison
Immigrants
Immigrants from Latvia
25.1%
WAGE/INCOME GAP
82.3/ 100
METRIC RATING
150th/ 347
METRIC RANK
26.7%
WAGE/INCOME GAP
8.9/ 100
METRIC RATING
220th/ 347
METRIC RANK
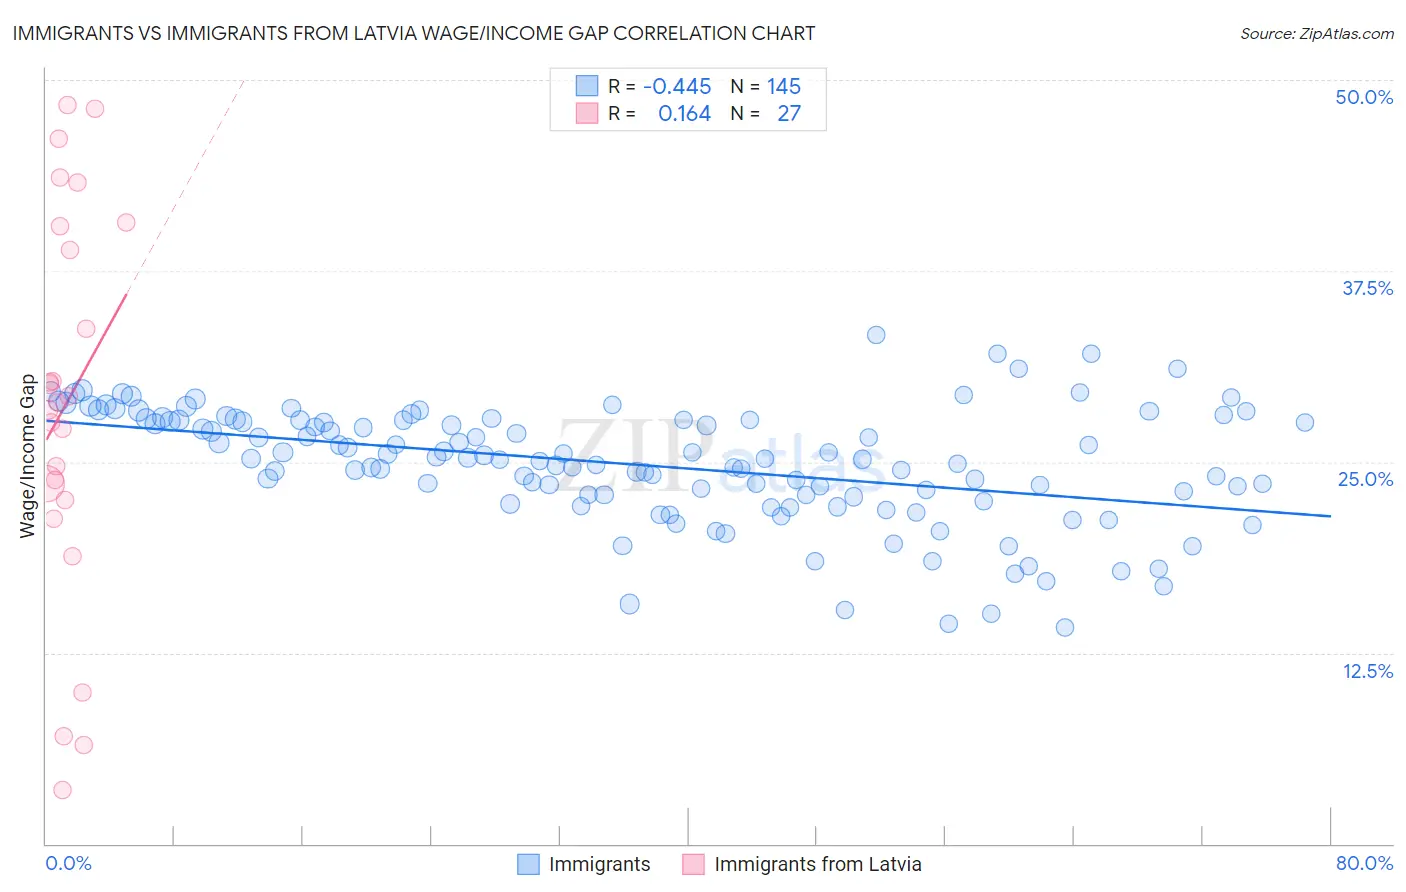
Immigrants vs Immigrants from Latvia Wage/Income Gap Correlation Chart
The statistical analysis conducted on geographies consisting of 574,033,804 people shows a moderate negative correlation between the proportion of Immigrants and wage/income gap percentage in the United States with a correlation coefficient (R) of -0.445 and weighted average of 25.1%. Similarly, the statistical analysis conducted on geographies consisting of 113,720,883 people shows a poor positive correlation between the proportion of Immigrants from Latvia and wage/income gap percentage in the United States with a correlation coefficient (R) of 0.164 and weighted average of 26.7%, a difference of 6.5%.
Wage/Income Gap Correlation Summary
| Measurement | Immigrants | Immigrants from Latvia |
| Minimum | 14.2% | 3.5% |
| Maximum | 33.3% | 48.4% |
| Range | 19.1% | 44.8% |
| Mean | 24.8% | 28.8% |
| Median | 25.2% | 28.9% |
| Interquartile 25% (IQ1) | 22.8% | 22.5% |
| Interquartile 75% (IQ3) | 27.7% | 40.4% |
| Interquartile Range (IQR) | 5.0% | 18.0% |
| Standard Deviation (Sample) | 3.8% | 12.6% |
| Standard Deviation (Population) | 3.8% | 12.4% |
Similar Demographics by Wage/Income Gap
Demographics Similar to Immigrants by Wage/Income Gap
In terms of wage/income gap, the demographic groups most similar to Immigrants are Immigrants from Peru (25.1%, a difference of 0.040%), Taiwanese (25.1%, a difference of 0.080%), Uruguayan (25.2%, a difference of 0.11%), Iroquois (25.1%, a difference of 0.19%), and Malaysian (25.0%, a difference of 0.33%).
| Demographics | Rating | Rank | Wage/Income Gap |
| Immigrants | Uganda | 88.0 /100 | #143 | Excellent 24.9% |
| Chippewa | 86.9 /100 | #144 | Excellent 25.0% |
| Comanche | 85.2 /100 | #145 | Excellent 25.0% |
| South Americans | 85.2 /100 | #146 | Excellent 25.0% |
| Malaysians | 84.9 /100 | #147 | Excellent 25.0% |
| Iroquois | 83.9 /100 | #148 | Excellent 25.1% |
| Immigrants | Peru | 82.6 /100 | #149 | Excellent 25.1% |
| Immigrants | Immigrants | 82.3 /100 | #150 | Excellent 25.1% |
| Taiwanese | 81.6 /100 | #151 | Excellent 25.1% |
| Uruguayans | 81.3 /100 | #152 | Excellent 25.2% |
| Blackfeet | 78.1 /100 | #153 | Good 25.2% |
| Immigrants | Northern Africa | 78.1 /100 | #154 | Good 25.2% |
| Immigrants | Vietnam | 77.7 /100 | #155 | Good 25.2% |
| Immigrants | Mexico | 76.4 /100 | #156 | Good 25.3% |
| Costa Ricans | 75.8 /100 | #157 | Good 25.3% |
Demographics Similar to Immigrants from Latvia by Wage/Income Gap
In terms of wage/income gap, the demographic groups most similar to Immigrants from Latvia are Immigrants from Poland (26.7%, a difference of 0.010%), Immigrants from Saudi Arabia (26.7%, a difference of 0.040%), Brazilian (26.7%, a difference of 0.070%), Immigrants from Spain (26.8%, a difference of 0.070%), and Bolivian (26.8%, a difference of 0.11%).
| Demographics | Rating | Rank | Wage/Income Gap |
| Immigrants | Iraq | 10.3 /100 | #213 | Poor 26.7% |
| Immigrants | China | 10.3 /100 | #214 | Poor 26.7% |
| Yugoslavians | 9.7 /100 | #215 | Tragic 26.7% |
| Immigrants | Portugal | 9.5 /100 | #216 | Tragic 26.7% |
| Brazilians | 9.2 /100 | #217 | Tragic 26.7% |
| Immigrants | Saudi Arabia | 9.1 /100 | #218 | Tragic 26.7% |
| Immigrants | Poland | 8.9 /100 | #219 | Tragic 26.7% |
| Immigrants | Latvia | 8.9 /100 | #220 | Tragic 26.7% |
| Immigrants | Spain | 8.5 /100 | #221 | Tragic 26.8% |
| Bolivians | 8.3 /100 | #222 | Tragic 26.8% |
| Jordanians | 8.0 /100 | #223 | Tragic 26.8% |
| Immigrants | Argentina | 7.2 /100 | #224 | Tragic 26.8% |
| Immigrants | Ireland | 6.5 /100 | #225 | Tragic 26.9% |
| Asians | 5.9 /100 | #226 | Tragic 26.9% |
| Spaniards | 5.6 /100 | #227 | Tragic 27.0% |