Immigrants from Taiwan vs Cypriot Wage/Income Gap
COMPARE
Immigrants from Taiwan
Cypriot
Wage/Income Gap
Wage/Income Gap Comparison
Immigrants from Taiwan
Cypriots
29.5%
WAGE/INCOME GAP
0.0/ 100
METRIC RATING
335th/ 347
METRIC RANK
27.3%
WAGE/INCOME GAP
2.8/ 100
METRIC RATING
248th/ 347
METRIC RANK
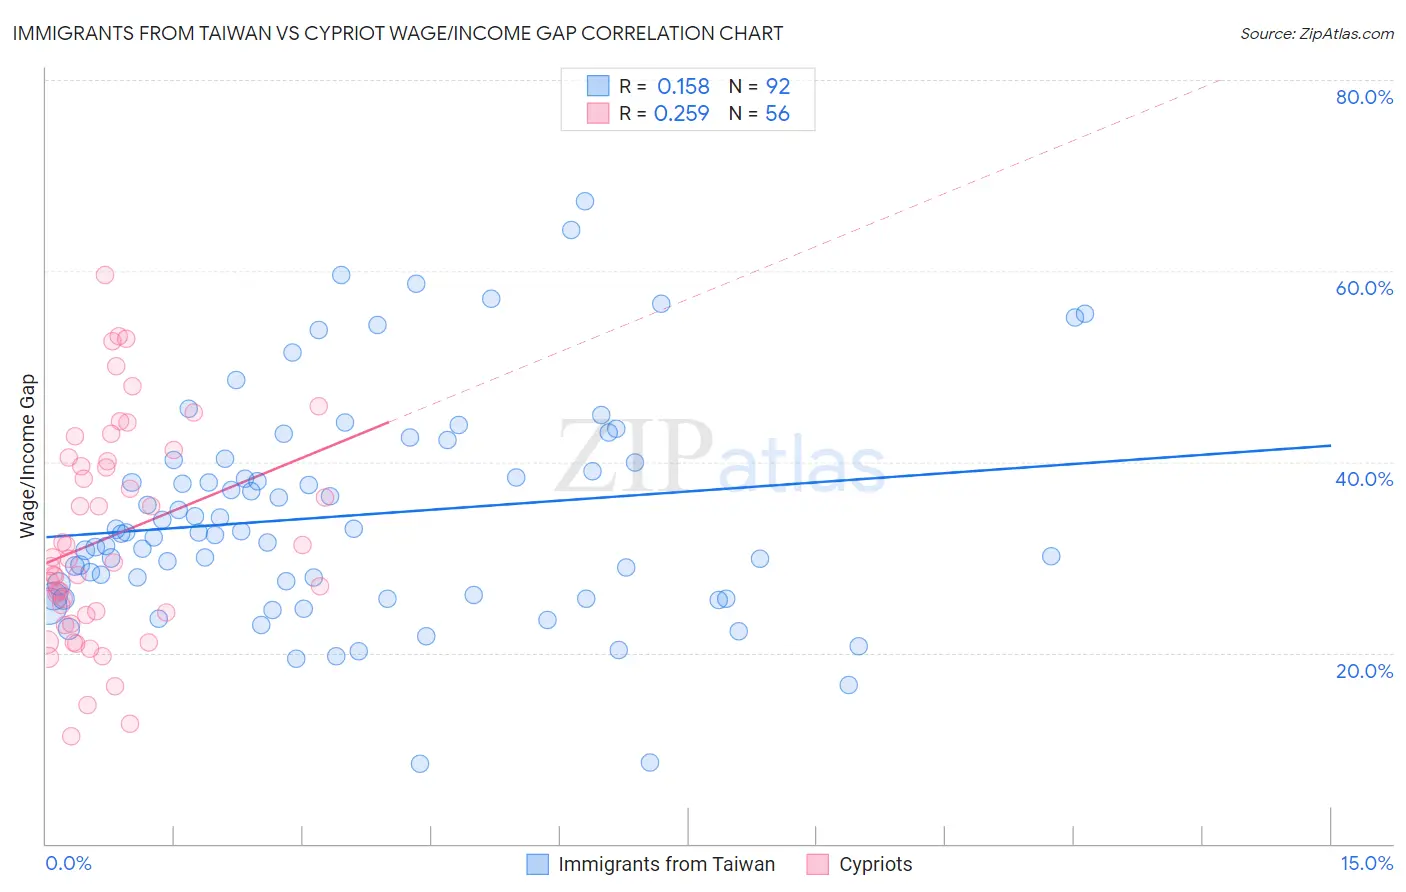
Immigrants from Taiwan vs Cypriot Wage/Income Gap Correlation Chart
The statistical analysis conducted on geographies consisting of 298,208,657 people shows a poor positive correlation between the proportion of Immigrants from Taiwan and wage/income gap percentage in the United States with a correlation coefficient (R) of 0.158 and weighted average of 29.5%. Similarly, the statistical analysis conducted on geographies consisting of 61,856,994 people shows a weak positive correlation between the proportion of Cypriots and wage/income gap percentage in the United States with a correlation coefficient (R) of 0.259 and weighted average of 27.3%, a difference of 8.0%.
Wage/Income Gap Correlation Summary
| Measurement | Immigrants from Taiwan | Cypriot |
| Minimum | 8.4% | 11.3% |
| Maximum | 67.2% | 59.6% |
| Range | 58.8% | 48.3% |
| Mean | 34.4% | 32.1% |
| Median | 32.5% | 29.6% |
| Interquartile 25% (IQ1) | 26.0% | 24.1% |
| Interquartile 75% (IQ3) | 40.1% | 40.2% |
| Interquartile Range (IQR) | 14.1% | 16.2% |
| Standard Deviation (Sample) | 11.6% | 11.2% |
| Standard Deviation (Population) | 11.5% | 11.1% |
Similar Demographics by Wage/Income Gap
Demographics Similar to Immigrants from Taiwan by Wage/Income Gap
In terms of wage/income gap, the demographic groups most similar to Immigrants from Taiwan are English (29.5%, a difference of 0.010%), Swedish (29.4%, a difference of 0.13%), European (29.4%, a difference of 0.27%), Immigrants from South Central Asia (29.3%, a difference of 0.46%), and Dutch (29.6%, a difference of 0.59%).
| Demographics | Rating | Rank | Wage/Income Gap |
| Scandinavians | 0.0 /100 | #328 | Tragic 29.1% |
| Scottish | 0.0 /100 | #329 | Tragic 29.1% |
| Germans | 0.0 /100 | #330 | Tragic 29.2% |
| Czechs | 0.0 /100 | #331 | Tragic 29.2% |
| Immigrants | South Central Asia | 0.0 /100 | #332 | Tragic 29.3% |
| Europeans | 0.0 /100 | #333 | Tragic 29.4% |
| Swedes | 0.0 /100 | #334 | Tragic 29.4% |
| Immigrants | Taiwan | 0.0 /100 | #335 | Tragic 29.5% |
| English | 0.0 /100 | #336 | Tragic 29.5% |
| Dutch | 0.0 /100 | #337 | Tragic 29.6% |
| Filipinos | 0.0 /100 | #338 | Tragic 29.7% |
| Iranians | 0.0 /100 | #339 | Tragic 29.7% |
| Swiss | 0.0 /100 | #340 | Tragic 30.0% |
| Thais | 0.0 /100 | #341 | Tragic 30.5% |
| Pennsylvania Germans | 0.0 /100 | #342 | Tragic 30.7% |
Demographics Similar to Cypriots by Wage/Income Gap
In terms of wage/income gap, the demographic groups most similar to Cypriots are Carpatho Rusyn (27.3%, a difference of 0.0%), Celtic (27.3%, a difference of 0.010%), Immigrants from Czechoslovakia (27.3%, a difference of 0.020%), Immigrants from Norway (27.3%, a difference of 0.13%), and Ukrainian (27.3%, a difference of 0.19%).
| Demographics | Rating | Rank | Wage/Income Gap |
| Creek | 3.8 /100 | #241 | Tragic 27.1% |
| Immigrants | Sri Lanka | 3.7 /100 | #242 | Tragic 27.1% |
| Spanish | 3.6 /100 | #243 | Tragic 27.1% |
| Chickasaw | 3.5 /100 | #244 | Tragic 27.2% |
| Immigrants | Azores | 3.5 /100 | #245 | Tragic 27.2% |
| Immigrants | Nonimmigrants | 3.3 /100 | #246 | Tragic 27.2% |
| Celtics | 2.8 /100 | #247 | Tragic 27.3% |
| Cypriots | 2.8 /100 | #248 | Tragic 27.3% |
| Carpatho Rusyns | 2.7 /100 | #249 | Tragic 27.3% |
| Immigrants | Czechoslovakia | 2.7 /100 | #250 | Tragic 27.3% |
| Immigrants | Norway | 2.5 /100 | #251 | Tragic 27.3% |
| Ukrainians | 2.4 /100 | #252 | Tragic 27.3% |
| Portuguese | 2.2 /100 | #253 | Tragic 27.4% |
| Israelis | 2.1 /100 | #254 | Tragic 27.4% |
| Immigrants | France | 2.1 /100 | #255 | Tragic 27.4% |