Immigrants from Taiwan GED/Equivalency
COMPARE
Immigrants from Taiwan
Select to Compare
GED/Equivalency
Immigrants from Taiwan GED/Equivalency
88.8%
GED/EQUIVALENCY
99.9/ 100
METRIC RATING
16th/ 347
METRIC RANK
Immigrants from Taiwan GED/Equivalency Correlation Chart
The statistical analysis conducted on geographies consisting of 298,292,402 people shows a poor positive correlation between the proportion of Immigrants from Taiwan and percentage of population with at least ged/equivalency education in the United States with a correlation coefficient (R) of 0.136 and weighted average of 88.8%. On average, for every 1% (one percent) increase in Immigrants from Taiwan within a typical geography, there is an increase of 0.20% in percentage of population with at least ged/equivalency education.
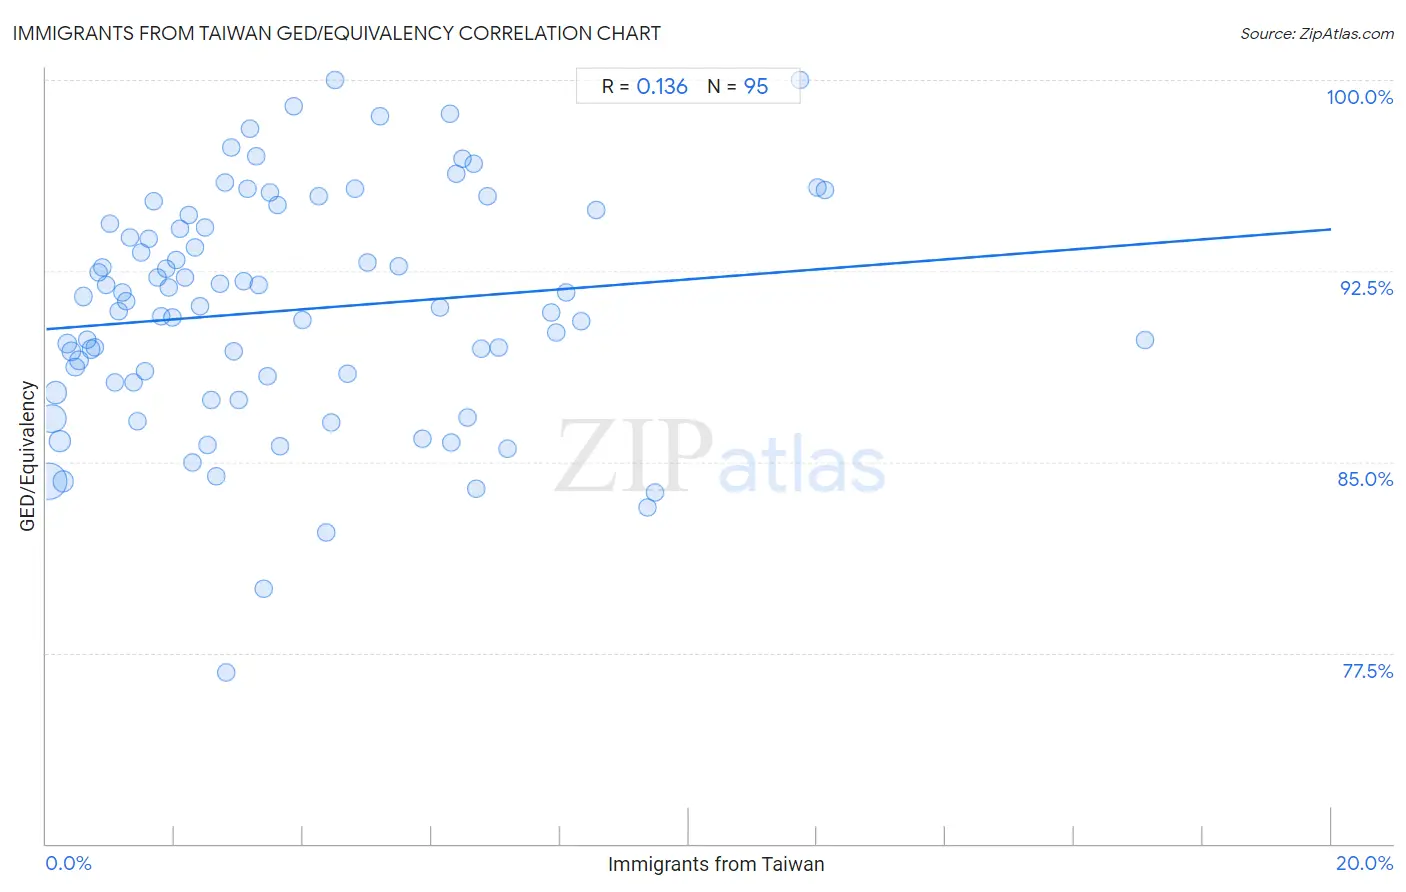
It is essential to understand that the correlation between the percentage of Immigrants from Taiwan and percentage of population with at least ged/equivalency education does not imply a direct cause-and-effect relationship. It remains uncertain whether the presence of Immigrants from Taiwan influences an upward or downward trend in the level of percentage of population with at least ged/equivalency education within an area, or if Immigrants from Taiwan simply ended up residing in those areas with higher or lower levels of percentage of population with at least ged/equivalency education due to other factors.
Demographics Similar to Immigrants from Taiwan by GED/Equivalency
In terms of ged/equivalency, the demographic groups most similar to Immigrants from Taiwan are Okinawan (88.9%, a difference of 0.030%), Croatian (88.8%, a difference of 0.030%), Cypriot (88.9%, a difference of 0.050%), Slovene (88.8%, a difference of 0.060%), and Immigrants from Iran (88.9%, a difference of 0.080%).
| Demographics | Rating | Rank | GED/Equivalency |
| Chinese | 99.9 /100 | #9 | Exceptional 89.0% |
| Norwegians | 99.9 /100 | #10 | Exceptional 89.0% |
| Bulgarians | 99.9 /100 | #11 | Exceptional 89.0% |
| Lithuanians | 99.9 /100 | #12 | Exceptional 88.9% |
| Immigrants from Iran | 99.9 /100 | #13 | Exceptional 88.9% |
| Cypriots | 99.9 /100 | #14 | Exceptional 88.9% |
| Okinawans | 99.9 /100 | #15 | Exceptional 88.9% |
| Immigrants from Taiwan | 99.9 /100 | #16 | Exceptional 88.8% |
| Croatians | 99.9 /100 | #17 | Exceptional 88.8% |
| Slovenes | 99.9 /100 | #18 | Exceptional 88.8% |
| Swedes | 99.9 /100 | #19 | Exceptional 88.8% |
| Maltese | 99.9 /100 | #20 | Exceptional 88.6% |
| Luxembourgers | 99.8 /100 | #21 | Exceptional 88.6% |
| Immigrants from Ireland | 99.8 /100 | #22 | Exceptional 88.6% |
| Russians | 99.8 /100 | #23 | Exceptional 88.6% |
Immigrants from Taiwan GED/Equivalency Correlation Summary
| Measurement | Immigrants from Taiwan Data | GED/Equivalency Data |
| Minimum | 0.032% | 76.7% |
| Maximum | 17.1% | 100.0% |
| Range | 17.1% | 23.3% |
| Mean | 3.8% | 91.0% |
| Median | 2.9% | 91.1% |
| Interquartile 25% (IQ1) | 1.4% | 88.1% |
| Interquartile 75% (IQ3) | 5.8% | 94.4% |
| Interquartile Range (IQR) | 4.4% | 6.2% |
| Standard Deviation (Sample) | 3.2% | 4.6% |
| Standard Deviation (Population) | 3.2% | 4.5% |
Correlation Details
| Immigrants from Taiwan Percentile | Sample Size | GED/Equivalency |
[ 0.0% - 0.5% ] 0.032% | 111,306,539 | 84.2% |
[ 0.0% - 0.5% ] 0.084% | 60,929,472 | 86.7% |
[ 0.0% - 0.5% ] 0.15% | 28,386,157 | 87.7% |
[ 0.0% - 0.5% ] 0.21% | 23,709,455 | 85.8% |
[ 0.0% - 0.5% ] 0.26% | 20,878,784 | 84.2% |
[ 0.0% - 0.5% ] 0.33% | 9,721,486 | 89.6% |
[ 0.0% - 0.5% ] 0.39% | 6,493,257 | 89.3% |
[ 0.0% - 0.5% ] 0.46% | 4,473,267 | 88.7% |
[ 0.5% - 1.0% ] 0.51% | 3,793,426 | 89.0% |
[ 0.5% - 1.0% ] 0.58% | 4,026,145 | 91.5% |
[ 0.5% - 1.0% ] 0.64% | 3,511,953 | 89.8% |
[ 0.5% - 1.0% ] 0.70% | 2,497,084 | 89.4% |
[ 0.5% - 1.0% ] 0.76% | 1,676,611 | 89.5% |
[ 0.5% - 1.0% ] 0.82% | 1,394,889 | 92.4% |
[ 0.5% - 1.0% ] 0.88% | 1,195,371 | 92.6% |
[ 0.5% - 1.0% ] 0.94% | 1,143,784 | 91.9% |
[ 0.5% - 1.0% ] 1.00% | 908,107 | 94.4% |
[ 1.0% - 1.5% ] 1.06% | 1,031,552 | 88.1% |
[ 1.0% - 1.5% ] 1.12% | 769,940 | 90.9% |
[ 1.0% - 1.5% ] 1.18% | 767,757 | 91.6% |
[ 1.0% - 1.5% ] 1.25% | 585,778 | 91.3% |
[ 1.0% - 1.5% ] 1.31% | 161,280 | 93.8% |
[ 1.0% - 1.5% ] 1.35% | 1,684,286 | 88.1% |
[ 1.0% - 1.5% ] 1.42% | 234,522 | 86.6% |
[ 1.0% - 1.5% ] 1.48% | 497,074 | 93.2% |
[ 1.5% - 2.0% ] 1.54% | 659,535 | 88.6% |
[ 1.5% - 2.0% ] 1.59% | 106,109 | 93.8% |
[ 1.5% - 2.0% ] 1.67% | 259,288 | 95.2% |
[ 1.5% - 2.0% ] 1.74% | 105,001 | 92.2% |
[ 1.5% - 2.0% ] 1.78% | 57,202 | 90.7% |
[ 1.5% - 2.0% ] 1.86% | 411,301 | 92.6% |
[ 1.5% - 2.0% ] 1.90% | 268,133 | 91.9% |
[ 1.5% - 2.0% ] 1.97% | 612,178 | 90.7% |
[ 2.0% - 2.5% ] 2.02% | 99,729 | 92.9% |
[ 2.0% - 2.5% ] 2.09% | 197,657 | 94.2% |
[ 2.0% - 2.5% ] 2.15% | 142,062 | 92.2% |
[ 2.0% - 2.5% ] 2.22% | 68,508 | 94.7% |
[ 2.0% - 2.5% ] 2.28% | 96,497 | 85.0% |
[ 2.0% - 2.5% ] 2.32% | 426,787 | 93.4% |
[ 2.0% - 2.5% ] 2.39% | 48,030 | 91.1% |
[ 2.0% - 2.5% ] 2.47% | 287,905 | 94.2% |
[ 2.5% - 3.0% ] 2.51% | 102,592 | 85.7% |
[ 2.5% - 3.0% ] 2.58% | 198,983 | 87.5% |
[ 2.5% - 3.0% ] 2.64% | 114,547 | 84.5% |
[ 2.5% - 3.0% ] 2.71% | 84,857 | 92.0% |
[ 2.5% - 3.0% ] 2.77% | 12,470 | 96.0% |
[ 2.5% - 3.0% ] 2.80% | 172,515 | 76.7% |
[ 2.5% - 3.0% ] 2.88% | 38,903 | 97.3% |
[ 2.5% - 3.0% ] 2.91% | 212,221 | 89.4% |
[ 3.0% - 3.5% ] 3.00% | 63,649 | 87.4% |
[ 3.0% - 3.5% ] 3.06% | 273,341 | 92.1% |
[ 3.0% - 3.5% ] 3.13% | 46,906 | 95.8% |
[ 3.0% - 3.5% ] 3.18% | 7,559 | 98.1% |
[ 3.0% - 3.5% ] 3.26% | 1,258 | 97.0% |
[ 3.0% - 3.5% ] 3.31% | 17,826 | 91.9% |
[ 3.0% - 3.5% ] 3.39% | 52,797 | 80.0% |
[ 3.0% - 3.5% ] 3.45% | 1,277 | 88.4% |
[ 3.0% - 3.5% ] 3.49% | 24,692 | 95.6% |
[ 3.5% - 4.0% ] 3.59% | 61,940 | 95.1% |
[ 3.5% - 4.0% ] 3.64% | 40,981 | 85.6% |
[ 3.5% - 4.0% ] 3.86% | 20,442 | 99.0% |
[ 3.5% - 4.0% ] 3.98% | 5,170 | 90.6% |
[ 4.0% - 4.5% ] 4.25% | 34,904 | 95.4% |
[ 4.0% - 4.5% ] 4.37% | 5,474 | 82.2% |
[ 4.0% - 4.5% ] 4.44% | 31,335 | 86.6% |
[ 4.0% - 4.5% ] 4.49% | 936 | 100.0% |
[ 4.5% - 5.0% ] 4.69% | 8,362 | 88.5% |
[ 4.5% - 5.0% ] 4.81% | 2,890 | 95.7% |
[ 4.5% - 5.0% ] 4.99% | 98,350 | 92.8% |
[ 5.0% - 5.5% ] 5.19% | 8,441 | 98.6% |
[ 5.0% - 5.5% ] 5.48% | 62,451 | 92.7% |
[ 5.5% - 6.0% ] 5.85% | 35,556 | 85.9% |
[ 6.0% - 6.5% ] 6.13% | 767 | 91.0% |
[ 6.0% - 6.5% ] 6.29% | 954 | 98.7% |
[ 6.0% - 6.5% ] 6.31% | 36,909 | 85.8% |
[ 6.0% - 6.5% ] 6.38% | 31,688 | 96.3% |
[ 6.0% - 6.5% ] 6.47% | 61,414 | 96.9% |
[ 6.5% - 7.0% ] 6.57% | 4,463 | 86.8% |
[ 6.5% - 7.0% ] 6.65% | 90,534 | 96.7% |
[ 6.5% - 7.0% ] 6.69% | 110,950 | 84.0% |
[ 6.5% - 7.0% ] 6.76% | 33,367 | 89.4% |
[ 6.5% - 7.0% ] 6.88% | 53,464 | 95.4% |
[ 7.0% - 7.5% ] 7.04% | 24,169 | 89.5% |
[ 7.0% - 7.5% ] 7.18% | 1,031 | 85.5% |
[ 7.5% - 8.0% ] 7.85% | 73,363 | 90.9% |
[ 7.5% - 8.0% ] 7.94% | 54,534 | 90.1% |
[ 8.0% - 8.5% ] 8.09% | 84,393 | 91.7% |
[ 8.0% - 8.5% ] 8.33% | 45,303 | 90.5% |
[ 8.5% - 9.0% ] 8.56% | 222 | 94.9% |
[ 9.0% - 9.5% ] 9.37% | 43,851 | 83.2% |
[ 9.0% - 9.5% ] 9.48% | 47,209 | 83.8% |
[ 11.5% - 12.0% ] 11.73% | 1,176 | 100.0% |
[ 12.0% - 12.5% ] 12.01% | 12,559 | 95.8% |
[ 12.0% - 12.5% ] 12.12% | 12,442 | 95.7% |
[ 17.0% - 17.5% ] 17.09% | 117 | 89.8% |