Immigrants from Portugal vs Immigrants from Mexico Wage/Income Gap
COMPARE
Immigrants from Portugal
Immigrants from Mexico
Wage/Income Gap
Wage/Income Gap Comparison
Immigrants from Portugal
Immigrants from Mexico
26.7%
WAGE/INCOME GAP
9.5/ 100
METRIC RATING
216th/ 347
METRIC RANK
25.3%
WAGE/INCOME GAP
76.4/ 100
METRIC RATING
156th/ 347
METRIC RANK
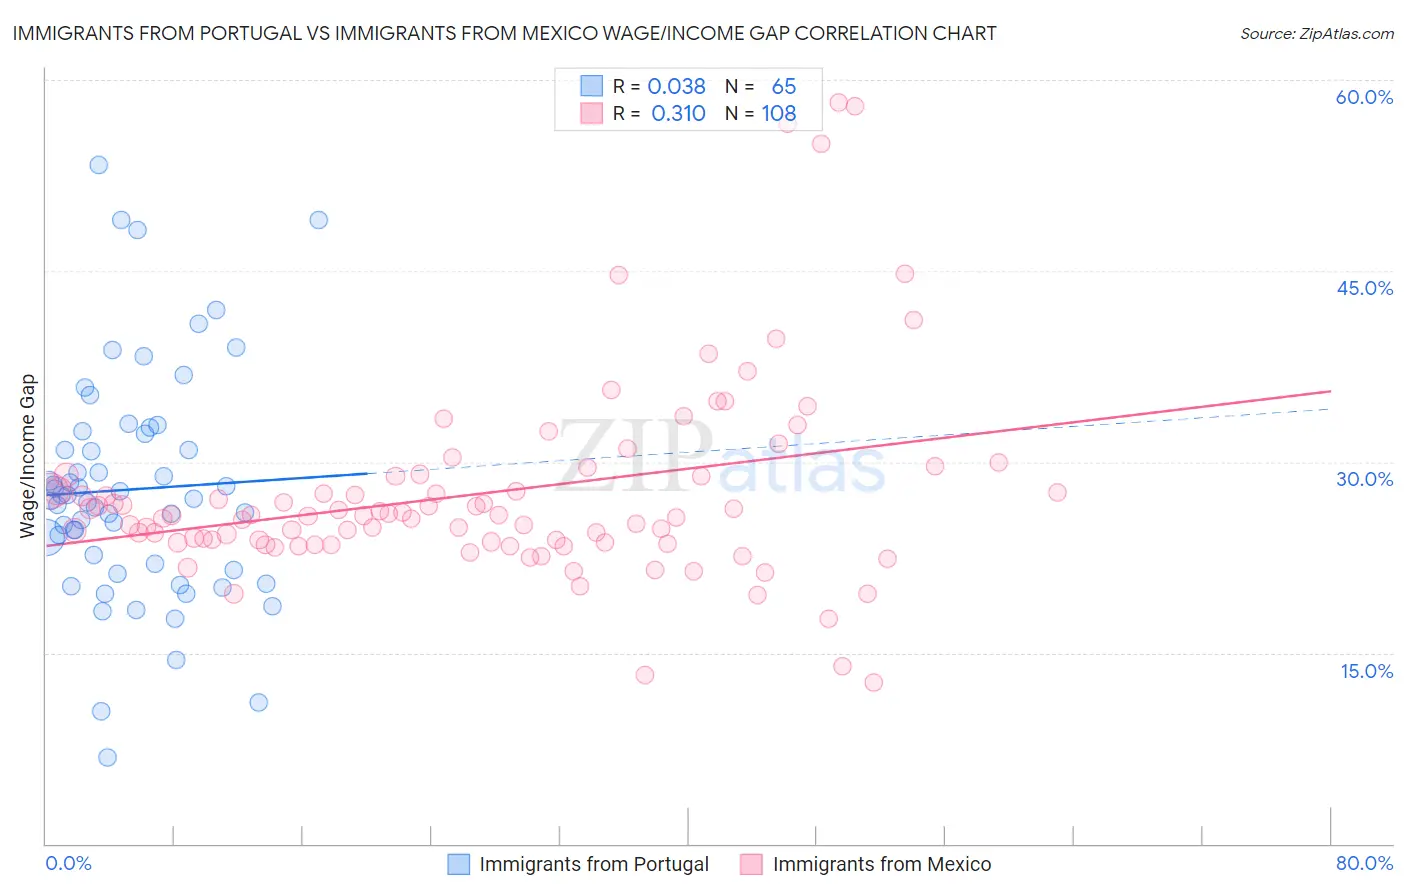
Immigrants from Portugal vs Immigrants from Mexico Wage/Income Gap Correlation Chart
The statistical analysis conducted on geographies consisting of 174,735,300 people shows no correlation between the proportion of Immigrants from Portugal and wage/income gap percentage in the United States with a correlation coefficient (R) of 0.038 and weighted average of 26.7%. Similarly, the statistical analysis conducted on geographies consisting of 512,302,630 people shows a mild positive correlation between the proportion of Immigrants from Mexico and wage/income gap percentage in the United States with a correlation coefficient (R) of 0.310 and weighted average of 25.3%, a difference of 5.7%.
Wage/Income Gap Correlation Summary
| Measurement | Immigrants from Portugal | Immigrants from Mexico |
| Minimum | 6.7% | 12.7% |
| Maximum | 53.3% | 58.3% |
| Range | 46.6% | 45.6% |
| Mean | 27.8% | 27.5% |
| Median | 27.1% | 25.8% |
| Interquartile 25% (IQ1) | 21.7% | 23.6% |
| Interquartile 75% (IQ3) | 32.3% | 28.9% |
| Interquartile Range (IQR) | 10.6% | 5.3% |
| Standard Deviation (Sample) | 9.0% | 7.9% |
| Standard Deviation (Population) | 9.0% | 7.9% |
Similar Demographics by Wage/Income Gap
Demographics Similar to Immigrants from Portugal by Wage/Income Gap
In terms of wage/income gap, the demographic groups most similar to Immigrants from Portugal are Yugoslavian (26.7%, a difference of 0.040%), Brazilian (26.7%, a difference of 0.050%), Immigrants from Saudi Arabia (26.7%, a difference of 0.080%), Immigrants from Poland (26.7%, a difference of 0.11%), and Immigrants from Latvia (26.7%, a difference of 0.12%).
| Demographics | Rating | Rank | Wage/Income Gap |
| Immigrants | Kuwait | 12.6 /100 | #209 | Poor 26.6% |
| Arabs | 12.3 /100 | #210 | Poor 26.6% |
| Mongolians | 11.4 /100 | #211 | Poor 26.6% |
| Iraqis | 11.2 /100 | #212 | Poor 26.6% |
| Immigrants | Iraq | 10.3 /100 | #213 | Poor 26.7% |
| Immigrants | China | 10.3 /100 | #214 | Poor 26.7% |
| Yugoslavians | 9.7 /100 | #215 | Tragic 26.7% |
| Immigrants | Portugal | 9.5 /100 | #216 | Tragic 26.7% |
| Brazilians | 9.2 /100 | #217 | Tragic 26.7% |
| Immigrants | Saudi Arabia | 9.1 /100 | #218 | Tragic 26.7% |
| Immigrants | Poland | 8.9 /100 | #219 | Tragic 26.7% |
| Immigrants | Latvia | 8.9 /100 | #220 | Tragic 26.7% |
| Immigrants | Spain | 8.5 /100 | #221 | Tragic 26.8% |
| Bolivians | 8.3 /100 | #222 | Tragic 26.8% |
| Jordanians | 8.0 /100 | #223 | Tragic 26.8% |
Demographics Similar to Immigrants from Mexico by Wage/Income Gap
In terms of wage/income gap, the demographic groups most similar to Immigrants from Mexico are Costa Rican (25.3%, a difference of 0.060%), Immigrants from Vietnam (25.2%, a difference of 0.12%), Blackfeet (25.2%, a difference of 0.16%), Immigrants from Northern Africa (25.2%, a difference of 0.16%), and Immigrants from Zimbabwe (25.3%, a difference of 0.24%).
| Demographics | Rating | Rank | Wage/Income Gap |
| Immigrants | Peru | 82.6 /100 | #149 | Excellent 25.1% |
| Immigrants | Immigrants | 82.3 /100 | #150 | Excellent 25.1% |
| Taiwanese | 81.6 /100 | #151 | Excellent 25.1% |
| Uruguayans | 81.3 /100 | #152 | Excellent 25.2% |
| Blackfeet | 78.1 /100 | #153 | Good 25.2% |
| Immigrants | Northern Africa | 78.1 /100 | #154 | Good 25.2% |
| Immigrants | Vietnam | 77.7 /100 | #155 | Good 25.2% |
| Immigrants | Mexico | 76.4 /100 | #156 | Good 25.3% |
| Costa Ricans | 75.8 /100 | #157 | Good 25.3% |
| Immigrants | Zimbabwe | 73.7 /100 | #158 | Good 25.3% |
| Puget Sound Salish | 73.0 /100 | #159 | Good 25.3% |
| French American Indians | 72.5 /100 | #160 | Good 25.4% |
| Albanians | 69.4 /100 | #161 | Good 25.4% |
| Shoshone | 69.0 /100 | #162 | Good 25.4% |
| Native Hawaiians | 69.0 /100 | #163 | Good 25.4% |