Immigrants from Pakistan vs Immigrants from North Macedonia Wage/Income Gap
COMPARE
Immigrants from Pakistan
Immigrants from North Macedonia
Wage/Income Gap
Wage/Income Gap Comparison
Immigrants from Pakistan
Immigrants from North Macedonia
27.0%
WAGE/INCOME GAP
4.9/ 100
METRIC RATING
234th/ 347
METRIC RANK
28.4%
WAGE/INCOME GAP
0.2/ 100
METRIC RATING
299th/ 347
METRIC RANK
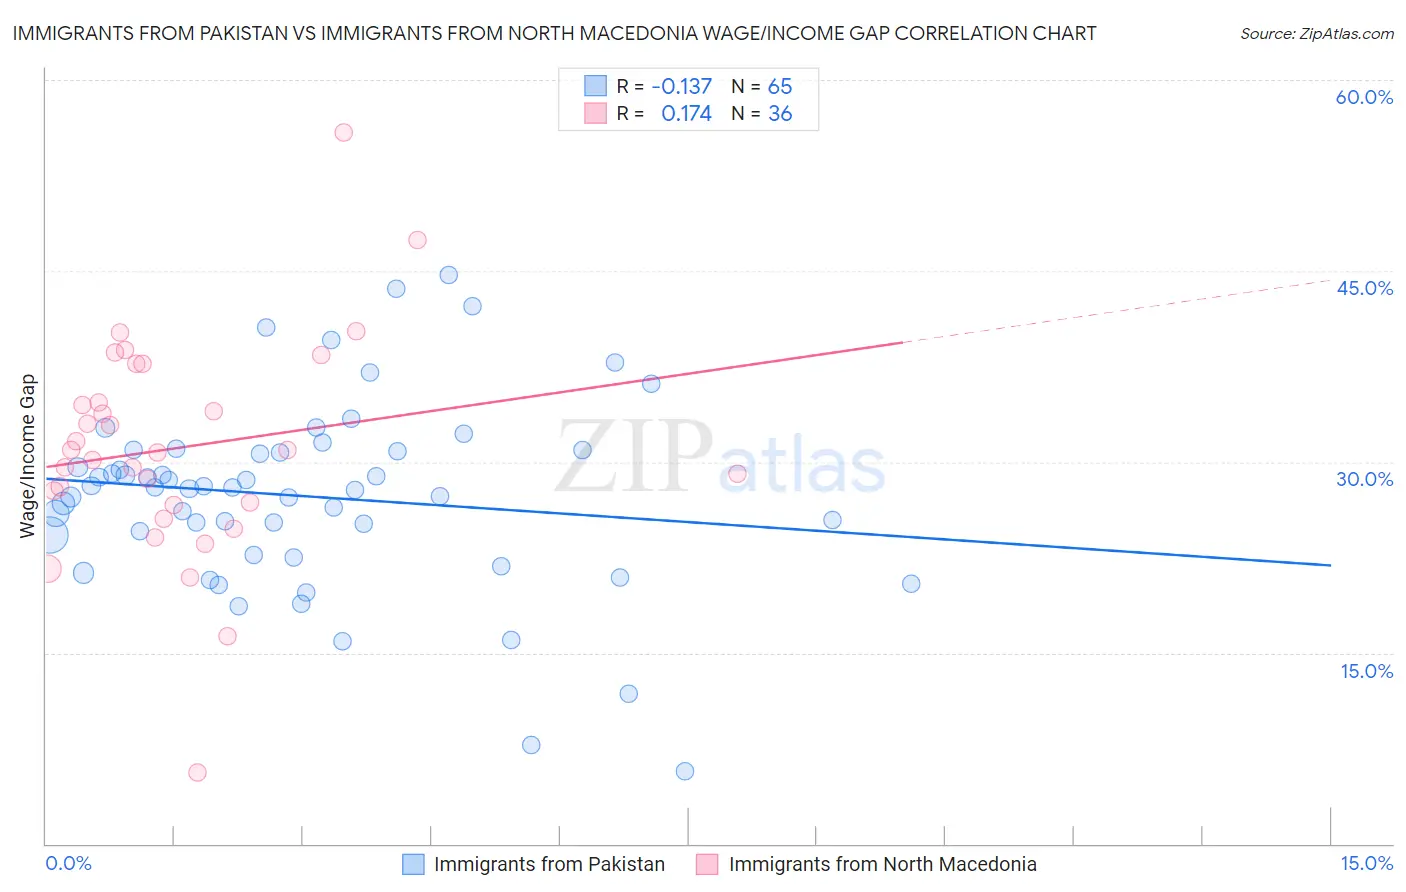
Immigrants from Pakistan vs Immigrants from North Macedonia Wage/Income Gap Correlation Chart
The statistical analysis conducted on geographies consisting of 283,872,842 people shows a poor negative correlation between the proportion of Immigrants from Pakistan and wage/income gap percentage in the United States with a correlation coefficient (R) of -0.137 and weighted average of 27.0%. Similarly, the statistical analysis conducted on geographies consisting of 74,314,405 people shows a poor positive correlation between the proportion of Immigrants from North Macedonia and wage/income gap percentage in the United States with a correlation coefficient (R) of 0.174 and weighted average of 28.4%, a difference of 5.2%.
Wage/Income Gap Correlation Summary
| Measurement | Immigrants from Pakistan | Immigrants from North Macedonia |
| Minimum | 5.7% | 5.6% |
| Maximum | 44.7% | 55.9% |
| Range | 39.0% | 50.3% |
| Mean | 27.3% | 31.1% |
| Median | 28.0% | 30.8% |
| Interquartile 25% (IQ1) | 23.5% | 26.7% |
| Interquartile 75% (IQ3) | 30.9% | 36.2% |
| Interquartile Range (IQR) | 7.4% | 9.4% |
| Standard Deviation (Sample) | 7.4% | 8.7% |
| Standard Deviation (Population) | 7.4% | 8.6% |
Similar Demographics by Wage/Income Gap
Demographics Similar to Immigrants from Pakistan by Wage/Income Gap
In terms of wage/income gap, the demographic groups most similar to Immigrants from Pakistan are Immigrants from Hungary (27.0%, a difference of 0.010%), Immigrants from Romania (27.0%, a difference of 0.030%), Immigrants from Brazil (27.0%, a difference of 0.050%), Argentinean (27.0%, a difference of 0.11%), and Bhutanese (27.0%, a difference of 0.13%).
| Demographics | Rating | Rank | Wage/Income Gap |
| Spaniards | 5.6 /100 | #227 | Tragic 27.0% |
| Immigrants | Turkey | 5.6 /100 | #228 | Tragic 27.0% |
| Immigrants | Asia | 5.5 /100 | #229 | Tragic 27.0% |
| Ottawa | 5.3 /100 | #230 | Tragic 27.0% |
| Bhutanese | 5.3 /100 | #231 | Tragic 27.0% |
| Argentineans | 5.2 /100 | #232 | Tragic 27.0% |
| Immigrants | Brazil | 5.0 /100 | #233 | Tragic 27.0% |
| Immigrants | Pakistan | 4.9 /100 | #234 | Tragic 27.0% |
| Immigrants | Hungary | 4.8 /100 | #235 | Tragic 27.0% |
| Immigrants | Romania | 4.8 /100 | #236 | Tragic 27.0% |
| Immigrants | Eastern Asia | 4.4 /100 | #237 | Tragic 27.1% |
| Osage | 4.4 /100 | #238 | Tragic 27.1% |
| Estonians | 4.3 /100 | #239 | Tragic 27.1% |
| Immigrants | Europe | 3.8 /100 | #240 | Tragic 27.1% |
| Creek | 3.8 /100 | #241 | Tragic 27.1% |
Demographics Similar to Immigrants from North Macedonia by Wage/Income Gap
In terms of wage/income gap, the demographic groups most similar to Immigrants from North Macedonia are Immigrants from North America (28.4%, a difference of 0.050%), Austrian (28.4%, a difference of 0.050%), Immigrants from Northern Europe (28.5%, a difference of 0.12%), Immigrants from Canada (28.5%, a difference of 0.16%), and Scotch-Irish (28.5%, a difference of 0.19%).
| Demographics | Rating | Rank | Wage/Income Gap |
| Immigrants | Australia | 0.3 /100 | #292 | Tragic 28.2% |
| Immigrants | Israel | 0.3 /100 | #293 | Tragic 28.2% |
| Greeks | 0.3 /100 | #294 | Tragic 28.2% |
| Slovenes | 0.3 /100 | #295 | Tragic 28.3% |
| Northern Europeans | 0.3 /100 | #296 | Tragic 28.3% |
| Immigrants | North America | 0.2 /100 | #297 | Tragic 28.4% |
| Austrians | 0.2 /100 | #298 | Tragic 28.4% |
| Immigrants | North Macedonia | 0.2 /100 | #299 | Tragic 28.4% |
| Immigrants | Northern Europe | 0.2 /100 | #300 | Tragic 28.5% |
| Immigrants | Canada | 0.2 /100 | #301 | Tragic 28.5% |
| Scotch-Irish | 0.2 /100 | #302 | Tragic 28.5% |
| Irish | 0.2 /100 | #303 | Tragic 28.5% |
| Immigrants | Netherlands | 0.2 /100 | #304 | Tragic 28.5% |
| Immigrants | South Africa | 0.1 /100 | #305 | Tragic 28.5% |
| Whites/Caucasians | 0.1 /100 | #306 | Tragic 28.5% |