Immigrants from Pakistan vs Delaware Wage/Income Gap
COMPARE
Immigrants from Pakistan
Delaware
Wage/Income Gap
Wage/Income Gap Comparison
Immigrants from Pakistan
Delaware
27.0%
WAGE/INCOME GAP
4.9/ 100
METRIC RATING
234th/ 347
METRIC RANK
26.3%
WAGE/INCOME GAP
20.9/ 100
METRIC RATING
200th/ 347
METRIC RANK
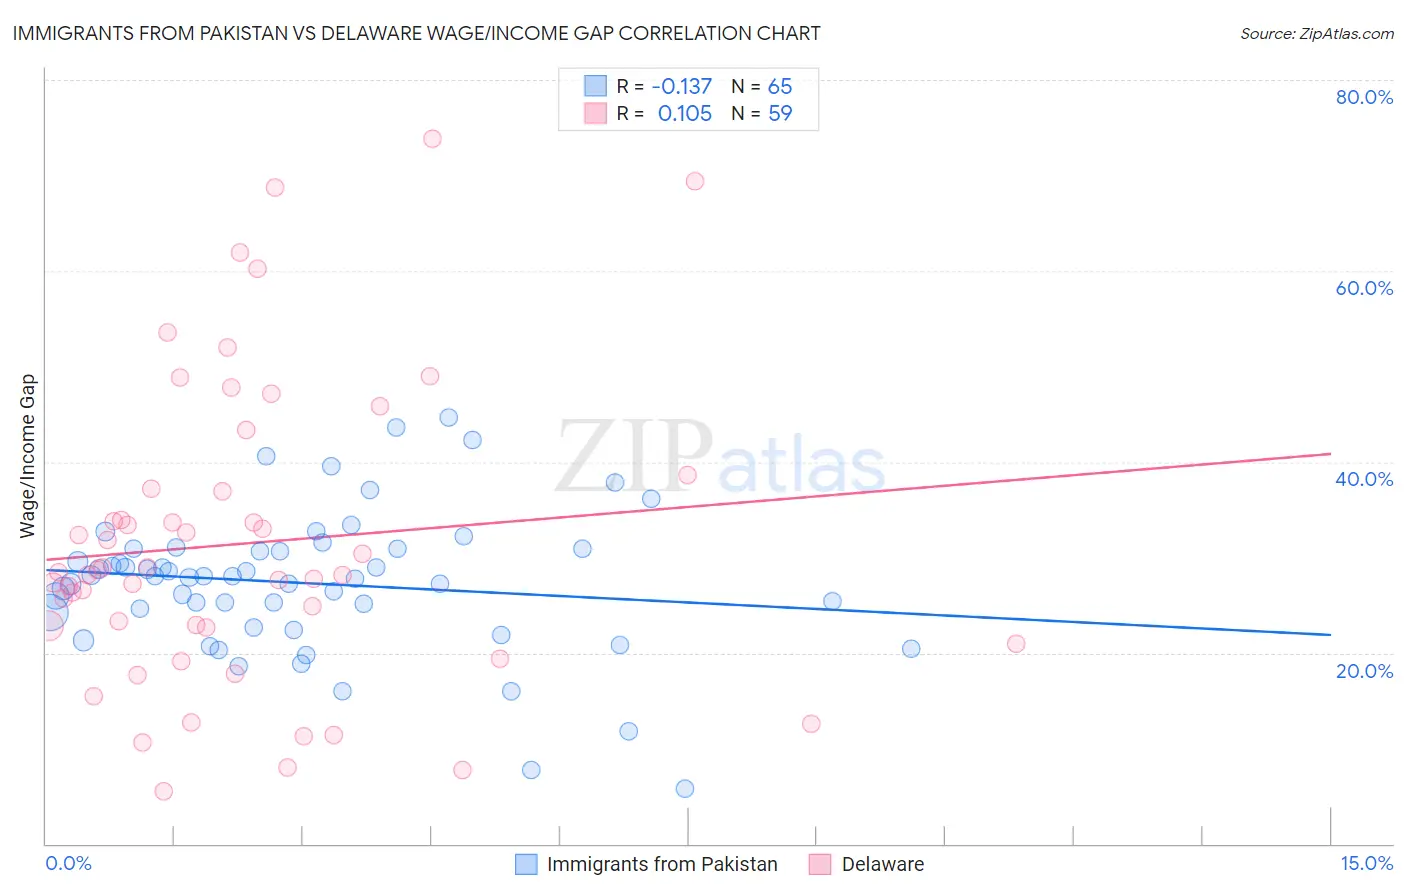
Immigrants from Pakistan vs Delaware Wage/Income Gap Correlation Chart
The statistical analysis conducted on geographies consisting of 283,872,842 people shows a poor negative correlation between the proportion of Immigrants from Pakistan and wage/income gap percentage in the United States with a correlation coefficient (R) of -0.137 and weighted average of 27.0%. Similarly, the statistical analysis conducted on geographies consisting of 96,192,604 people shows a poor positive correlation between the proportion of Delaware and wage/income gap percentage in the United States with a correlation coefficient (R) of 0.105 and weighted average of 26.3%, a difference of 2.6%.
Wage/Income Gap Correlation Summary
| Measurement | Immigrants from Pakistan | Delaware |
| Minimum | 5.7% | 5.5% |
| Maximum | 44.7% | 73.9% |
| Range | 39.0% | 68.4% |
| Mean | 27.3% | 31.5% |
| Median | 28.0% | 28.4% |
| Interquartile 25% (IQ1) | 23.5% | 22.7% |
| Interquartile 75% (IQ3) | 30.9% | 37.2% |
| Interquartile Range (IQR) | 7.4% | 14.5% |
| Standard Deviation (Sample) | 7.4% | 15.7% |
| Standard Deviation (Population) | 7.4% | 15.5% |
Similar Demographics by Wage/Income Gap
Demographics Similar to Immigrants from Pakistan by Wage/Income Gap
In terms of wage/income gap, the demographic groups most similar to Immigrants from Pakistan are Immigrants from Hungary (27.0%, a difference of 0.010%), Immigrants from Romania (27.0%, a difference of 0.030%), Immigrants from Brazil (27.0%, a difference of 0.050%), Argentinean (27.0%, a difference of 0.11%), and Bhutanese (27.0%, a difference of 0.13%).
| Demographics | Rating | Rank | Wage/Income Gap |
| Spaniards | 5.6 /100 | #227 | Tragic 27.0% |
| Immigrants | Turkey | 5.6 /100 | #228 | Tragic 27.0% |
| Immigrants | Asia | 5.5 /100 | #229 | Tragic 27.0% |
| Ottawa | 5.3 /100 | #230 | Tragic 27.0% |
| Bhutanese | 5.3 /100 | #231 | Tragic 27.0% |
| Argentineans | 5.2 /100 | #232 | Tragic 27.0% |
| Immigrants | Brazil | 5.0 /100 | #233 | Tragic 27.0% |
| Immigrants | Pakistan | 4.9 /100 | #234 | Tragic 27.0% |
| Immigrants | Hungary | 4.8 /100 | #235 | Tragic 27.0% |
| Immigrants | Romania | 4.8 /100 | #236 | Tragic 27.0% |
| Immigrants | Eastern Asia | 4.4 /100 | #237 | Tragic 27.1% |
| Osage | 4.4 /100 | #238 | Tragic 27.1% |
| Estonians | 4.3 /100 | #239 | Tragic 27.1% |
| Immigrants | Europe | 3.8 /100 | #240 | Tragic 27.1% |
| Creek | 3.8 /100 | #241 | Tragic 27.1% |
Demographics Similar to Delaware by Wage/Income Gap
In terms of wage/income gap, the demographic groups most similar to Delaware are Dutch West Indian (26.3%, a difference of 0.010%), Venezuelan (26.3%, a difference of 0.050%), Zimbabwean (26.3%, a difference of 0.070%), Immigrants from Western Asia (26.3%, a difference of 0.080%), and Immigrants from Malaysia (26.3%, a difference of 0.12%).
| Demographics | Rating | Rank | Wage/Income Gap |
| Immigrants | Jordan | 22.4 /100 | #193 | Fair 26.3% |
| Chileans | 22.3 /100 | #194 | Fair 26.3% |
| Immigrants | Malaysia | 22.2 /100 | #195 | Fair 26.3% |
| Immigrants | Western Asia | 21.7 /100 | #196 | Fair 26.3% |
| Zimbabweans | 21.6 /100 | #197 | Fair 26.3% |
| Venezuelans | 21.5 /100 | #198 | Fair 26.3% |
| Dutch West Indians | 21.0 /100 | #199 | Fair 26.3% |
| Delaware | 20.9 /100 | #200 | Fair 26.3% |
| Immigrants | Syria | 19.3 /100 | #201 | Poor 26.4% |
| Laotians | 19.2 /100 | #202 | Poor 26.4% |
| Immigrants | Eastern Europe | 19.2 /100 | #203 | Poor 26.4% |
| Immigrants | Russia | 19.0 /100 | #204 | Poor 26.4% |
| Immigrants | Southern Europe | 17.3 /100 | #205 | Poor 26.4% |
| Indians (Asian) | 16.5 /100 | #206 | Poor 26.4% |
| Immigrants | Italy | 15.8 /100 | #207 | Poor 26.5% |