Immigrants from Ethiopia 1 or more Vehicles in Household
COMPARE
Immigrants from Ethiopia
Select to Compare
1 or more Vehicles in Household
Immigrants from Ethiopia 1 or more Vehicles in Household
89.6%
1+ VEHICLES AVAILABLE
42.5/ 100
METRIC RATING
181st/ 347
METRIC RANK
Immigrants from Ethiopia 1 or more Vehicles in Household Correlation Chart
The statistical analysis conducted on geographies consisting of 211,422,561 people shows a moderate positive correlation between the proportion of Immigrants from Ethiopia and percentage of households with 1 or more vehicles available in the United States with a correlation coefficient (R) of 0.426 and weighted average of 89.6%. On average, for every 1% (one percent) increase in Immigrants from Ethiopia within a typical geography, there is an increase of 0.26% in percentage of households with 1 or more vehicles available.
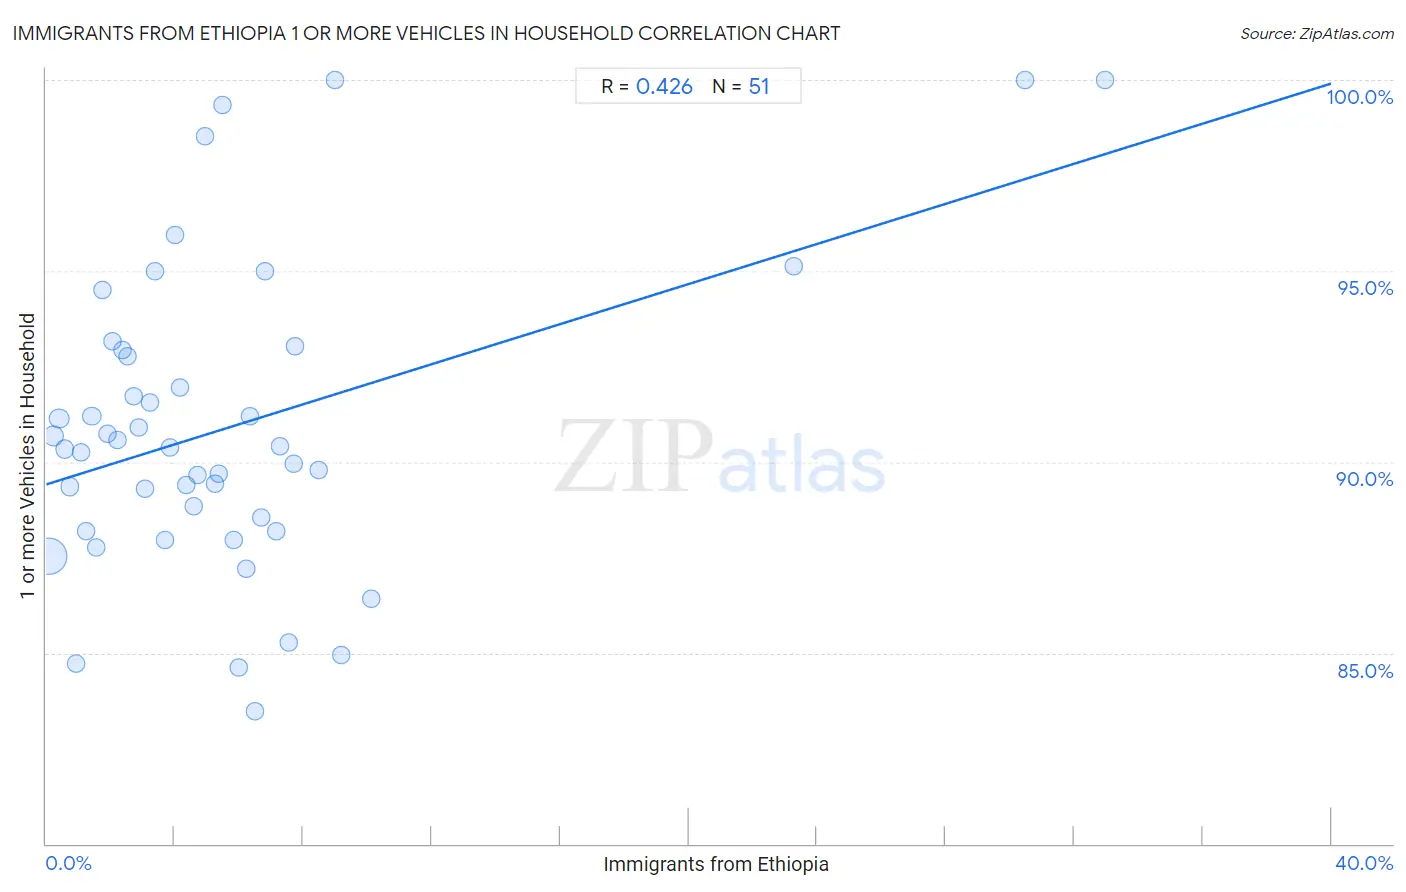
It is essential to understand that the correlation between the percentage of Immigrants from Ethiopia and percentage of households with 1 or more vehicles available does not imply a direct cause-and-effect relationship. It remains uncertain whether the presence of Immigrants from Ethiopia influences an upward or downward trend in the level of percentage of households with 1 or more vehicles available within an area, or if Immigrants from Ethiopia simply ended up residing in those areas with higher or lower levels of percentage of households with 1 or more vehicles available due to other factors.
Demographics Similar to Immigrants from Ethiopia by 1 or more Vehicles in Household
In terms of 1 or more vehicles in household, the demographic groups most similar to Immigrants from Ethiopia are Ukrainian (89.6%, a difference of 0.0%), Arab (89.6%, a difference of 0.010%), German Russian (89.6%, a difference of 0.020%), Ethiopian (89.6%, a difference of 0.020%), and Immigrants from El Salvador (89.6%, a difference of 0.030%).
| Demographics | Rating | Rank | 1 or more Vehicles in Household |
| Filipinos | 50.0 /100 | #174 | Average 89.7% |
| Immigrants from Burma/Myanmar | 47.6 /100 | #175 | Average 89.7% |
| Immigrants from Sudan | 47.1 /100 | #176 | Average 89.7% |
| Hmong | 45.8 /100 | #177 | Average 89.6% |
| Immigrants from El Salvador | 44.1 /100 | #178 | Average 89.6% |
| German Russians | 44.0 /100 | #179 | Average 89.6% |
| Arabs | 43.3 /100 | #180 | Average 89.6% |
| Immigrants from Ethiopia | 42.5 /100 | #181 | Average 89.6% |
| Ukrainians | 42.4 /100 | #182 | Average 89.6% |
| Ethiopians | 41.2 /100 | #183 | Average 89.6% |
| Immigrants from Bulgaria | 40.7 /100 | #184 | Average 89.6% |
| Immigrants from Brazil | 40.1 /100 | #185 | Average 89.6% |
| Pueblo | 39.9 /100 | #186 | Fair 89.6% |
| South Americans | 39.6 /100 | #187 | Fair 89.5% |
| Immigrants from Nepal | 38.9 /100 | #188 | Fair 89.5% |
Immigrants from Ethiopia 1 or more Vehicles in Household Correlation Summary
| Measurement | Immigrants from Ethiopia Data | 1 or more Vehicles in Household Data |
| Minimum | 0.061% | 83.5% |
| Maximum | 33.0% | 100.0% |
| Range | 32.9% | 16.5% |
| Mean | 5.7% | 90.9% |
| Median | 4.4% | 90.4% |
| Interquartile 25% (IQ1) | 2.1% | 88.2% |
| Interquartile 75% (IQ3) | 6.8% | 92.9% |
| Interquartile Range (IQR) | 4.8% | 4.7% |
| Standard Deviation (Sample) | 6.5% | 4.0% |
| Standard Deviation (Population) | 6.4% | 4.0% |
Correlation Details
| Immigrants from Ethiopia Percentile | Sample Size | 1 or more Vehicles in Household |
[ 0.0% - 0.5% ] 0.061% | 150,619,823 | 87.5% |
[ 0.0% - 0.5% ] 0.23% | 25,215,753 | 90.7% |
[ 0.0% - 0.5% ] 0.41% | 13,374,205 | 91.1% |
[ 0.5% - 1.0% ] 0.57% | 4,757,314 | 90.3% |
[ 0.5% - 1.0% ] 0.73% | 3,448,125 | 89.3% |
[ 0.5% - 1.0% ] 0.92% | 2,593,443 | 84.7% |
[ 1.0% - 1.5% ] 1.08% | 2,698,214 | 90.2% |
[ 1.0% - 1.5% ] 1.23% | 1,602,876 | 88.2% |
[ 1.0% - 1.5% ] 1.42% | 1,248,866 | 91.2% |
[ 1.5% - 2.0% ] 1.56% | 987,685 | 87.8% |
[ 1.5% - 2.0% ] 1.73% | 717,159 | 94.5% |
[ 1.5% - 2.0% ] 1.91% | 440,302 | 90.7% |
[ 2.0% - 2.5% ] 2.07% | 336,758 | 93.2% |
[ 2.0% - 2.5% ] 2.23% | 200,034 | 90.6% |
[ 2.0% - 2.5% ] 2.38% | 224,276 | 92.9% |
[ 2.5% - 3.0% ] 2.55% | 255,766 | 92.8% |
[ 2.5% - 3.0% ] 2.72% | 405,740 | 91.7% |
[ 2.5% - 3.0% ] 2.88% | 295,675 | 90.9% |
[ 3.0% - 3.5% ] 3.06% | 219,632 | 89.3% |
[ 3.0% - 3.5% ] 3.23% | 166,439 | 91.5% |
[ 3.0% - 3.5% ] 3.40% | 110,229 | 95.0% |
[ 3.5% - 4.0% ] 3.71% | 164,183 | 88.0% |
[ 3.5% - 4.0% ] 3.86% | 263,076 | 90.4% |
[ 4.0% - 4.5% ] 4.00% | 86,662 | 95.9% |
[ 4.0% - 4.5% ] 4.16% | 33,847 | 91.9% |
[ 4.0% - 4.5% ] 4.37% | 4,161 | 89.4% |
[ 4.5% - 5.0% ] 4.60% | 73,074 | 88.8% |
[ 4.5% - 5.0% ] 4.70% | 75,806 | 89.7% |
[ 4.5% - 5.0% ] 4.95% | 4,023 | 98.5% |
[ 5.0% - 5.5% ] 5.26% | 25,324 | 89.4% |
[ 5.0% - 5.5% ] 5.37% | 29,132 | 89.7% |
[ 5.0% - 5.5% ] 5.48% | 11,716 | 99.4% |
[ 5.5% - 6.0% ] 5.85% | 97,661 | 88.0% |
[ 5.5% - 6.0% ] 5.99% | 152,984 | 84.6% |
[ 6.0% - 6.5% ] 6.24% | 4,763 | 87.2% |
[ 6.0% - 6.5% ] 6.35% | 56,737 | 91.2% |
[ 6.5% - 7.0% ] 6.51% | 81,808 | 83.5% |
[ 6.5% - 7.0% ] 6.69% | 73,292 | 88.5% |
[ 6.5% - 7.0% ] 6.82% | 23,505 | 95.0% |
[ 7.0% - 7.5% ] 7.14% | 75,534 | 88.2% |
[ 7.0% - 7.5% ] 7.28% | 30,927 | 90.4% |
[ 7.5% - 8.0% ] 7.54% | 17,542 | 85.3% |
[ 7.5% - 8.0% ] 7.71% | 27,523 | 90.0% |
[ 7.5% - 8.0% ] 7.75% | 37,207 | 93.0% |
[ 8.0% - 8.5% ] 8.50% | 18,324 | 89.8% |
[ 8.5% - 9.0% ] 8.97% | 535 | 100.0% |
[ 9.0% - 9.5% ] 9.17% | 15,489 | 85.0% |
[ 10.0% - 10.5% ] 10.11% | 14,553 | 86.4% |
[ 23.0% - 23.5% ] 23.25% | 4,572 | 95.1% |
[ 30.0% - 30.5% ] 30.48% | 105 | 100.0% |
[ 32.5% - 33.0% ] 32.97% | 182 | 100.0% |