Immigrants from England vs Slovak Wage/Income Gap
COMPARE
Immigrants from England
Slovak
Wage/Income Gap
Wage/Income Gap Comparison
Immigrants from England
Slovaks
27.9%
WAGE/INCOME GAP
0.6/ 100
METRIC RATING
278th/ 347
METRIC RANK
28.9%
WAGE/INCOME GAP
0.1/ 100
METRIC RATING
319th/ 347
METRIC RANK
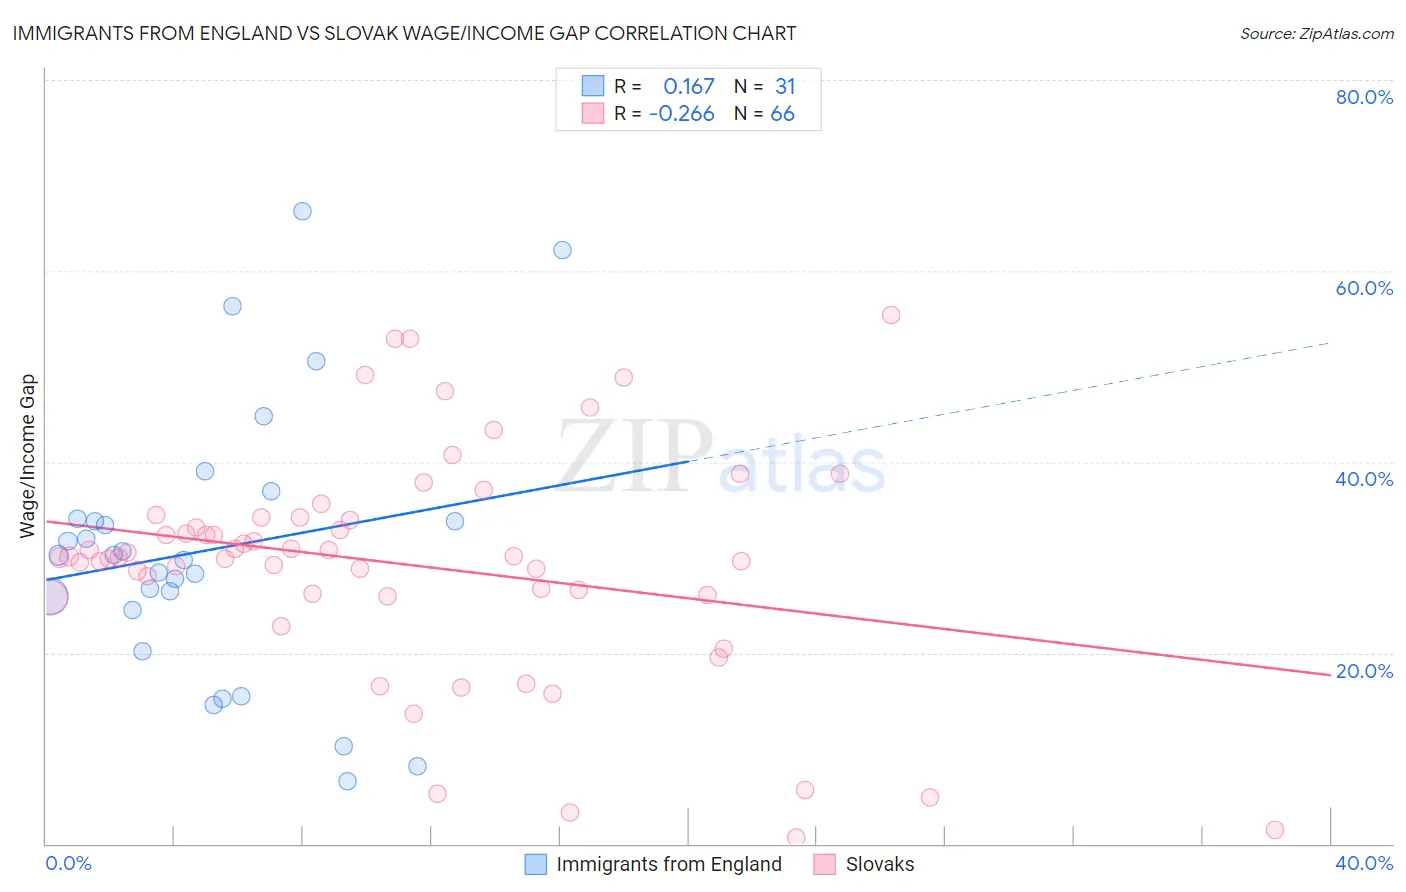
Immigrants from England vs Slovak Wage/Income Gap Correlation Chart
The statistical analysis conducted on geographies consisting of 391,474,935 people shows a poor positive correlation between the proportion of Immigrants from England and wage/income gap percentage in the United States with a correlation coefficient (R) of 0.167 and weighted average of 27.9%. Similarly, the statistical analysis conducted on geographies consisting of 397,444,585 people shows a weak negative correlation between the proportion of Slovaks and wage/income gap percentage in the United States with a correlation coefficient (R) of -0.266 and weighted average of 28.9%, a difference of 3.5%.
Wage/Income Gap Correlation Summary
| Measurement | Immigrants from England | Slovak |
| Minimum | 6.6% | 0.72% |
| Maximum | 66.3% | 55.3% |
| Range | 59.7% | 54.6% |
| Mean | 30.8% | 29.3% |
| Median | 30.2% | 30.0% |
| Interquartile 25% (IQ1) | 24.5% | 26.0% |
| Interquartile 75% (IQ3) | 34.1% | 34.2% |
| Interquartile Range (IQR) | 9.6% | 8.2% |
| Standard Deviation (Sample) | 14.3% | 11.9% |
| Standard Deviation (Population) | 14.0% | 11.8% |
Similar Demographics by Wage/Income Gap
Demographics Similar to Immigrants from England by Wage/Income Gap
In terms of wage/income gap, the demographic groups most similar to Immigrants from England are Lebanese (27.9%, a difference of 0.080%), Latvian (27.9%, a difference of 0.080%), Immigrants from Japan (27.9%, a difference of 0.11%), American (27.8%, a difference of 0.19%), and Bulgarian (27.8%, a difference of 0.23%).
| Demographics | Rating | Rank | Wage/Income Gap |
| Ute | 0.8 /100 | #271 | Tragic 27.8% |
| Immigrants | Korea | 0.8 /100 | #272 | Tragic 27.8% |
| Bulgarians | 0.7 /100 | #273 | Tragic 27.8% |
| Americans | 0.7 /100 | #274 | Tragic 27.8% |
| Immigrants | Japan | 0.7 /100 | #275 | Tragic 27.9% |
| Lebanese | 0.7 /100 | #276 | Tragic 27.9% |
| Latvians | 0.7 /100 | #277 | Tragic 27.9% |
| Immigrants | England | 0.6 /100 | #278 | Tragic 27.9% |
| Romanians | 0.5 /100 | #279 | Tragic 28.0% |
| Russians | 0.5 /100 | #280 | Tragic 28.0% |
| Burmese | 0.5 /100 | #281 | Tragic 28.0% |
| South Africans | 0.5 /100 | #282 | Tragic 28.0% |
| French Canadians | 0.4 /100 | #283 | Tragic 28.1% |
| Immigrants | Sweden | 0.4 /100 | #284 | Tragic 28.1% |
| Italians | 0.4 /100 | #285 | Tragic 28.1% |
Demographics Similar to Slovaks by Wage/Income Gap
In terms of wage/income gap, the demographic groups most similar to Slovaks are British (28.9%, a difference of 0.060%), Welsh (28.9%, a difference of 0.13%), Immigrants from Singapore (28.9%, a difference of 0.15%), Norwegian (29.0%, a difference of 0.25%), and Basque (28.8%, a difference of 0.31%).
| Demographics | Rating | Rank | Wage/Income Gap |
| Eastern Europeans | 0.1 /100 | #312 | Tragic 28.6% |
| French | 0.1 /100 | #313 | Tragic 28.7% |
| Immigrants | Scotland | 0.1 /100 | #314 | Tragic 28.7% |
| Maltese | 0.1 /100 | #315 | Tragic 28.7% |
| Lithuanians | 0.1 /100 | #316 | Tragic 28.7% |
| Belgians | 0.1 /100 | #317 | Tragic 28.8% |
| Basques | 0.1 /100 | #318 | Tragic 28.8% |
| Slovaks | 0.1 /100 | #319 | Tragic 28.9% |
| British | 0.1 /100 | #320 | Tragic 28.9% |
| Welsh | 0.1 /100 | #321 | Tragic 28.9% |
| Immigrants | Singapore | 0.1 /100 | #322 | Tragic 28.9% |
| Norwegians | 0.1 /100 | #323 | Tragic 29.0% |
| Croatians | 0.0 /100 | #324 | Tragic 29.0% |
| Hungarians | 0.0 /100 | #325 | Tragic 29.0% |
| Immigrants | Belgium | 0.0 /100 | #326 | Tragic 29.0% |