Immigrants from England vs Greek Wage/Income Gap
COMPARE
Immigrants from England
Greek
Wage/Income Gap
Wage/Income Gap Comparison
Immigrants from England
Greeks
27.9%
WAGE/INCOME GAP
0.6/ 100
METRIC RATING
278th/ 347
METRIC RANK
28.2%
WAGE/INCOME GAP
0.3/ 100
METRIC RATING
294th/ 347
METRIC RANK
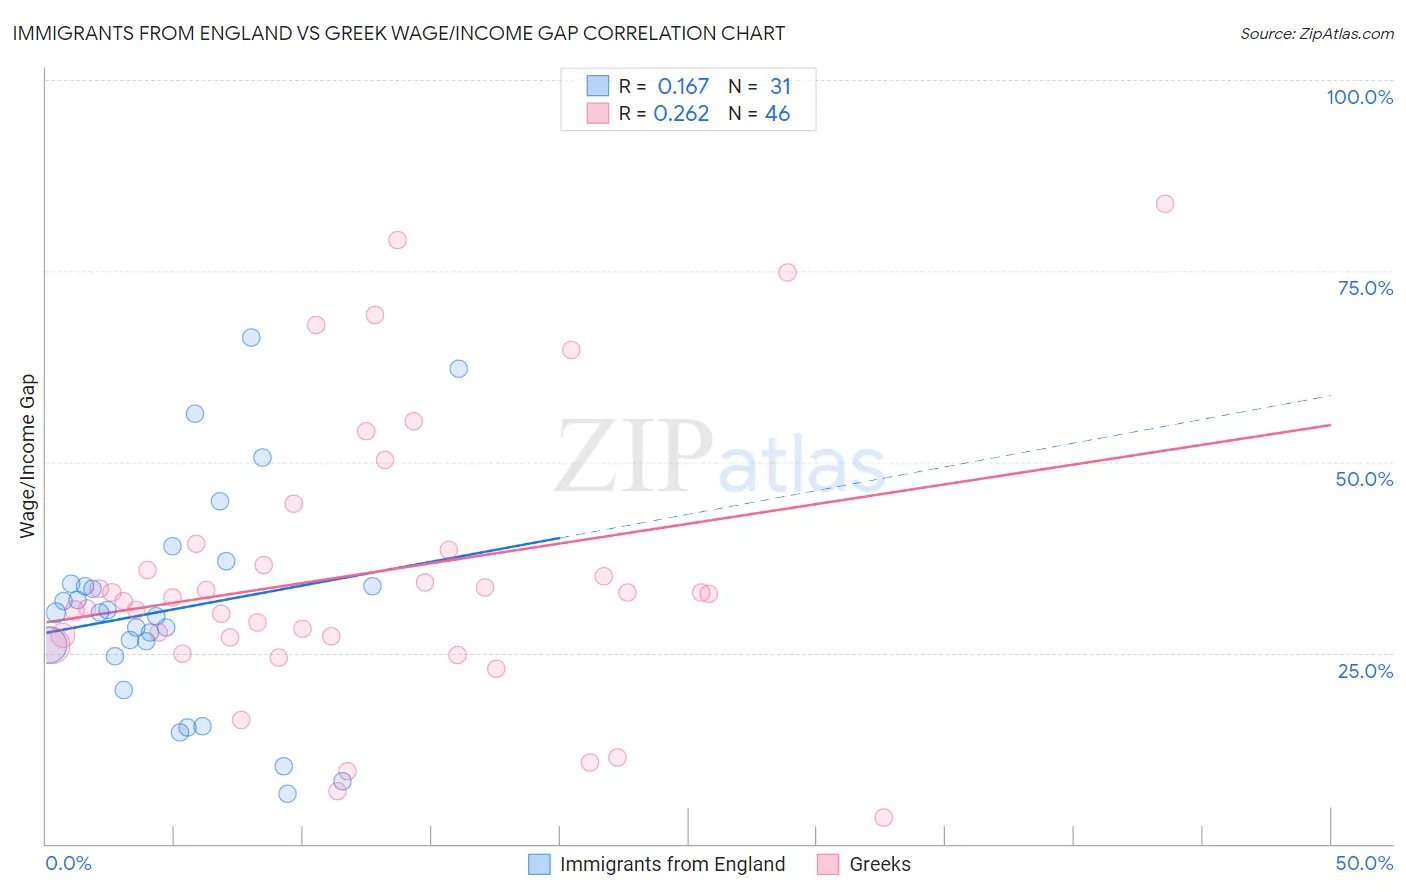
Immigrants from England vs Greek Wage/Income Gap Correlation Chart
The statistical analysis conducted on geographies consisting of 391,474,935 people shows a poor positive correlation between the proportion of Immigrants from England and wage/income gap percentage in the United States with a correlation coefficient (R) of 0.167 and weighted average of 27.9%. Similarly, the statistical analysis conducted on geographies consisting of 482,094,899 people shows a weak positive correlation between the proportion of Greeks and wage/income gap percentage in the United States with a correlation coefficient (R) of 0.262 and weighted average of 28.2%, a difference of 1.3%.
Wage/Income Gap Correlation Summary
| Measurement | Immigrants from England | Greek |
| Minimum | 6.6% | 3.5% |
| Maximum | 66.3% | 83.8% |
| Range | 59.7% | 80.3% |
| Mean | 30.8% | 35.4% |
| Median | 30.2% | 32.4% |
| Interquartile 25% (IQ1) | 24.5% | 27.0% |
| Interquartile 75% (IQ3) | 34.1% | 38.5% |
| Interquartile Range (IQR) | 9.6% | 11.5% |
| Standard Deviation (Sample) | 14.3% | 18.3% |
| Standard Deviation (Population) | 14.0% | 18.1% |
Demographics Similar to Immigrants from England and Greeks by Wage/Income Gap
In terms of wage/income gap, the demographic groups most similar to Immigrants from England are Lebanese (27.9%, a difference of 0.080%), Latvian (27.9%, a difference of 0.080%), Romanian (28.0%, a difference of 0.23%), Russian (28.0%, a difference of 0.38%), and Burmese (28.0%, a difference of 0.43%). Similarly, the demographic groups most similar to Greeks are Immigrants from Israel (28.2%, a difference of 0.020%), Immigrants from Australia (28.2%, a difference of 0.13%), Slovene (28.3%, a difference of 0.13%), Northern European (28.3%, a difference of 0.13%), and Czechoslovakian (28.2%, a difference of 0.19%).
| Demographics | Rating | Rank | Wage/Income Gap |
| Lebanese | 0.7 /100 | #276 | Tragic 27.9% |
| Latvians | 0.7 /100 | #277 | Tragic 27.9% |
| Immigrants | England | 0.6 /100 | #278 | Tragic 27.9% |
| Romanians | 0.5 /100 | #279 | Tragic 28.0% |
| Russians | 0.5 /100 | #280 | Tragic 28.0% |
| Burmese | 0.5 /100 | #281 | Tragic 28.0% |
| South Africans | 0.5 /100 | #282 | Tragic 28.0% |
| French Canadians | 0.4 /100 | #283 | Tragic 28.1% |
| Immigrants | Sweden | 0.4 /100 | #284 | Tragic 28.1% |
| Italians | 0.4 /100 | #285 | Tragic 28.1% |
| Immigrants | Austria | 0.4 /100 | #286 | Tragic 28.1% |
| Okinawans | 0.4 /100 | #287 | Tragic 28.1% |
| Choctaw | 0.4 /100 | #288 | Tragic 28.1% |
| Canadians | 0.3 /100 | #289 | Tragic 28.1% |
| Australians | 0.3 /100 | #290 | Tragic 28.2% |
| Czechoslovakians | 0.3 /100 | #291 | Tragic 28.2% |
| Immigrants | Australia | 0.3 /100 | #292 | Tragic 28.2% |
| Immigrants | Israel | 0.3 /100 | #293 | Tragic 28.2% |
| Greeks | 0.3 /100 | #294 | Tragic 28.2% |
| Slovenes | 0.3 /100 | #295 | Tragic 28.3% |
| Northern Europeans | 0.3 /100 | #296 | Tragic 28.3% |