Immigrants from Chile vs African Wage/Income Gap
COMPARE
Immigrants from Chile
African
Wage/Income Gap
Wage/Income Gap Comparison
Immigrants from Chile
Africans
25.7%
WAGE/INCOME GAP
53.2/ 100
METRIC RATING
172nd/ 347
METRIC RANK
22.9%
WAGE/INCOME GAP
99.9/ 100
METRIC RATING
77th/ 347
METRIC RANK
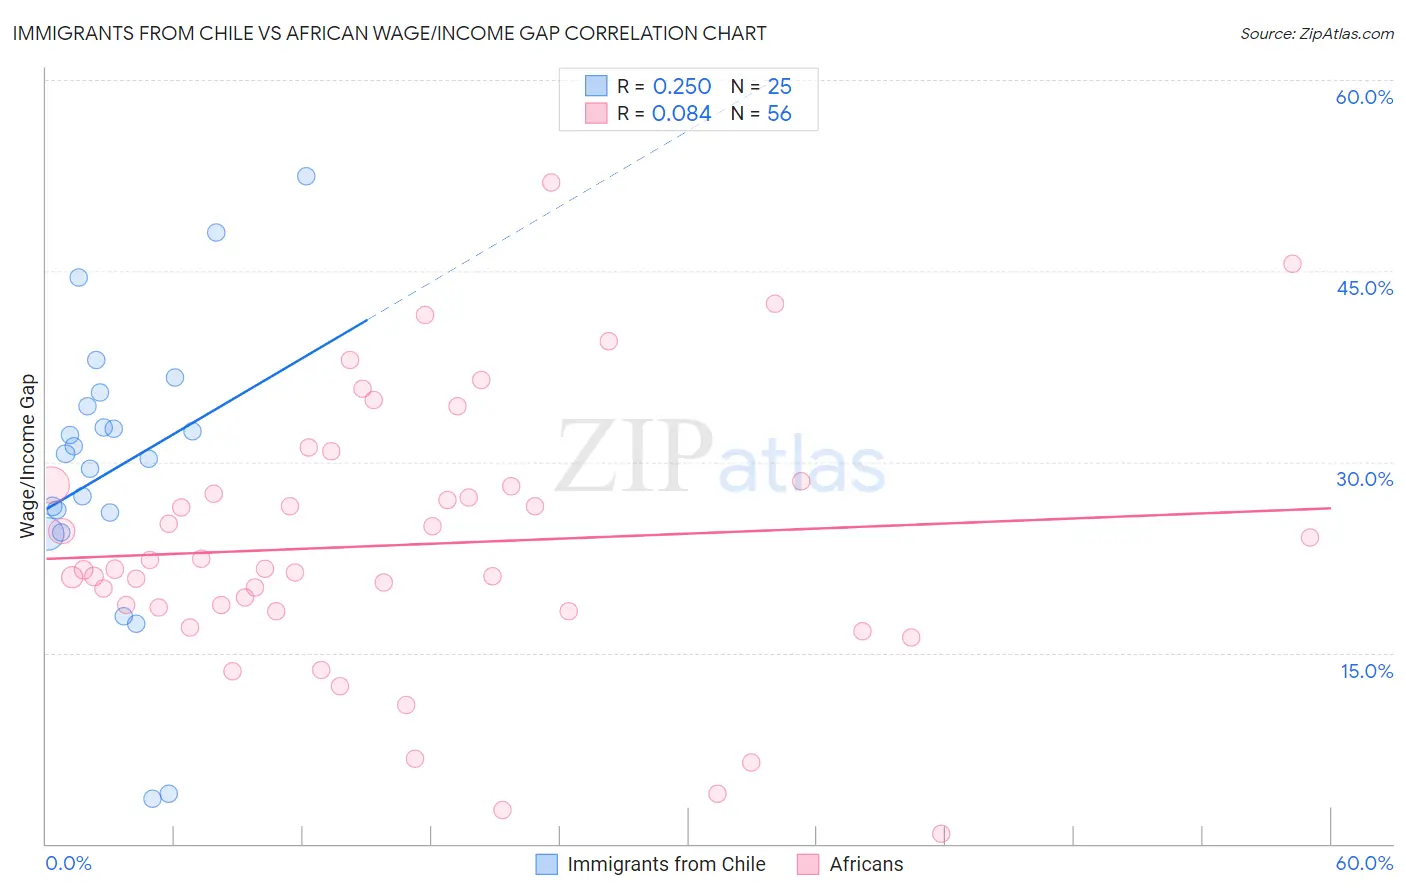
Immigrants from Chile vs African Wage/Income Gap Correlation Chart
The statistical analysis conducted on geographies consisting of 218,595,517 people shows a weak positive correlation between the proportion of Immigrants from Chile and wage/income gap percentage in the United States with a correlation coefficient (R) of 0.250 and weighted average of 25.7%. Similarly, the statistical analysis conducted on geographies consisting of 469,416,254 people shows a slight positive correlation between the proportion of Africans and wage/income gap percentage in the United States with a correlation coefficient (R) of 0.084 and weighted average of 22.9%, a difference of 12.1%.
Wage/Income Gap Correlation Summary
| Measurement | Immigrants from Chile | African |
| Minimum | 3.5% | 0.79% |
| Maximum | 52.4% | 51.9% |
| Range | 48.9% | 51.2% |
| Mean | 29.5% | 23.5% |
| Median | 30.7% | 21.6% |
| Interquartile 25% (IQ1) | 25.2% | 18.4% |
| Interquartile 75% (IQ3) | 34.9% | 28.2% |
| Interquartile Range (IQR) | 9.7% | 9.7% |
| Standard Deviation (Sample) | 11.2% | 10.5% |
| Standard Deviation (Population) | 11.0% | 10.4% |
Similar Demographics by Wage/Income Gap
Demographics Similar to Immigrants from Chile by Wage/Income Gap
In terms of wage/income gap, the demographic groups most similar to Immigrants from Chile are Immigrants from Belarus (25.7%, a difference of 0.020%), Alaskan Athabascan (25.8%, a difference of 0.21%), Immigrants from Greece (25.7%, a difference of 0.22%), Immigrants from Oceania (25.6%, a difference of 0.28%), and Sri Lankan (25.8%, a difference of 0.41%).
| Demographics | Rating | Rank | Wage/Income Gap |
| Immigrants | Hong Kong | 64.0 /100 | #165 | Good 25.5% |
| Immigrants | Ukraine | 63.8 /100 | #166 | Good 25.5% |
| Paiute | 62.9 /100 | #167 | Good 25.5% |
| Seminole | 62.6 /100 | #168 | Good 25.6% |
| Peruvians | 60.1 /100 | #169 | Good 25.6% |
| Immigrants | Oceania | 57.5 /100 | #170 | Average 25.6% |
| Immigrants | Greece | 56.6 /100 | #171 | Average 25.7% |
| Immigrants | Chile | 53.2 /100 | #172 | Average 25.7% |
| Immigrants | Belarus | 52.9 /100 | #173 | Average 25.7% |
| Alaskan Athabascans | 50.0 /100 | #174 | Average 25.8% |
| Sri Lankans | 47.0 /100 | #175 | Average 25.8% |
| Paraguayans | 46.7 /100 | #176 | Average 25.8% |
| Cambodians | 45.1 /100 | #177 | Average 25.8% |
| Chinese | 42.0 /100 | #178 | Average 25.9% |
| Samoans | 38.6 /100 | #179 | Fair 26.0% |
Demographics Similar to Africans by Wage/Income Gap
In terms of wage/income gap, the demographic groups most similar to Africans are Nigerian (23.0%, a difference of 0.11%), Ecuadorian (22.9%, a difference of 0.13%), Fijian (22.9%, a difference of 0.15%), Immigrants from Nicaragua (23.0%, a difference of 0.19%), and Salvadoran (23.0%, a difference of 0.26%).
| Demographics | Rating | Rank | Wage/Income Gap |
| Immigrants | Uzbekistan | 99.9 /100 | #70 | Exceptional 22.7% |
| Immigrants | El Salvador | 99.9 /100 | #71 | Exceptional 22.8% |
| Sub-Saharan Africans | 99.9 /100 | #72 | Exceptional 22.8% |
| Immigrants | Eastern Africa | 99.9 /100 | #73 | Exceptional 22.8% |
| Immigrants | Burma/Myanmar | 99.9 /100 | #74 | Exceptional 22.8% |
| Fijians | 99.9 /100 | #75 | Exceptional 22.9% |
| Ecuadorians | 99.9 /100 | #76 | Exceptional 22.9% |
| Africans | 99.9 /100 | #77 | Exceptional 22.9% |
| Nigerians | 99.9 /100 | #78 | Exceptional 23.0% |
| Immigrants | Nicaragua | 99.9 /100 | #79 | Exceptional 23.0% |
| Salvadorans | 99.9 /100 | #80 | Exceptional 23.0% |
| Bermudans | 99.8 /100 | #81 | Exceptional 23.1% |
| Central Americans | 99.8 /100 | #82 | Exceptional 23.1% |
| Immigrants | Africa | 99.8 /100 | #83 | Exceptional 23.2% |
| Cubans | 99.7 /100 | #84 | Exceptional 23.3% |