Immigrants from Chile vs Taiwanese Wage/Income Gap
COMPARE
Immigrants from Chile
Taiwanese
Wage/Income Gap
Wage/Income Gap Comparison
Immigrants from Chile
Taiwanese
25.7%
WAGE/INCOME GAP
53.2/ 100
METRIC RATING
172nd/ 347
METRIC RANK
25.1%
WAGE/INCOME GAP
81.6/ 100
METRIC RATING
151st/ 347
METRIC RANK
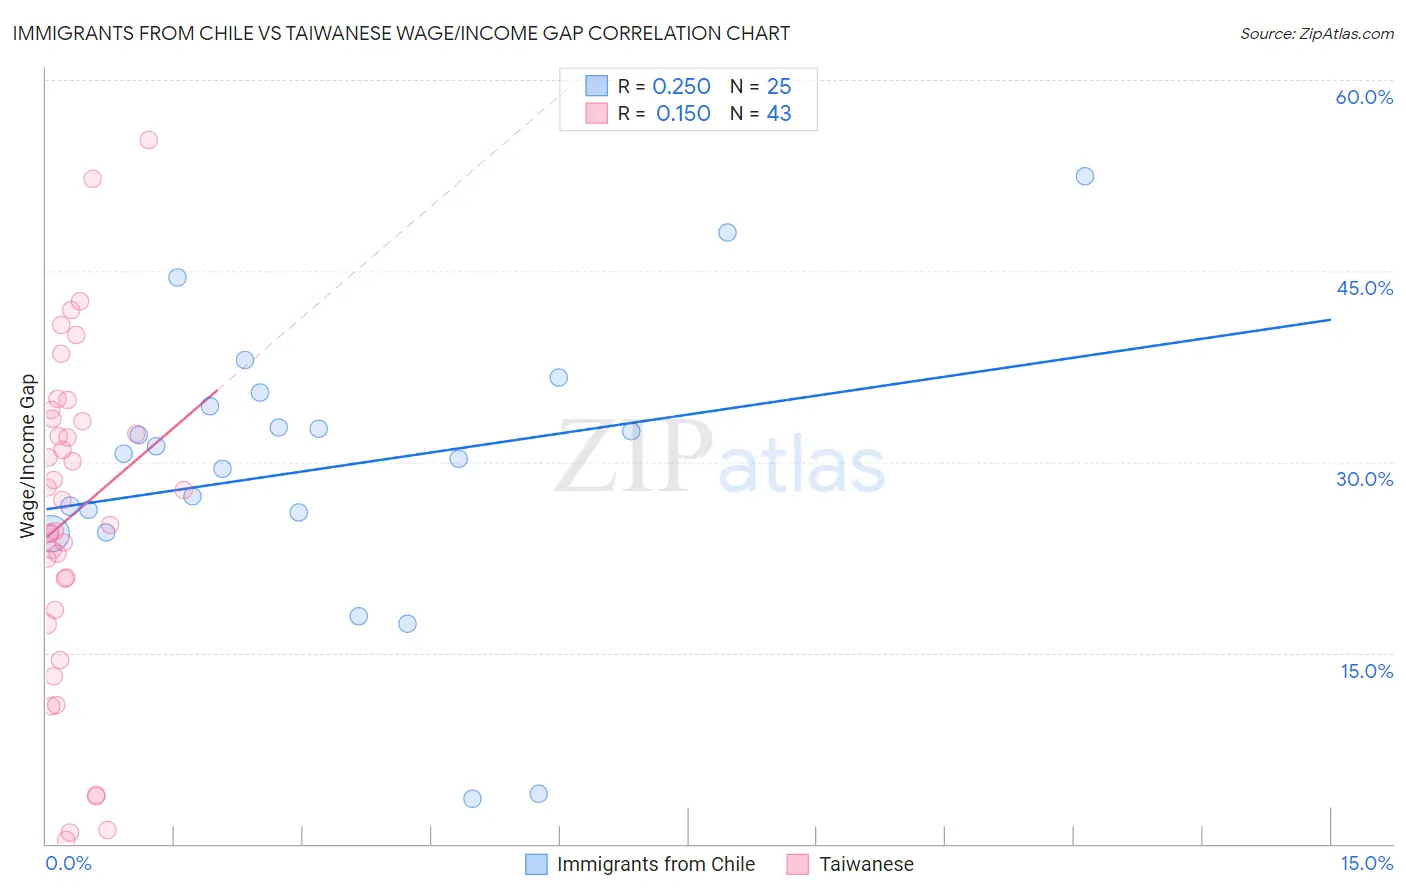
Immigrants from Chile vs Taiwanese Wage/Income Gap Correlation Chart
The statistical analysis conducted on geographies consisting of 218,595,517 people shows a weak positive correlation between the proportion of Immigrants from Chile and wage/income gap percentage in the United States with a correlation coefficient (R) of 0.250 and weighted average of 25.7%. Similarly, the statistical analysis conducted on geographies consisting of 31,719,634 people shows a poor positive correlation between the proportion of Taiwanese and wage/income gap percentage in the United States with a correlation coefficient (R) of 0.150 and weighted average of 25.1%, a difference of 2.3%.
Wage/Income Gap Correlation Summary
| Measurement | Immigrants from Chile | Taiwanese |
| Minimum | 3.5% | 0.32% |
| Maximum | 52.4% | 55.3% |
| Range | 48.9% | 55.0% |
| Mean | 29.5% | 25.8% |
| Median | 30.7% | 27.0% |
| Interquartile 25% (IQ1) | 25.2% | 18.4% |
| Interquartile 75% (IQ3) | 34.9% | 33.4% |
| Interquartile Range (IQR) | 9.7% | 15.0% |
| Standard Deviation (Sample) | 11.2% | 13.0% |
| Standard Deviation (Population) | 11.0% | 12.8% |
Similar Demographics by Wage/Income Gap
Demographics Similar to Immigrants from Chile by Wage/Income Gap
In terms of wage/income gap, the demographic groups most similar to Immigrants from Chile are Immigrants from Belarus (25.7%, a difference of 0.020%), Alaskan Athabascan (25.8%, a difference of 0.21%), Immigrants from Greece (25.7%, a difference of 0.22%), Immigrants from Oceania (25.6%, a difference of 0.28%), and Sri Lankan (25.8%, a difference of 0.41%).
| Demographics | Rating | Rank | Wage/Income Gap |
| Immigrants | Hong Kong | 64.0 /100 | #165 | Good 25.5% |
| Immigrants | Ukraine | 63.8 /100 | #166 | Good 25.5% |
| Paiute | 62.9 /100 | #167 | Good 25.5% |
| Seminole | 62.6 /100 | #168 | Good 25.6% |
| Peruvians | 60.1 /100 | #169 | Good 25.6% |
| Immigrants | Oceania | 57.5 /100 | #170 | Average 25.6% |
| Immigrants | Greece | 56.6 /100 | #171 | Average 25.7% |
| Immigrants | Chile | 53.2 /100 | #172 | Average 25.7% |
| Immigrants | Belarus | 52.9 /100 | #173 | Average 25.7% |
| Alaskan Athabascans | 50.0 /100 | #174 | Average 25.8% |
| Sri Lankans | 47.0 /100 | #175 | Average 25.8% |
| Paraguayans | 46.7 /100 | #176 | Average 25.8% |
| Cambodians | 45.1 /100 | #177 | Average 25.8% |
| Chinese | 42.0 /100 | #178 | Average 25.9% |
| Samoans | 38.6 /100 | #179 | Fair 26.0% |
Demographics Similar to Taiwanese by Wage/Income Gap
In terms of wage/income gap, the demographic groups most similar to Taiwanese are Uruguayan (25.2%, a difference of 0.030%), Immigrants (25.1%, a difference of 0.080%), Immigrants from Peru (25.1%, a difference of 0.12%), Iroquois (25.1%, a difference of 0.27%), and Blackfeet (25.2%, a difference of 0.36%).
| Demographics | Rating | Rank | Wage/Income Gap |
| Chippewa | 86.9 /100 | #144 | Excellent 25.0% |
| Comanche | 85.2 /100 | #145 | Excellent 25.0% |
| South Americans | 85.2 /100 | #146 | Excellent 25.0% |
| Malaysians | 84.9 /100 | #147 | Excellent 25.0% |
| Iroquois | 83.9 /100 | #148 | Excellent 25.1% |
| Immigrants | Peru | 82.6 /100 | #149 | Excellent 25.1% |
| Immigrants | Immigrants | 82.3 /100 | #150 | Excellent 25.1% |
| Taiwanese | 81.6 /100 | #151 | Excellent 25.1% |
| Uruguayans | 81.3 /100 | #152 | Excellent 25.2% |
| Blackfeet | 78.1 /100 | #153 | Good 25.2% |
| Immigrants | Northern Africa | 78.1 /100 | #154 | Good 25.2% |
| Immigrants | Vietnam | 77.7 /100 | #155 | Good 25.2% |
| Immigrants | Mexico | 76.4 /100 | #156 | Good 25.3% |
| Costa Ricans | 75.8 /100 | #157 | Good 25.3% |
| Immigrants | Zimbabwe | 73.7 /100 | #158 | Good 25.3% |