Immigrants from Central America Disability Age 5 to 17
COMPARE
Immigrants from Central America
Select to Compare
Disability Age 5 to 17
Immigrants from Central America Disability Age 5 to 17
5.6%
DISABILITY | AGE 5 TO 17
49.4/ 100
METRIC RATING
176th/ 347
METRIC RANK
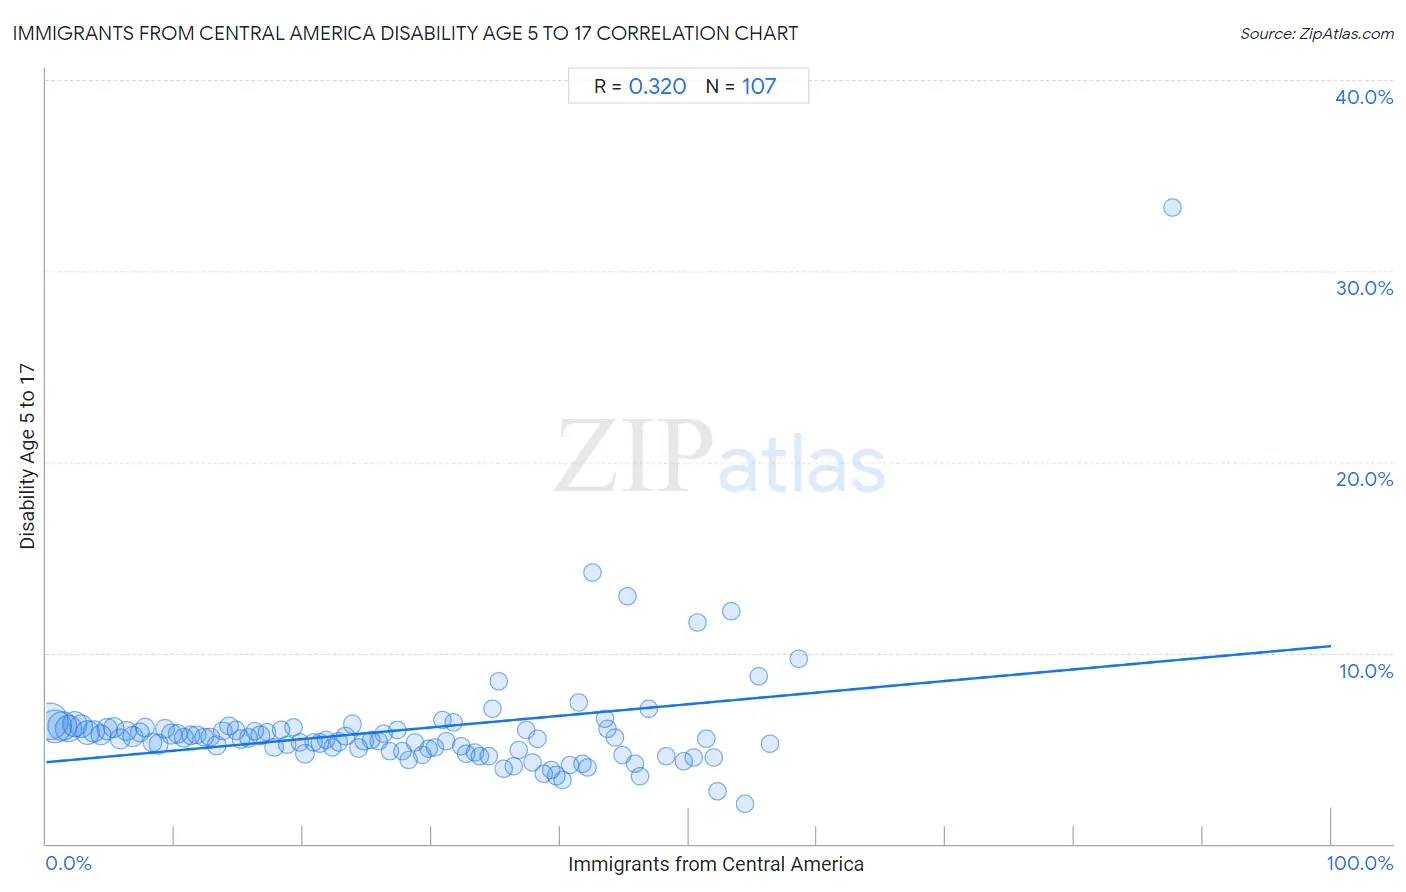
Immigrants from Central America Disability Age 5 to 17 Correlation Chart
The statistical analysis conducted on geographies consisting of 527,600,457 people shows a mild positive correlation between the proportion of Immigrants from Central America and percentage of population with a disability between the ages 5 and 17 in the United States with a correlation coefficient (R) of 0.320 and weighted average of 5.6%. On average, for every 1% (one percent) increase in Immigrants from Central America within a typical geography, there is an increase of 0.061% in percentage of population with a disability between the ages 5 and 17.
It is essential to understand that the correlation between the percentage of Immigrants from Central America and percentage of population with a disability between the ages 5 and 17 does not imply a direct cause-and-effect relationship. It remains uncertain whether the presence of Immigrants from Central America influences an upward or downward trend in the level of percentage of population with a disability between the ages 5 and 17 within an area, or if Immigrants from Central America simply ended up residing in those areas with higher or lower levels of percentage of population with a disability between the ages 5 and 17 due to other factors.
Demographics Similar to Immigrants from Central America by Disability Age 5 to 17
In terms of disability age 5 to 17, the demographic groups most similar to Immigrants from Central America are Shoshone (5.6%, a difference of 0.0%), Costa Rican (5.6%, a difference of 0.030%), Uruguayan (5.6%, a difference of 0.080%), Immigrants from Western Europe (5.6%, a difference of 0.080%), and Immigrants from Trinidad and Tobago (5.6%, a difference of 0.090%).
| Demographics | Rating | Rank | Disability Age 5 to 17 |
| Immigrants from Norway | 55.7 /100 | #169 | Average 5.6% |
| Serbians | 54.0 /100 | #170 | Average 5.6% |
| Immigrants from Iraq | 53.9 /100 | #171 | Average 5.6% |
| Ukrainians | 51.5 /100 | #172 | Average 5.6% |
| Uruguayans | 51.0 /100 | #173 | Average 5.6% |
| Costa Ricans | 50.0 /100 | #174 | Average 5.6% |
| Shoshone | 49.4 /100 | #175 | Average 5.6% |
| Immigrants from Central America | 49.4 /100 | #176 | Average 5.6% |
| Immigrants from Western Europe | 47.8 /100 | #177 | Average 5.6% |
| Immigrants from Trinidad and Tobago | 47.6 /100 | #178 | Average 5.6% |
| Immigrants from Barbados | 40.5 /100 | #179 | Average 5.6% |
| Immigrants from Uruguay | 37.7 /100 | #180 | Fair 5.6% |
| Immigrants from England | 36.4 /100 | #181 | Fair 5.6% |
| Mexican American Indians | 35.2 /100 | #182 | Fair 5.6% |
| Immigrants from Latin America | 34.3 /100 | #183 | Fair 5.6% |
Immigrants from Central America Disability Age 5 to 17 Correlation Summary
| Measurement | Immigrants from Central America Data | Disability Age 5 to 17 Data |
| Minimum | 0.25% | 2.1% |
| Maximum | 87.6% | 33.3% |
| Range | 87.4% | 31.2% |
| Mean | 27.4% | 5.9% |
| Median | 26.7% | 5.5% |
| Interquartile 25% (IQ1) | 13.3% | 4.9% |
| Interquartile 75% (IQ3) | 40.2% | 6.0% |
| Interquartile Range (IQR) | 26.9% | 1.2% |
| Standard Deviation (Sample) | 16.9% | 3.2% |
| Standard Deviation (Population) | 16.8% | 3.2% |
Correlation Details
| Immigrants from Central America Percentile | Sample Size | Disability Age 5 to 17 |
[ 0.0% - 0.5% ] 0.25% | 85,109,313 | 6.4% |
[ 0.5% - 1.0% ] 0.73% | 66,361,974 | 6.2% |
[ 1.0% - 1.5% ] 1.24% | 52,890,827 | 6.2% |
[ 1.5% - 2.0% ] 1.75% | 41,568,347 | 6.0% |
[ 2.0% - 2.5% ] 2.24% | 30,568,018 | 6.3% |
[ 2.5% - 3.0% ] 2.74% | 23,474,918 | 6.1% |
[ 3.0% - 3.5% ] 3.25% | 28,080,955 | 5.8% |
[ 3.5% - 4.0% ] 3.73% | 15,927,828 | 5.9% |
[ 4.0% - 4.5% ] 4.24% | 12,949,621 | 5.7% |
[ 4.5% - 5.0% ] 4.72% | 13,771,951 | 6.0% |
[ 5.0% - 5.5% ] 5.26% | 10,759,848 | 6.1% |
[ 5.5% - 6.0% ] 5.74% | 9,990,413 | 5.5% |
[ 6.0% - 6.5% ] 6.25% | 8,269,434 | 5.9% |
[ 6.5% - 7.0% ] 6.72% | 8,147,327 | 5.6% |
[ 7.0% - 7.5% ] 7.26% | 6,586,048 | 5.9% |
[ 7.5% - 8.0% ] 7.71% | 5,476,591 | 6.1% |
[ 8.0% - 8.5% ] 8.29% | 5,707,381 | 5.3% |
[ 8.5% - 9.0% ] 8.77% | 7,271,192 | 5.2% |
[ 9.0% - 9.5% ] 9.27% | 5,719,100 | 6.0% |
[ 9.5% - 10.0% ] 9.74% | 8,107,270 | 5.7% |
[ 10.0% - 10.5% ] 10.22% | 4,387,782 | 5.8% |
[ 10.5% - 11.0% ] 10.75% | 3,901,136 | 5.6% |
[ 11.0% - 11.5% ] 11.26% | 2,646,228 | 5.7% |
[ 11.5% - 12.0% ] 11.70% | 1,850,719 | 5.7% |
[ 12.0% - 12.5% ] 12.27% | 2,855,792 | 5.6% |
[ 12.5% - 13.0% ] 12.73% | 4,367,678 | 5.6% |
[ 13.0% - 13.5% ] 13.26% | 2,583,150 | 5.2% |
[ 13.5% - 14.0% ] 13.74% | 2,800,268 | 5.9% |
[ 14.0% - 14.5% ] 14.24% | 2,824,536 | 6.2% |
[ 14.5% - 15.0% ] 14.76% | 1,856,362 | 5.9% |
[ 15.0% - 15.5% ] 15.18% | 2,251,485 | 5.5% |
[ 15.5% - 16.0% ] 15.76% | 1,839,054 | 5.6% |
[ 16.0% - 16.5% ] 16.26% | 1,567,452 | 5.9% |
[ 16.5% - 17.0% ] 16.65% | 2,997,861 | 5.7% |
[ 17.0% - 17.5% ] 17.18% | 3,687,498 | 5.9% |
[ 17.5% - 18.0% ] 17.74% | 1,996,120 | 5.1% |
[ 18.0% - 18.5% ] 18.25% | 1,672,705 | 6.0% |
[ 18.5% - 19.0% ] 18.74% | 2,493,093 | 5.2% |
[ 19.0% - 19.5% ] 19.26% | 1,384,783 | 6.1% |
[ 19.5% - 20.0% ] 19.74% | 1,363,414 | 5.3% |
[ 20.0% - 20.5% ] 20.09% | 6,079,456 | 4.7% |
[ 20.5% - 21.0% ] 20.77% | 1,397,711 | 5.3% |
[ 21.0% - 21.5% ] 21.28% | 980,110 | 5.3% |
[ 21.5% - 22.0% ] 21.78% | 1,188,200 | 5.5% |
[ 22.0% - 22.5% ] 22.30% | 890,058 | 5.1% |
[ 22.5% - 23.0% ] 22.73% | 897,195 | 5.3% |
[ 23.0% - 23.5% ] 23.28% | 1,486,616 | 5.6% |
[ 23.5% - 24.0% ] 23.79% | 1,070,392 | 6.3% |
[ 24.0% - 24.5% ] 24.29% | 1,126,014 | 5.0% |
[ 24.5% - 25.0% ] 24.76% | 844,151 | 5.4% |
[ 25.0% - 25.5% ] 25.30% | 702,336 | 5.4% |
[ 25.5% - 26.0% ] 25.84% | 587,655 | 5.4% |
[ 26.0% - 26.5% ] 26.23% | 1,072,717 | 5.7% |
[ 26.5% - 27.0% ] 26.71% | 475,664 | 4.9% |
[ 27.0% - 27.5% ] 27.32% | 525,118 | 6.0% |
[ 27.5% - 28.0% ] 27.68% | 1,027,394 | 4.9% |
[ 28.0% - 28.5% ] 28.24% | 557,553 | 4.4% |
[ 28.5% - 29.0% ] 28.70% | 348,774 | 5.3% |
[ 29.0% - 29.5% ] 29.30% | 787,934 | 4.7% |
[ 29.5% - 30.0% ] 29.78% | 559,704 | 5.0% |
[ 30.0% - 30.5% ] 30.26% | 486,827 | 5.0% |
[ 30.5% - 31.0% ] 30.82% | 225,501 | 6.5% |
[ 31.0% - 31.5% ] 31.17% | 203,737 | 5.4% |
[ 31.5% - 32.0% ] 31.73% | 994,859 | 6.3% |
[ 32.0% - 32.5% ] 32.25% | 274,974 | 5.1% |
[ 32.5% - 33.0% ] 32.68% | 366,461 | 4.7% |
[ 33.0% - 33.5% ] 33.38% | 211,708 | 4.8% |
[ 33.5% - 34.0% ] 33.80% | 389,112 | 4.6% |
[ 34.0% - 34.5% ] 34.41% | 200,380 | 4.6% |
[ 34.5% - 35.0% ] 34.70% | 162,593 | 7.1% |
[ 35.0% - 35.5% ] 35.21% | 60,123 | 8.5% |
[ 35.5% - 36.0% ] 35.62% | 132,680 | 3.9% |
[ 36.0% - 36.5% ] 36.37% | 308,047 | 4.1% |
[ 36.5% - 37.0% ] 36.73% | 333,570 | 4.9% |
[ 37.0% - 37.5% ] 37.31% | 186,248 | 6.0% |
[ 37.5% - 38.0% ] 37.80% | 225,274 | 4.3% |
[ 38.0% - 38.5% ] 38.25% | 200,241 | 5.5% |
[ 38.5% - 39.0% ] 38.69% | 143,367 | 3.7% |
[ 39.0% - 39.5% ] 39.32% | 150,532 | 3.9% |
[ 39.5% - 40.0% ] 39.69% | 288,468 | 3.6% |
[ 40.0% - 40.5% ] 40.20% | 125,795 | 3.3% |
[ 40.5% - 41.0% ] 40.73% | 256,152 | 4.2% |
[ 41.0% - 41.5% ] 41.43% | 15,528 | 7.4% |
[ 41.5% - 42.0% ] 41.71% | 205,663 | 4.2% |
[ 42.0% - 42.5% ] 42.13% | 80,258 | 4.0% |
[ 42.5% - 43.0% ] 42.53% | 569 | 14.2% |
[ 43.0% - 43.5% ] 43.45% | 47,611 | 6.5% |
[ 43.5% - 44.0% ] 43.67% | 108,589 | 6.0% |
[ 44.0% - 44.5% ] 44.29% | 260,530 | 5.6% |
[ 44.5% - 45.0% ] 44.82% | 44,450 | 4.6% |
[ 45.0% - 45.5% ] 45.27% | 18,993 | 13.0% |
[ 45.5% - 46.0% ] 45.84% | 66,729 | 4.2% |
[ 46.0% - 46.5% ] 46.24% | 9,078 | 3.6% |
[ 46.5% - 47.0% ] 46.88% | 54,879 | 7.1% |
[ 48.0% - 48.5% ] 48.20% | 3,170 | 4.6% |
[ 49.5% - 50.0% ] 49.62% | 794 | 4.3% |
[ 50.0% - 50.5% ] 50.37% | 19,115 | 4.5% |
[ 50.5% - 51.0% ] 50.67% | 1,352 | 11.6% |
[ 51.0% - 51.5% ] 51.33% | 5,922 | 5.5% |
[ 51.5% - 52.0% ] 51.93% | 12,603 | 4.5% |
[ 52.0% - 52.5% ] 52.24% | 892 | 2.7% |
[ 53.0% - 53.5% ] 53.33% | 812 | 12.1% |
[ 54.0% - 54.5% ] 54.39% | 21,933 | 2.1% |
[ 55.0% - 55.5% ] 55.44% | 3,191 | 8.8% |
[ 56.0% - 56.5% ] 56.34% | 13,137 | 5.2% |
[ 58.5% - 59.0% ] 58.58% | 7,689 | 9.7% |
[ 87.5% - 88.0% ] 87.63% | 97 | 33.3% |