Immigrants from Central America Married-couple Households
COMPARE
Immigrants from Central America
Select to Compare
Married-couple Households
Immigrants from Central America Married-couple Households
45.7%
MARRIED-COUPLE HOUSEHOLDS
14.2/ 100
METRIC RATING
202nd/ 347
METRIC RANK
Immigrants from Central America Married-couple Households Correlation Chart
The statistical analysis conducted on geographies consisting of 536,047,937 people shows a moderate positive correlation between the proportion of Immigrants from Central America and percentage of married-couple family households in the United States with a correlation coefficient (R) of 0.415 and weighted average of 45.7%. On average, for every 1% (one percent) increase in Immigrants from Central America within a typical geography, there is an increase of 0.26% in percentage of married-couple family households.
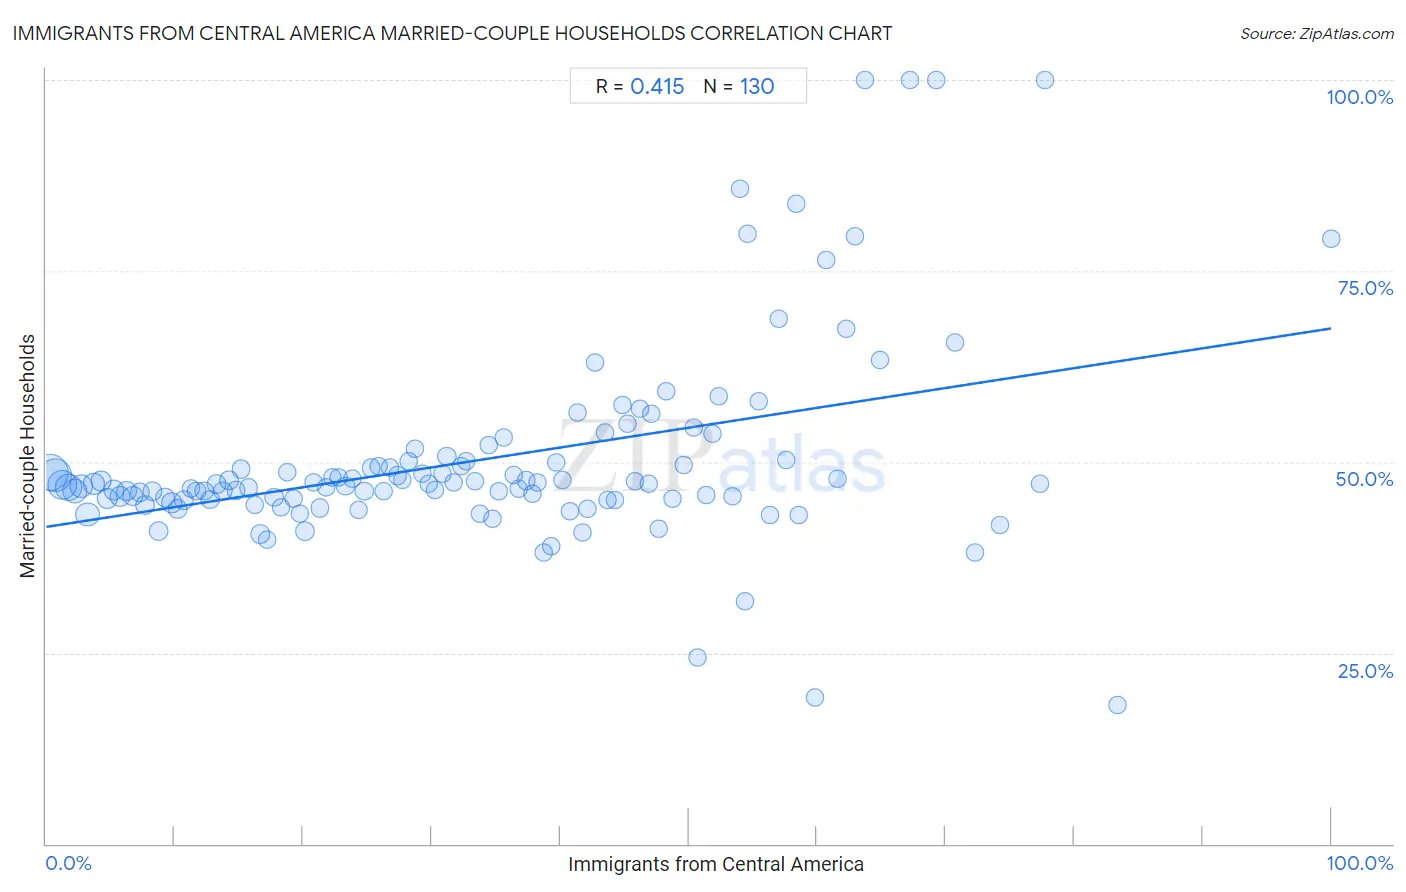
It is essential to understand that the correlation between the percentage of Immigrants from Central America and percentage of married-couple family households does not imply a direct cause-and-effect relationship. It remains uncertain whether the presence of Immigrants from Central America influences an upward or downward trend in the level of percentage of married-couple family households within an area, or if Immigrants from Central America simply ended up residing in those areas with higher or lower levels of percentage of married-couple family households due to other factors.
Demographics Similar to Immigrants from Central America by Married-couple Households
In terms of married-couple households, the demographic groups most similar to Immigrants from Central America are Immigrants from Serbia (45.7%, a difference of 0.080%), Alaska Native (45.6%, a difference of 0.090%), Potawatomi (45.7%, a difference of 0.11%), Carpatho Rusyn (45.7%, a difference of 0.12%), and Aleut (45.6%, a difference of 0.14%).
| Demographics | Rating | Rank | Married-couple Households |
| Chickasaw | 22.7 /100 | #195 | Fair 45.9% |
| Immigrants from South America | 22.2 /100 | #196 | Fair 45.9% |
| Cambodians | 21.3 /100 | #197 | Fair 45.9% |
| Ottawa | 19.4 /100 | #198 | Poor 45.8% |
| Carpatho Rusyns | 15.7 /100 | #199 | Poor 45.7% |
| Potawatomi | 15.6 /100 | #200 | Poor 45.7% |
| Immigrants from Serbia | 15.2 /100 | #201 | Poor 45.7% |
| Immigrants from Central America | 14.2 /100 | #202 | Poor 45.7% |
| Alaska Natives | 13.0 /100 | #203 | Poor 45.6% |
| Aleuts | 12.5 /100 | #204 | Poor 45.6% |
| Nepalese | 11.9 /100 | #205 | Poor 45.6% |
| Uruguayans | 10.4 /100 | #206 | Poor 45.5% |
| Immigrants from France | 8.8 /100 | #207 | Tragic 45.4% |
| Hispanics or Latinos | 8.7 /100 | #208 | Tragic 45.4% |
| Immigrants from Uzbekistan | 8.4 /100 | #209 | Tragic 45.4% |
Immigrants from Central America Married-couple Households Correlation Summary
| Measurement | Immigrants from Central America Data | Married-couple Households Data |
| Minimum | 0.25% | 18.2% |
| Maximum | 100.0% | 100.0% |
| Range | 99.7% | 81.8% |
| Mean | 33.8% | 50.3% |
| Median | 32.5% | 47.1% |
| Interquartile 25% (IQ1) | 16.3% | 45.1% |
| Interquartile 75% (IQ3) | 48.7% | 50.1% |
| Interquartile Range (IQR) | 32.5% | 5.0% |
| Standard Deviation (Sample) | 21.2% | 13.3% |
| Standard Deviation (Population) | 21.1% | 13.2% |
Correlation Details
| Immigrants from Central America Percentile | Sample Size | Married-couple Households |
[ 0.0% - 0.5% ] 0.25% | 87,048,193 | 48.6% |
[ 0.5% - 1.0% ] 0.73% | 67,715,201 | 48.2% |
[ 1.0% - 1.5% ] 1.24% | 53,699,441 | 47.0% |
[ 1.5% - 2.0% ] 1.75% | 42,096,650 | 46.6% |
[ 2.0% - 2.5% ] 2.24% | 31,036,209 | 46.1% |
[ 2.5% - 3.0% ] 2.74% | 23,814,829 | 46.9% |
[ 3.0% - 3.5% ] 3.25% | 28,410,080 | 43.1% |
[ 3.5% - 4.0% ] 3.73% | 16,146,799 | 47.1% |
[ 4.0% - 4.5% ] 4.24% | 13,166,068 | 47.5% |
[ 4.5% - 5.0% ] 4.72% | 13,952,602 | 45.2% |
[ 5.0% - 5.5% ] 5.26% | 10,933,107 | 46.3% |
[ 5.5% - 6.0% ] 5.74% | 10,111,856 | 45.5% |
[ 6.0% - 6.5% ] 6.25% | 8,361,394 | 46.2% |
[ 6.5% - 7.0% ] 6.72% | 8,221,526 | 45.5% |
[ 7.0% - 7.5% ] 7.26% | 6,704,353 | 46.1% |
[ 7.5% - 8.0% ] 7.71% | 5,560,584 | 44.4% |
[ 8.0% - 8.5% ] 8.29% | 5,799,137 | 46.1% |
[ 8.5% - 9.0% ] 8.77% | 7,354,277 | 40.9% |
[ 9.0% - 9.5% ] 9.27% | 5,783,058 | 45.4% |
[ 9.5% - 10.0% ] 9.74% | 8,200,162 | 44.6% |
[ 10.0% - 10.5% ] 10.22% | 4,448,148 | 43.9% |
[ 10.5% - 11.0% ] 10.75% | 3,951,434 | 45.0% |
[ 11.0% - 11.5% ] 11.26% | 2,718,603 | 46.6% |
[ 11.5% - 12.0% ] 11.70% | 1,884,749 | 46.2% |
[ 12.0% - 12.5% ] 12.27% | 2,901,346 | 46.2% |
[ 12.5% - 13.0% ] 12.73% | 4,410,511 | 45.1% |
[ 13.0% - 13.5% ] 13.26% | 2,628,455 | 47.1% |
[ 13.5% - 14.0% ] 13.74% | 2,862,976 | 46.2% |
[ 14.0% - 14.5% ] 14.24% | 2,865,539 | 47.6% |
[ 14.5% - 15.0% ] 14.76% | 1,876,918 | 46.2% |
[ 15.0% - 15.5% ] 15.19% | 2,272,581 | 49.0% |
[ 15.5% - 16.0% ] 15.76% | 1,867,308 | 46.6% |
[ 16.0% - 16.5% ] 16.26% | 1,577,215 | 44.4% |
[ 16.5% - 17.0% ] 16.65% | 3,024,818 | 40.6% |
[ 17.0% - 17.5% ] 17.18% | 3,712,821 | 39.8% |
[ 17.5% - 18.0% ] 17.74% | 2,009,452 | 45.3% |
[ 18.0% - 18.5% ] 18.25% | 1,688,062 | 44.0% |
[ 18.5% - 19.0% ] 18.74% | 2,507,844 | 48.7% |
[ 19.0% - 19.5% ] 19.26% | 1,399,362 | 45.2% |
[ 19.5% - 20.0% ] 19.74% | 1,373,027 | 43.3% |
[ 20.0% - 20.5% ] 20.09% | 6,092,813 | 40.9% |
[ 20.5% - 21.0% ] 20.77% | 1,404,486 | 47.3% |
[ 21.0% - 21.5% ] 21.28% | 998,173 | 44.0% |
[ 21.5% - 22.0% ] 21.78% | 1,210,108 | 46.6% |
[ 22.0% - 22.5% ] 22.30% | 903,859 | 48.0% |
[ 22.5% - 23.0% ] 22.73% | 921,202 | 47.9% |
[ 23.0% - 23.5% ] 23.28% | 1,500,581 | 46.9% |
[ 23.5% - 24.0% ] 23.79% | 1,091,443 | 47.8% |
[ 24.0% - 24.5% ] 24.29% | 1,135,458 | 43.8% |
[ 24.5% - 25.0% ] 24.76% | 861,787 | 46.2% |
[ 25.0% - 25.5% ] 25.30% | 714,994 | 49.2% |
[ 25.5% - 26.0% ] 25.84% | 601,289 | 49.4% |
[ 26.0% - 26.5% ] 26.23% | 1,073,715 | 46.2% |
[ 26.5% - 27.0% ] 26.72% | 491,216 | 49.3% |
[ 27.0% - 27.5% ] 27.32% | 535,854 | 48.2% |
[ 27.5% - 28.0% ] 27.68% | 1,054,760 | 47.7% |
[ 28.0% - 28.5% ] 28.23% | 563,946 | 50.1% |
[ 28.5% - 29.0% ] 28.70% | 352,659 | 51.8% |
[ 29.0% - 29.5% ] 29.30% | 790,541 | 48.4% |
[ 29.5% - 30.0% ] 29.78% | 564,486 | 47.2% |
[ 30.0% - 30.5% ] 30.26% | 497,714 | 46.3% |
[ 30.5% - 31.0% ] 30.82% | 232,146 | 48.5% |
[ 31.0% - 31.5% ] 31.18% | 207,116 | 50.7% |
[ 31.5% - 32.0% ] 31.73% | 995,540 | 47.4% |
[ 32.0% - 32.5% ] 32.25% | 275,799 | 49.4% |
[ 32.5% - 33.0% ] 32.68% | 369,325 | 50.1% |
[ 33.0% - 33.5% ] 33.38% | 213,172 | 47.4% |
[ 33.5% - 34.0% ] 33.80% | 391,639 | 43.3% |
[ 34.0% - 34.5% ] 34.40% | 204,429 | 52.1% |
[ 34.5% - 35.0% ] 34.70% | 167,454 | 42.6% |
[ 35.0% - 35.5% ] 35.21% | 65,718 | 46.1% |
[ 35.5% - 36.0% ] 35.63% | 140,248 | 53.2% |
[ 36.0% - 36.5% ] 36.36% | 309,978 | 48.3% |
[ 36.5% - 37.0% ] 36.73% | 334,418 | 46.4% |
[ 37.0% - 37.5% ] 37.31% | 192,048 | 47.6% |
[ 37.5% - 38.0% ] 37.80% | 227,085 | 45.8% |
[ 38.0% - 38.5% ] 38.25% | 201,517 | 47.4% |
[ 38.5% - 39.0% ] 38.69% | 146,866 | 38.1% |
[ 39.0% - 39.5% ] 39.32% | 151,683 | 39.0% |
[ 39.5% - 40.0% ] 39.69% | 290,098 | 49.9% |
[ 40.0% - 40.5% ] 40.20% | 127,958 | 47.6% |
[ 40.5% - 41.0% ] 40.73% | 259,503 | 43.5% |
[ 41.0% - 41.5% ] 41.33% | 26,564 | 56.5% |
[ 41.5% - 42.0% ] 41.71% | 208,415 | 40.8% |
[ 42.0% - 42.5% ] 42.14% | 84,249 | 43.8% |
[ 42.5% - 43.0% ] 42.73% | 5,816 | 63.1% |
[ 43.0% - 43.5% ] 43.44% | 49,238 | 53.8% |
[ 43.5% - 44.0% ] 43.67% | 110,643 | 45.0% |
[ 44.0% - 44.5% ] 44.29% | 261,369 | 45.1% |
[ 44.5% - 45.0% ] 44.81% | 45,930 | 57.4% |
[ 45.0% - 45.5% ] 45.26% | 20,284 | 54.9% |
[ 45.5% - 46.0% ] 45.81% | 81,498 | 47.4% |
[ 46.0% - 46.5% ] 46.24% | 9,714 | 56.9% |
[ 46.5% - 47.0% ] 46.87% | 59,577 | 47.2% |
[ 47.0% - 47.5% ] 47.06% | 34 | 56.2% |
[ 47.5% - 48.0% ] 47.62% | 504 | 41.2% |
[ 48.0% - 48.5% ] 48.22% | 4,258 | 59.3% |
[ 48.5% - 49.0% ] 48.71% | 10,108 | 45.2% |
[ 49.5% - 50.0% ] 49.61% | 3,241 | 49.6% |
[ 50.0% - 50.5% ] 50.37% | 19,115 | 54.5% |
[ 50.5% - 51.0% ] 50.68% | 1,543 | 24.4% |
[ 51.0% - 51.5% ] 51.33% | 5,922 | 45.7% |
[ 51.5% - 52.0% ] 51.90% | 13,841 | 53.6% |
[ 52.0% - 52.5% ] 52.34% | 2,432 | 58.6% |
[ 53.0% - 53.5% ] 53.45% | 3,422 | 45.4% |
[ 54.0% - 54.5% ] 54.00% | 50 | 85.7% |
[ 54.0% - 54.5% ] 54.39% | 23,509 | 31.8% |
[ 54.5% - 55.0% ] 54.55% | 132 | 79.9% |
[ 55.0% - 55.5% ] 55.43% | 3,258 | 58.0% |
[ 56.0% - 56.5% ] 56.32% | 14,669 | 43.0% |
[ 56.5% - 57.0% ] 56.96% | 316 | 68.8% |
[ 57.5% - 58.0% ] 57.58% | 1,023 | 50.2% |
[ 58.0% - 58.5% ] 58.33% | 1,104 | 83.7% |
[ 58.5% - 59.0% ] 58.58% | 7,764 | 43.0% |
[ 59.5% - 60.0% ] 59.86% | 1,410 | 19.1% |
[ 60.5% - 61.0% ] 60.71% | 425 | 76.4% |
[ 61.5% - 62.0% ] 61.54% | 130 | 47.8% |
[ 62.0% - 62.5% ] 62.25% | 347 | 67.4% |
[ 62.5% - 63.0% ] 62.93% | 1,748 | 79.5% |
[ 63.5% - 64.0% ] 63.71% | 248 | 100.0% |
[ 64.5% - 65.0% ] 64.85% | 1,101 | 63.3% |
[ 67.0% - 67.5% ] 67.19% | 128 | 100.0% |
[ 69.0% - 69.5% ] 69.23% | 39 | 100.0% |
[ 70.5% - 71.0% ] 70.71% | 140 | 65.7% |
[ 72.0% - 72.5% ] 72.32% | 289 | 38.2% |
[ 74.0% - 74.5% ] 74.19% | 31 | 41.7% |
[ 77.0% - 77.5% ] 77.38% | 84 | 47.1% |
[ 77.5% - 78.0% ] 77.68% | 112 | 100.0% |
[ 83.0% - 83.5% ] 83.33% | 72 | 18.2% |
[ 99.5% - 100.0% ] 100.00% | 572 | 79.3% |