Colville 2 or more Vehicles in Household
COMPARE
Colville
Select to Compare
2 or more Vehicles in Household
Colville 2 or more Vehicles in Household
55.6%
2+ VEHICLES AVAILABLE
61.1/ 100
METRIC RATING
161st/ 347
METRIC RANK
Colville 2 or more Vehicles in Household Correlation Chart
The statistical analysis conducted on geographies consisting of 34,683,092 people shows no correlation between the proportion of Colville and percentage of households with 2 or more vehicles available in the United States with a correlation coefficient (R) of 0.000 and weighted average of 55.6%. On average, for every 1% (one percent) increase in Colville within a typical geography, there is an increase of 0.00014% in percentage of households with 2 or more vehicles available.
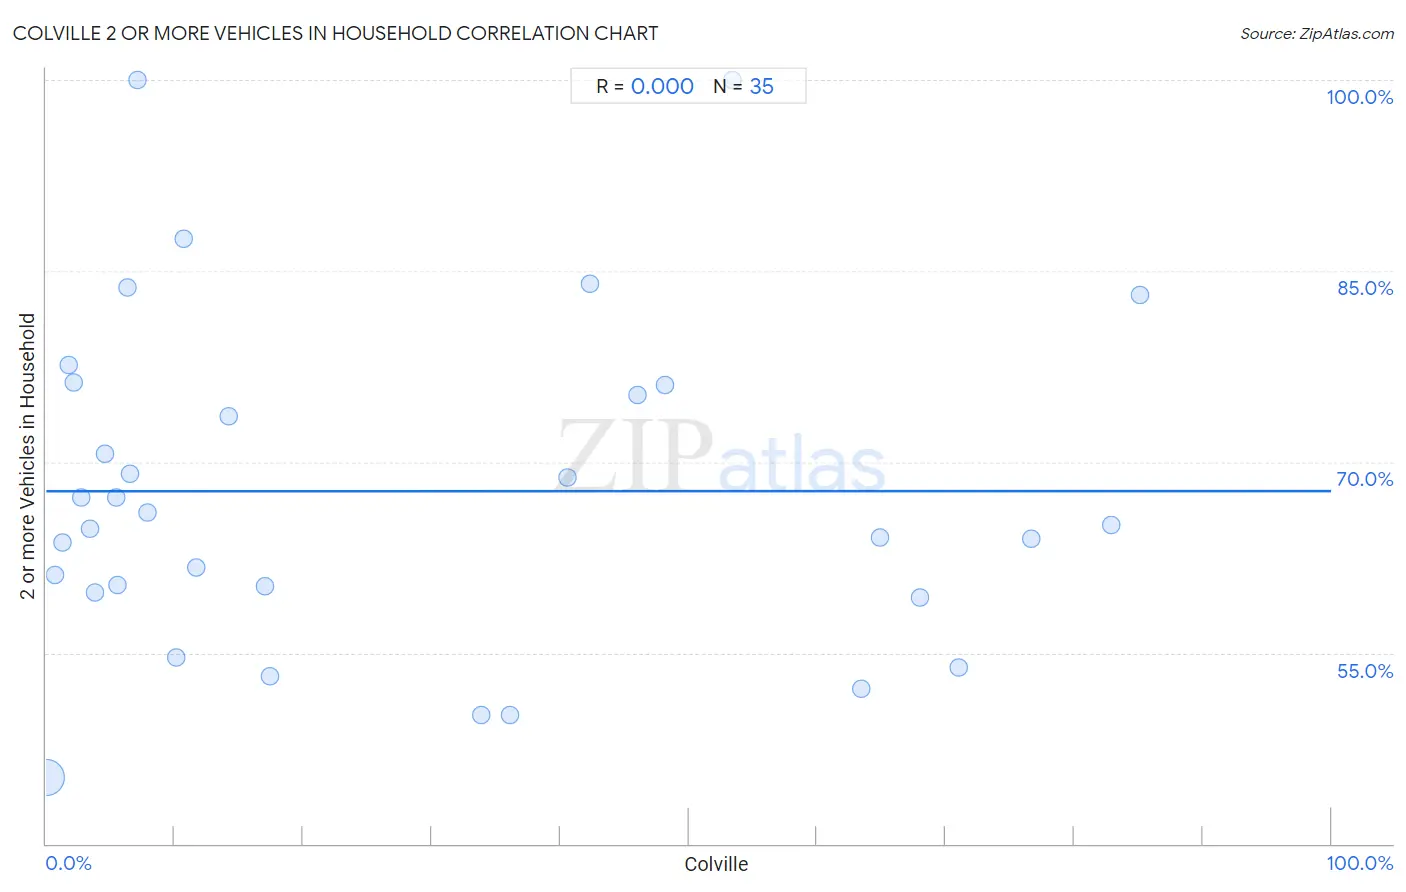
It is essential to understand that the correlation between the percentage of Colville and percentage of households with 2 or more vehicles available does not imply a direct cause-and-effect relationship. It remains uncertain whether the presence of Colville influences an upward or downward trend in the level of percentage of households with 2 or more vehicles available within an area, or if Colville simply ended up residing in those areas with higher or lower levels of percentage of households with 2 or more vehicles available due to other factors.
Demographics Similar to Colville by 2 or more Vehicles in Household
In terms of 2 or more vehicles in household, the demographic groups most similar to Colville are German Russian (55.6%, a difference of 0.010%), Immigrants from Zimbabwe (55.6%, a difference of 0.040%), Dutch West Indian (55.6%, a difference of 0.050%), Immigrants from El Salvador (55.6%, a difference of 0.070%), and Immigrants from Sri Lanka (55.5%, a difference of 0.12%).
| Demographics | Rating | Rank | 2 or more Vehicles in Household |
| Ukrainians | 70.8 /100 | #154 | Good 55.8% |
| Immigrants from Venezuela | 70.7 /100 | #155 | Good 55.8% |
| Immigrants from Lithuania | 70.4 /100 | #156 | Good 55.8% |
| Immigrants from Kuwait | 70.2 /100 | #157 | Good 55.8% |
| Tlingit-Haida | 68.5 /100 | #158 | Good 55.8% |
| Paiute | 68.0 /100 | #159 | Good 55.8% |
| Crow | 67.0 /100 | #160 | Good 55.7% |
| Colville | 61.1 /100 | #161 | Good 55.6% |
| German Russians | 60.9 /100 | #162 | Good 55.6% |
| Immigrants from Zimbabwe | 60.2 /100 | #163 | Good 55.6% |
| Dutch West Indians | 59.8 /100 | #164 | Average 55.6% |
| Immigrants from El Salvador | 59.4 /100 | #165 | Average 55.6% |
| Immigrants from Sri Lanka | 58.3 /100 | #166 | Average 55.5% |
| Kenyans | 58.1 /100 | #167 | Average 55.5% |
| French American Indians | 56.7 /100 | #168 | Average 55.5% |
Colville 2 or more Vehicles in Household Correlation Summary
| Measurement | Colville Data | 2 or more Vehicles in Household Data |
| Minimum | 0.026% | 45.2% |
| Maximum | 85.1% | 100.0% |
| Range | 85.1% | 54.8% |
| Mean | 27.2% | 67.7% |
| Median | 11.7% | 65.0% |
| Interquartile 25% (IQ1) | 4.5% | 59.8% |
| Interquartile 75% (IQ3) | 48.1% | 76.1% |
| Interquartile Range (IQR) | 43.6% | 16.3% |
| Standard Deviation (Sample) | 28.0% | 13.2% |
| Standard Deviation (Population) | 27.6% | 13.0% |
Correlation Details
| Colville Percentile | Sample Size | 2 or more Vehicles in Household |
[ 0.0% - 0.5% ] 0.026% | 34,436,478 | 45.2% |
[ 0.5% - 1.0% ] 0.64% | 127,711 | 61.1% |
[ 1.0% - 1.5% ] 1.28% | 35,844 | 63.7% |
[ 1.5% - 2.0% ] 1.70% | 13,619 | 77.6% |
[ 2.0% - 2.5% ] 2.11% | 17,953 | 76.2% |
[ 2.5% - 3.0% ] 2.74% | 5,867 | 67.2% |
[ 3.0% - 3.5% ] 3.37% | 5,404 | 64.8% |
[ 3.5% - 4.0% ] 3.83% | 4,957 | 59.8% |
[ 4.5% - 5.0% ] 4.55% | 5,587 | 70.7% |
[ 5.0% - 5.5% ] 5.44% | 643 | 67.2% |
[ 5.5% - 6.0% ] 5.53% | 561 | 60.3% |
[ 6.0% - 6.5% ] 6.32% | 918 | 83.7% |
[ 6.5% - 7.0% ] 6.56% | 5,456 | 69.1% |
[ 7.0% - 7.5% ] 7.09% | 127 | 100.0% |
[ 7.5% - 8.0% ] 7.92% | 1,098 | 66.0% |
[ 10.0% - 10.5% ] 10.15% | 1,034 | 54.6% |
[ 10.5% - 11.0% ] 10.66% | 122 | 87.5% |
[ 11.5% - 12.0% ] 11.68% | 865 | 61.7% |
[ 14.0% - 14.5% ] 14.22% | 9,218 | 73.6% |
[ 16.5% - 17.0% ] 16.99% | 1,377 | 60.3% |
[ 17.0% - 17.5% ] 17.45% | 424 | 53.2% |
[ 33.5% - 34.0% ] 33.81% | 1,538 | 50.1% |
[ 36.0% - 36.5% ] 36.06% | 1,334 | 50.1% |
[ 40.5% - 41.0% ] 40.54% | 74 | 68.8% |
[ 42.0% - 42.5% ] 42.28% | 395 | 84.0% |
[ 46.0% - 46.5% ] 46.01% | 276 | 75.2% |
[ 48.0% - 48.5% ] 48.15% | 270 | 76.1% |
[ 53.0% - 53.5% ] 53.39% | 236 | 100.0% |
[ 63.0% - 63.5% ] 63.38% | 568 | 52.2% |
[ 64.5% - 65.0% ] 64.91% | 1,103 | 64.0% |
[ 67.5% - 68.0% ] 67.97% | 256 | 59.3% |
[ 70.5% - 71.0% ] 70.97% | 155 | 53.8% |
[ 76.5% - 77.0% ] 76.66% | 977 | 64.0% |
[ 82.5% - 83.0% ] 82.84% | 338 | 65.0% |
[ 85.0% - 85.5% ] 85.11% | 309 | 83.1% |