Area Code 574 Map & Demographics
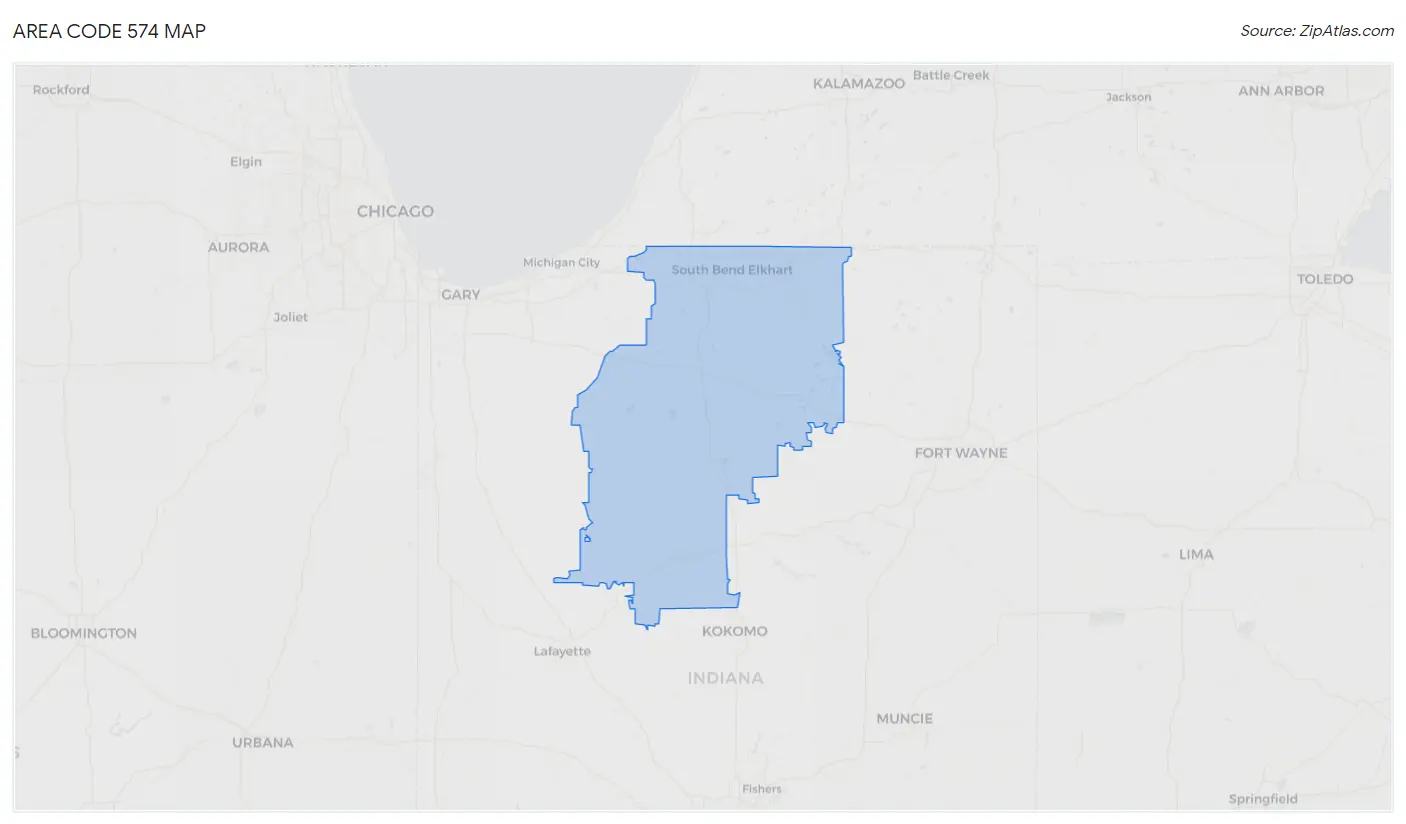
Area Code 574 Map
Area Code 574 Overview
$32,444
PER CAPITA INCOME
$80,034
AVG FAMILY INCOME
$65,129
AVG HOUSEHOLD INCOME
37.1%
WAGE / INCOME GAP [ % ]
62.9¢/ $1
WAGE / INCOME GAP [ $ ]
$10,473
FAMILY INCOME DEFICIT
31.68
INEQUALITY / GINI INDEX
730,035
TOTAL POPULATION
362,456
MALE POPULATION
367,579
FEMALE POPULATION
98.61
MALES / 100 FEMALES
101.41
FEMALES / 100 MALES
40.7
MEDIAN AGE
3.2
AVG FAMILY SIZE
2.6
AVG HOUSEHOLD SIZE
361,395
LABOR FORCE [ PEOPLE ]
63.1%
PERCENT IN LABOR FORCE
4.2%
UNEMPLOYMENT RATE
Income in Area Code 574
Income Overview in Area Code 574
Per Capita Income in Area Code 574 is $32,444, while median incomes of families and households are $80,034 and $65,129 respectively.
| Characteristic | Number | Measure |
| Per Capita Income | 730,035 | $32,444 |
| Median Family Income | 176,830 | $80,034 |
| Mean Family Income | 176,830 | $7,162,660 |
| Median Household Income | 275,957 | $65,129 |
| Mean Household Income | 275,957 | $6,312,239 |
| Income Deficit | 176,830 | $10,473 |
| Wage / Income Gap (%) | 730,035 | 37.12% |
| Wage / Income Gap ($) | 730,035 | 62.88¢ per $1 |
| Gini / Inequality Index | 730,035 | 31.68 |
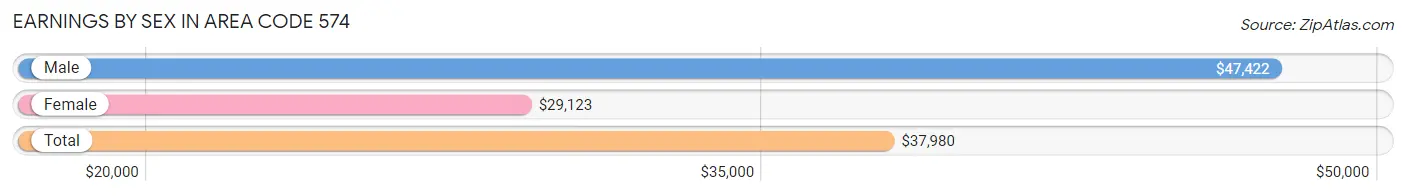
Earnings by Sex in Area Code 574
Average Earnings in Area Code 574 are $37,980, $47,422 for men and $29,123 for women, a difference of 38.6%.
| Sex | Number | Average Earnings |
| Male | 205,970 (53.3%) | $47,422 |
| Female | 180,436 (46.7%) | $29,123 |
| Total | 386,406 (100.0%) | $37,980 |
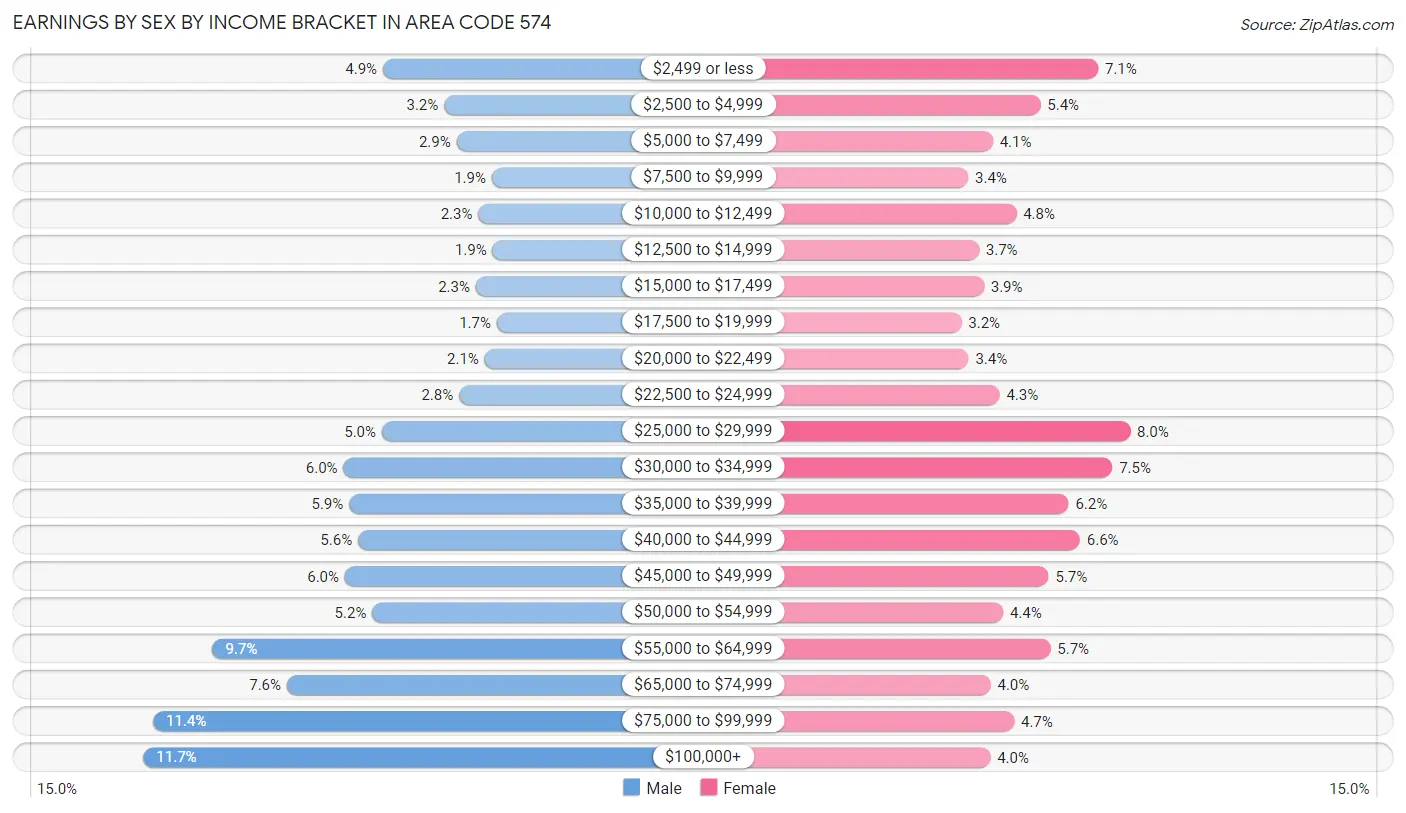
Earnings by Sex by Income Bracket in Area Code 574
The most common earnings brackets in Area Code 574 are $100,000+ for men (24,021 | 11.7%) and $25,000 to $29,999 for women (14,354 | 8.0%).
| Income | Male | Female |
| $2,499 or less | 10,147 (4.9%) | 12,736 (7.1%) |
| $2,500 to $4,999 | 6,606 (3.2%) | 9,810 (5.4%) |
| $5,000 to $7,499 | 5,890 (2.9%) | 7,401 (4.1%) |
| $7,500 to $9,999 | 3,844 (1.9%) | 6,159 (3.4%) |
| $10,000 to $12,499 | 4,632 (2.2%) | 8,588 (4.8%) |
| $12,500 to $14,999 | 3,805 (1.8%) | 6,695 (3.7%) |
| $15,000 to $17,499 | 4,787 (2.3%) | 6,952 (3.8%) |
| $17,500 to $19,999 | 3,553 (1.7%) | 5,802 (3.2%) |
| $20,000 to $22,499 | 4,258 (2.1%) | 6,167 (3.4%) |
| $22,500 to $24,999 | 5,754 (2.8%) | 7,736 (4.3%) |
| $25,000 to $29,999 | 10,216 (5.0%) | 14,354 (8.0%) |
| $30,000 to $34,999 | 12,434 (6.0%) | 13,459 (7.5%) |
| $35,000 to $39,999 | 12,119 (5.9%) | 11,250 (6.2%) |
| $40,000 to $44,999 | 11,588 (5.6%) | 11,826 (6.6%) |
| $45,000 to $49,999 | 12,349 (6.0%) | 10,229 (5.7%) |
| $50,000 to $54,999 | 10,769 (5.2%) | 7,919 (4.4%) |
| $55,000 to $64,999 | 20,013 (9.7%) | 10,313 (5.7%) |
| $65,000 to $74,999 | 15,720 (7.6%) | 7,286 (4.0%) |
| $75,000 to $99,999 | 23,465 (11.4%) | 8,484 (4.7%) |
| $100,000+ | 24,021 (11.7%) | 7,270 (4.0%) |
| Total | 205,970 (100.0%) | 180,436 (100.0%) |
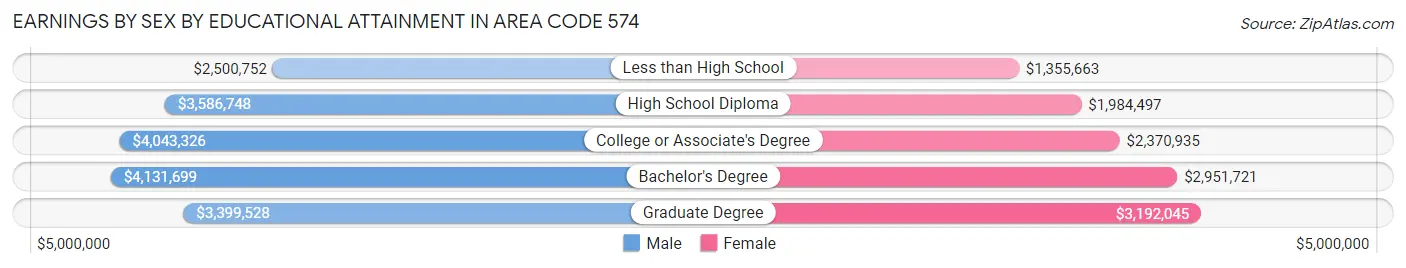
Earnings by Sex by Educational Attainment in Area Code 574
Average earnings in Area Code 574 are $3,962,680 for men and $2,490,155 for women, a difference of 37.2%. Men with an educational attainment of bachelor's degree enjoy the highest average annual earnings of $4,131,699, while those with less than high school education earn the least with $2,500,752. Women with an educational attainment of graduate degree earn the most with the average annual earnings of $3,192,045, while those with less than high school education have the smallest earnings of $1,355,663.
| Educational Attainment | Male Income | Female Income |
| Less than High School | $2,500,752 | $1,355,663 |
| High School Diploma | $3,586,748 | $1,984,497 |
| College or Associate's Degree | $4,043,326 | $2,370,935 |
| Bachelor's Degree | $4,131,699 | $2,951,721 |
| Graduate Degree | $3,399,528 | $3,192,045 |
| Total | $3,962,680 | $2,490,155 |
Family Income in Area Code 574
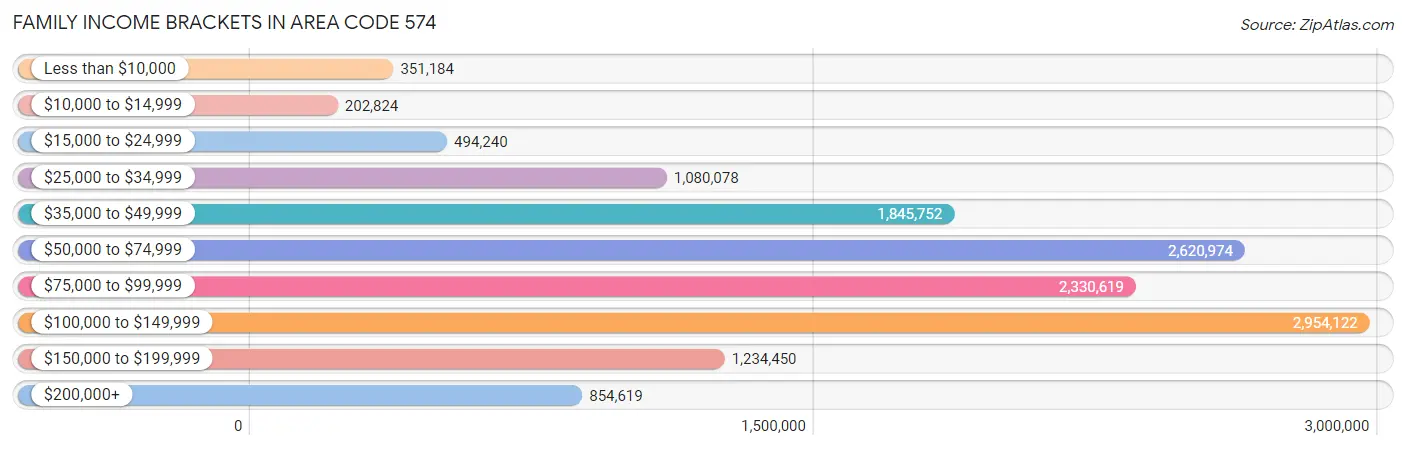
Family Income Brackets in Area Code 574
According to the Area Code 574 family income data, there are 2,954,122 families falling into the $100,000 to $149,999 income range, which is the most common income bracket and makes up 1,670.6% of all families. Conversely, the $10,000 to $14,999 income bracket is the least frequent group with only 202,824 families (114.7%) belonging to this category.
| Income Bracket | # Families | % Families |
| Less than $10,000 | 351,184 | 198.6% |
| $10,000 to $14,999 | 202,824 | 114.7% |
| $15,000 to $24,999 | 494,240 | 279.5% |
| $25,000 to $34,999 | 1,080,078 | 610.8% |
| $35,000 to $49,999 | 1,845,752 | 1,043.8% |
| $50,000 to $74,999 | 2,620,974 | 1,482.2% |
| $75,000 to $99,999 | 2,330,619 | 1,318.0% |
| $100,000 to $149,999 | 2,954,122 | 1,670.6% |
| $150,000 to $199,999 | 1,234,450 | 698.1% |
| $200,000+ | 854,619 | 483.3% |
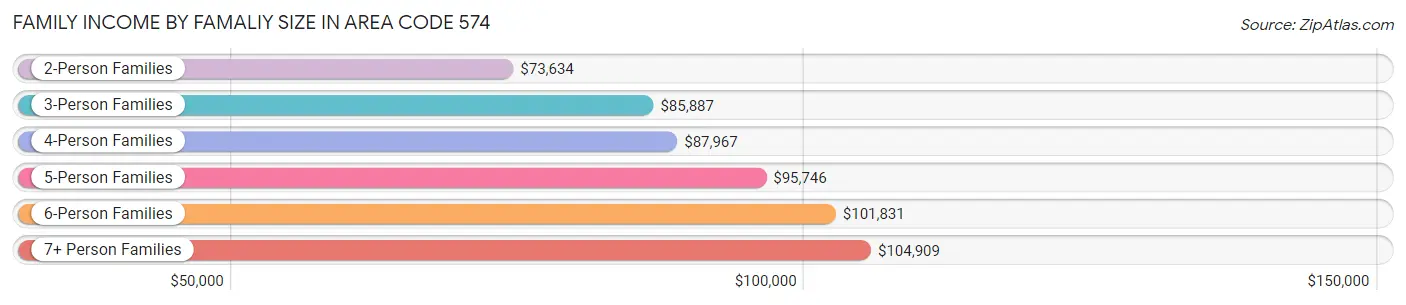
Family Income by Famaliy Size in Area Code 574
7+ person families (3,987 | 2.2%) account for the highest median family income in Area Code 574 with $104,909 per family, while 2-person families (87,559 | 49.5%) have the highest median income of $36,817 per family member.
| Income Bracket | # Families | Median Income |
| 2-Person Families | 87,559 (49.5%) | $73,634 |
| 3-Person Families | 36,563 (20.7%) | $85,887 |
| 4-Person Families | 29,013 (16.4%) | $87,967 |
| 5-Person Families | 13,563 (7.7%) | $95,746 |
| 6-Person Families | 6,145 (3.5%) | $101,831 |
| 7+ Person Families | 3,987 (2.2%) | $104,909 |
| Total | 176,830 (100.0%) | $80,034 |
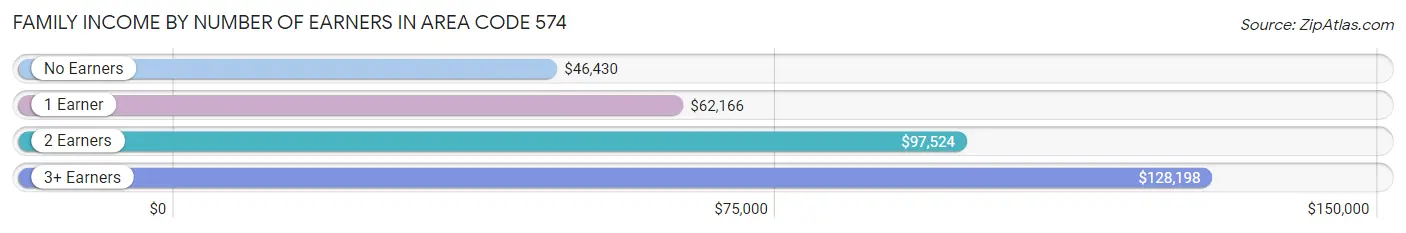
Family Income by Number of Earners in Area Code 574
The median family income in Area Code 574 is $80,034, with families comprising 3+ earners (20,746) having the highest median family income of $128,198, while families with no earners (25,494) have the lowest median family income of $46,430, accounting for 11.7% and 14.4% of families, respectively.
| Number of Earners | # Families | Median Income |
| No Earners | 25,494 (14.4%) | $46,430 |
| 1 Earner | 56,493 (32.0%) | $62,166 |
| 2 Earners | 74,097 (41.9%) | $97,524 |
| 3+ Earners | 20,746 (11.7%) | $128,198 |
| Total | 176,830 (100.0%) | $80,034 |
Household Income in Area Code 574
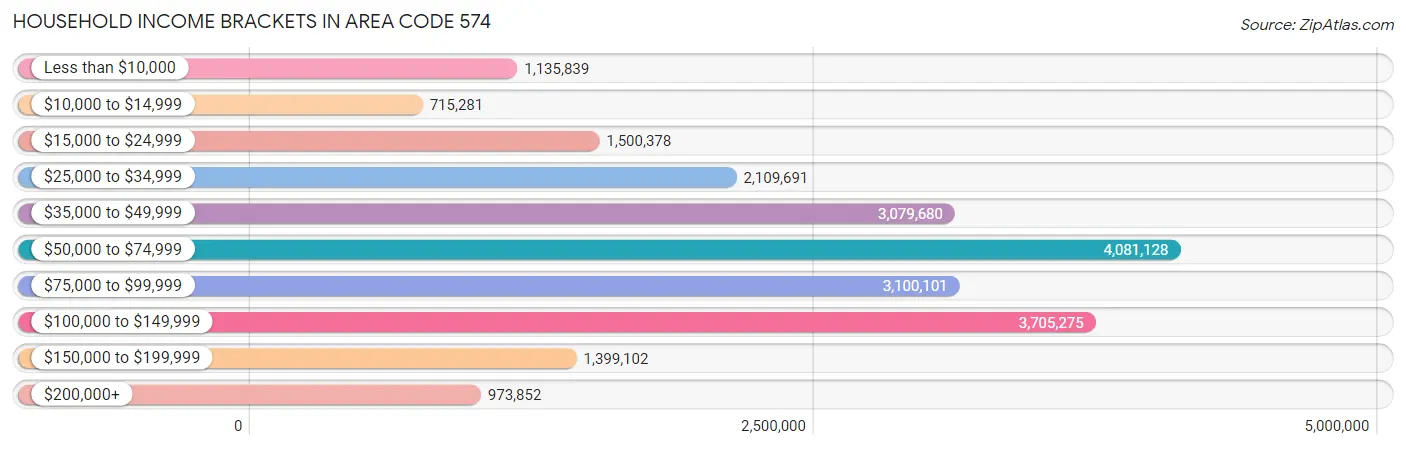
Household Income Brackets in Area Code 574
With 4,081,128 households falling in the category, the $50,000 to $74,999 income range is the most frequent in Area Code 574, accounting for 1,478.9% of all households. In contrast, only 715,281 households (259.2%) fall into the $10,000 to $14,999 income bracket, making it the least populous group.
| Income Bracket | # Households | % Households |
| Less than $10,000 | 1,135,839 | 411.6% |
| $10,000 to $14,999 | 715,281 | 259.2% |
| $15,000 to $24,999 | 1,500,378 | 543.7% |
| $25,000 to $34,999 | 2,109,691 | 764.5% |
| $35,000 to $49,999 | 3,079,680 | 1,116.0% |
| $50,000 to $74,999 | 4,081,128 | 1,478.9% |
| $75,000 to $99,999 | 3,100,101 | 1,123.4% |
| $100,000 to $149,999 | 3,705,275 | 1,342.7% |
| $150,000 to $199,999 | 1,399,102 | 507.0% |
| $200,000+ | 973,852 | 352.9% |
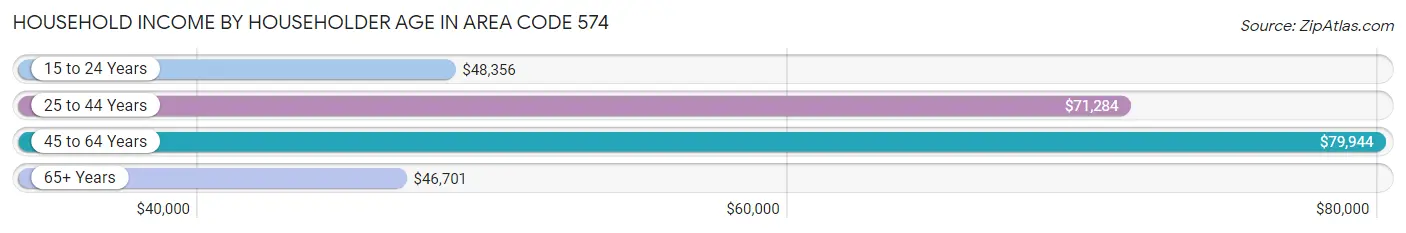
Household Income by Householder Age in Area Code 574
The median household income in Area Code 574 is $65,129, with the highest median household income of $79,944 found in the 45 to 64 years age bracket for the primary householder. A total of 102,414 households (37.1%) fall into this category. Meanwhile, the 65+ years age bracket for the primary householder has the lowest median household income of $46,701, with 77,491 households (28.1%) in this group.
| Income Bracket | # Households | Median Income |
| 15 to 24 Years | 11,672 (4.2%) | $48,356 |
| 25 to 44 Years | 84,380 (30.6%) | $71,284 |
| 45 to 64 Years | 102,414 (37.1%) | $79,944 |
| 65+ Years | 77,491 (28.1%) | $46,701 |
| Total | 275,957 (100.0%) | $65,129 |
Poverty in Area Code 574
Income Below Poverty by Sex and Age in Area Code 574
With 11.2% poverty level for males and 13.7% for females among the residents of Area Code 574, under 5 year old males and 6 to 11 year old females are the most vulnerable to poverty, with 4,787 males (20.2%) and 5,005 females (18.0%) in their respective age groups living below the poverty level.
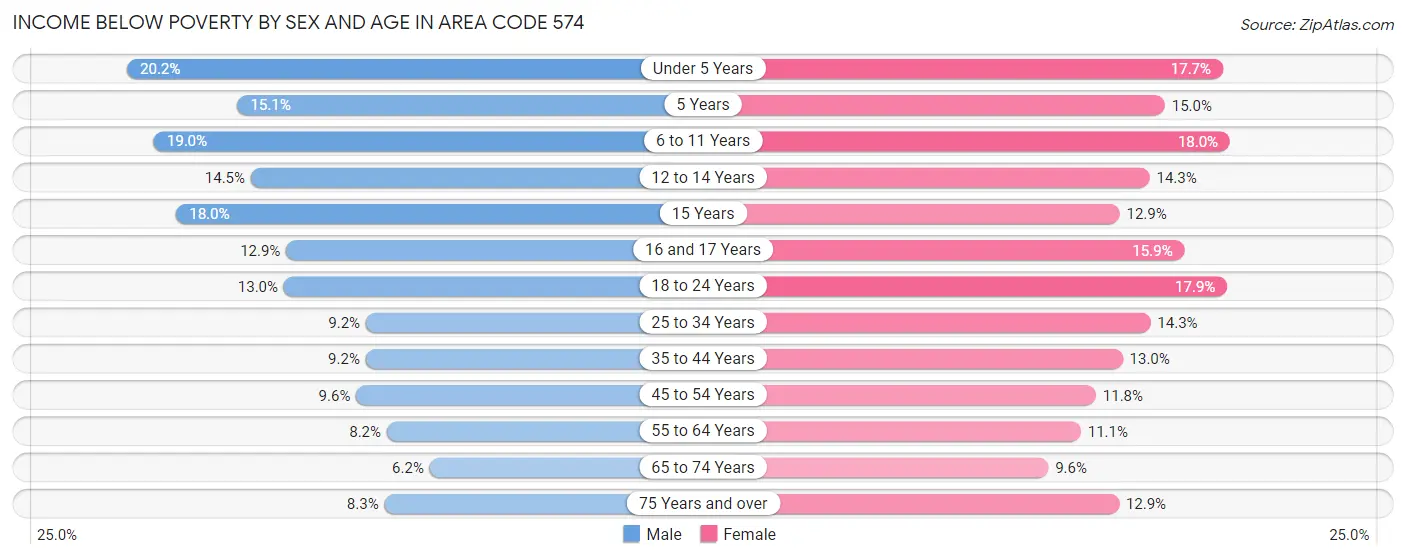
| Age Bracket | Male | Female |
| Under 5 Years | 4,787 (20.2%) | 3,931 (17.7%) |
| 5 Years | 785 (15.1%) | 674 (15.0%) |
| 6 to 11 Years | 5,564 (19.0%) | 5,005 (18.0%) |
| 12 to 14 Years | 2,258 (14.5%) | 2,211 (14.3%) |
| 15 Years | 1,034 (18.0%) | 654 (12.9%) |
| 16 and 17 Years | 1,275 (12.9%) | 1,631 (15.9%) |
| 18 to 24 Years | 4,173 (13.0%) | 5,485 (17.9%) |
| 25 to 34 Years | 4,191 (9.2%) | 6,410 (14.3%) |
| 35 to 44 Years | 3,918 (9.2%) | 5,550 (13.0%) |
| 45 to 54 Years | 4,147 (9.6%) | 5,095 (11.8%) |
| 55 to 64 Years | 3,773 (8.2%) | 5,171 (11.1%) |
| 65 to 74 Years | 2,129 (6.2%) | 3,499 (9.6%) |
| 75 Years and over | 1,623 (8.3%) | 3,626 (12.9%) |
| Total | 39,657 (11.2%) | 48,942 (13.7%) |
Income Above Poverty by Sex and Age in Area Code 574
According to the poverty statistics in Area Code 574, males aged 65 to 74 years and females aged 65 to 74 years are the age groups that are most secure financially, with 93.8% of males and 90.4% of females in these age groups living above the poverty line.
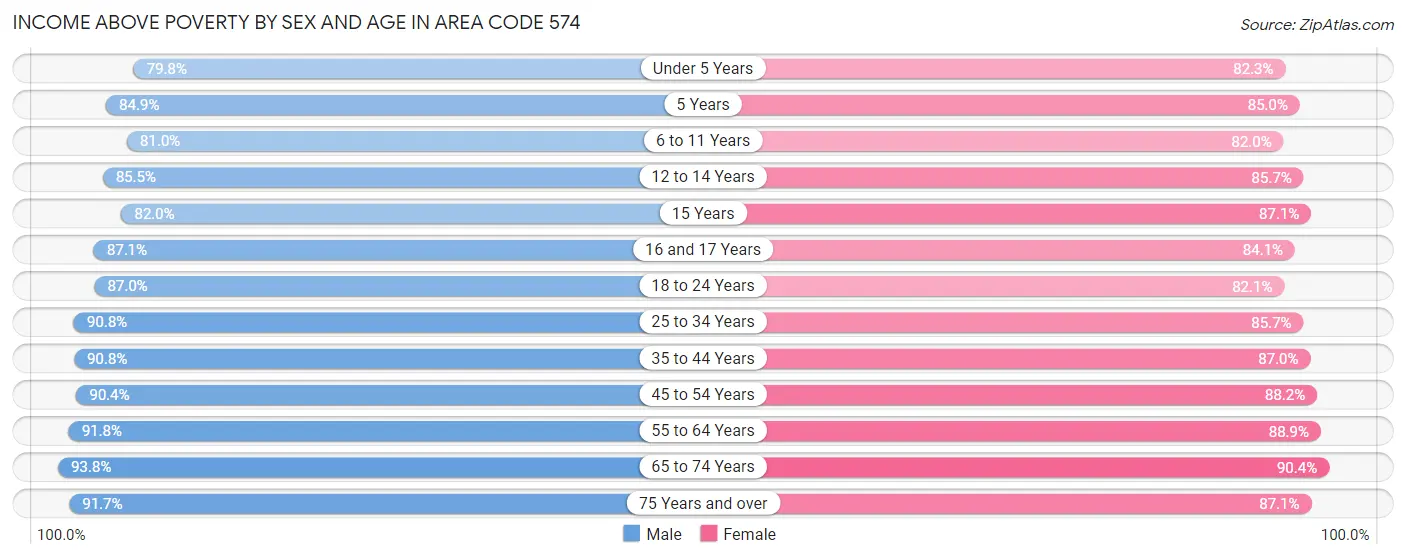
| Age Bracket | Male | Female |
| Under 5 Years | 18,861 (79.8%) | 18,297 (82.3%) |
| 5 Years | 4,406 (84.9%) | 3,822 (85.0%) |
| 6 to 11 Years | 23,717 (81.0%) | 22,784 (82.0%) |
| 12 to 14 Years | 13,310 (85.5%) | 13,270 (85.7%) |
| 15 Years | 4,722 (82.0%) | 4,421 (87.1%) |
| 16 and 17 Years | 8,643 (87.1%) | 8,629 (84.1%) |
| 18 to 24 Years | 28,012 (87.0%) | 25,187 (82.1%) |
| 25 to 34 Years | 41,564 (90.8%) | 38,342 (85.7%) |
| 35 to 44 Years | 38,802 (90.8%) | 37,042 (87.0%) |
| 45 to 54 Years | 39,017 (90.4%) | 38,104 (88.2%) |
| 55 to 64 Years | 42,275 (91.8%) | 41,456 (88.9%) |
| 65 to 74 Years | 32,195 (93.8%) | 33,042 (90.4%) |
| 75 Years and over | 17,932 (91.7%) | 24,560 (87.1%) |
| Total | 313,456 (88.8%) | 308,956 (86.3%) |
Income Below Poverty Among Married-Couple Families in Area Code 574
The poverty statistics for married-couple families in Area Code 574 show that 3.9% or 5,113 of the total 132,124 families live below the poverty line. Families with 5 or more children have the highest poverty rate of 15.3%, comprising of 316 families. On the other hand, families with no children have the lowest poverty rate of 2.6%, which includes 2,088 families.
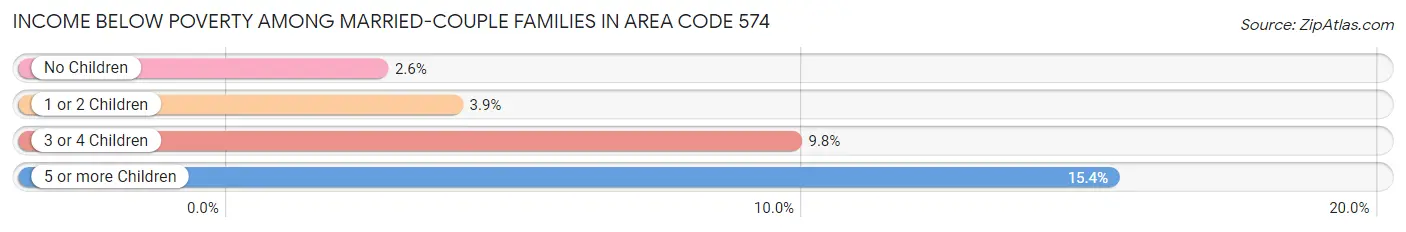
| Children | Above Poverty | Below Poverty |
| No Children | 77,904 (97.4%) | 2,088 (2.6%) |
| 1 or 2 Children | 35,891 (96.1%) | 1,461 (3.9%) |
| 3 or 4 Children | 11,474 (90.2%) | 1,248 (9.8%) |
| 5 or more Children | 1,742 (84.7%) | 316 (15.3%) |
| Total | 127,011 (96.1%) | 5,113 (3.9%) |
Income Below Poverty Among Single-Parent Households in Area Code 574
According to the poverty data in Area Code 574, 12.1% or 1,577 single-father households and 27.9% or 8,837 single-mother households are living below the poverty line. Among single-father households, those with 5 or more children have the highest poverty rate, with 37 households (100.0%) experiencing poverty. Likewise, among single-mother households, those with 3 or 4 children have the highest poverty rate, with 1,977 households (48.8%) falling below the poverty line.
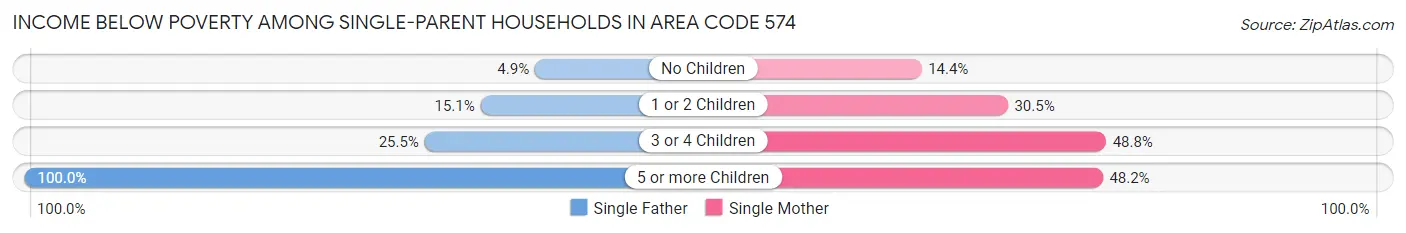
| Children | Single Father | Single Mother |
| No Children | 259 (4.9%) | 1,461 (14.4%) |
| 1 or 2 Children | 1,004 (15.1%) | 5,238 (30.5%) |
| 3 or 4 Children | 277 (25.5%) | 1,977 (48.8%) |
| 5 or more Children | 37 (100.0%) | 161 (48.2%) |
| Total | 1,577 (12.1%) | 8,837 (27.9%) |
Income Below Poverty Among Married-Couple vs Single-Parent Households in Area Code 574
The poverty data for Area Code 574 shows that 5,113 of the married-couple family households (3.9%) and 10,414 of the single-parent households (23.3%) are living below the poverty level. Within the married-couple family households, those with 5 or more children have the highest poverty rate, with 316 households (15.3%) falling below the poverty line. Among the single-parent households, those with 5 or more children have the highest poverty rate, with 198 household (53.4%) living below poverty.
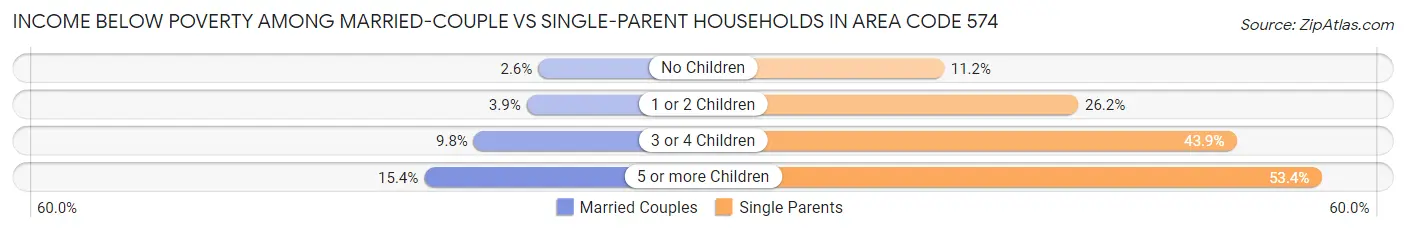
| Children | Married-Couple Families | Single-Parent Households |
| No Children | 2,088 (2.6%) | 1,720 (11.2%) |
| 1 or 2 Children | 1,461 (3.9%) | 6,242 (26.2%) |
| 3 or 4 Children | 1,248 (9.8%) | 2,254 (43.9%) |
| 5 or more Children | 316 (15.3%) | 198 (53.4%) |
| Total | 5,113 (3.9%) | 10,414 (23.3%) |
Race in Area Code 574
The most populous races in Area Code 574 are White / Caucasian (591,842 | 81.1%), Hispanic or Latino (84,758 | 11.6%), and Black / African American (47,305 | 6.5%).
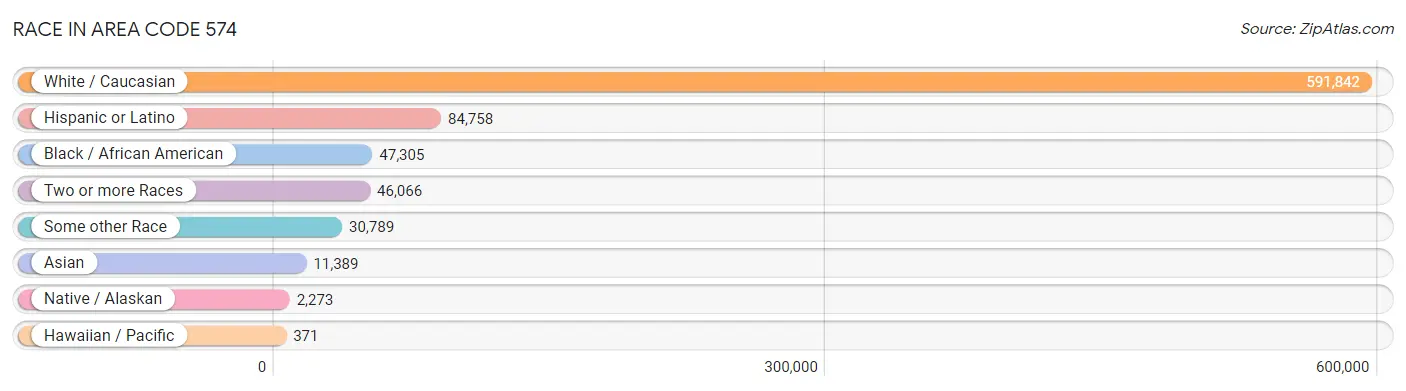
| Race | # Population | % Population |
| Asian | 11,389 | 1.6% |
| Black / African American | 47,305 | 6.5% |
| Hawaiian / Pacific | 371 | 0.1% |
| Hispanic or Latino | 84,758 | 11.6% |
| Native / Alaskan | 2,273 | 0.3% |
| White / Caucasian | 591,842 | 81.1% |
| Two or more Races | 46,066 | 6.3% |
| Some other Race | 30,789 | 4.2% |
| Total | 730,035 | 100.0% |
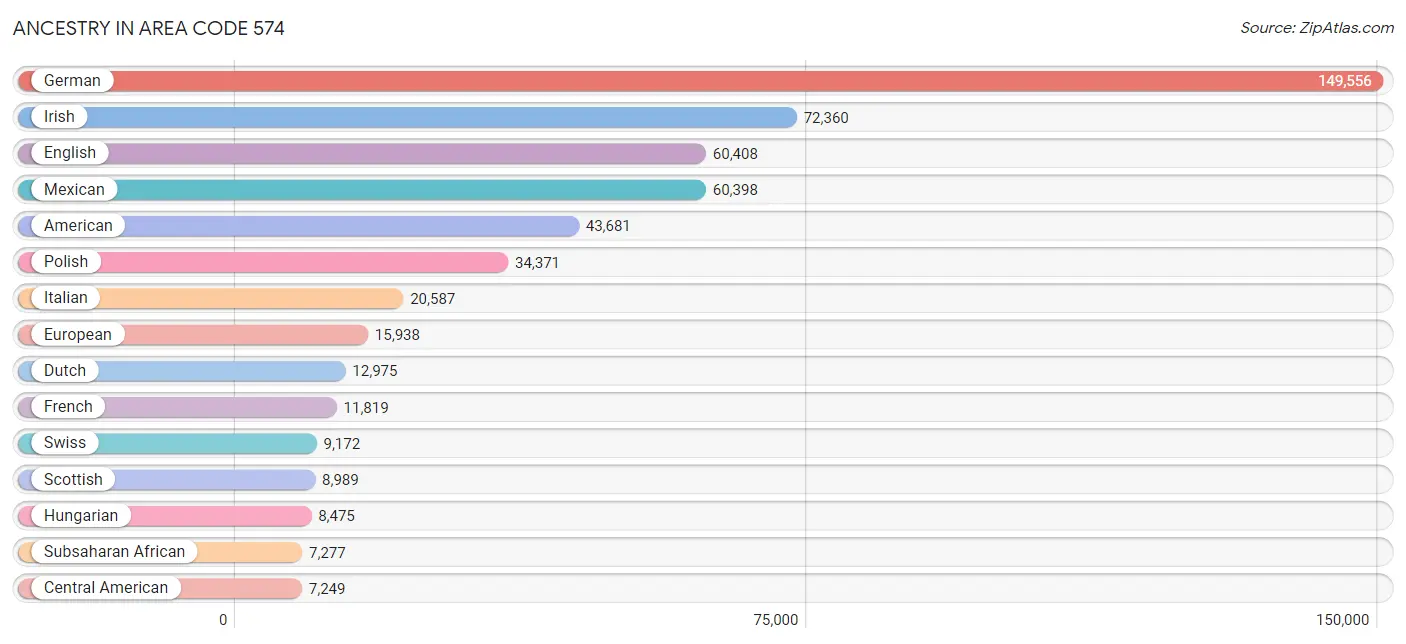
Ancestry in Area Code 574
The most populous ancestries reported in Area Code 574 are German (149,556 | 20.5%), Irish (72,360 | 9.9%), English (60,408 | 8.3%), Mexican (60,398 | 8.3%), and American (43,681 | 6.0%), together accounting for 52.9% of all Area Code 574 residents.
| Ancestry | # Population | % Population |
| African | 4,834 | 0.7% |
| Albanian | 63 | 0.0% |
| Alsatian | 7 | 0.0% |
| American | 43,681 | 6.0% |
| Apache | 146 | 0.0% |
| Arab | 2,135 | 0.3% |
| Arapaho | 7 | 0.0% |
| Argentinean | 112 | 0.0% |
| Armenian | 139 | 0.0% |
| Assyrian / Chaldean / Syriac | 143 | 0.0% |
| Australian | 146 | 0.0% |
| Austrian | 1,438 | 0.2% |
| Bahamian | 27 | 0.0% |
| Basque | 31 | 0.0% |
| Belgian | 4,123 | 0.6% |
| Belizean | 30 | 0.0% |
| Bermudan | 6 | 0.0% |
| Bhutanese | 871 | 0.1% |
| Blackfeet | 305 | 0.0% |
| Bolivian | 115 | 0.0% |
| Brazilian | 621 | 0.1% |
| British | 3,298 | 0.4% |
| British West Indian | 1 | 0.0% |
| Bulgarian | 108 | 0.0% |
| Burmese | 1,672 | 0.2% |
| Cajun | 176 | 0.0% |
| Cambodian | 39 | 0.0% |
| Canadian | 1,194 | 0.2% |
| Cape Verdean | 11 | 0.0% |
| Carpatho Rusyn | 5 | 0.0% |
| Celtic | 118 | 0.0% |
| Central American | 7,249 | 1.0% |
| Central American Indian | 248 | 0.0% |
| Cherokee | 2,197 | 0.3% |
| Cheyenne | 47 | 0.0% |
| Chilean | 135 | 0.0% |
| Chippewa | 177 | 0.0% |
| Choctaw | 117 | 0.0% |
| Colombian | 584 | 0.1% |
| Comanche | 6 | 0.0% |
| Costa Rican | 105 | 0.0% |
| Cree | 52 | 0.0% |
| Creek | 6 | 0.0% |
| Croatian | 1,014 | 0.1% |
| Crow | 26 | 0.0% |
| Cuban | 913 | 0.1% |
| Cypriot | 17 | 0.0% |
| Czech | 2,032 | 0.3% |
| Czechoslovakian | 370 | 0.1% |
| Danish | 1,154 | 0.2% |
| Delaware | 25 | 0.0% |
| Dominican | 408 | 0.1% |
| Dutch | 12,975 | 1.8% |
| Dutch West Indian | 13 | 0.0% |
| Eastern European | 1,105 | 0.2% |
| Ecuadorian | 425 | 0.1% |
| Egyptian | 43 | 0.0% |
| English | 60,408 | 8.3% |
| Estonian | 26 | 0.0% |
| Ethiopian | 131 | 0.0% |
| European | 15,938 | 2.2% |
| Fijian | 103 | 0.0% |
| Filipino | 20 | 0.0% |
| Finnish | 533 | 0.1% |
| French | 11,819 | 1.6% |
| French American Indian | 56 | 0.0% |
| French Canadian | 1,957 | 0.3% |
| German | 149,556 | 20.5% |
| German Russian | 18 | 0.0% |
| Ghanaian | 102 | 0.0% |
| Greek | 1,451 | 0.2% |
| Guamanian / Chamorro | 16 | 0.0% |
| Guatemalan | 1,895 | 0.3% |
| Guyanese | 26 | 0.0% |
| Haitian | 499 | 0.1% |
| Honduran | 2,758 | 0.4% |
| Hungarian | 8,475 | 1.2% |
| Icelander | 30 | 0.0% |
| Indian (Asian) | 3,510 | 0.5% |
| Indonesian | 763 | 0.1% |
| Inupiat | 14 | 0.0% |
| Iranian | 126 | 0.0% |
| Iraqi | 93 | 0.0% |
| Irish | 72,360 | 9.9% |
| Iroquois | 117 | 0.0% |
| Israeli | 26 | 0.0% |
| Italian | 20,587 | 2.8% |
| Jamaican | 516 | 0.1% |
| Japanese | 156 | 0.0% |
| Jordanian | 80 | 0.0% |
| Kenyan | 875 | 0.1% |
| Korean | 2,603 | 0.4% |
| Laotian | 131 | 0.0% |
| Latvian | 112 | 0.0% |
| Lebanese | 1,172 | 0.2% |
| Liberian | 30 | 0.0% |
| Lithuanian | 1,363 | 0.2% |
| Luxembourger | 92 | 0.0% |
| Macedonian | 45 | 0.0% |
| Malaysian | 566 | 0.1% |
| Maltese | 72 | 0.0% |
| Mexican | 60,398 | 8.3% |
| Mexican American Indian | 931 | 0.1% |
| Moroccan | 17 | 0.0% |
| Native Hawaiian | 86 | 0.0% |
| Navajo | 44 | 0.0% |
| Nicaraguan | 15 | 0.0% |
| Nigerian | 145 | 0.0% |
| Northern European | 573 | 0.1% |
| Norwegian | 4,096 | 0.6% |
| Osage | 36 | 0.0% |
| Ottawa | 2 | 0.0% |
| Pakistani | 272 | 0.0% |
| Palestinian | 104 | 0.0% |
| Panamanian | 210 | 0.0% |
| Paraguayan | 38 | 0.0% |
| Pennsylvania German | 3,890 | 0.5% |
| Peruvian | 912 | 0.1% |
| Polish | 34,371 | 4.7% |
| Portuguese | 358 | 0.1% |
| Potawatomi | 120 | 0.0% |
| Pueblo | 4 | 0.0% |
| Puerto Rican | 6,378 | 0.9% |
| Romanian | 715 | 0.1% |
| Russian | 2,248 | 0.3% |
| Salvadoran | 2,266 | 0.3% |
| Samoan | 78 | 0.0% |
| Scandinavian | 1,303 | 0.2% |
| Scotch-Irish | 4,176 | 0.6% |
| Scottish | 8,989 | 1.2% |
| Seminole | 28 | 0.0% |
| Serbian | 665 | 0.1% |
| Sierra Leonean | 31 | 0.0% |
| Sioux | 288 | 0.0% |
| Slavic | 402 | 0.1% |
| Slovak | 1,200 | 0.2% |
| Slovene | 207 | 0.0% |
| South African | 176 | 0.0% |
| South American | 4,309 | 0.6% |
| South American Indian | 67 | 0.0% |
| Spaniard | 992 | 0.1% |
| Spanish | 788 | 0.1% |
| Spanish American | 24 | 0.0% |
| Spanish American Indian | 23 | 0.0% |
| Sri Lankan | 1,108 | 0.2% |
| Subsaharan African | 7,277 | 1.0% |
| Swedish | 6,549 | 0.9% |
| Swiss | 9,172 | 1.3% |
| Syrian | 260 | 0.0% |
| Thai | 3,197 | 0.4% |
| Tongan | 4 | 0.0% |
| Trinidadian and Tobagonian | 92 | 0.0% |
| Turkish | 133 | 0.0% |
| Ugandan | 20 | 0.0% |
| Ukrainian | 1,108 | 0.2% |
| Uruguayan | 25 | 0.0% |
| Venezuelan | 1,963 | 0.3% |
| Vietnamese | 109 | 0.0% |
| Welsh | 3,752 | 0.5% |
| West Indian | 41 | 0.0% |
| Yaqui | 11 | 0.0% |
| Yugoslavian | 226 | 0.0% |
| Zimbabwean | 284 | 0.0% | View All 163 Rows |
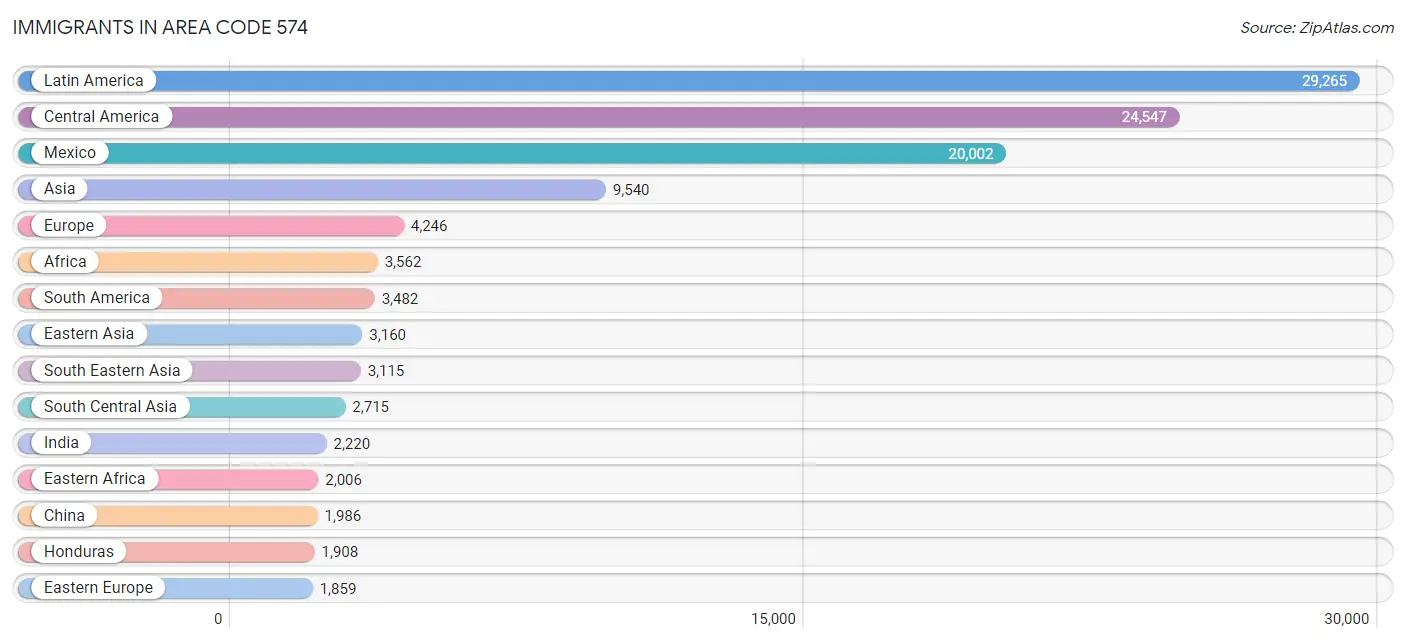
Immigrants in Area Code 574
The most numerous immigrant groups reported in Area Code 574 came from Latin America (29,265 | 4.0%), Central America (24,547 | 3.4%), Mexico (20,002 | 2.7%), Asia (9,540 | 1.3%), and Europe (4,246 | 0.6%), together accounting for 12.0% of all Area Code 574 residents.
| Immigration Origin | # Population | % Population |
| Africa | 3,562 | 0.5% |
| Albania | 10 | 0.0% |
| Argentina | 100 | 0.0% |
| Asia | 9,540 | 1.3% |
| Australia | 77 | 0.0% |
| Austria | 67 | 0.0% |
| Azores | 22 | 0.0% |
| Bangladesh | 130 | 0.0% |
| Barbados | 13 | 0.0% |
| Belarus | 9 | 0.0% |
| Belgium | 60 | 0.0% |
| Belize | 118 | 0.0% |
| Bolivia | 123 | 0.0% |
| Bosnia and Herzegovina | 73 | 0.0% |
| Brazil | 356 | 0.1% |
| Bulgaria | 36 | 0.0% |
| Cambodia | 68 | 0.0% |
| Canada | 1,207 | 0.2% |
| Caribbean | 1,236 | 0.2% |
| Central America | 24,547 | 3.4% |
| Chile | 83 | 0.0% |
| China | 1,986 | 0.3% |
| Colombia | 493 | 0.1% |
| Congo | 18 | 0.0% |
| Costa Rica | 156 | 0.0% |
| Croatia | 33 | 0.0% |
| Cuba | 141 | 0.0% |
| Czechoslovakia | 16 | 0.0% |
| Denmark | 18 | 0.0% |
| Dominican Republic | 342 | 0.1% |
| Eastern Africa | 2,006 | 0.3% |
| Eastern Asia | 3,160 | 0.4% |
| Eastern Europe | 1,859 | 0.3% |
| Ecuador | 225 | 0.0% |
| Egypt | 64 | 0.0% |
| El Salvador | 1,153 | 0.2% |
| England | 163 | 0.0% |
| Ethiopia | 160 | 0.0% |
| Europe | 4,246 | 0.6% |
| France | 251 | 0.0% |
| Germany | 720 | 0.1% |
| Ghana | 449 | 0.1% |
| Greece | 228 | 0.0% |
| Guatemala | 1,111 | 0.2% |
| Guyana | 23 | 0.0% |
| Haiti | 463 | 0.1% |
| Honduras | 1,908 | 0.3% |
| Hong Kong | 59 | 0.0% |
| Hungary | 303 | 0.0% |
| India | 2,220 | 0.3% |
| Indonesia | 110 | 0.0% |
| Iran | 29 | 0.0% |
| Iraq | 99 | 0.0% |
| Ireland | 69 | 0.0% |
| Israel | 31 | 0.0% |
| Italy | 252 | 0.0% |
| Jamaica | 110 | 0.0% |
| Japan | 259 | 0.0% |
| Jordan | 31 | 0.0% |
| Kenya | 1,008 | 0.1% |
| Korea | 915 | 0.1% |
| Laos | 234 | 0.0% |
| Latin America | 29,265 | 4.0% |
| Lebanon | 198 | 0.0% |
| Liberia | 76 | 0.0% |
| Lithuania | 169 | 0.0% |
| Mexico | 20,002 | 2.7% |
| Middle Africa | 228 | 0.0% |
| Moldova | 5 | 0.0% |
| Morocco | 11 | 0.0% |
| Nepal | 66 | 0.0% |
| Netherlands | 124 | 0.0% |
| Nicaragua | 37 | 0.0% |
| Nigeria | 337 | 0.1% |
| North Macedonia | 10 | 0.0% |
| Northern Africa | 75 | 0.0% |
| Northern Europe | 609 | 0.1% |
| Norway | 43 | 0.0% |
| Oceania | 174 | 0.0% |
| Pakistan | 216 | 0.0% |
| Panama | 62 | 0.0% |
| Peru | 369 | 0.1% |
| Philippines | 1,296 | 0.2% |
| Poland | 375 | 0.1% |
| Portugal | 22 | 0.0% |
| Romania | 153 | 0.0% |
| Russia | 162 | 0.0% |
| Scotland | 44 | 0.0% |
| Serbia | 23 | 0.0% |
| Sierra Leone | 39 | 0.0% |
| Singapore | 5 | 0.0% |
| South Africa | 124 | 0.0% |
| South America | 3,482 | 0.5% |
| South Central Asia | 2,715 | 0.4% |
| South Eastern Asia | 3,115 | 0.4% |
| Southern Europe | 542 | 0.1% |
| Spain | 40 | 0.0% |
| Sri Lanka | 32 | 0.0% |
| Switzerland | 14 | 0.0% |
| Syria | 16 | 0.0% |
| Taiwan | 163 | 0.0% |
| Thailand | 302 | 0.0% |
| Trinidad and Tobago | 59 | 0.0% |
| Turkey | 72 | 0.0% |
| Ukraine | 370 | 0.1% |
| Uruguay | 79 | 0.0% |
| Uzbekistan | 4 | 0.0% |
| Venezuela | 1,597 | 0.2% |
| Vietnam | 663 | 0.1% |
| West Indies | 66 | 0.0% |
| Western Africa | 934 | 0.1% |
| Western Asia | 523 | 0.1% |
| Western Europe | 1,236 | 0.2% |
| Yemen | 13 | 0.0% |
| Zaire | 210 | 0.0% |
| Zimbabwe | 313 | 0.0% | View All 116 Rows |
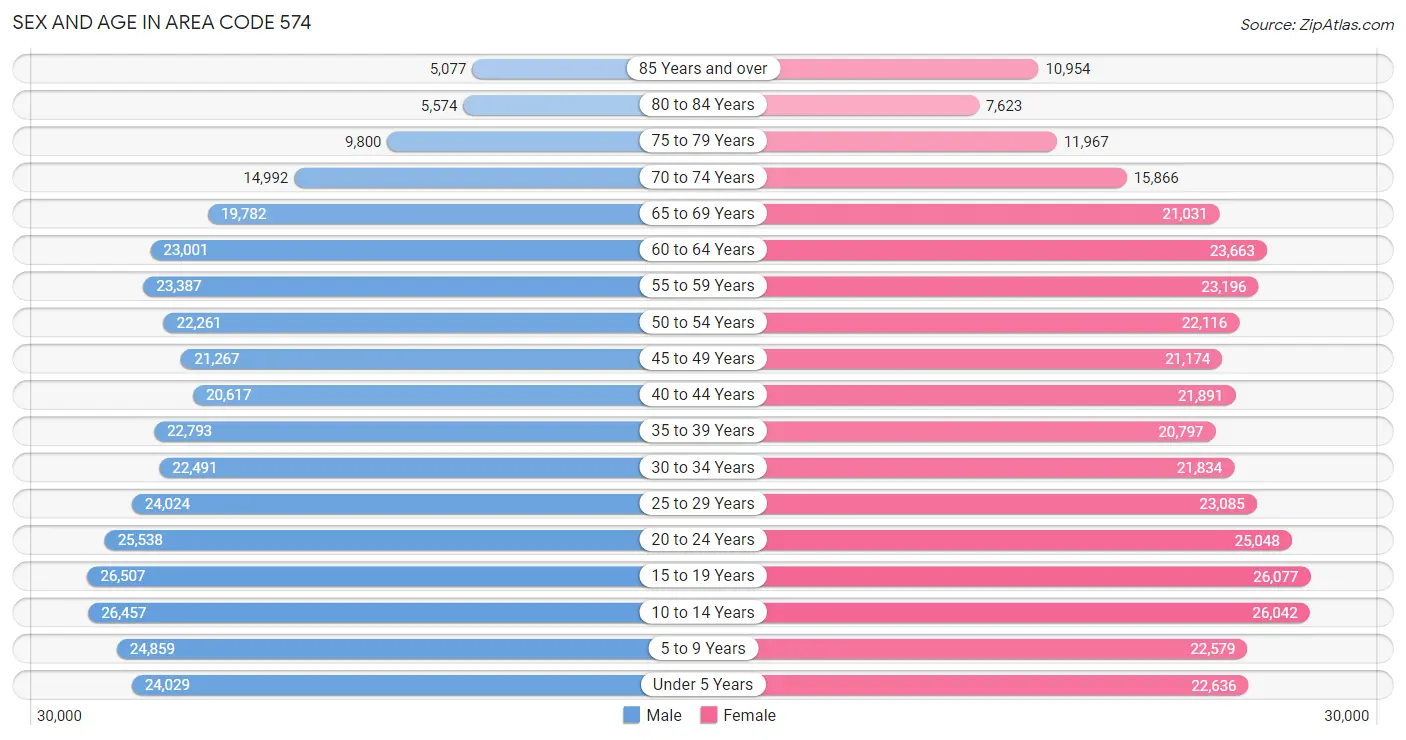
Sex and Age in Area Code 574
Sex and Age in Area Code 574
The most populous age groups in Area Code 574 are 15 to 19 Years (26,507 | 7.3%) for men and 15 to 19 Years (26,077 | 7.1%) for women.
| Age Bracket | Male | Female |
| Under 5 Years | 24,029 (6.6%) | 22,636 (6.2%) |
| 5 to 9 Years | 24,859 (6.9%) | 22,579 (6.1%) |
| 10 to 14 Years | 26,457 (7.3%) | 26,042 (7.1%) |
| 15 to 19 Years | 26,507 (7.3%) | 26,077 (7.1%) |
| 20 to 24 Years | 25,538 (7.0%) | 25,048 (6.8%) |
| 25 to 29 Years | 24,024 (6.6%) | 23,085 (6.3%) |
| 30 to 34 Years | 22,491 (6.2%) | 21,834 (5.9%) |
| 35 to 39 Years | 22,793 (6.3%) | 20,797 (5.7%) |
| 40 to 44 Years | 20,617 (5.7%) | 21,891 (6.0%) |
| 45 to 49 Years | 21,267 (5.9%) | 21,174 (5.8%) |
| 50 to 54 Years | 22,261 (6.1%) | 22,116 (6.0%) |
| 55 to 59 Years | 23,387 (6.5%) | 23,196 (6.3%) |
| 60 to 64 Years | 23,001 (6.4%) | 23,663 (6.4%) |
| 65 to 69 Years | 19,782 (5.5%) | 21,031 (5.7%) |
| 70 to 74 Years | 14,992 (4.1%) | 15,866 (4.3%) |
| 75 to 79 Years | 9,800 (2.7%) | 11,967 (3.3%) |
| 80 to 84 Years | 5,574 (1.5%) | 7,623 (2.1%) |
| 85 Years and over | 5,077 (1.4%) | 10,954 (3.0%) |
| Total | 362,456 (100.0%) | 367,579 (100.0%) |
Families and Households in Area Code 574
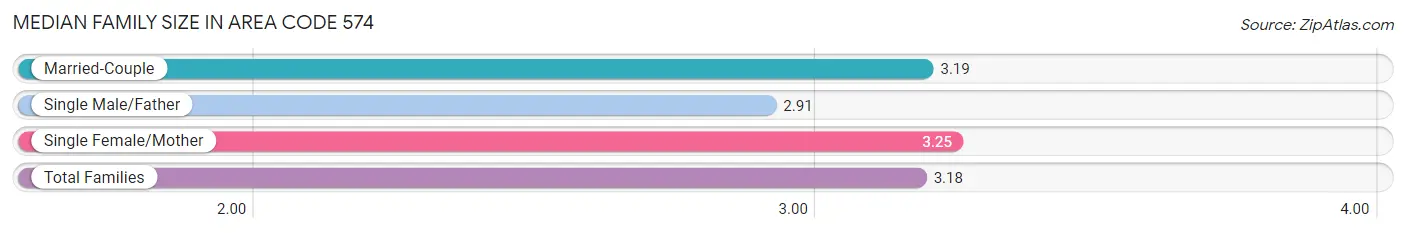
Median Family Size in Area Code 574
The median family size in Area Code 574 is 3.18 persons per family, with single female/mother families (31,673 | 17.9%) accounting for the largest median family size of 3.2452 persons per family. On the other hand, single male/father families (13,033 | 7.4%) represent the smallest median family size with 2.91 persons per family.
| Family Type | # Families | Family Size |
| Married-Couple | 132,124 (74.7%) | 3.19 |
| Single Male/Father | 13,033 (7.4%) | 2.91 |
| Single Female/Mother | 31,673 (17.9%) | 3.25 |
| Total Families | 176,830 (100.0%) | 3.18 |
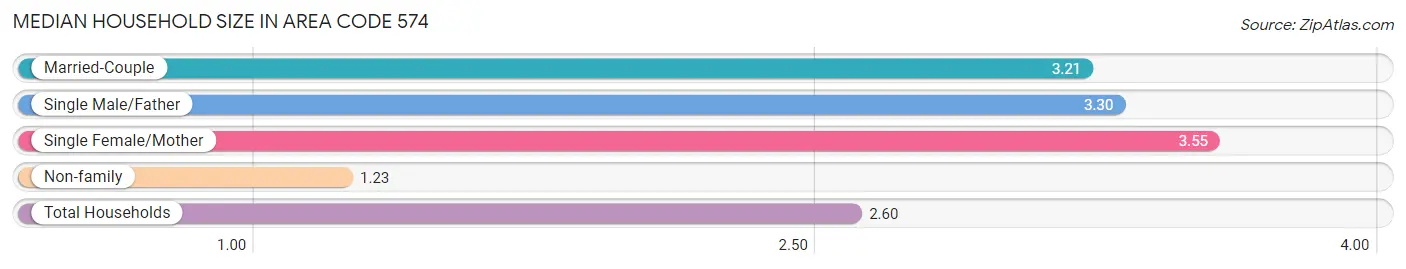
Median Household Size in Area Code 574
The median household size in Area Code 574 is 2.60 persons per household, with single female/mother households (31,673 | 11.5%) accounting for the largest median household size of 3.5532 persons per household. non-family households (99,127 | 35.9%) represent the smallest median household size with 1.23 persons per household.
| Household Type | # Households | Household Size |
| Married-Couple | 132,124 (47.9%) | 3.21 |
| Single Male/Father | 13,033 (4.7%) | 3.30 |
| Single Female/Mother | 31,673 (11.5%) | 3.55 |
| Non-family | 99,127 (35.9%) | 1.23 |
| Total Households | 275,957 (100.0%) | 2.60 |
Household Size by Marriage Status in Area Code 574
Out of a total of 275,957 households in Area Code 574, 176,830 (64.1%) are family households, while 99,127 (35.9%) are nonfamily households. The most numerous type of family households are 2-person households, comprising 81,364, and the most common type of nonfamily households are 1-person households, comprising 83,531.
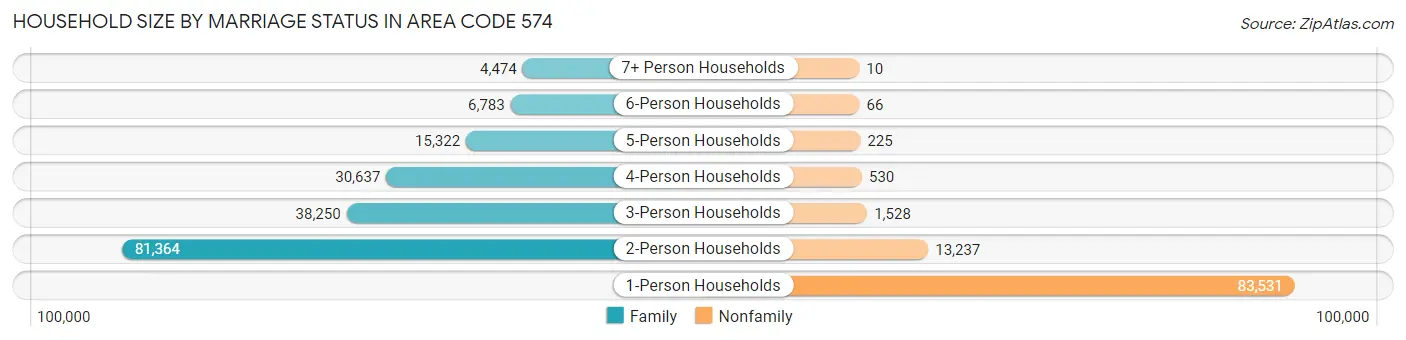
| Household Size | Family Households | Nonfamily Households |
| 1-Person Households | - | 83,531 (30.3%) |
| 2-Person Households | 81,364 (29.5%) | 13,237 (4.8%) |
| 3-Person Households | 38,250 (13.9%) | 1,528 (0.5%) |
| 4-Person Households | 30,637 (11.1%) | 530 (0.2%) |
| 5-Person Households | 15,322 (5.6%) | 225 (0.1%) |
| 6-Person Households | 6,783 (2.5%) | 66 (0.0%) |
| 7+ Person Households | 4,474 (1.6%) | 10 (0.0%) |
| Total | 176,830 (64.1%) | 99,127 (35.9%) |
Female Fertility in Area Code 574
Fertility by Age in Area Code 574
Average fertility rate in Area Code 574 is 59.8 births per 1,000 women. Women in the age bracket of 20 to 34 years have the highest fertility rate with 110.1 births per 1,000 women. Women in the age bracket of 20 to 34 years acount for 74.2% of all women with births.
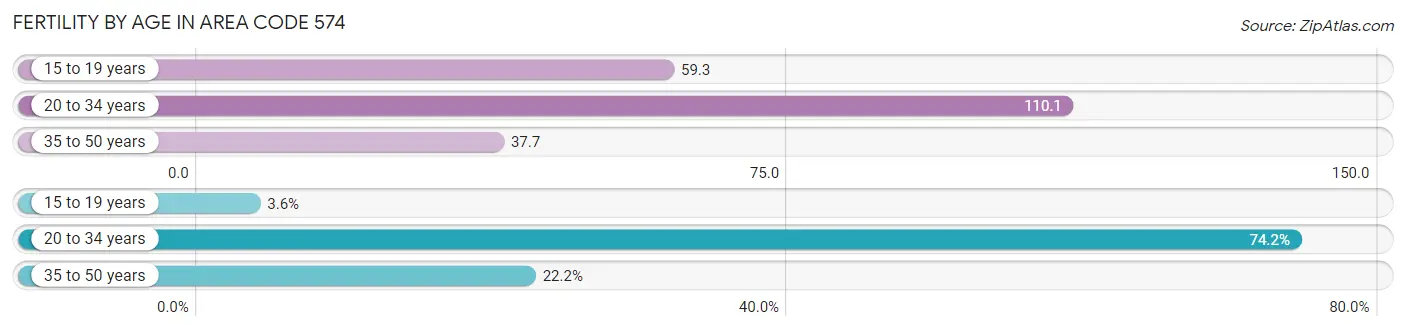
| Age Bracket | Women with Births | Births / 1,000 Women |
| 15 to 19 years | 307 (3.5%) | 59.3 |
| 20 to 34 years | 6,420 (74.2%) | 110.1 |
| 35 to 50 years | 1,924 (22.2%) | 37.7 |
| Total | 8,651 (100.0%) | 59.8 |
Fertility by Age by Marriage Status in Area Code 574
55.9% of women with births (8,651) in Area Code 574 are married. The highest percentage of unmarried women with births falls into 15 to 19 years age bracket with 89.6% of them unmarried at the time of birth, while the lowest percentage of unmarried women with births belong to 20 to 34 years age bracket with 45.5% of them unmarried.
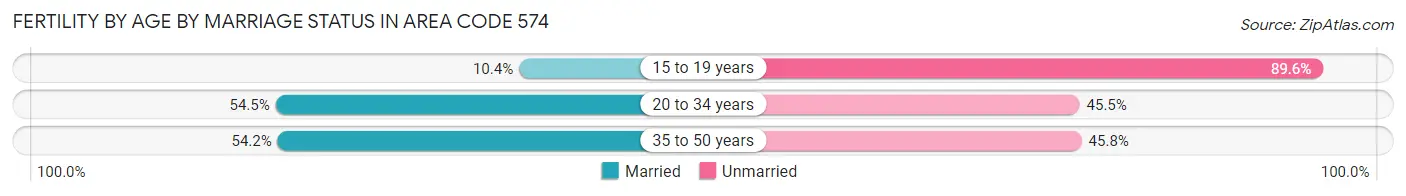
| Age Bracket | Married | Unmarried |
| 15 to 19 years | 32 (10.4%) | 275 (89.6%) |
| 20 to 34 years | 3,501 (54.5%) | 2,919 (45.5%) |
| 35 to 50 years | 1,042 (54.2%) | 882 (45.8%) |
| Total | 4,838 (55.9%) | 3,813 (44.1%) |
Fertility by Education in Area Code 574
Average fertility rate in Area Code 574 is 59.8 births per 1,000 women. Women with the education attainment of graduate degree have the highest fertility rate of 168.7 births per 1,000 women, while women with the education attainment of high school diploma have the lowest fertility at 76.2 births per 1,000 women. Women with the education attainment of college or associate's degree represent 30.9% of all women with births.
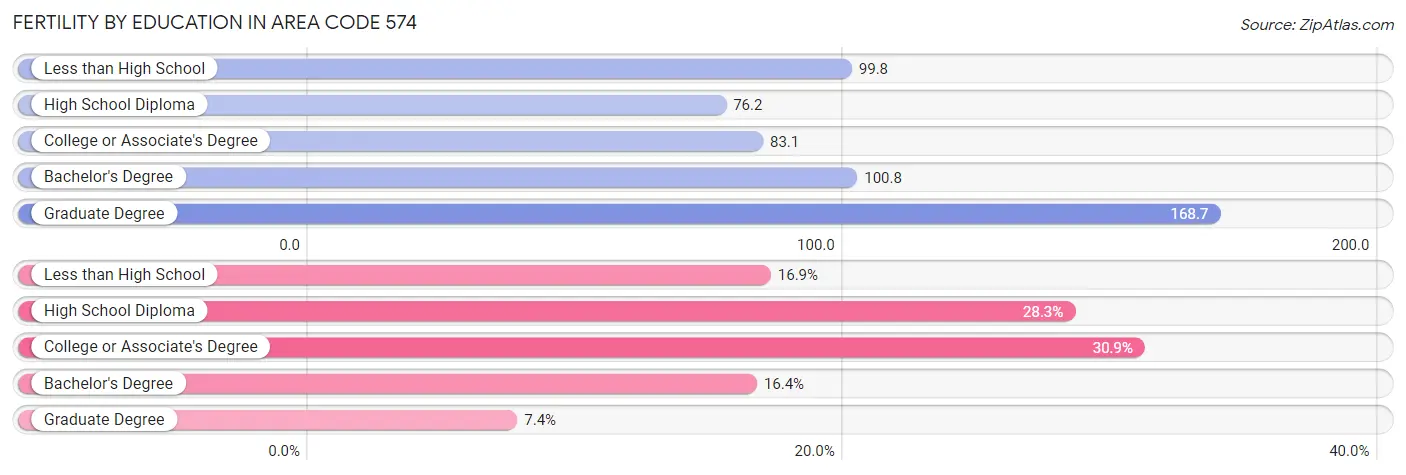
| Educational Attainment | Women with Births | Births / 1,000 Women |
| Less than High School | 1,464 (16.9%) | 99.8 |
| High School Diploma | 2,450 (28.3%) | 76.2 |
| College or Associate's Degree | 2,676 (30.9%) | 83.1 |
| Bachelor's Degree | 1,419 (16.4%) | 100.8 |
| Graduate Degree | 642 (7.4%) | 168.7 |
| Total | 8,651 (100.0%) | 59.8 |
Fertility by Education by Marriage Status in Area Code 574
44.1% of women with births in Area Code 574 are unmarried. Women with the educational attainment of bachelor's degree are most likely to be married with 45.7% of them married at childbirth, while women with the educational attainment of less than high school are least likely to be married with 68.9% of them unmarried at childbirth.
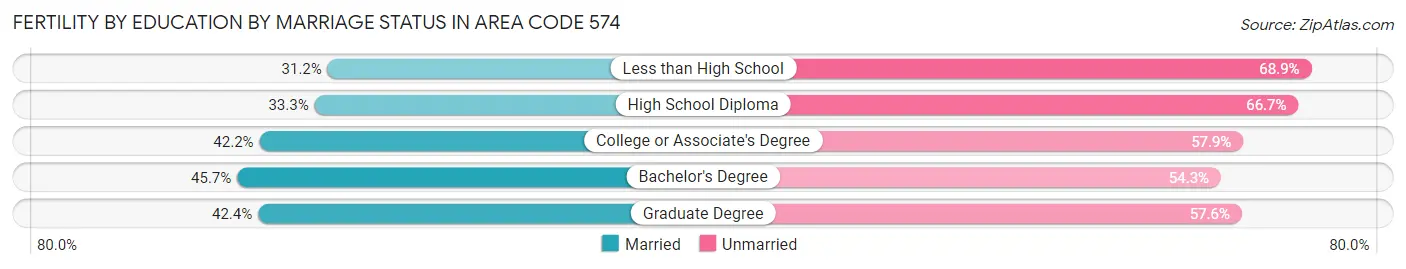
| Educational Attainment | Married | Unmarried |
| Less than High School | 456 (31.1%) | 1,008 (68.9%) |
| High School Diploma | 815 (33.3%) | 1,635 (66.7%) |
| College or Associate's Degree | 1,128 (42.1%) | 1,548 (57.9%) |
| Bachelor's Degree | 649 (45.7%) | 770 (54.3%) |
| Graduate Degree | 272 (42.4%) | 370 (57.6%) |
| Total | 4,838 (55.9%) | 3,813 (44.1%) |
Employment Characteristics in Area Code 574
Employment by Class of Employer in Area Code 574
Among the 341,450 employed individuals in Area Code 574, private company employees (244,957 | 71.7%), not-for-profit organizations (37,694 | 11.0%), and local government employees (20,570 | 6.0%) make up the most common classes of employment.
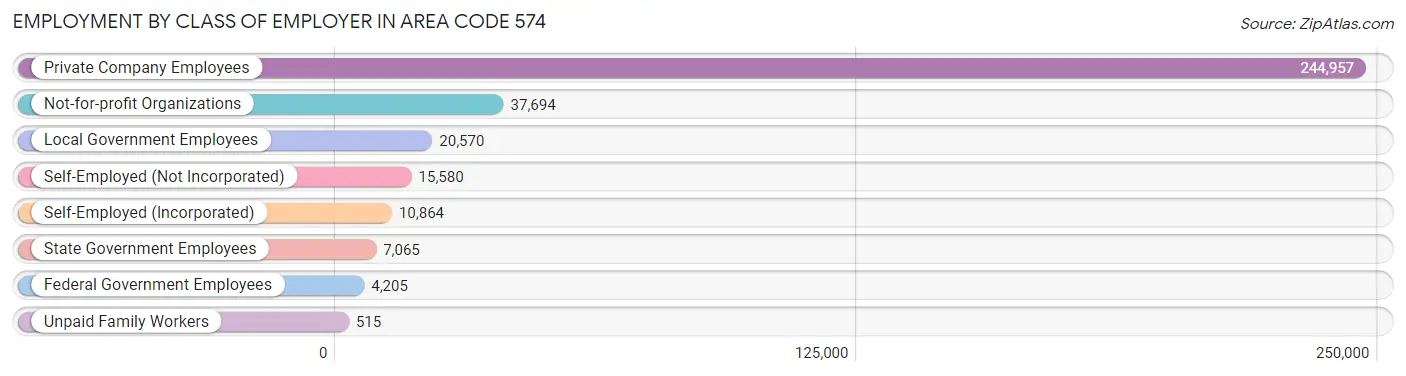
| Employer Class | # Employees | % Employees |
| Private Company Employees | 244,957 | 71.7% |
| Self-Employed (Incorporated) | 10,864 | 3.2% |
| Self-Employed (Not Incorporated) | 15,580 | 4.6% |
| Not-for-profit Organizations | 37,694 | 11.0% |
| Local Government Employees | 20,570 | 6.0% |
| State Government Employees | 7,065 | 2.1% |
| Federal Government Employees | 4,205 | 1.2% |
| Unpaid Family Workers | 515 | 0.2% |
| Total | 341,450 | 100.0% |
Employment Status by Age in Area Code 574
According to the labor force statistics for Area Code 574, out of the total population over 16 years of age (572,571), 63.1% or 361,407 individuals are in the labor force, with 4.3% or 15,360 of them unemployed. The age group with the highest labor force participation rate is 20 to 24 years, with 83.4% or 42,168 individuals in the labor force. Within the labor force, the 16 to 19 years age range has the highest percentage of unemployed individuals, with 701.0% or 155,622 of them being unemployed.
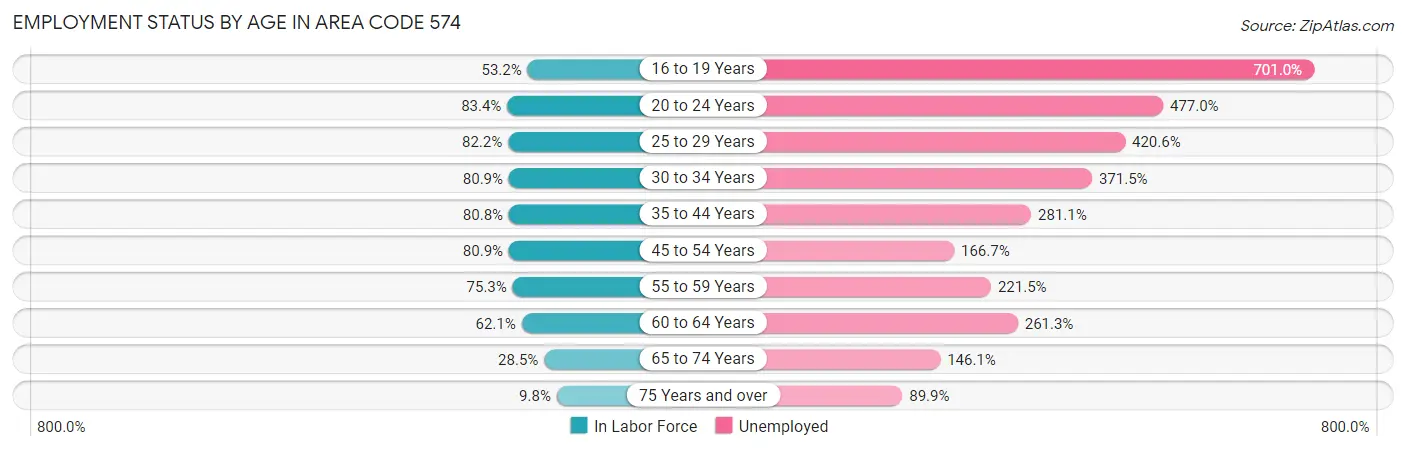
| Age Bracket | In Labor Force | Unemployed |
| 16 to 19 Years | 22,199 (53.2%) | 155,622 (701.0%) |
| 20 to 24 Years | 42,167 (83.4%) | 201,141 (477.0%) |
| 25 to 29 Years | 38,709 (82.2%) | 162,810 (420.6%) |
| 30 to 34 Years | 35,873 (80.9%) | 133,264 (371.5%) |
| 35 to 44 Years | 69,576 (80.8%) | 195,578 (281.1%) |
| 45 to 54 Years | 70,215 (80.9%) | 117,053 (166.7%) |
| 55 to 59 Years | 35,093 (75.3%) | 77,727 (221.5%) |
| 60 to 64 Years | 28,967 (62.1%) | 75,683 (261.3%) |
| 65 to 74 Years | 20,439 (28.5%) | 29,864 (146.1%) |
| 75 Years and over | 4,985 (9.8%) | 4,483 (89.9%) |
| Total | 361,395 (63.1%) | 15,352 (4.3%) |
Employment Status by Educational Attainment in Area Code 574
According to labor force statistics for Area Code 574, 77.1% of individuals (275,779) out of the total population between 25 and 64 years of age (357,597) are in the labor force, with 273.5% or 754,256 of them being unemployed. The group with the highest labor force participation rate are those with the educational attainment of bachelor's degree or higher, with 86.8% or 75,763 individuals in the labor force. Within the labor force, individuals with less than high school education have the highest percentage of unemployment, with 724.9% or 217,376 of them being unemployed.
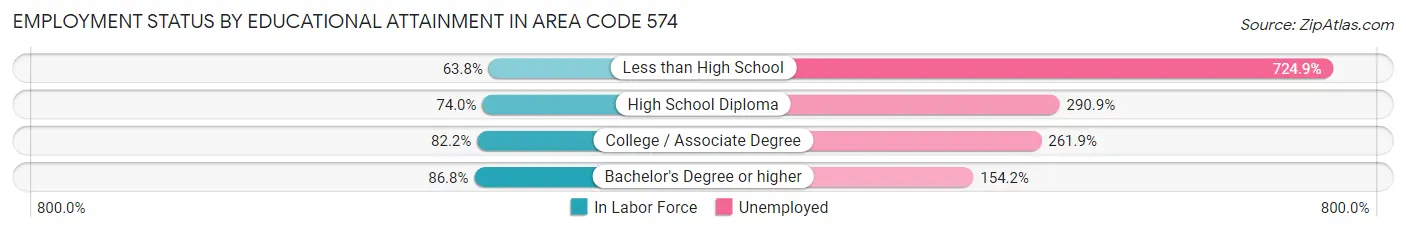
| Educational Attainment | In Labor Force | Unemployed |
| Less than High School | 29,986 (63.8%) | 340,660 (724.9%) |
| High School Diploma | 86,912 (74.0%) | 341,866 (290.9%) |
| College / Associate Degree | 86,988 (82.2%) | 277,033 (261.9%) |
| Bachelor's Degree or higher | 75,763 (86.8%) | 134,624 (154.2%) |
| Total | 275,785 (77.1%) | 978,028 (273.5%) |
Employment Occupations by Sex in Area Code 574
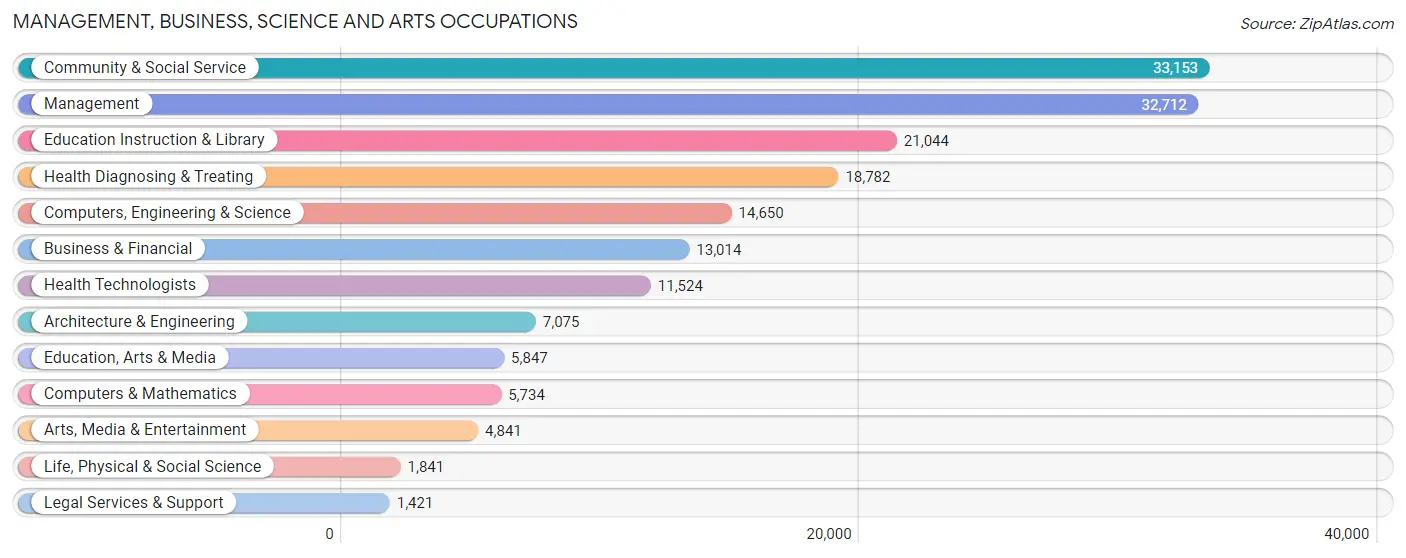
Management, Business, Science and Arts Occupations
The most common Management, Business, Science and Arts occupations in Area Code 574 are Community & Social Service (33,153 | 9.5%), Management (32,712 | 9.4%), Education Instruction & Library (21,044 | 6.0%), Health Diagnosing & Treating (18,782 | 5.4%), and Computers, Engineering & Science (14,650 | 4.2%).
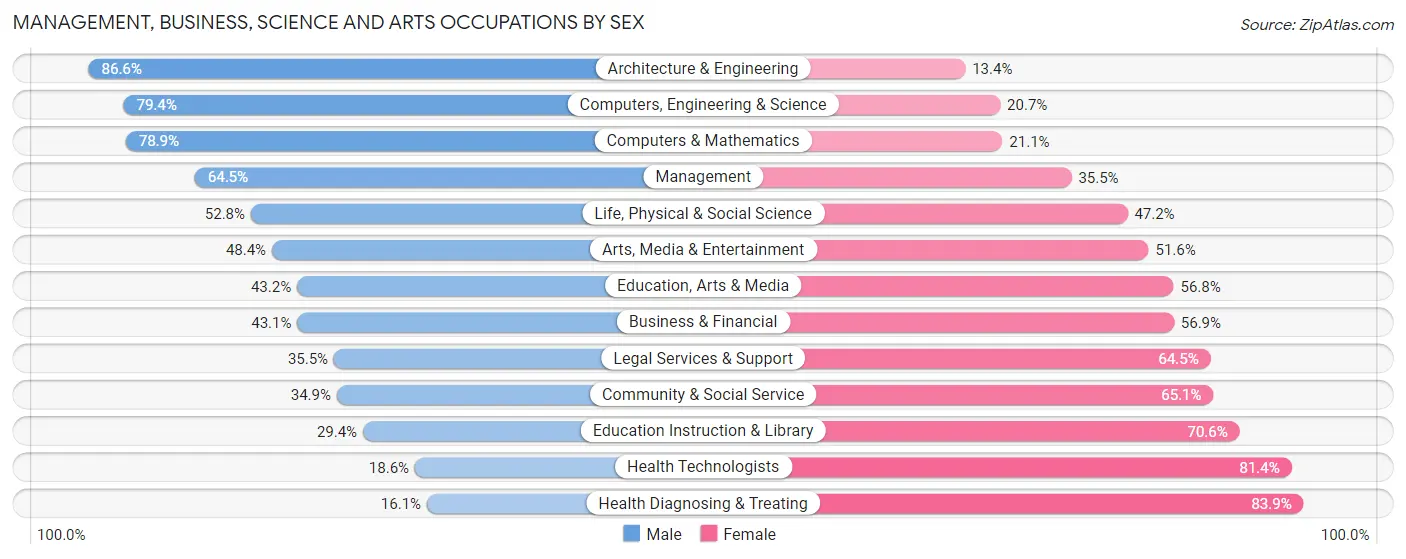
Management, Business, Science and Arts Occupations by Sex
Within the Management, Business, Science and Arts occupations in Area Code 574, the most male-oriented occupations are Architecture & Engineering (86.6%), Computers, Engineering & Science (79.3%), and Computers & Mathematics (78.9%), while the most female-oriented occupations are Health Diagnosing & Treating (83.9%), Health Technologists (81.4%), and Education Instruction & Library (70.6%).
| Occupation | Male | Female |
| Management | 21,093 (64.5%) | 11,619 (35.5%) |
| Business & Financial | 5,612 (43.1%) | 7,402 (56.9%) |
| Computers, Engineering & Science | 11,625 (79.3%) | 3,025 (20.6%) |
| Computers & Mathematics | 4,523 (78.9%) | 1,211 (21.1%) |
| Architecture & Engineering | 6,130 (86.6%) | 945 (13.4%) |
| Life, Physical & Social Science | 972 (52.8%) | 869 (47.2%) |
| Community & Social Service | 11,563 (34.9%) | 21,590 (65.1%) |
| Education, Arts & Media | 2,525 (43.2%) | 3,322 (56.8%) |
| Legal Services & Support | 504 (35.5%) | 917 (64.5%) |
| Education Instruction & Library | 6,191 (29.4%) | 14,853 (70.6%) |
| Arts, Media & Entertainment | 2,343 (48.4%) | 2,498 (51.6%) |
| Health Diagnosing & Treating | 3,020 (16.1%) | 15,762 (83.9%) |
| Health Technologists | 2,141 (18.6%) | 9,383 (81.4%) |
| Total (Category) | 52,913 (47.1%) | 59,398 (52.9%) |
| Total (Overall) | 187,094 (53.6%) | 161,703 (46.4%) |
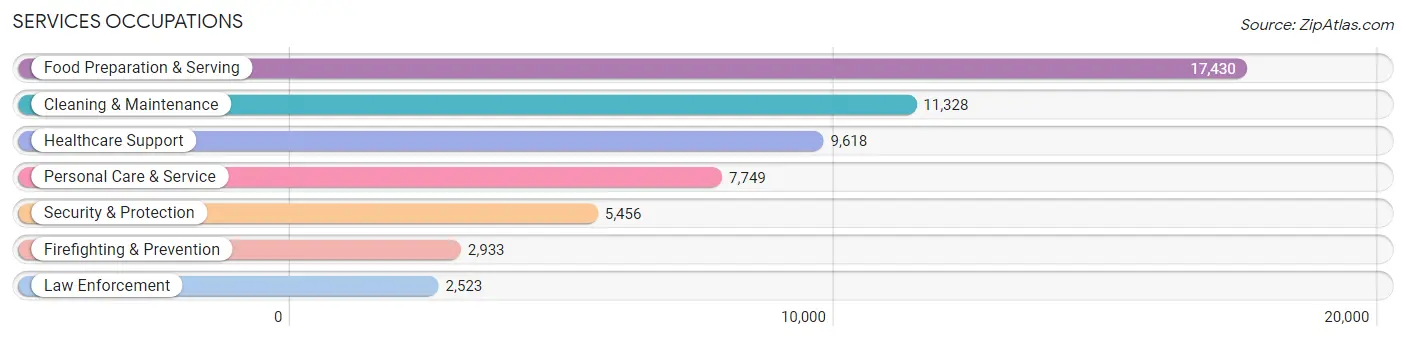
Services Occupations
The most common Services occupations in Area Code 574 are Food Preparation & Serving (17,430 | 5.0%), Cleaning & Maintenance (11,328 | 3.3%), Healthcare Support (9,618 | 2.8%), Personal Care & Service (7,749 | 2.2%), and Security & Protection (5,456 | 1.6%).
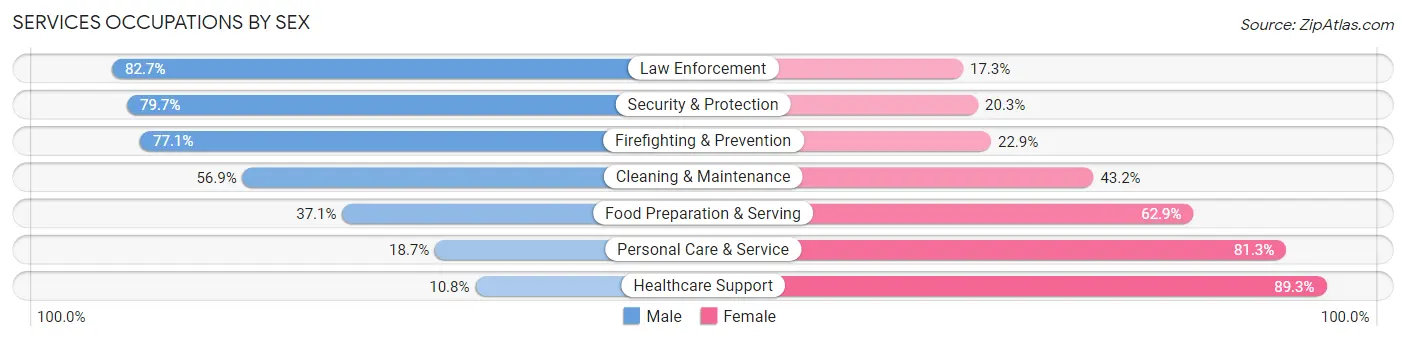
Services Occupations by Sex
Within the Services occupations in Area Code 574, the most male-oriented occupations are Law Enforcement (82.7%), Security & Protection (79.7%), and Firefighting & Prevention (77.1%), while the most female-oriented occupations are Healthcare Support (89.2%), Personal Care & Service (81.3%), and Food Preparation & Serving (62.9%).
| Occupation | Male | Female |
| Healthcare Support | 1,034 (10.7%) | 8,584 (89.2%) |
| Security & Protection | 4,348 (79.7%) | 1,108 (20.3%) |
| Firefighting & Prevention | 2,262 (77.1%) | 671 (22.9%) |
| Law Enforcement | 2,086 (82.7%) | 437 (17.3%) |
| Food Preparation & Serving | 6,464 (37.1%) | 10,966 (62.9%) |
| Cleaning & Maintenance | 6,440 (56.9%) | 4,888 (43.1%) |
| Personal Care & Service | 1,450 (18.7%) | 6,299 (81.3%) |
| Total (Category) | 19,736 (38.3%) | 31,845 (61.7%) |
| Total (Overall) | 187,094 (53.6%) | 161,703 (46.4%) |
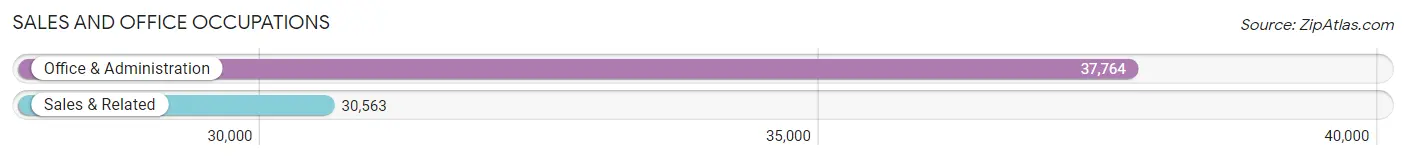
Sales and Office Occupations
The most common Sales and Office occupations in Area Code 574 are Office & Administration (37,764 | 10.8%), and Sales & Related (30,563 | 8.8%).
Sales and Office Occupations by Sex
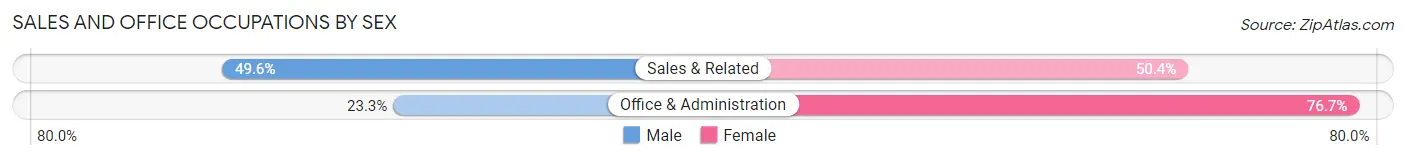
| Occupation | Male | Female |
| Sales & Related | 15,162 (49.6%) | 15,401 (50.4%) |
| Office & Administration | 8,802 (23.3%) | 28,962 (76.7%) |
| Total (Category) | 23,964 (35.1%) | 44,363 (64.9%) |
| Total (Overall) | 187,094 (53.6%) | 161,703 (46.4%) |
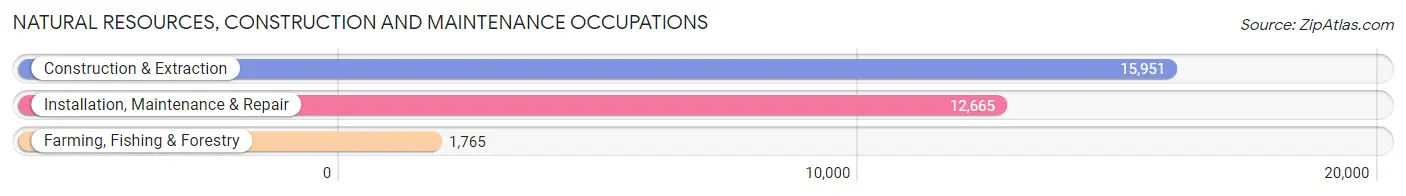
Natural Resources, Construction and Maintenance Occupations
The most common Natural Resources, Construction and Maintenance occupations in Area Code 574 are Construction & Extraction (15,951 | 4.6%), Installation, Maintenance & Repair (12,665 | 3.6%), and Farming, Fishing & Forestry (1,765 | 0.5%).
Natural Resources, Construction and Maintenance Occupations by Sex
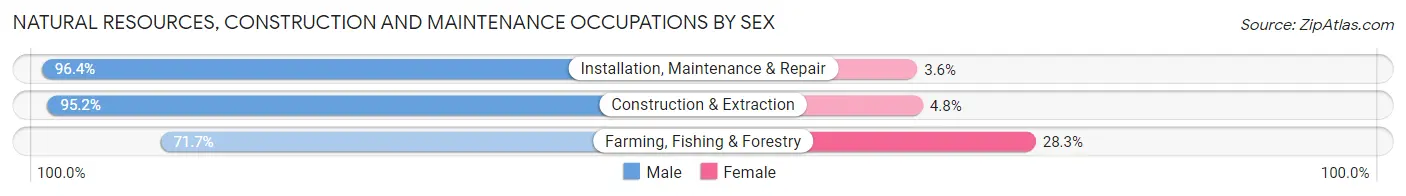
| Occupation | Male | Female |
| Farming, Fishing & Forestry | 1,266 (71.7%) | 499 (28.3%) |
| Construction & Extraction | 15,189 (95.2%) | 762 (4.8%) |
| Installation, Maintenance & Repair | 12,208 (96.4%) | 457 (3.6%) |
| Total (Category) | 28,663 (94.4%) | 1,718 (5.7%) |
| Total (Overall) | 187,094 (53.6%) | 161,703 (46.4%) |
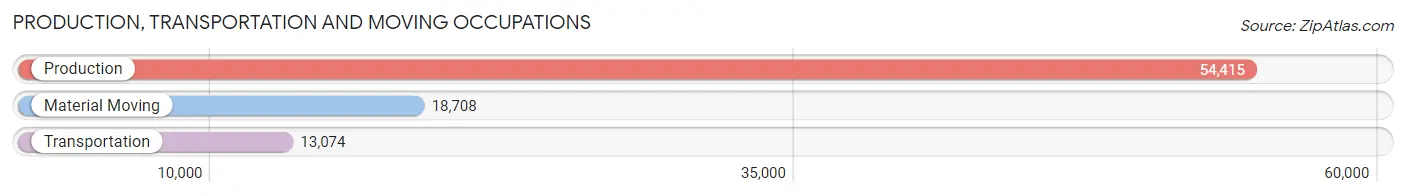
Production, Transportation and Moving Occupations
The most common Production, Transportation and Moving occupations in Area Code 574 are Production (54,415 | 15.6%), Material Moving (18,708 | 5.4%), and Transportation (13,074 | 3.7%).
Production, Transportation and Moving Occupations by Sex
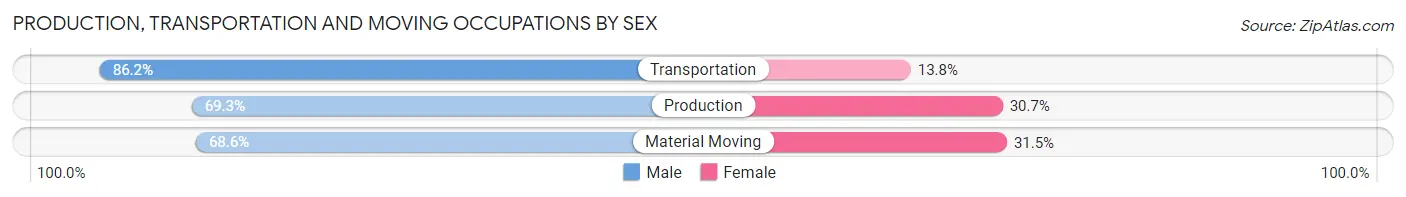
| Occupation | Male | Female |
| Production | 37,725 (69.3%) | 16,690 (30.7%) |
| Transportation | 11,268 (86.2%) | 1,806 (13.8%) |
| Material Moving | 12,825 (68.5%) | 5,883 (31.5%) |
| Total (Category) | 61,818 (71.7%) | 24,379 (28.3%) |
| Total (Overall) | 187,094 (53.6%) | 161,703 (46.4%) |
Employment Industries by Sex in Area Code 574
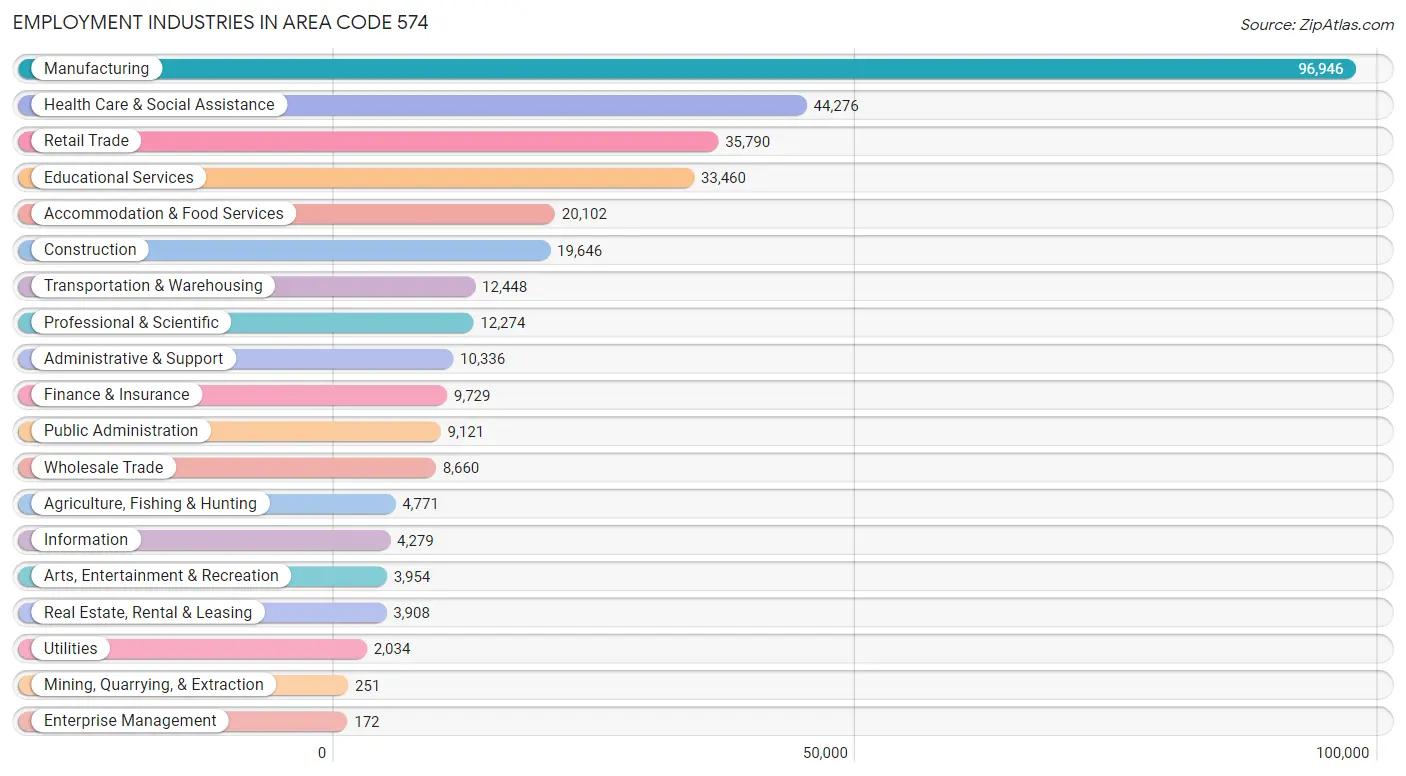
Employment Industries in Area Code 574
The major employment industries in Area Code 574 include Manufacturing (96,946 | 27.8%), Health Care & Social Assistance (44,276 | 12.7%), Retail Trade (35,790 | 10.3%), Educational Services (33,460 | 9.6%), and Accommodation & Food Services (20,102 | 5.8%).
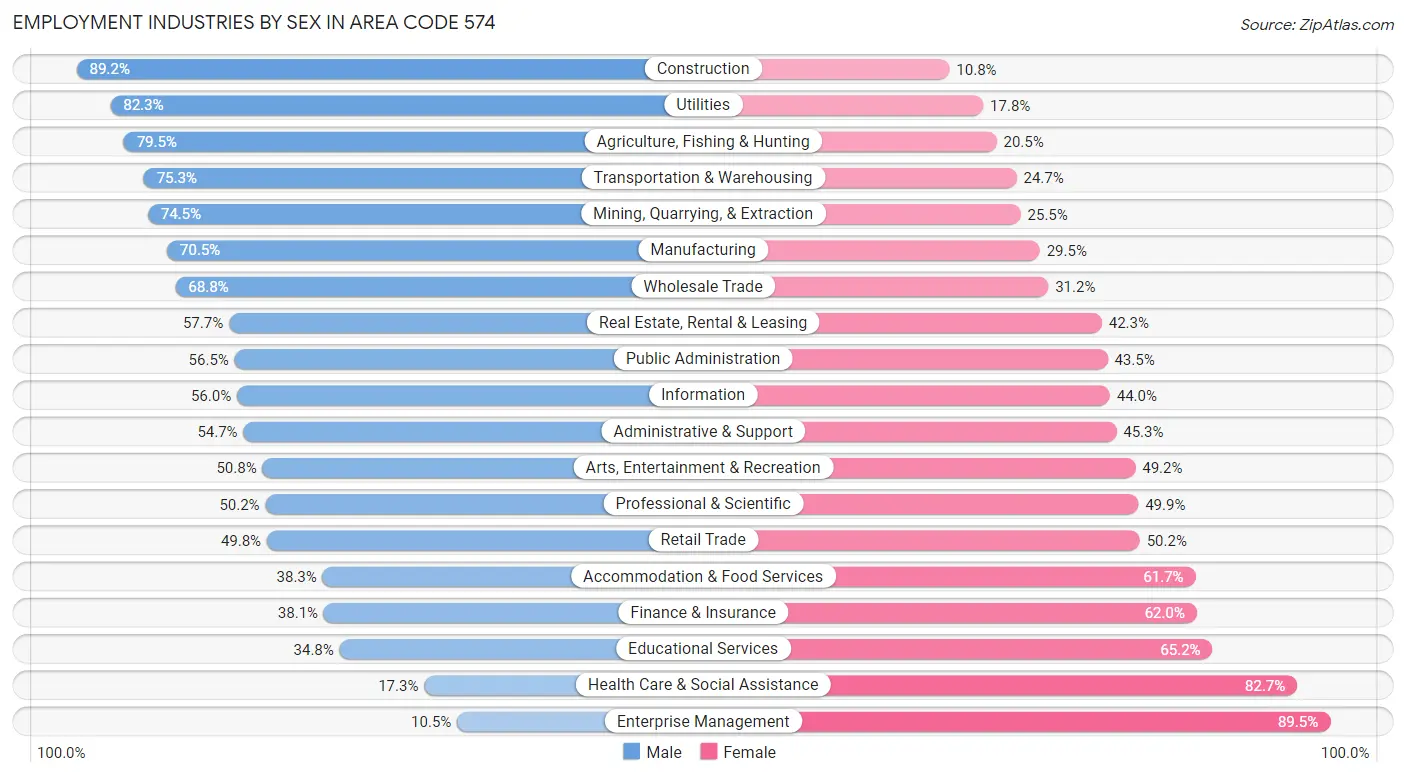
Employment Industries by Sex in Area Code 574
The Area Code 574 industries that see more men than women are Construction (89.2%), Utilities (82.3%), and Agriculture, Fishing & Hunting (79.5%), whereas the industries that tend to have a higher number of women are Enterprise Management (89.5%), Health Care & Social Assistance (82.7%), and Educational Services (65.2%).
| Industry | Male | Female |
| Agriculture, Fishing & Hunting | 3,792 (79.5%) | 979 (20.5%) |
| Mining, Quarrying, & Extraction | 187 (74.5%) | 64 (25.5%) |
| Construction | 17,533 (89.2%) | 2,113 (10.8%) |
| Manufacturing | 68,388 (70.5%) | 28,558 (29.5%) |
| Wholesale Trade | 5,956 (68.8%) | 2,704 (31.2%) |
| Retail Trade | 17,838 (49.8%) | 17,952 (50.2%) |
| Transportation & Warehousing | 9,378 (75.3%) | 3,070 (24.7%) |
| Utilities | 1,673 (82.3%) | 361 (17.7%) |
| Information | 2,398 (56.0%) | 1,881 (44.0%) |
| Finance & Insurance | 3,702 (38.1%) | 6,027 (62.0%) |
| Real Estate, Rental & Leasing | 2,255 (57.7%) | 1,653 (42.3%) |
| Professional & Scientific | 6,155 (50.1%) | 6,119 (49.8%) |
| Enterprise Management | 18 (10.5%) | 154 (89.5%) |
| Administrative & Support | 5,654 (54.7%) | 4,682 (45.3%) |
| Educational Services | 11,643 (34.8%) | 21,817 (65.2%) |
| Health Care & Social Assistance | 7,652 (17.3%) | 36,624 (82.7%) |
| Arts, Entertainment & Recreation | 2,007 (50.8%) | 1,947 (49.2%) |
| Accommodation & Food Services | 7,704 (38.3%) | 12,398 (61.7%) |
| Public Administration | 5,155 (56.5%) | 3,966 (43.5%) |
| Total | 187,094 (53.6%) | 161,703 (46.4%) |
Education in Area Code 574
School Enrollment in Area Code 574
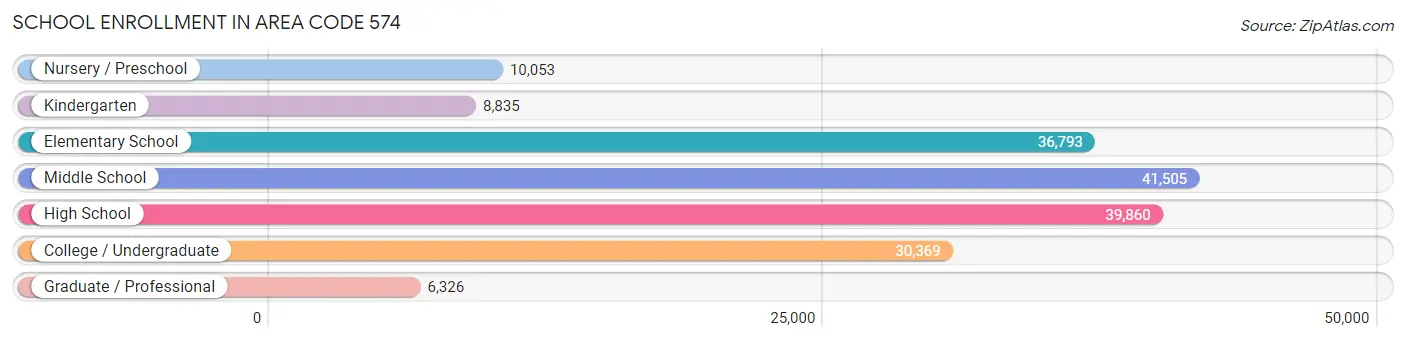
The most common levels of schooling among the 173,741 students in Area Code 574 are middle school (41,505 | 23.9%), high school (39,860 | 22.9%), and elementary school (36,793 | 21.2%).
| School Level | # Students | % Students |
| Nursery / Preschool | 10,053 | 5.8% |
| Kindergarten | 8,835 | 5.1% |
| Elementary School | 36,793 | 21.2% |
| Middle School | 41,505 | 23.9% |
| High School | 39,860 | 22.9% |
| College / Undergraduate | 30,369 | 17.5% |
| Graduate / Professional | 6,326 | 3.6% |
| Total | 173,741 | 100.0% |
School Enrollment by Age by Funding Source in Area Code 574
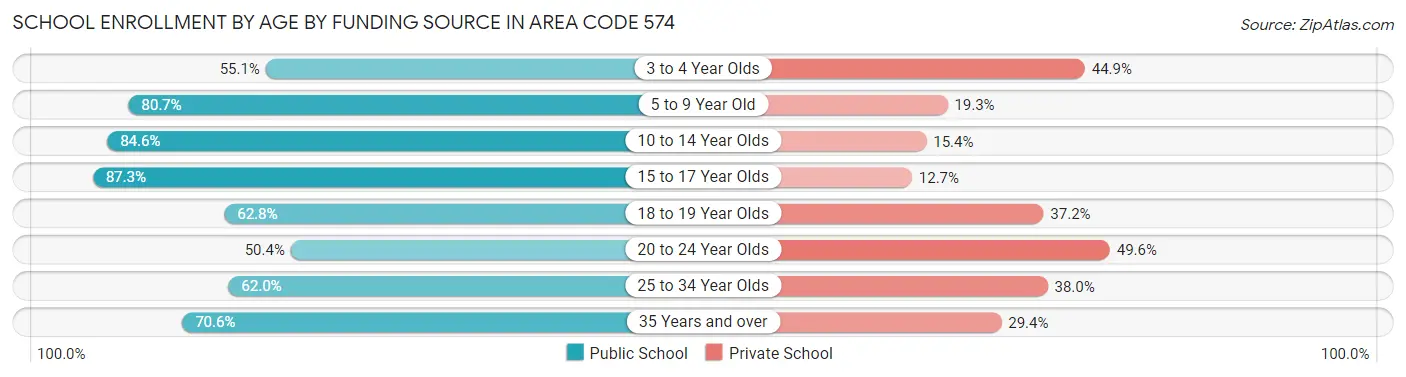
Out of a total of 173,741 students who are enrolled in schools in Area Code 574, 40,855 (23.5%) attend a private institution, while the remaining 132,886 (76.5%) are enrolled in public schools. The age group of 20 to 24 year olds has the highest likelihood of being enrolled in private schools, with 8,029 (49.6% in the age bracket) enrolled. Conversely, the age group of 15 to 17 year olds has the lowest likelihood of being enrolled in a private school, with 25,313 (87.3% in the age bracket) attending a public institution.
| Age Bracket | Public School | Private School |
| 3 to 4 Year Olds | 3,699 (55.1%) | 3,016 (44.9%) |
| 5 to 9 Year Old | 34,727 (80.7%) | 8,323 (19.3%) |
| 10 to 14 Year Olds | 42,929 (84.6%) | 7,807 (15.4%) |
| 15 to 17 Year Olds | 25,313 (87.3%) | 3,684 (12.7%) |
| 18 to 19 Year Olds | 9,150 (62.8%) | 5,421 (37.2%) |
| 20 to 24 Year Olds | 8,167 (50.4%) | 8,029 (49.6%) |
| 25 to 34 Year Olds | 4,500 (62.0%) | 2,754 (38.0%) |
| 35 Years and over | 4,395 (70.6%) | 1,827 (29.4%) |
| Total | 132,886 (76.5%) | 40,855 (23.5%) |
Educational Attainment by Field of Study in Area Code 574
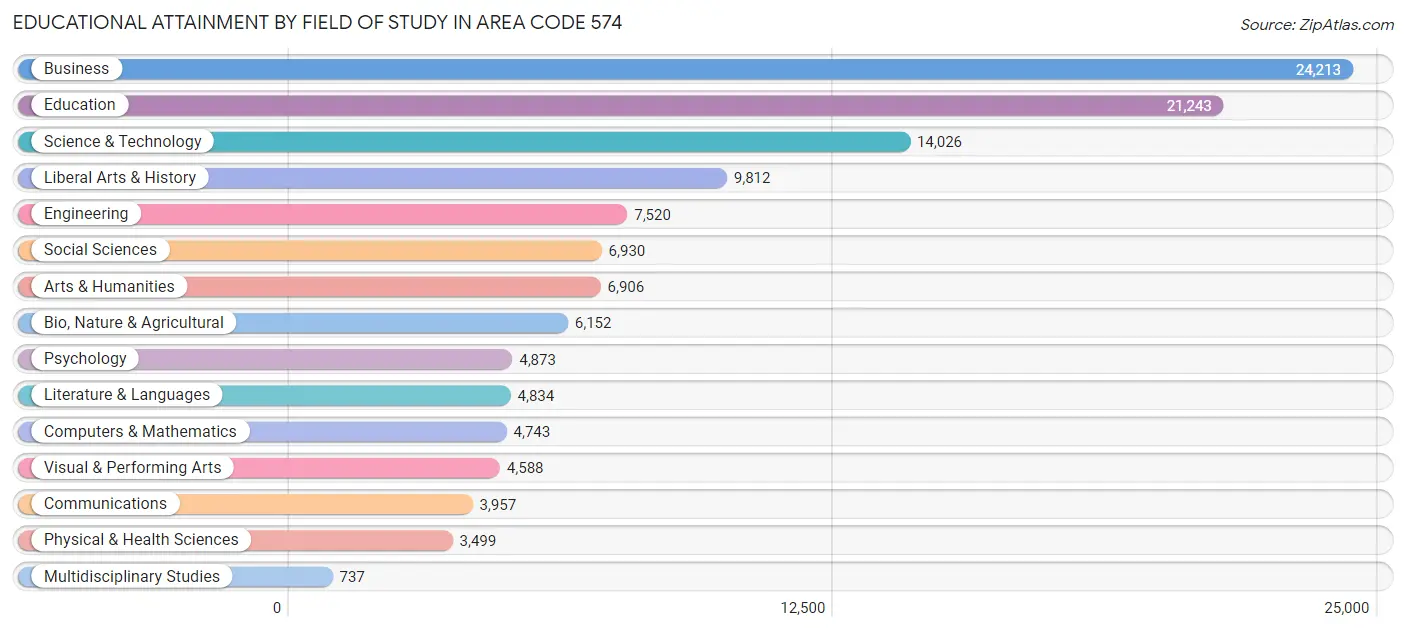
Business (24,213 | 19.5%), education (21,243 | 17.1%), science & technology (14,026 | 11.3%), liberal arts & history (9,812 | 7.9%), and engineering (7,520 | 6.1%) are the most common fields of study among 124,033 individuals in Area Code 574 who have obtained a bachelor's degree or higher.
| Field of Study | # Graduates | % Graduates |
| Computers & Mathematics | 4,743 | 3.8% |
| Bio, Nature & Agricultural | 6,152 | 5.0% |
| Physical & Health Sciences | 3,499 | 2.8% |
| Psychology | 4,873 | 3.9% |
| Social Sciences | 6,930 | 5.6% |
| Engineering | 7,520 | 6.1% |
| Multidisciplinary Studies | 737 | 0.6% |
| Science & Technology | 14,026 | 11.3% |
| Business | 24,213 | 19.5% |
| Education | 21,243 | 17.1% |
| Literature & Languages | 4,834 | 3.9% |
| Liberal Arts & History | 9,812 | 7.9% |
| Visual & Performing Arts | 4,588 | 3.7% |
| Communications | 3,957 | 3.2% |
| Arts & Humanities | 6,906 | 5.6% |
| Total | 124,033 | 100.0% |
Transportation & Commute in Area Code 574
Vehicle Availability by Sex in Area Code 574
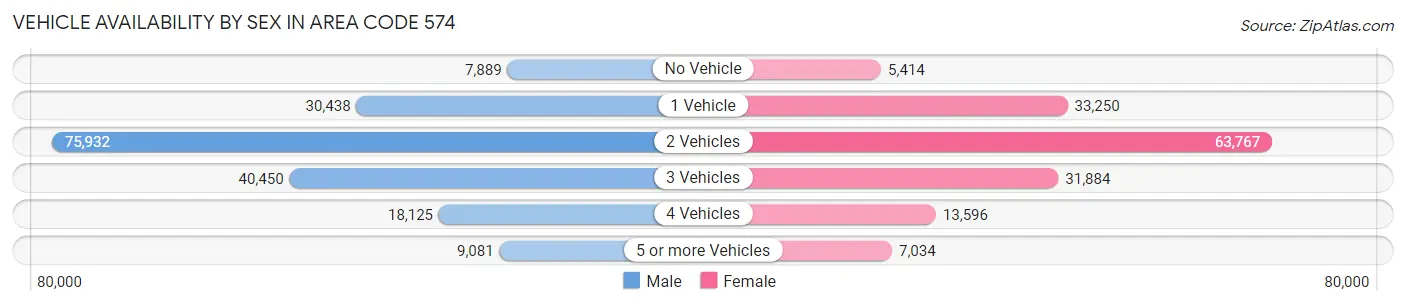
The most prevalent vehicle ownership categories in Area Code 574 are males with 2 vehicles (75,932, accounting for 41.7%) and females with 2 vehicles (63,767, making up 49.0%).
| Vehicles Available | Male | Female |
| No Vehicle | 7,889 (4.3%) | 5,414 (3.5%) |
| 1 Vehicle | 30,438 (16.7%) | 33,250 (21.5%) |
| 2 Vehicles | 75,932 (41.7%) | 63,767 (41.1%) |
| 3 Vehicles | 40,450 (22.2%) | 31,884 (20.6%) |
| 4 Vehicles | 18,125 (10.0%) | 13,596 (8.8%) |
| 5 or more Vehicles | 9,081 (5.0%) | 7,034 (4.5%) |
| Total | 181,915 (100.0%) | 154,945 (100.0%) |
Commute Time in Area Code 574
The most frequently occuring commute durations in Area Code 574 are 15 to 19 minutes (58,592 commuters, 18.3%), 10 to 14 minutes (54,563 commuters, 17.0%), and 20 to 24 minutes (47,351 commuters, 14.8%).
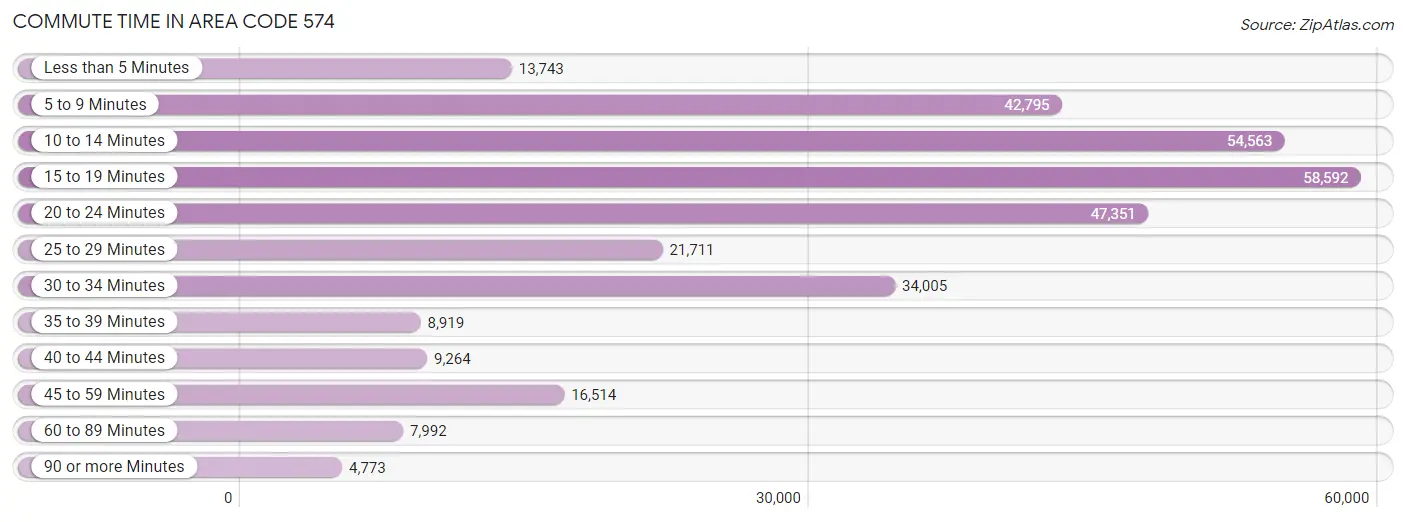
| Commute Time | # Commuters | % Commuters |
| Less than 5 Minutes | 13,743 | 4.3% |
| 5 to 9 Minutes | 42,795 | 13.4% |
| 10 to 14 Minutes | 54,563 | 17.0% |
| 15 to 19 Minutes | 58,592 | 18.3% |
| 20 to 24 Minutes | 47,351 | 14.8% |
| 25 to 29 Minutes | 21,711 | 6.8% |
| 30 to 34 Minutes | 34,005 | 10.6% |
| 35 to 39 Minutes | 8,919 | 2.8% |
| 40 to 44 Minutes | 9,264 | 2.9% |
| 45 to 59 Minutes | 16,514 | 5.2% |
| 60 to 89 Minutes | 7,992 | 2.5% |
| 90 or more Minutes | 4,773 | 1.5% |
Commute Time by Sex in Area Code 574
The most common commute times in Area Code 574 are 15 to 19 minutes (29,175 commuters, 16.8%) for males and 15 to 19 minutes (29,417 commuters, 20.1%) for females.
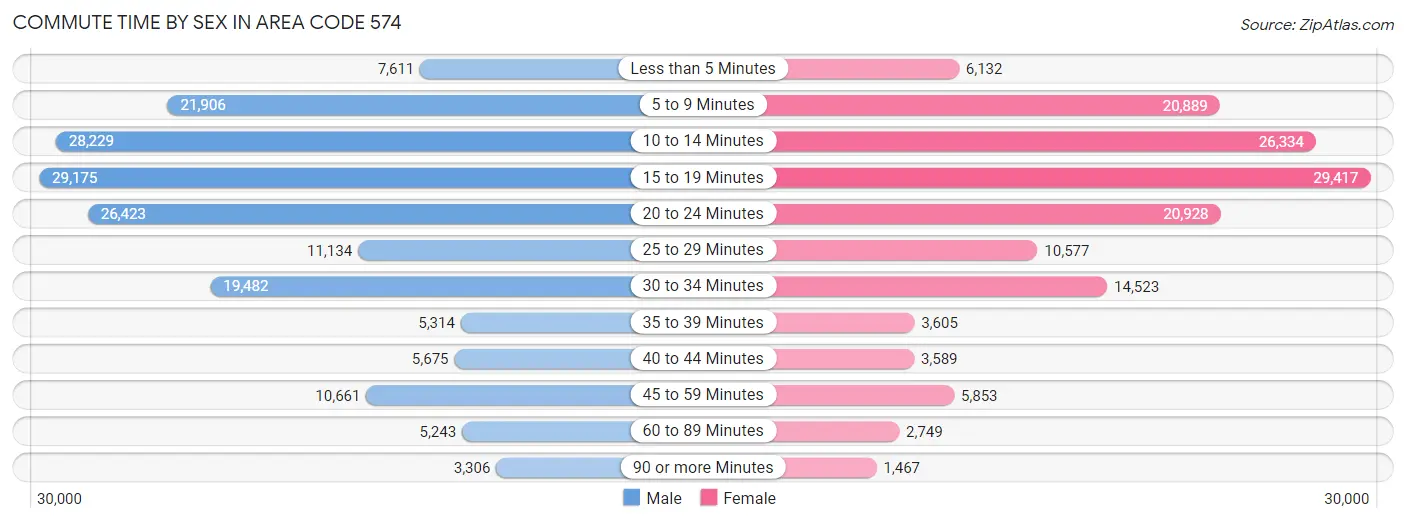
| Commute Time | Male | Female |
| Less than 5 Minutes | 7,611 (4.4%) | 6,132 (4.2%) |
| 5 to 9 Minutes | 21,906 (12.6%) | 20,889 (14.3%) |
| 10 to 14 Minutes | 28,229 (16.2%) | 26,334 (18.0%) |
| 15 to 19 Minutes | 29,175 (16.8%) | 29,417 (20.1%) |
| 20 to 24 Minutes | 26,423 (15.2%) | 20,928 (14.3%) |
| 25 to 29 Minutes | 11,134 (6.4%) | 10,577 (7.2%) |
| 30 to 34 Minutes | 19,482 (11.2%) | 14,523 (9.9%) |
| 35 to 39 Minutes | 5,314 (3.0%) | 3,605 (2.5%) |
| 40 to 44 Minutes | 5,675 (3.3%) | 3,589 (2.5%) |
| 45 to 59 Minutes | 10,661 (6.1%) | 5,853 (4.0%) |
| 60 to 89 Minutes | 5,243 (3.0%) | 2,749 (1.9%) |
| 90 or more Minutes | 3,306 (1.9%) | 1,467 (1.0%) |
Time of Departure to Work by Sex in Area Code 574
The most frequent times of departure to work in Area Code 574 are 12:00 AM to 4:59 AM (27,866, 16.0%) for males and 7:30 AM to 7:59 AM (22,195, 15.2%) for females.
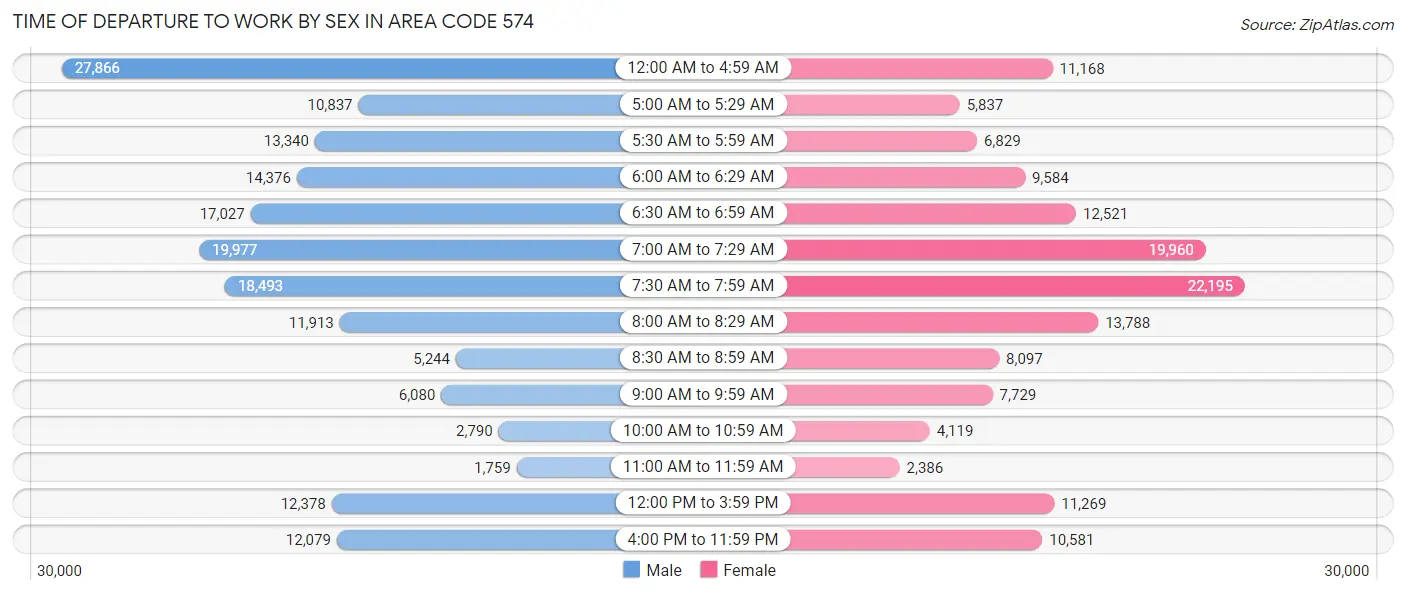
| Time of Departure | Male | Female |
| 12:00 AM to 4:59 AM | 27,866 (16.0%) | 11,168 (7.6%) |
| 5:00 AM to 5:29 AM | 10,837 (6.2%) | 5,837 (4.0%) |
| 5:30 AM to 5:59 AM | 13,340 (7.7%) | 6,829 (4.7%) |
| 6:00 AM to 6:29 AM | 14,376 (8.3%) | 9,584 (6.6%) |
| 6:30 AM to 6:59 AM | 17,027 (9.8%) | 12,521 (8.6%) |
| 7:00 AM to 7:29 AM | 19,977 (11.5%) | 19,960 (13.7%) |
| 7:30 AM to 7:59 AM | 18,493 (10.6%) | 22,195 (15.2%) |
| 8:00 AM to 8:29 AM | 11,913 (6.8%) | 13,788 (9.4%) |
| 8:30 AM to 8:59 AM | 5,244 (3.0%) | 8,097 (5.5%) |
| 9:00 AM to 9:59 AM | 6,080 (3.5%) | 7,729 (5.3%) |
| 10:00 AM to 10:59 AM | 2,790 (1.6%) | 4,119 (2.8%) |
| 11:00 AM to 11:59 AM | 1,759 (1.0%) | 2,386 (1.6%) |
| 12:00 PM to 3:59 PM | 12,378 (7.1%) | 11,269 (7.7%) |
| 4:00 PM to 11:59 PM | 12,079 (6.9%) | 10,581 (7.2%) |
| Total | 174,159 (100.0%) | 146,063 (100.0%) |
Housing Occupancy in Area Code 574
Occupancy by Ownership in Area Code 574
Of the total 275,957 dwellings in Area Code 574, owner-occupied units account for 199,180 (72.2%), while renter-occupied units make up 76,777 (27.8%).
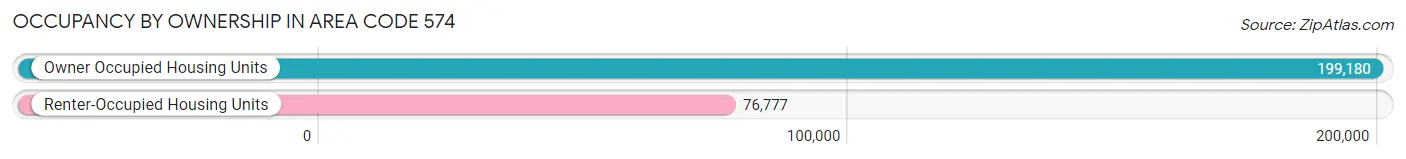
| Occupancy | # Housing Units | % Housing Units |
| Owner Occupied Housing Units | 199,180 | 72.2% |
| Renter-Occupied Housing Units | 76,777 | 27.8% |
| Total Occupied Housing Units | 275,957 | 100.0% |
Occupancy by Household Size in Area Code 574
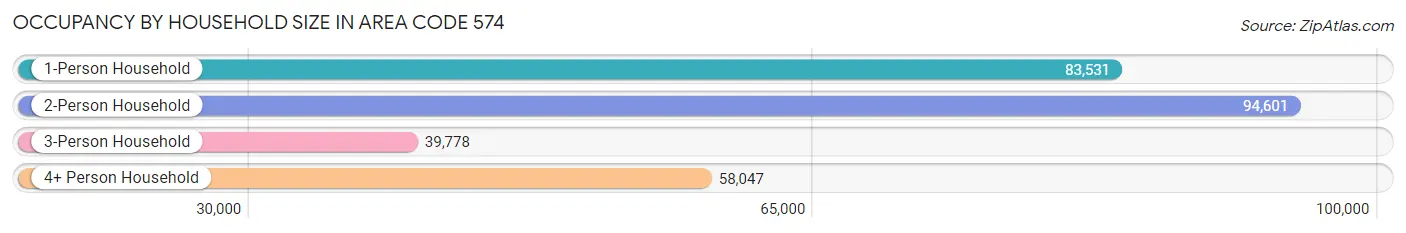
| Household Size | # Housing Units | % Housing Units |
| 1-Person Household | 83,531 | 30.3% |
| 2-Person Household | 94,601 | 34.3% |
| 3-Person Household | 39,778 | 14.4% |
| 4+ Person Household | 58,047 | 21.0% |
| Total Housing Units | 275,957 | 100.0% |
Occupancy by Ownership by Household Size in Area Code 574
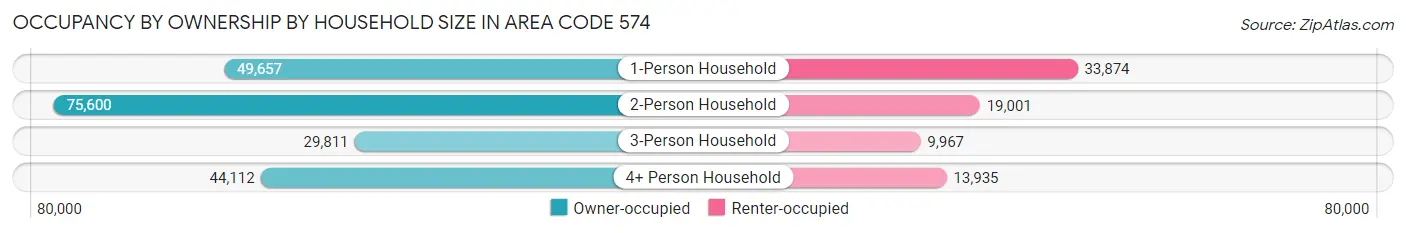
| Household Size | Owner-occupied | Renter-occupied |
| 1-Person Household | 49,657 (59.5%) | 33,874 (40.6%) |
| 2-Person Household | 75,600 (79.9%) | 19,001 (20.1%) |
| 3-Person Household | 29,811 (74.9%) | 9,967 (25.1%) |
| 4+ Person Household | 44,112 (76.0%) | 13,935 (24.0%) |
| Total Housing Units | 199,180 (72.2%) | 76,777 (27.8%) |
Occupancy by Educational Attainment in Area Code 574
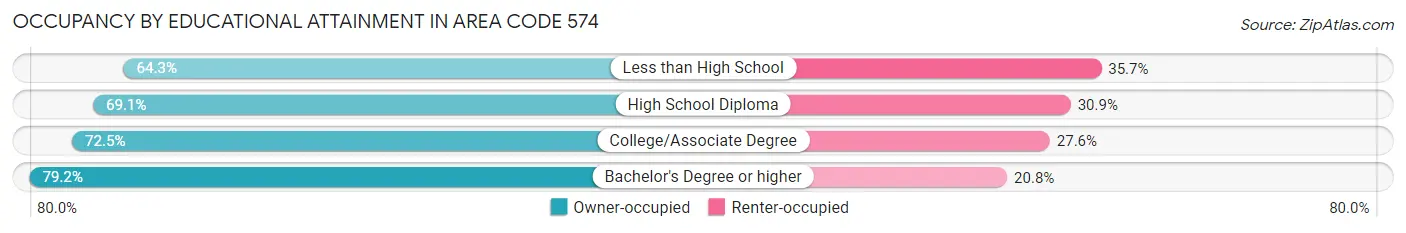
| Household Size | Owner-occupied | Renter-occupied |
| Less than High School | 19,697 (64.3%) | 10,941 (35.7%) |
| High School Diploma | 63,247 (69.1%) | 28,235 (30.9%) |
| College/Associate Degree | 60,276 (72.5%) | 22,921 (27.6%) |
| Bachelor's Degree or higher | 55,960 (79.2%) | 14,680 (20.8%) |
Occupancy by Age of Householder in Area Code 574
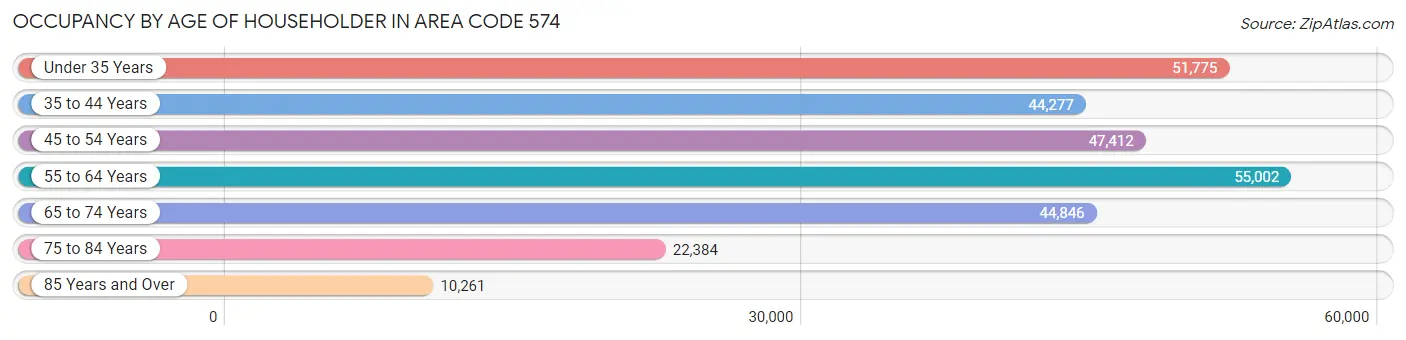
| Age Bracket | # Households | % Households |
| Under 35 Years | 51,775 | 18.8% |
| 35 to 44 Years | 44,277 | 16.0% |
| 45 to 54 Years | 47,412 | 17.2% |
| 55 to 64 Years | 55,002 | 19.9% |
| 65 to 74 Years | 44,846 | 16.3% |
| 75 to 84 Years | 22,384 | 8.1% |
| 85 Years and Over | 10,261 | 3.7% |
| Total | 275,957 | 100.0% |
Housing Finances in Area Code 574
Median Income by Occupancy in Area Code 574
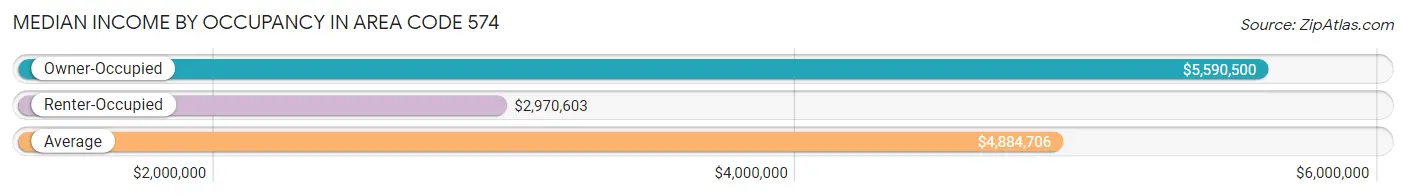
| Occupancy Type | # Households | Median Income |
| Owner-Occupied | 199,180 (72.2%) | $5,590,500 |
| Renter-Occupied | 76,777 (27.8%) | $2,970,603 |
| Average | 275,957 (100.0%) | $4,884,706 |
Occupancy by Householder Income Bracket in Area Code 574
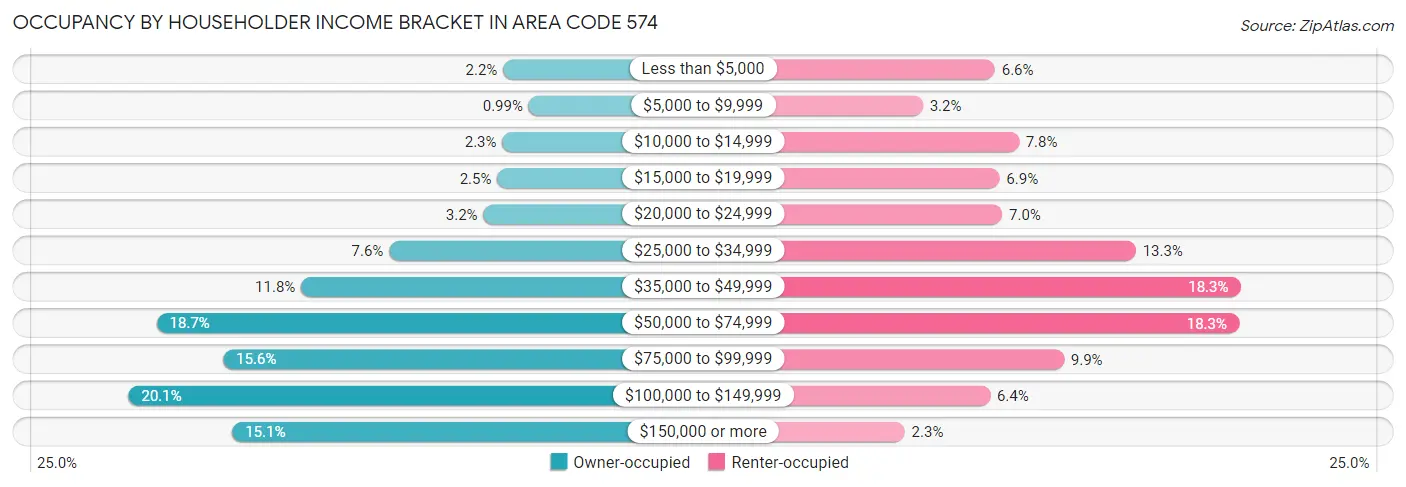
| Income Bracket | Owner-occupied | Renter-occupied |
| Less than $5,000 | 4,404 (2.2%) | 5,089 (6.6%) |
| $5,000 to $9,999 | 1,966 (1.0%) | 2,459 (3.2%) |
| $10,000 to $14,999 | 4,475 (2.2%) | 5,963 (7.8%) |
| $15,000 to $19,999 | 4,965 (2.5%) | 5,259 (6.9%) |
| $20,000 to $24,999 | 6,284 (3.2%) | 5,360 (7.0%) |
| $25,000 to $34,999 | 15,225 (7.6%) | 10,239 (13.3%) |
| $35,000 to $49,999 | 23,557 (11.8%) | 14,066 (18.3%) |
| $50,000 to $74,999 | 37,292 (18.7%) | 14,014 (18.2%) |
| $75,000 to $99,999 | 30,976 (15.5%) | 7,620 (9.9%) |
| $100,000 to $149,999 | 39,948 (20.1%) | 4,913 (6.4%) |
| $150,000 or more | 30,088 (15.1%) | 1,795 (2.3%) |
| Total | 199,180 (100.0%) | 76,777 (100.0%) |
Monthly Housing Cost Tiers in Area Code 574
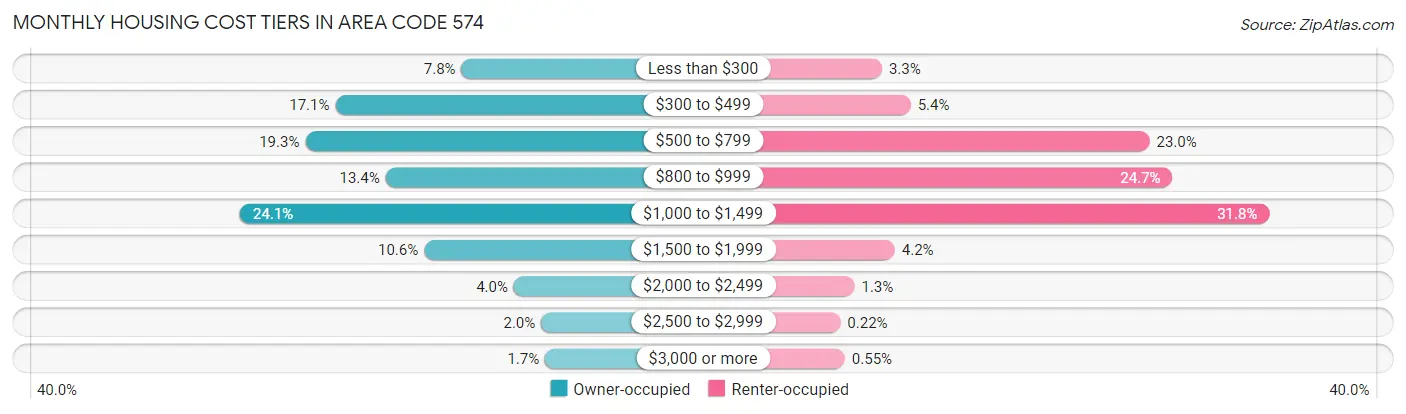
| Monthly Cost | Owner-occupied | Renter-occupied |
| Less than $300 | 15,592 (7.8%) | 2,520 (3.3%) |
| $300 to $499 | 34,090 (17.1%) | 4,145 (5.4%) |
| $500 to $799 | 38,500 (19.3%) | 17,650 (23.0%) |
| $800 to $999 | 26,724 (13.4%) | 18,942 (24.7%) |
| $1,000 to $1,499 | 48,090 (24.1%) | 24,413 (31.8%) |
| $1,500 to $1,999 | 21,068 (10.6%) | 3,246 (4.2%) |
| $2,000 to $2,499 | 7,902 (4.0%) | 970 (1.3%) |
| $2,500 to $2,999 | 3,894 (2.0%) | 166 (0.2%) |
| $3,000 or more | 3,320 (1.7%) | 421 (0.5%) |
| Total | 199,180 (100.0%) | 76,777 (100.0%) |
Physical Housing Characteristics in Area Code 574
Housing Structures in Area Code 574
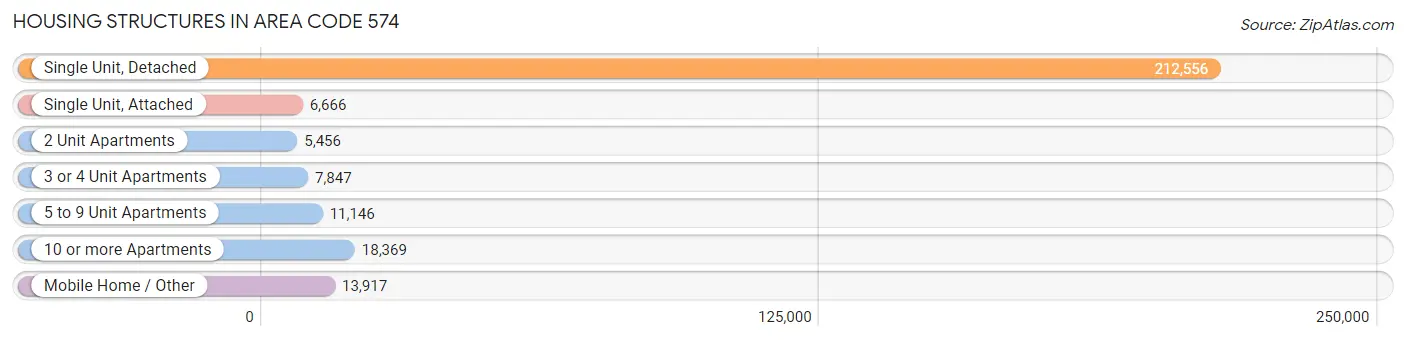
| Structure Type | # Housing Units | % Housing Units |
| Single Unit, Detached | 212,556 | 77.0% |
| Single Unit, Attached | 6,666 | 2.4% |
| 2 Unit Apartments | 5,456 | 2.0% |
| 3 or 4 Unit Apartments | 7,847 | 2.8% |
| 5 to 9 Unit Apartments | 11,146 | 4.0% |
| 10 or more Apartments | 18,369 | 6.7% |
| Mobile Home / Other | 13,917 | 5.0% |
| Total | 275,957 | 100.0% |
Housing Structures by Occupancy in Area Code 574
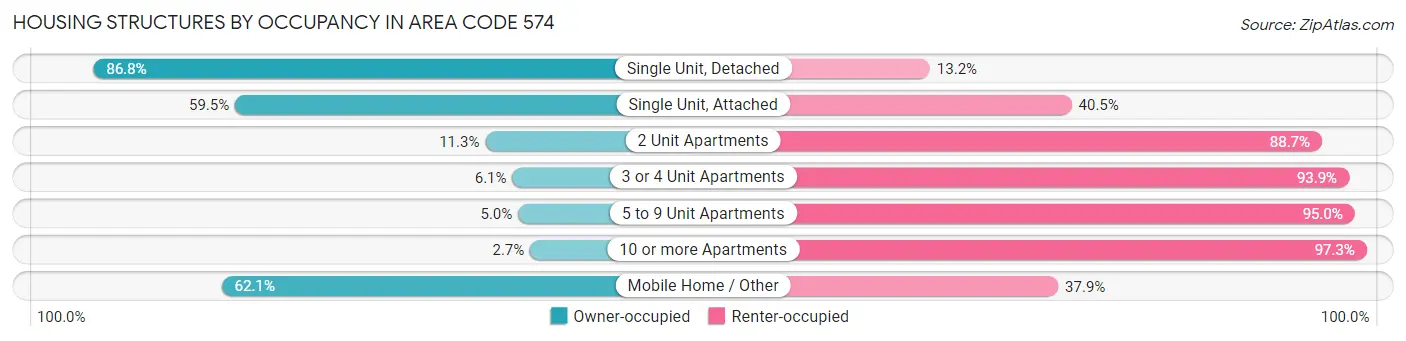
| Structure Type | Owner-occupied | Renter-occupied |
| Single Unit, Detached | 184,436 (86.8%) | 28,120 (13.2%) |
| Single Unit, Attached | 3,965 (59.5%) | 2,701 (40.5%) |
| 2 Unit Apartments | 617 (11.3%) | 4,839 (88.7%) |
| 3 or 4 Unit Apartments | 478 (6.1%) | 7,369 (93.9%) |
| 5 to 9 Unit Apartments | 555 (5.0%) | 10,591 (95.0%) |
| 10 or more Apartments | 491 (2.7%) | 17,878 (97.3%) |
| Mobile Home / Other | 8,638 (62.1%) | 5,279 (37.9%) |
| Total | 199,180 (72.2%) | 76,777 (27.8%) |
Housing Structures by Number of Rooms in Area Code 574
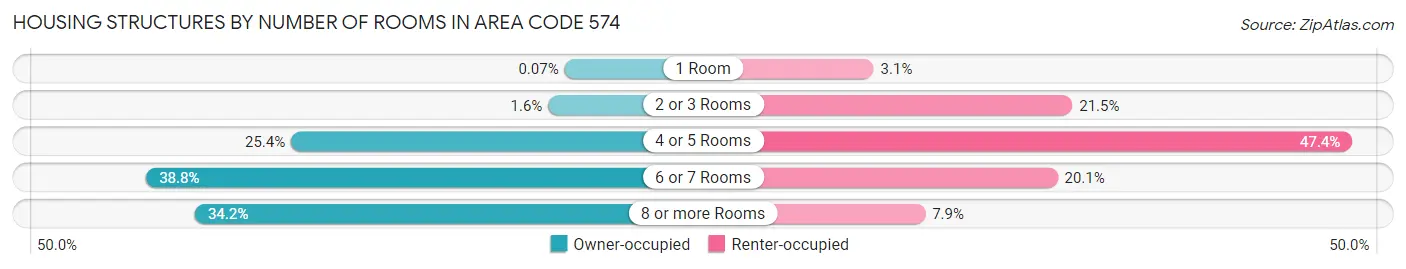
| Number of Rooms | Owner-occupied | Renter-occupied |
| 1 Room | 148 (0.1%) | 2,393 (3.1%) |
| 2 or 3 Rooms | 3,143 (1.6%) | 16,502 (21.5%) |
| 4 or 5 Rooms | 50,510 (25.4%) | 36,370 (47.4%) |
| 6 or 7 Rooms | 77,181 (38.8%) | 15,455 (20.1%) |
| 8 or more Rooms | 68,198 (34.2%) | 6,057 (7.9%) |
| Total | 199,180 (100.0%) | 76,777 (100.0%) |
Housing Structure by Heating Type in Area Code 574
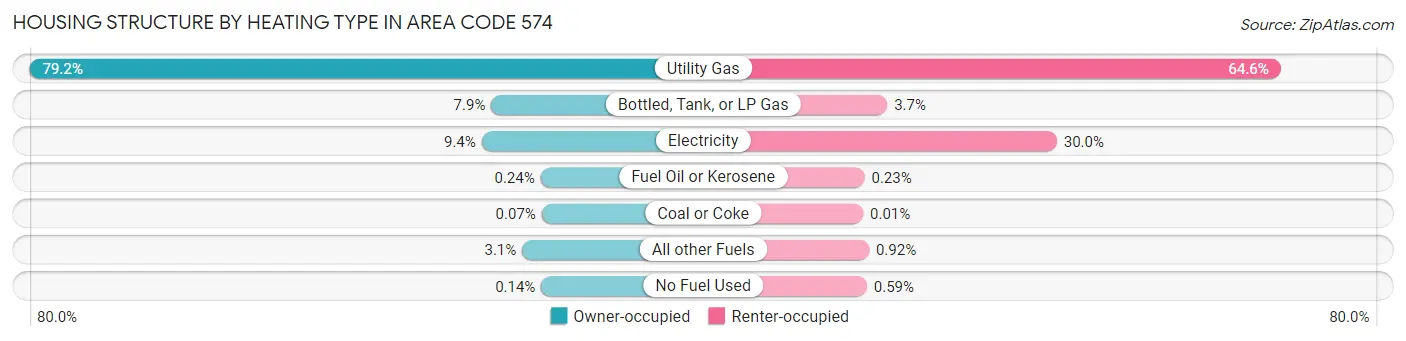
| Heating Type | Owner-occupied | Renter-occupied |
| Utility Gas | 157,824 (79.2%) | 49,556 (64.5%) |
| Bottled, Tank, or LP Gas | 15,662 (7.9%) | 2,875 (3.7%) |
| Electricity | 18,630 (9.3%) | 22,992 (29.9%) |
| Fuel Oil or Kerosene | 476 (0.2%) | 180 (0.2%) |
| Coal or Coke | 142 (0.1%) | 11 (0.0%) |
| All other Fuels | 6,158 (3.1%) | 707 (0.9%) |
| No Fuel Used | 288 (0.1%) | 456 (0.6%) |
| Total | 199,180 (100.0%) | 76,777 (100.0%) |
Household Vehicle Usage in Area Code 574
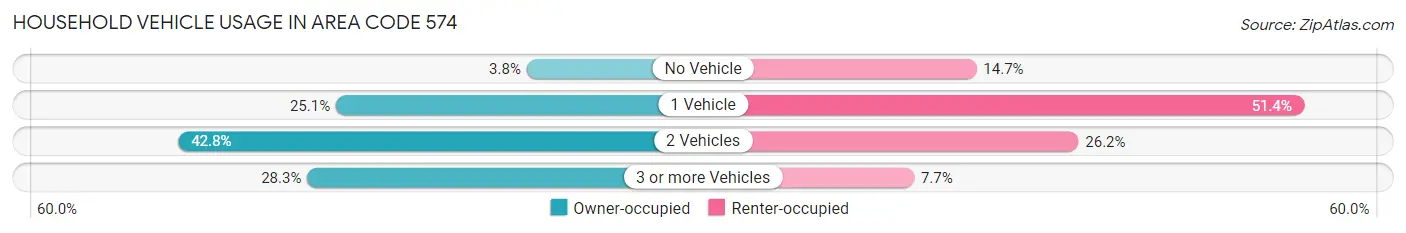
| Vehicles per Household | Owner-occupied | Renter-occupied |
| No Vehicle | 7,474 (3.7%) | 11,311 (14.7%) |
| 1 Vehicle | 50,043 (25.1%) | 39,457 (51.4%) |
| 2 Vehicles | 85,221 (42.8%) | 20,074 (26.2%) |
| 3 or more Vehicles | 56,442 (28.3%) | 5,935 (7.7%) |
| Total | 199,180 (100.0%) | 76,777 (100.0%) |
Real Estate & Mortgages in Area Code 574
Real Estate and Mortgage Overview in Area Code 574
| Characteristic | Without Mortgage | With Mortgage |
| Housing Units | 76,611 | 122,569 |
| Median Property Value | $11,455,700 | $12,819,000 |
| Median Household Income | $4,279,685 | $21,506 |
| Monthly Housing Costs | $33,560 | $3,197 |
| Real Estate Taxes | $84,954 | $2,936 |
Property Value by Mortgage Status in Area Code 574
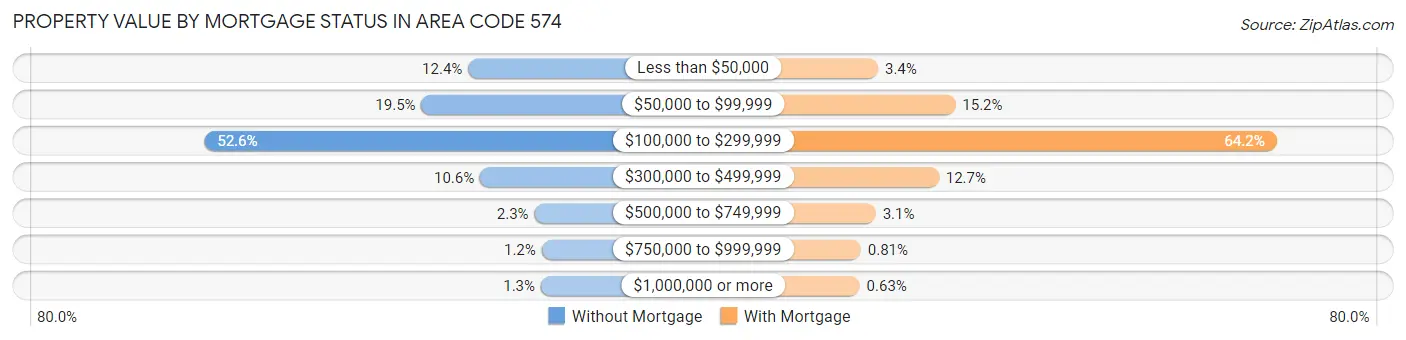
| Property Value | Without Mortgage | With Mortgage |
| Less than $50,000 | 9,508 (12.4%) | 4,202 (3.4%) |
| $50,000 to $99,999 | 14,960 (19.5%) | 18,647 (15.2%) |
| $100,000 to $299,999 | 40,305 (52.6%) | 78,646 (64.2%) |
| $300,000 to $499,999 | 8,118 (10.6%) | 15,539 (12.7%) |
| $500,000 to $749,999 | 1,766 (2.3%) | 3,769 (3.1%) |
| $750,000 to $999,999 | 934 (1.2%) | 993 (0.8%) |
| $1,000,000 or more | 1,020 (1.3%) | 773 (0.6%) |
| Total | 76,611 (100.0%) | 122,569 (100.0%) |
Household Income by Mortgage Status in Area Code 574
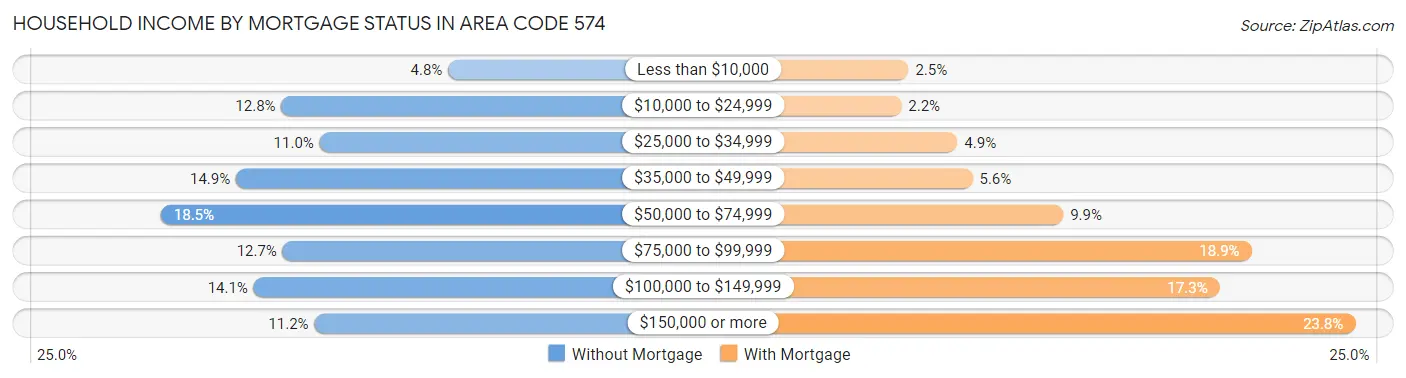
| Household Income | Without Mortgage | With Mortgage |
| Less than $10,000 | 3,703 (4.8%) | 3,088 (2.5%) |
| $10,000 to $24,999 | 9,783 (12.8%) | 2,667 (2.2%) |
| $25,000 to $34,999 | 8,392 (11.0%) | 5,941 (4.9%) |
| $35,000 to $49,999 | 11,436 (14.9%) | 6,833 (5.6%) |
| $50,000 to $74,999 | 14,184 (18.5%) | 12,121 (9.9%) |
| $75,000 to $99,999 | 9,738 (12.7%) | 23,108 (18.9%) |
| $100,000 to $149,999 | 10,793 (14.1%) | 21,238 (17.3%) |
| $150,000 or more | 8,582 (11.2%) | 29,155 (23.8%) |
| Total | 76,611 (100.0%) | 122,569 (100.0%) |
Property Value to Household Income Ratio in Area Code 574
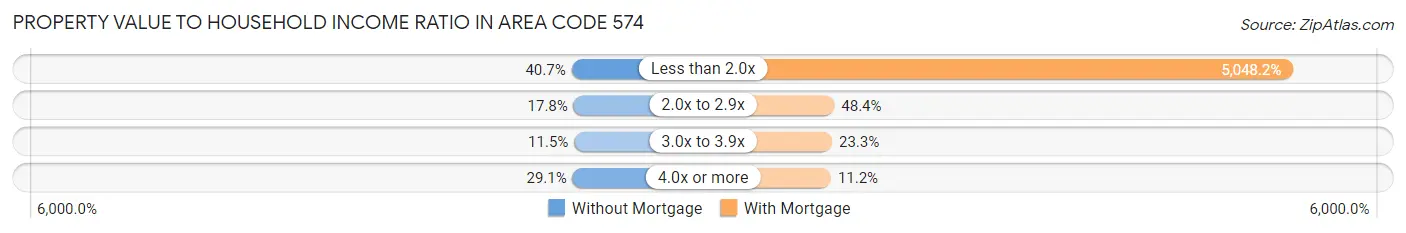
| Value-to-Income Ratio | Without Mortgage | With Mortgage |
| Less than 2.0x | 31,151 (40.7%) | 6,187,484 (5,048.2%) |
| 2.0x to 2.9x | 13,604 (17.8%) | 59,378 (48.4%) |
| 3.0x to 3.9x | 8,833 (11.5%) | 28,553 (23.3%) |
| 4.0x or more | 22,265 (29.1%) | 13,672 (11.2%) |
| Total | 76,611 (100.0%) | 122,569 (100.0%) |
Real Estate Taxes by Mortgage Status in Area Code 574
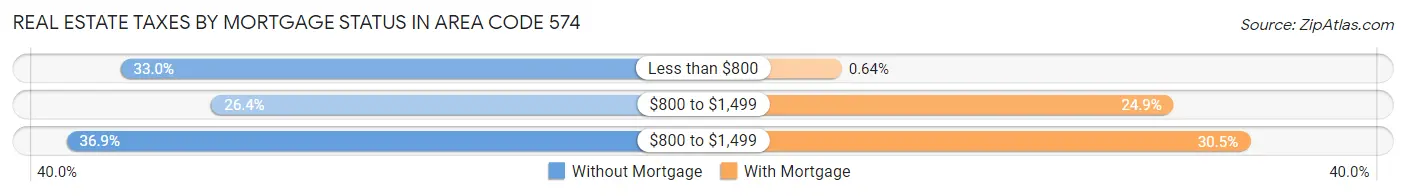
| Property Taxes | Without Mortgage | With Mortgage |
| Less than $800 | 25,264 (33.0%) | 785 (0.6%) |
| $800 to $1,499 | 20,187 (26.4%) | 30,498 (24.9%) |
| $800 to $1,499 | 28,291 (36.9%) | 37,340 (30.5%) |
| Total | 76,611 (100.0%) | 122,569 (100.0%) |
Health & Disability in Area Code 574
Health Insurance Coverage by Age in Area Code 574
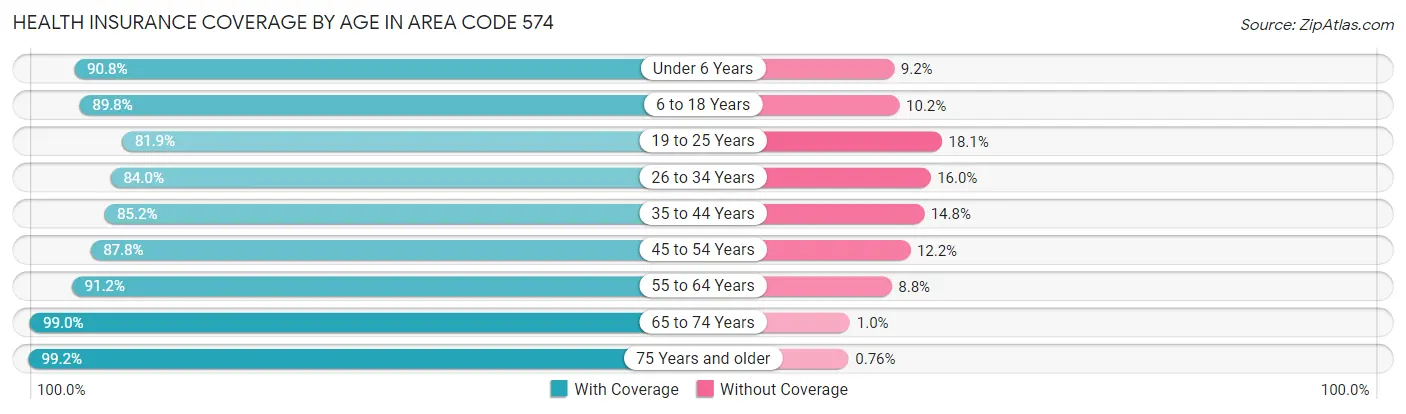
| Age Bracket | With Coverage | Without Coverage |
| Under 6 Years | 51,386 (90.8%) | 5,230 (9.2%) |
| 6 to 18 Years | 118,145 (89.8%) | 13,454 (10.2%) |
| 19 to 25 Years | 56,885 (81.9%) | 12,601 (18.1%) |
| 26 to 34 Years | 68,798 (84.0%) | 13,122 (16.0%) |
| 35 to 44 Years | 72,682 (85.2%) | 12,632 (14.8%) |
| 45 to 54 Years | 75,754 (87.8%) | 10,569 (12.2%) |
| 55 to 64 Years | 84,601 (91.2%) | 8,133 (8.8%) |
| 65 to 74 Years | 70,126 (99.0%) | 739 (1.0%) |
| 75 Years and older | 47,378 (99.2%) | 363 (0.8%) |
| Total | 645,755 (89.4%) | 76,843 (10.6%) |
Health Insurance Coverage by Citizenship Status in Area Code 574
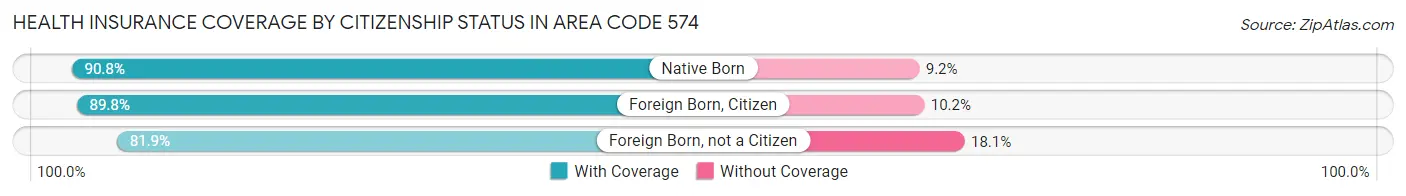
| Citizenship Status | With Coverage | Without Coverage |
| Native Born | 51,386 (90.8%) | 5,230 (9.2%) |
| Foreign Born, Citizen | 118,145 (89.8%) | 13,454 (10.2%) |
| Foreign Born, not a Citizen | 56,885 (81.9%) | 12,601 (18.1%) |
Health Insurance Coverage by Household Income in Area Code 574
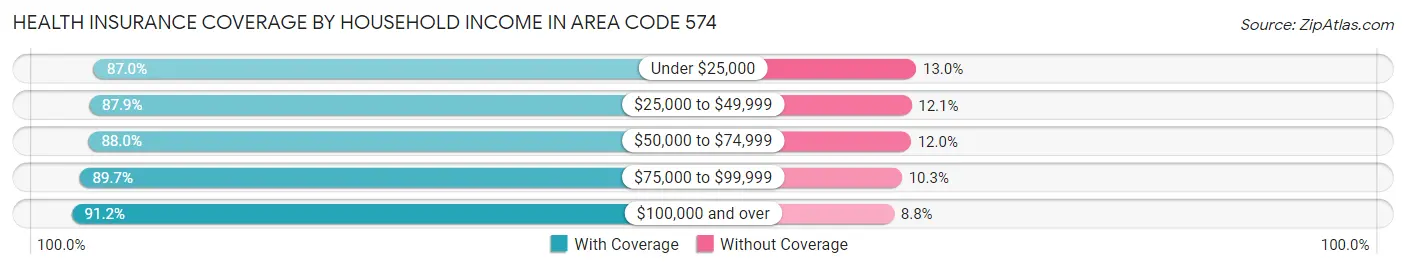
| Household Income | With Coverage | Without Coverage |
| Under $25,000 | 68,193 (87.0%) | 10,167 (13.0%) |
| $25,000 to $49,999 | 116,136 (87.9%) | 15,975 (12.1%) |
| $50,000 to $74,999 | 114,901 (88.0%) | 15,641 (12.0%) |
| $75,000 to $99,999 | 105,591 (89.7%) | 12,112 (10.3%) |
| $100,000 and over | 230,386 (91.2%) | 22,290 (8.8%) |
Public vs Private Health Insurance Coverage by Age in Area Code 574
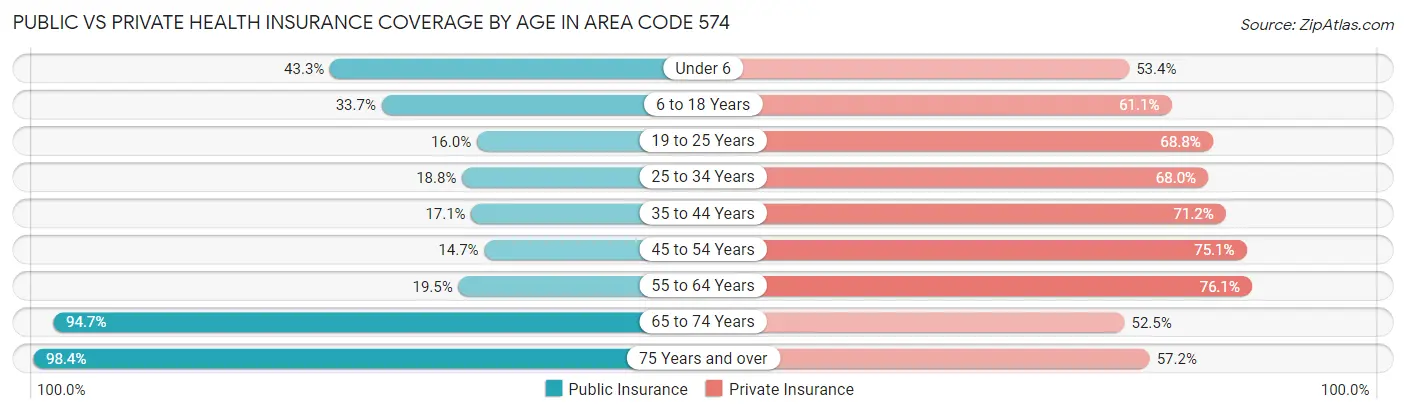
| Age Bracket | Public Insurance | Private Insurance |
| Under 6 | 24,503 (43.3%) | 30,205 (53.3%) |
| 6 to 18 Years | 44,359 (33.7%) | 80,460 (61.1%) |
| 19 to 25 Years | 11,141 (16.0%) | 47,829 (68.8%) |
| 25 to 34 Years | 15,379 (18.8%) | 55,667 (67.9%) |
| 35 to 44 Years | 14,552 (17.1%) | 60,772 (71.2%) |
| 45 to 54 Years | 12,650 (14.6%) | 64,824 (75.1%) |
| 55 to 64 Years | 18,041 (19.5%) | 70,568 (76.1%) |
| 65 to 74 Years | 67,119 (94.7%) | 37,191 (52.5%) |
| 75 Years and over | 46,991 (98.4%) | 27,291 (57.2%) |
| Total | 254,735 (35.2%) | 474,807 (65.7%) |
Disability Status by Sex by Age in Area Code 574
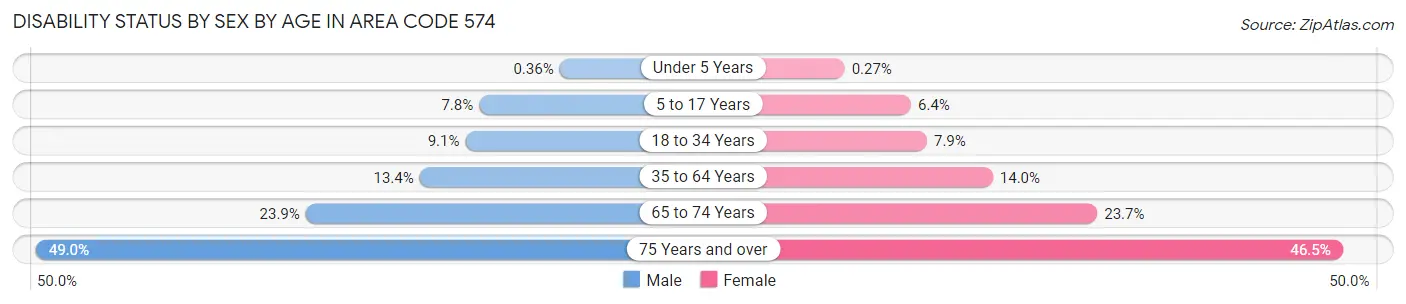
| Age Bracket | Male | Female |
| Under 5 Years | 86 (0.4%) | 62 (0.3%) |
| 5 to 17 Years | 5,239 (7.8%) | 4,115 (6.4%) |
| 18 to 34 Years | 7,422 (9.1%) | 6,363 (7.9%) |
| 35 to 64 Years | 17,612 (13.4%) | 18,569 (14.0%) |
| 65 to 74 Years | 8,211 (23.9%) | 8,664 (23.7%) |
| 75 Years and over | 9,575 (49.0%) | 13,097 (46.5%) |
Disability Class by Sex by Age in Area Code 574
Disability Class: Hearing Difficulty
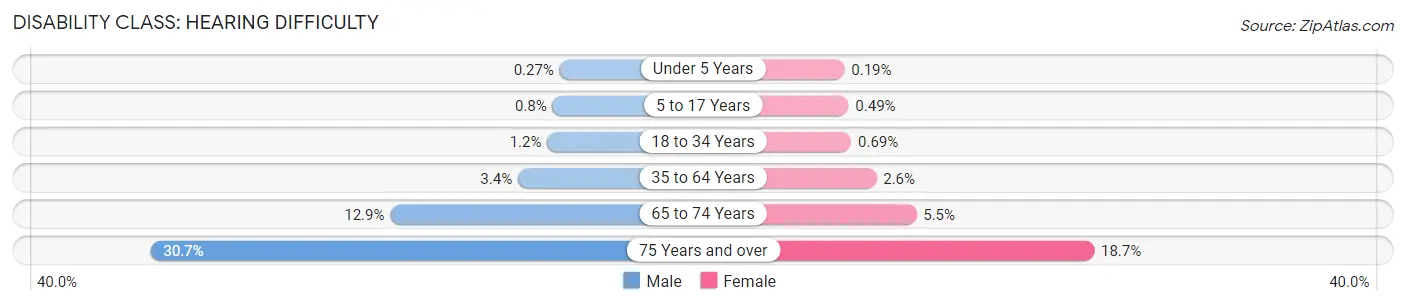
| Age Bracket | Male | Female |
| Under 5 Years | 64 (0.3%) | 44 (0.2%) |
| 5 to 17 Years | 538 (0.8%) | 316 (0.5%) |
| 18 to 34 Years | 970 (1.2%) | 558 (0.7%) |
| 35 to 64 Years | 4,451 (3.4%) | 3,389 (2.6%) |
| 65 to 74 Years | 4,410 (12.9%) | 2,020 (5.5%) |
| 75 Years and over | 5,995 (30.7%) | 5,279 (18.7%) |
Disability Class: Vision Difficulty
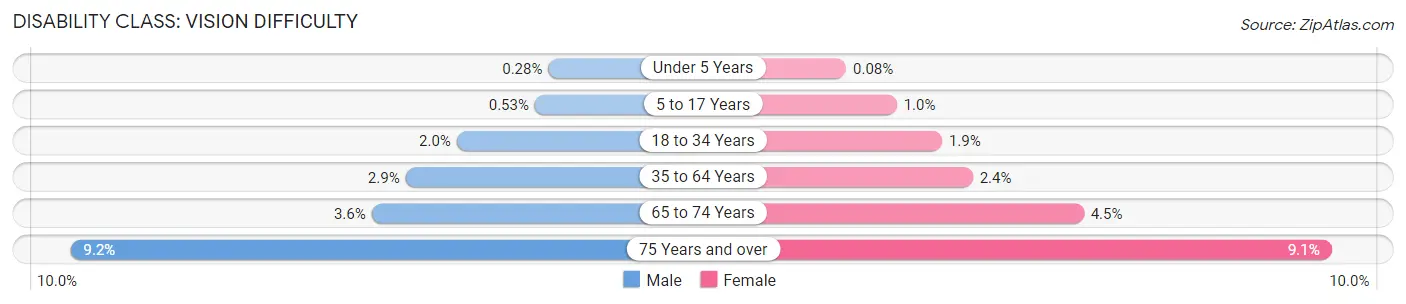
| Age Bracket | Male | Female |
| Under 5 Years | 67 (0.3%) | 18 (0.1%) |
| 5 to 17 Years | 358 (0.5%) | 650 (1.0%) |
| 18 to 34 Years | 1,618 (2.0%) | 1,496 (1.9%) |
| 35 to 64 Years | 3,862 (2.9%) | 3,212 (2.4%) |
| 65 to 74 Years | 1,221 (3.6%) | 1,641 (4.5%) |
| 75 Years and over | 1,789 (9.1%) | 2,563 (9.1%) |
Disability Class: Cognitive Difficulty
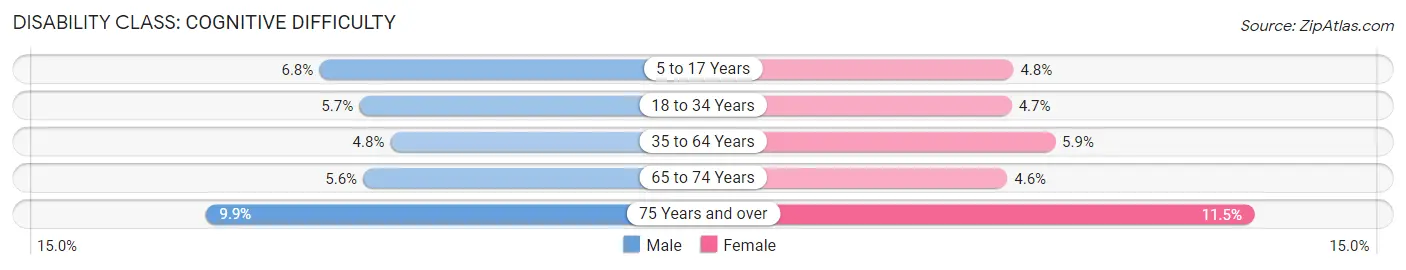
| Age Bracket | Male | Female |
| 5 to 17 Years | 4,556 (6.8%) | 3,059 (4.8%) |
| 18 to 34 Years | 4,643 (5.7%) | 3,807 (4.7%) |
| 35 to 64 Years | 6,361 (4.8%) | 7,862 (5.9%) |
| 65 to 74 Years | 1,914 (5.6%) | 1,685 (4.6%) |
| 75 Years and over | 1,944 (9.9%) | 3,233 (11.5%) |
Disability Class: Ambulatory Difficulty
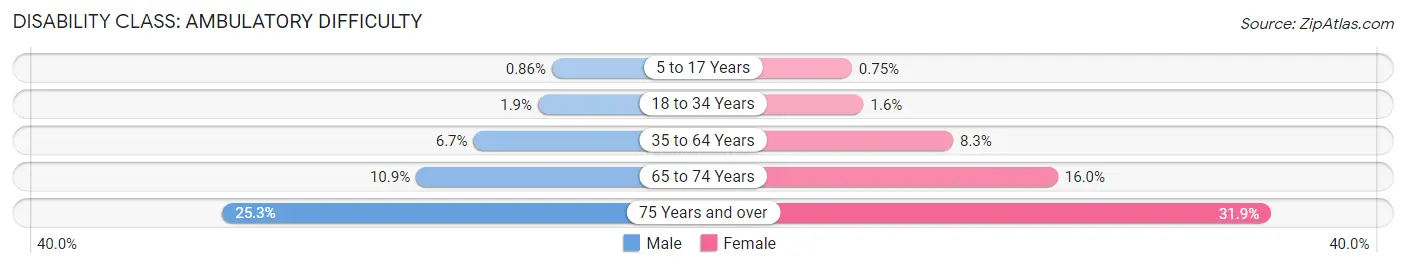
| Age Bracket | Male | Female |
| 5 to 17 Years | 577 (0.9%) | 480 (0.7%) |
| 18 to 34 Years | 1,539 (1.9%) | 1,307 (1.6%) |
| 35 to 64 Years | 8,808 (6.7%) | 10,942 (8.3%) |
| 65 to 74 Years | 3,756 (10.9%) | 5,860 (16.0%) |
| 75 Years and over | 4,951 (25.3%) | 8,983 (31.9%) |
Disability Class: Self-Care Difficulty
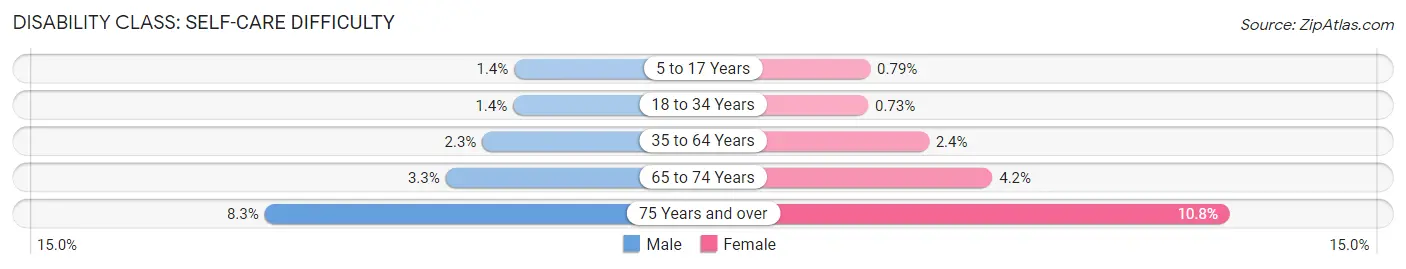
| Age Bracket | Male | Female |
| 5 to 17 Years | 917 (1.4%) | 504 (0.8%) |
| 18 to 34 Years | 1,142 (1.4%) | 589 (0.7%) |
| 35 to 64 Years | 2,983 (2.3%) | 3,210 (2.4%) |
| 65 to 74 Years | 1,125 (3.3%) | 1,532 (4.2%) |
| 75 Years and over | 1,627 (8.3%) | 3,045 (10.8%) |
Technology Access in Area Code 574
Computing Device Access in Area Code 574
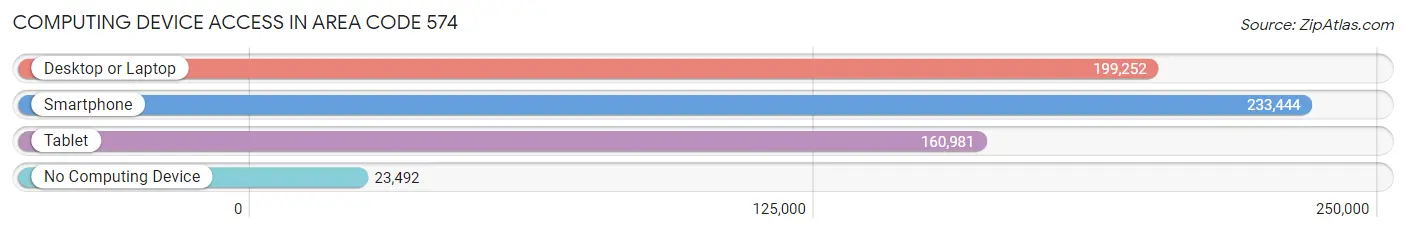
| Device Type | # Households | % Households |
| Desktop or Laptop | 199,252 | 72.2% |
| Smartphone | 233,444 | 84.6% |
| Tablet | 160,981 | 58.3% |
| No Computing Device | 23,492 | 8.5% |
| Total | 275,957 | 100.0% |
Internet Access in Area Code 574
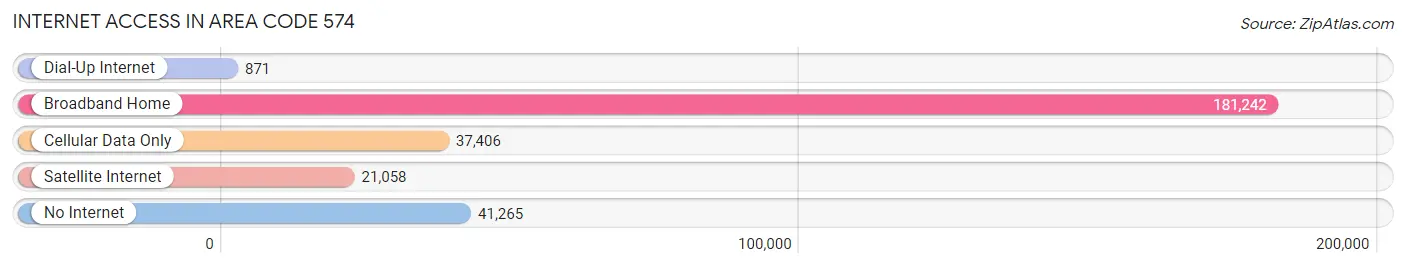
| Internet Type | # Households | % Households |
| Dial-Up Internet | 871 | 0.3% |
| Broadband Home | 181,242 | 65.7% |
| Cellular Data Only | 37,406 | 13.6% |
| Satellite Internet | 21,058 | 7.6% |
| No Internet | 41,265 | 14.9% |
| Total | 275,957 | 100.0% |
Area Code 574 Summary
Geography
Area code 574 is located in the northern part of Indiana, covering the cities of South Bend, Elkhart, Mishawaka, and Goshen. It also covers parts of LaPorte, St. Joseph, Marshall, and Starke counties.
Social
Area code 574 is home to a diverse population of people from all walks of life. The area is known for its strong sense of community and its vibrant culture. The area is home to a variety of festivals, events, and activities that bring people together.
Economics
Area code 574 is home to a strong economy, with a variety of industries and businesses. The area is home to several large employers, including the University of Notre Dame, Memorial Hospital, and the South Bend International Airport. The area also has a thriving small business sector, with many local businesses providing goods and services to the community.
Demographics
Area code 574 is home to a diverse population, with a median age of 36. The area is home to a variety of ethnicities, including African American, Hispanic, and Asian. The area also has a high rate of educational attainment, with over half of the population having a bachelor's degree or higher.
Common Questions
What is Per Capita Income in Area Code 574?
Per Capita income in Area Code 574 is $32,444.
What is the Median Family Income in Area Code 574?
Median Family Income in Area Code 574 is $80,034.
What is the Median Household income in Area Code 574?
Median Household Income in Area Code 574 is $65,129.
What is Income or Wage Gap in Area Code 574?
Income or Wage Gap in Area Code 574 is 37.1%.
Women in Area Code 574 earn 62.9 cents for every dollar earned by a man.
What is Family Income Deficit in Area Code 574?
Family Income Deficit in Area Code 574 is $10,473.
Families that are below poverty line in Area Code 574 earn $10,473 less on average than the poverty threshold level.
What is Inequality or Gini Index in Area Code 574?
Inequality or Gini Index in Area Code 574 is 31.68.
What is the Total Population of Area Code 574?
Total Population of Area Code 574 is 730,035.
What is the Total Male Population of Area Code 574?
Total Male Population of Area Code 574 is 362,456.
What is the Total Female Population of Area Code 574?
Total Female Population of Area Code 574 is 367,579.
What is the Ratio of Males per 100 Females in Area Code 574?
There are 98.61 Males per 100 Females in Area Code 574.
What is the Ratio of Females per 100 Males in Area Code 574?
There are 101.41 Females per 100 Males in Area Code 574.
What is the Median Population Age in Area Code 574?
Median Population Age in Area Code 574 is 40.7 Years.
What is the Average Family Size in Area Code 574
Average Family Size in Area Code 574 is 3.2 People.
What is the Average Household Size in Area Code 574
Average Household Size in Area Code 574 is 2.6 People.
How Large is the Labor Force in Area Code 574?
There are 361,395 People in the Labor Forcein in Area Code 574.
What is the Percentage of People in the Labor Force in Area Code 574?
63.1% of People are in the Labor Force in Area Code 574.
What is the Unemployment Rate in Area Code 574?
Unemployment Rate in Area Code 574 is 4.2%.