Elkhart County, IN Map & Demographics
Elkhart County Map
Elkhart County Overview
$30,708
PER CAPITA INCOME
$78,757
AVG FAMILY INCOME
$63,978
AVG HOUSEHOLD INCOME
38.1%
WAGE / INCOME GAP [ % ]
61.9¢/ $1
WAGE / INCOME GAP [ $ ]
$12,410
FAMILY INCOME DEFICIT
0.44
INEQUALITY / GINI INDEX
206,841
TOTAL POPULATION
102,604
MALE POPULATION
104,237
FEMALE POPULATION
98.43
MALES / 100 FEMALES
101.59
FEMALES / 100 MALES
35.6
MEDIAN AGE
3.5
AVG FAMILY SIZE
2.8
AVG HOUSEHOLD SIZE
102,844
LABOR FORCE [ PEOPLE ]
65.6%
PERCENT IN LABOR FORCE
3.8%
UNEMPLOYMENT RATE
Elkhart County Area Codes
Income in Elkhart County
Income Overview in Elkhart County
Per Capita Income in Elkhart County is $30,708, while median incomes of families and households are $78,757 and $63,978 respectively.
| Characteristic | Number | Measure |
| Per Capita Income | 206,841 | $30,708 |
| Median Family Income | 48,447 | $78,757 |
| Mean Family Income | 48,447 | $98,263 |
| Median Household Income | 71,751 | $63,978 |
| Mean Household Income | 71,751 | $83,810 |
| Income Deficit | 48,447 | $12,410 |
| Wage / Income Gap (%) | 206,841 | 38.09% |
| Wage / Income Gap ($) | 206,841 | 61.91¢ per $1 |
| Gini / Inequality Index | 206,841 | 0.44 |
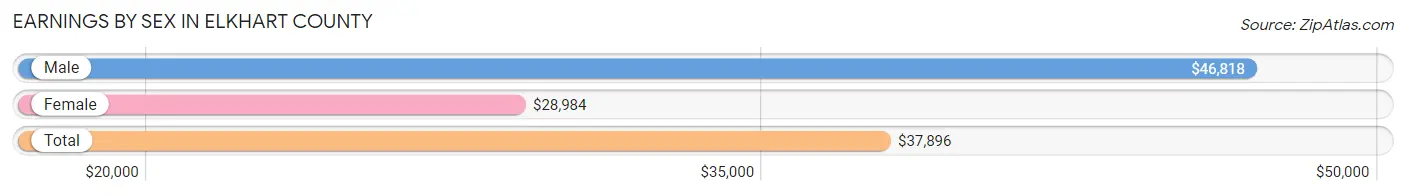
Earnings by Sex in Elkhart County
Average Earnings in Elkhart County are $37,896, $46,818 for men and $28,984 for women, a difference of 38.1%.
| Sex | Number | Average Earnings |
| Male | 58,271 (54.3%) | $46,818 |
| Female | 49,126 (45.7%) | $28,984 |
| Total | 107,397 (100.0%) | $37,896 |
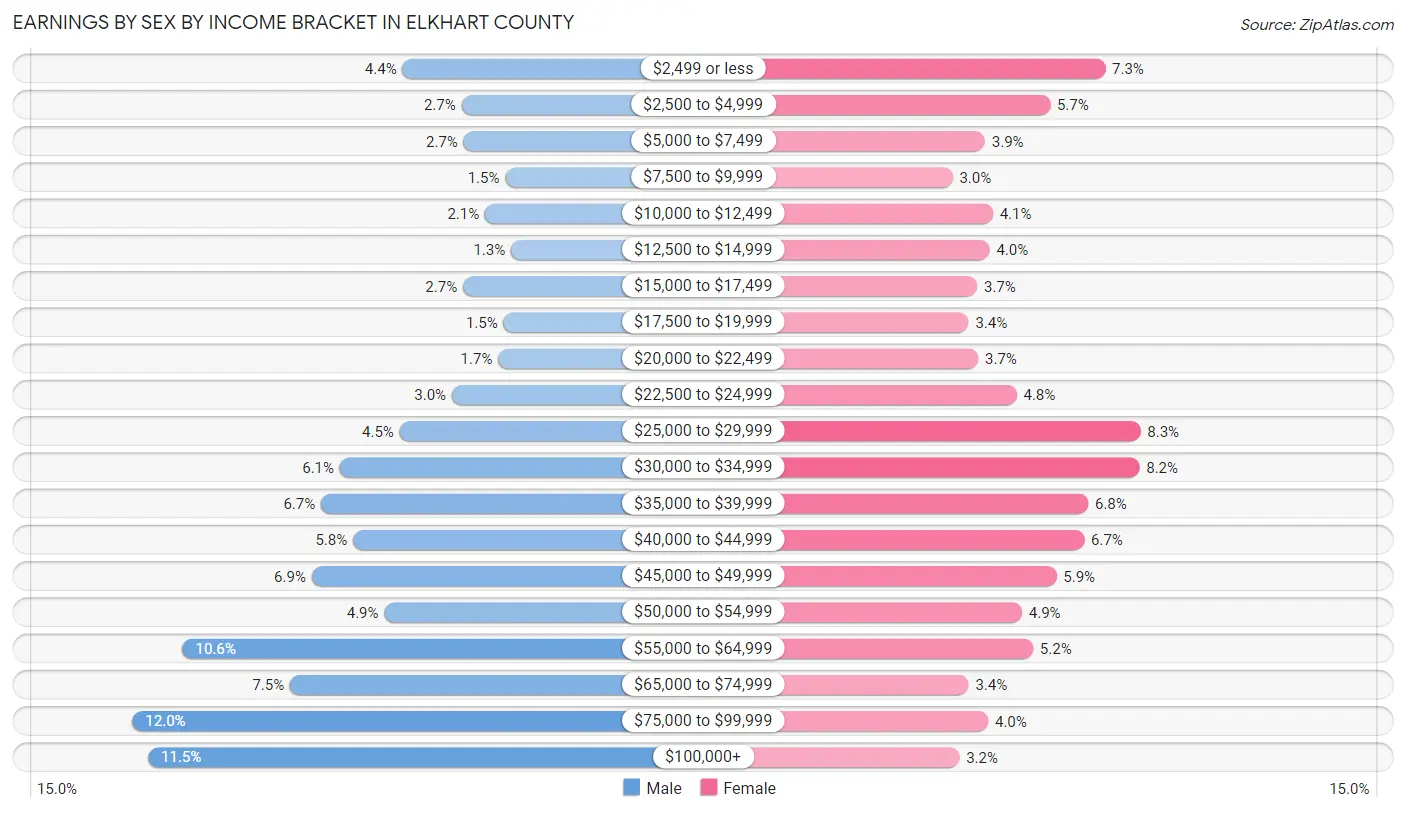
Earnings by Sex by Income Bracket in Elkhart County
The most common earnings brackets in Elkhart County are $75,000 to $99,999 for men (6,973 | 12.0%) and $25,000 to $29,999 for women (4,052 | 8.3%).
| Income | Male | Female |
| $2,499 or less | 2,555 (4.4%) | 3,569 (7.3%) |
| $2,500 to $4,999 | 1,586 (2.7%) | 2,807 (5.7%) |
| $5,000 to $7,499 | 1,551 (2.7%) | 1,907 (3.9%) |
| $7,500 to $9,999 | 866 (1.5%) | 1,457 (3.0%) |
| $10,000 to $12,499 | 1,200 (2.1%) | 2,013 (4.1%) |
| $12,500 to $14,999 | 776 (1.3%) | 1,971 (4.0%) |
| $15,000 to $17,499 | 1,561 (2.7%) | 1,800 (3.7%) |
| $17,500 to $19,999 | 895 (1.5%) | 1,679 (3.4%) |
| $20,000 to $22,499 | 986 (1.7%) | 1,814 (3.7%) |
| $22,500 to $24,999 | 1,743 (3.0%) | 2,344 (4.8%) |
| $25,000 to $29,999 | 2,599 (4.5%) | 4,052 (8.3%) |
| $30,000 to $34,999 | 3,575 (6.1%) | 4,040 (8.2%) |
| $35,000 to $39,999 | 3,889 (6.7%) | 3,331 (6.8%) |
| $40,000 to $44,999 | 3,362 (5.8%) | 3,279 (6.7%) |
| $45,000 to $49,999 | 4,036 (6.9%) | 2,893 (5.9%) |
| $50,000 to $54,999 | 2,852 (4.9%) | 2,419 (4.9%) |
| $55,000 to $64,999 | 6,154 (10.6%) | 2,567 (5.2%) |
| $65,000 to $74,999 | 4,393 (7.5%) | 1,682 (3.4%) |
| $75,000 to $99,999 | 6,973 (12.0%) | 1,950 (4.0%) |
| $100,000+ | 6,719 (11.5%) | 1,552 (3.2%) |
| Total | 58,271 (100.0%) | 49,126 (100.0%) |
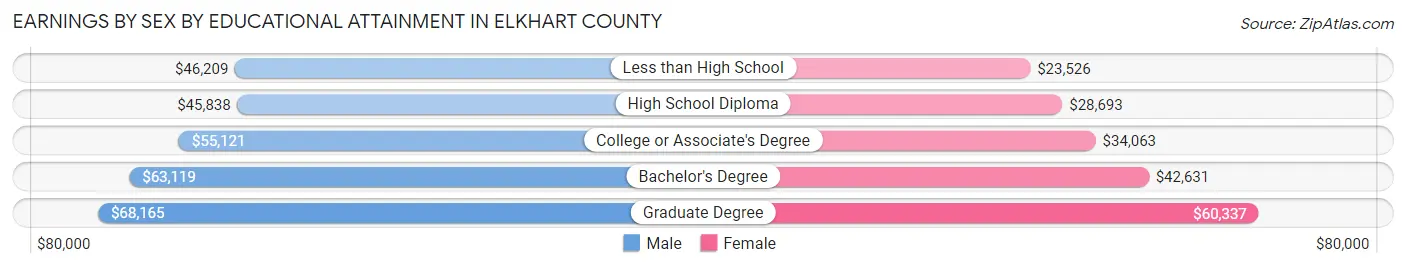
Earnings by Sex by Educational Attainment in Elkhart County
Average earnings in Elkhart County are $51,665 for men and $33,615 for women, a difference of 34.9%. Men with an educational attainment of graduate degree enjoy the highest average annual earnings of $68,165, while those with high school diploma education earn the least with $45,838. Women with an educational attainment of graduate degree earn the most with the average annual earnings of $60,337, while those with less than high school education have the smallest earnings of $23,526.
| Educational Attainment | Male Income | Female Income |
| Less than High School | $46,209 | $23,526 |
| High School Diploma | $45,838 | $28,693 |
| College or Associate's Degree | $55,121 | $34,063 |
| Bachelor's Degree | $63,119 | $42,631 |
| Graduate Degree | $68,165 | $60,337 |
| Total | $51,665 | $33,615 |
Family Income in Elkhart County
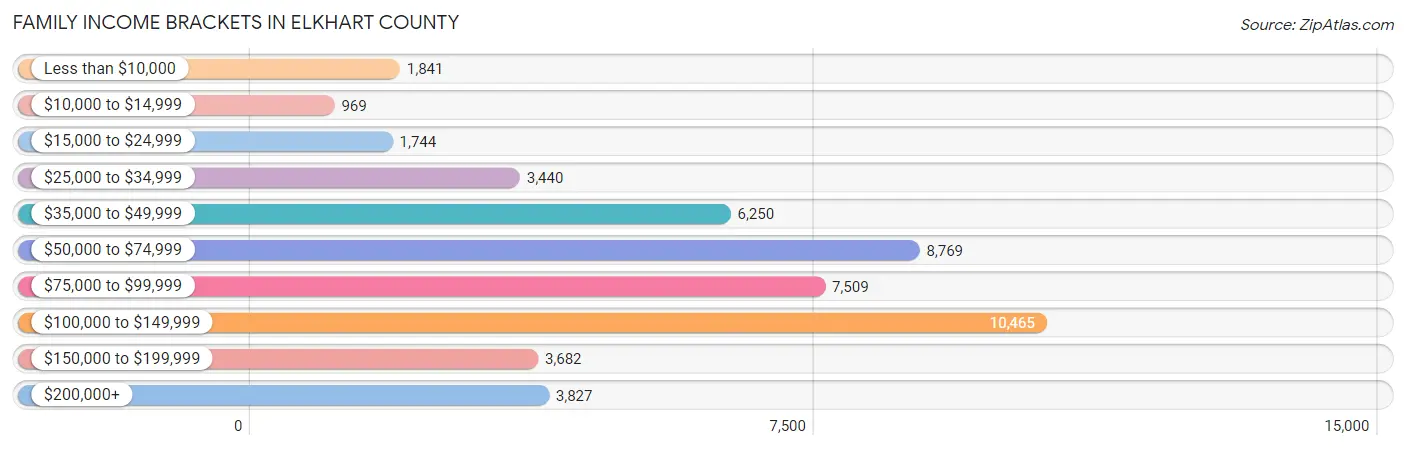
Family Income Brackets in Elkhart County
According to the Elkhart County family income data, there are 10,465 families falling into the $100,000 to $149,999 income range, which is the most common income bracket and makes up 21.6% of all families. Conversely, the $10,000 to $14,999 income bracket is the least frequent group with only 969 families (2.0%) belonging to this category.
| Income Bracket | # Families | % Families |
| Less than $10,000 | 1,841 | 3.8% |
| $10,000 to $14,999 | 969 | 2.0% |
| $15,000 to $24,999 | 1,744 | 3.6% |
| $25,000 to $34,999 | 3,440 | 7.1% |
| $35,000 to $49,999 | 6,250 | 12.9% |
| $50,000 to $74,999 | 8,769 | 18.1% |
| $75,000 to $99,999 | 7,509 | 15.5% |
| $100,000 to $149,999 | 10,465 | 21.6% |
| $150,000 to $199,999 | 3,682 | 7.6% |
| $200,000+ | 3,827 | 7.9% |
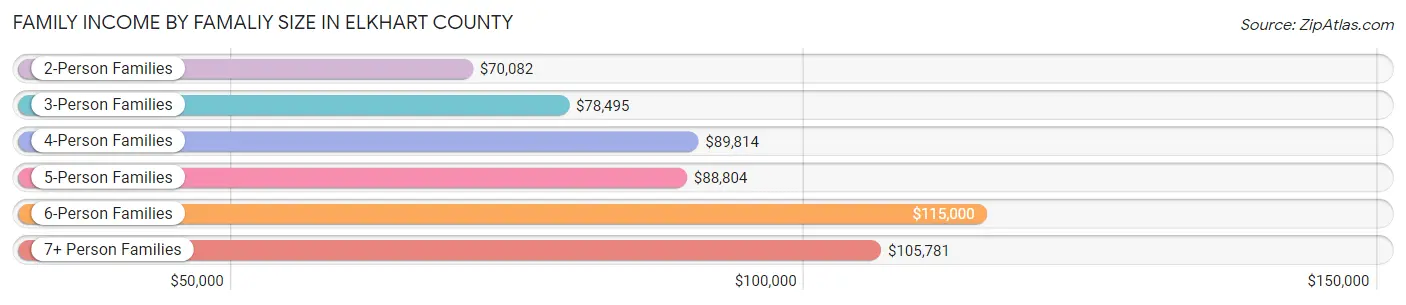
Family Income by Famaliy Size in Elkhart County
6-person families (1,774 | 3.7%) account for the highest median family income in Elkhart County with $115,000 per family, while 2-person families (22,648 | 46.8%) have the highest median income of $35,041 per family member.
| Income Bracket | # Families | Median Income |
| 2-Person Families | 22,648 (46.8%) | $70,082 |
| 3-Person Families | 10,627 (21.9%) | $78,495 |
| 4-Person Families | 7,855 (16.2%) | $89,814 |
| 5-Person Families | 4,322 (8.9%) | $88,804 |
| 6-Person Families | 1,774 (3.7%) | $115,000 |
| 7+ Person Families | 1,221 (2.5%) | $105,781 |
| Total | 48,447 (100.0%) | $78,757 |
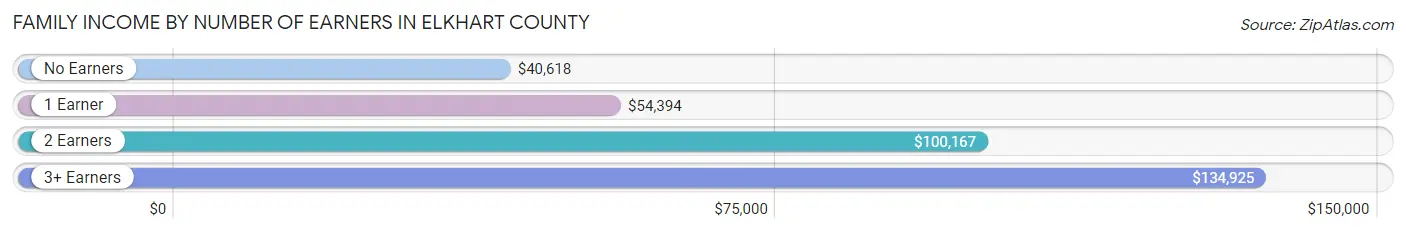
Family Income by Number of Earners in Elkhart County
The median family income in Elkhart County is $78,757, with families comprising 3+ earners (6,531) having the highest median family income of $134,925, while families with no earners (6,712) have the lowest median family income of $40,618, accounting for 13.5% and 13.9% of families, respectively.
| Number of Earners | # Families | Median Income |
| No Earners | 6,712 (13.9%) | $40,618 |
| 1 Earner | 15,154 (31.3%) | $54,394 |
| 2 Earners | 20,050 (41.4%) | $100,167 |
| 3+ Earners | 6,531 (13.5%) | $134,925 |
| Total | 48,447 (100.0%) | $78,757 |
Household Income in Elkhart County
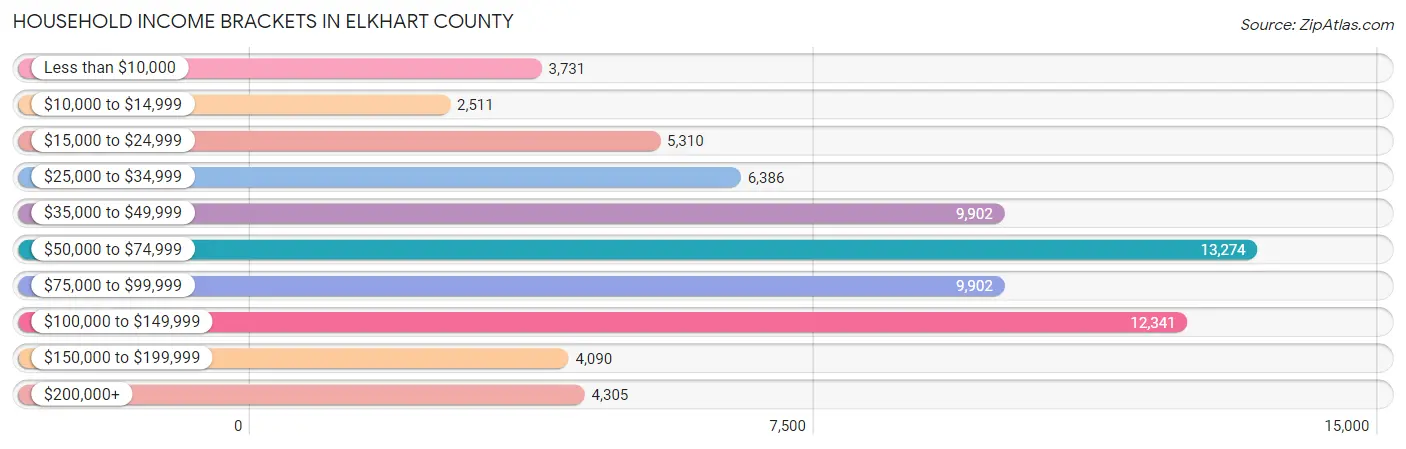
Household Income Brackets in Elkhart County
With 13,274 households falling in the category, the $50,000 to $74,999 income range is the most frequent in Elkhart County, accounting for 18.5% of all households. In contrast, only 2,511 households (3.5%) fall into the $10,000 to $14,999 income bracket, making it the least populous group.
| Income Bracket | # Households | % Households |
| Less than $10,000 | 3,731 | 5.2% |
| $10,000 to $14,999 | 2,511 | 3.5% |
| $15,000 to $24,999 | 5,310 | 7.4% |
| $25,000 to $34,999 | 6,386 | 8.9% |
| $35,000 to $49,999 | 9,902 | 13.8% |
| $50,000 to $74,999 | 13,274 | 18.5% |
| $75,000 to $99,999 | 9,902 | 13.8% |
| $100,000 to $149,999 | 12,341 | 17.2% |
| $150,000 to $199,999 | 4,090 | 5.7% |
| $200,000+ | 4,305 | 6.0% |
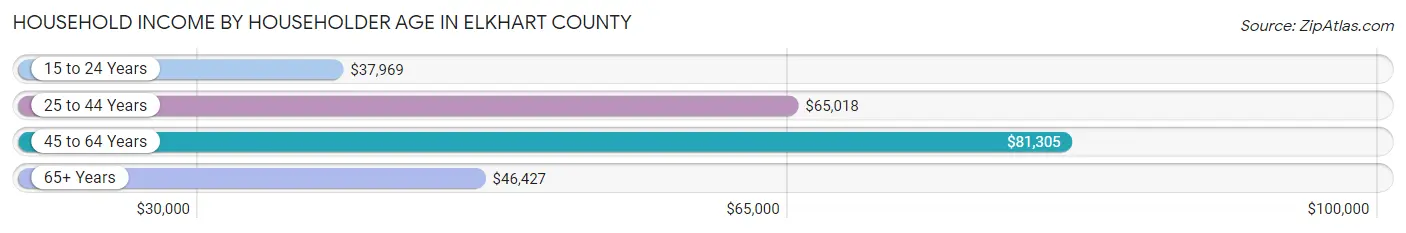
Household Income by Householder Age in Elkhart County
The median household income in Elkhart County is $63,978, with the highest median household income of $81,305 found in the 45 to 64 years age bracket for the primary householder. A total of 27,324 households (38.1%) fall into this category. Meanwhile, the 15 to 24 years age bracket for the primary householder has the lowest median household income of $37,969, with 3,072 households (4.3%) in this group.
| Income Bracket | # Households | Median Income |
| 15 to 24 Years | 3,072 (4.3%) | $37,969 |
| 25 to 44 Years | 22,990 (32.0%) | $65,018 |
| 45 to 64 Years | 27,324 (38.1%) | $81,305 |
| 65+ Years | 18,365 (25.6%) | $46,427 |
| Total | 71,751 (100.0%) | $63,978 |
Poverty in Elkhart County
Income Below Poverty by Sex and Age in Elkhart County
With 11.1% poverty level for males and 13.0% for females among the residents of Elkhart County, 6 to 11 year old males and 6 to 11 year old females are the most vulnerable to poverty, with 2,079 males (23.0%) and 1,671 females (19.4%) in their respective age groups living below the poverty level.
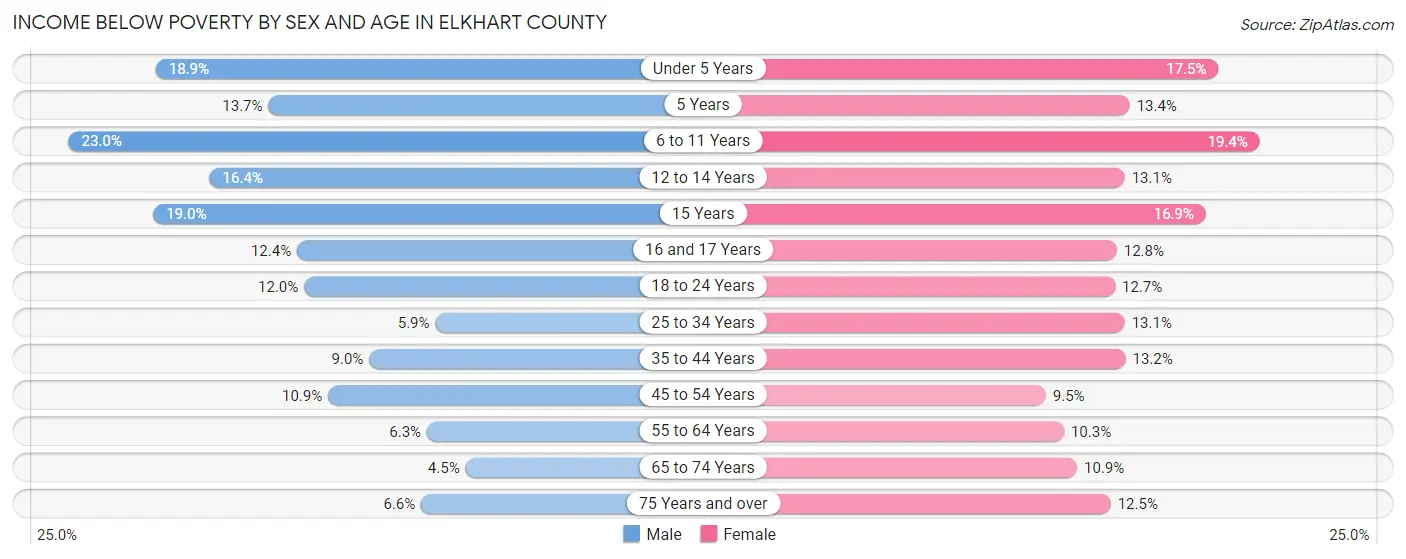
| Age Bracket | Male | Female |
| Under 5 Years | 1,438 (18.9%) | 1,255 (17.5%) |
| 5 Years | 216 (13.7%) | 170 (13.4%) |
| 6 to 11 Years | 2,079 (23.0%) | 1,671 (19.4%) |
| 12 to 14 Years | 847 (16.4%) | 732 (13.1%) |
| 15 Years | 359 (19.0%) | 223 (16.9%) |
| 16 and 17 Years | 365 (12.4%) | 446 (12.8%) |
| 18 to 24 Years | 1,151 (12.0%) | 1,152 (12.7%) |
| 25 to 34 Years | 772 (5.9%) | 1,688 (13.1%) |
| 35 to 44 Years | 1,098 (9.0%) | 1,614 (13.2%) |
| 45 to 54 Years | 1,343 (10.9%) | 1,164 (9.5%) |
| 55 to 64 Years | 758 (6.3%) | 1,241 (10.3%) |
| 65 to 74 Years | 387 (4.5%) | 1,020 (10.9%) |
| 75 Years and over | 323 (6.6%) | 915 (12.5%) |
| Total | 11,136 (11.1%) | 13,291 (13.0%) |
Income Above Poverty by Sex and Age in Elkhart County
According to the poverty statistics in Elkhart County, males aged 65 to 74 years and females aged 45 to 54 years are the age groups that are most secure financially, with 95.5% of males and 90.5% of females in these age groups living above the poverty line.
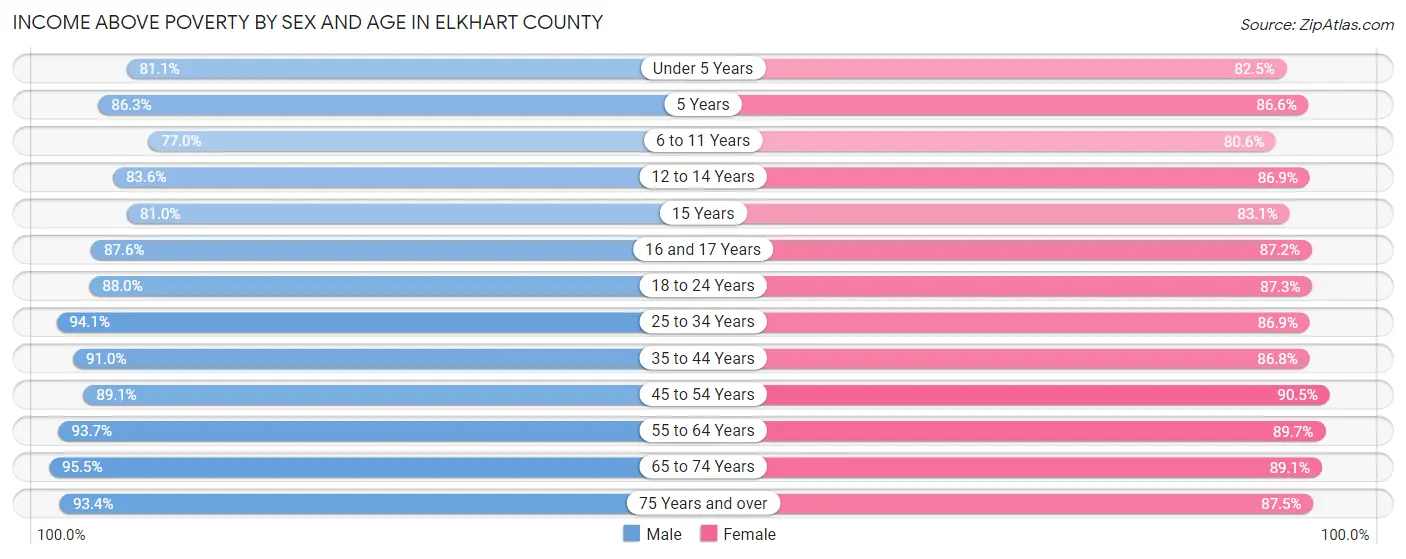
| Age Bracket | Male | Female |
| Under 5 Years | 6,165 (81.1%) | 5,927 (82.5%) |
| 5 Years | 1,362 (86.3%) | 1,102 (86.6%) |
| 6 to 11 Years | 6,975 (77.0%) | 6,945 (80.6%) |
| 12 to 14 Years | 4,313 (83.6%) | 4,845 (86.9%) |
| 15 Years | 1,527 (81.0%) | 1,097 (83.1%) |
| 16 and 17 Years | 2,588 (87.6%) | 3,050 (87.2%) |
| 18 to 24 Years | 8,413 (88.0%) | 7,931 (87.3%) |
| 25 to 34 Years | 12,219 (94.1%) | 11,168 (86.9%) |
| 35 to 44 Years | 11,092 (91.0%) | 10,645 (86.8%) |
| 45 to 54 Years | 10,953 (89.1%) | 11,131 (90.5%) |
| 55 to 64 Years | 11,221 (93.7%) | 10,795 (89.7%) |
| 65 to 74 Years | 8,129 (95.5%) | 8,320 (89.1%) |
| 75 Years and over | 4,570 (93.4%) | 6,419 (87.5%) |
| Total | 89,527 (88.9%) | 89,375 (87.1%) |
Income Below Poverty Among Married-Couple Families in Elkhart County
The poverty statistics for married-couple families in Elkhart County show that 4.2% or 1,515 of the total 36,473 families live below the poverty line. Families with 5 or more children have the highest poverty rate of 16.5%, comprising of 87 families. On the other hand, families with no children have the lowest poverty rate of 2.5%, which includes 542 families.
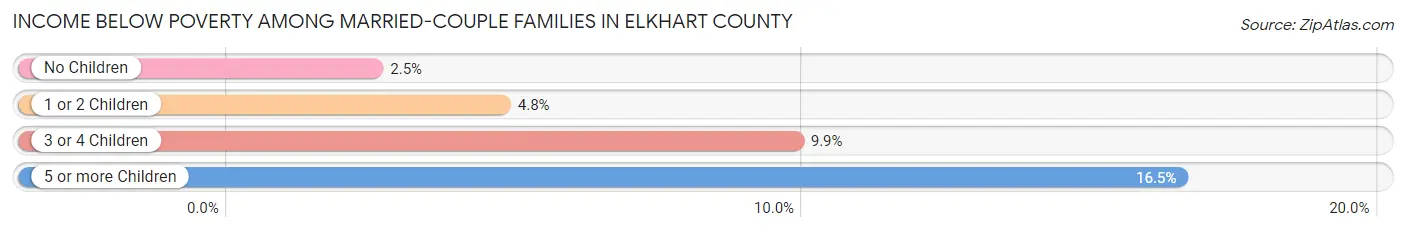
| Children | Above Poverty | Below Poverty |
| No Children | 20,863 (97.5%) | 542 (2.5%) |
| 1 or 2 Children | 10,204 (95.3%) | 509 (4.8%) |
| 3 or 4 Children | 3,452 (90.1%) | 377 (9.9%) |
| 5 or more Children | 439 (83.5%) | 87 (16.5%) |
| Total | 34,958 (95.9%) | 1,515 (4.2%) |
Income Below Poverty Among Single-Parent Households in Elkhart County
According to the poverty data in Elkhart County, 11.5% or 353 single-father households and 28.4% or 2,534 single-mother households are living below the poverty line. Among single-father households, those with 3 or 4 children have the highest poverty rate, with 107 households (36.4%) experiencing poverty. Likewise, among single-mother households, those with 5 or more children have the highest poverty rate, with 34 households (68.0%) falling below the poverty line.
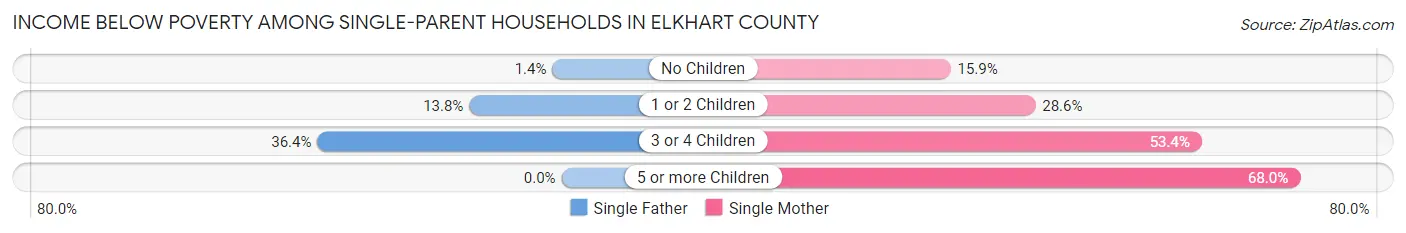
| Children | Single Father | Single Mother |
| No Children | 15 (1.4%) | 428 (15.9%) |
| 1 or 2 Children | 231 (13.8%) | 1,404 (28.5%) |
| 3 or 4 Children | 107 (36.4%) | 668 (53.3%) |
| 5 or more Children | 0 (0.0%) | 34 (68.0%) |
| Total | 353 (11.5%) | 2,534 (28.4%) |
Income Below Poverty Among Married-Couple vs Single-Parent Households in Elkhart County
The poverty data for Elkhart County shows that 1,515 of the married-couple family households (4.2%) and 2,887 of the single-parent households (24.1%) are living below the poverty level. Within the married-couple family households, those with 5 or more children have the highest poverty rate, with 87 households (16.5%) falling below the poverty line. Among the single-parent households, those with 5 or more children have the highest poverty rate, with 34 household (68.0%) living below poverty.
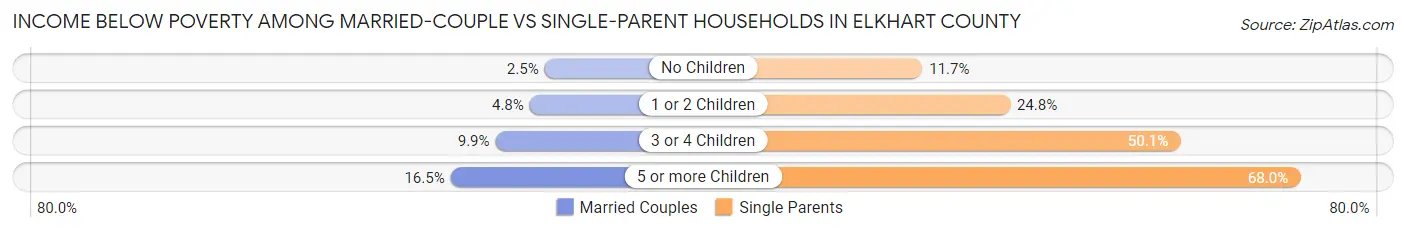
| Children | Married-Couple Families | Single-Parent Households |
| No Children | 542 (2.5%) | 443 (11.7%) |
| 1 or 2 Children | 509 (4.8%) | 1,635 (24.8%) |
| 3 or 4 Children | 377 (9.9%) | 775 (50.1%) |
| 5 or more Children | 87 (16.5%) | 34 (68.0%) |
| Total | 1,515 (4.2%) | 2,887 (24.1%) |
Race in Elkhart County
The most populous races in Elkhart County are White / Caucasian (164,733 | 79.6%), Hispanic or Latino (35,681 | 17.2%), and Two or more Races (14,807 | 7.2%).
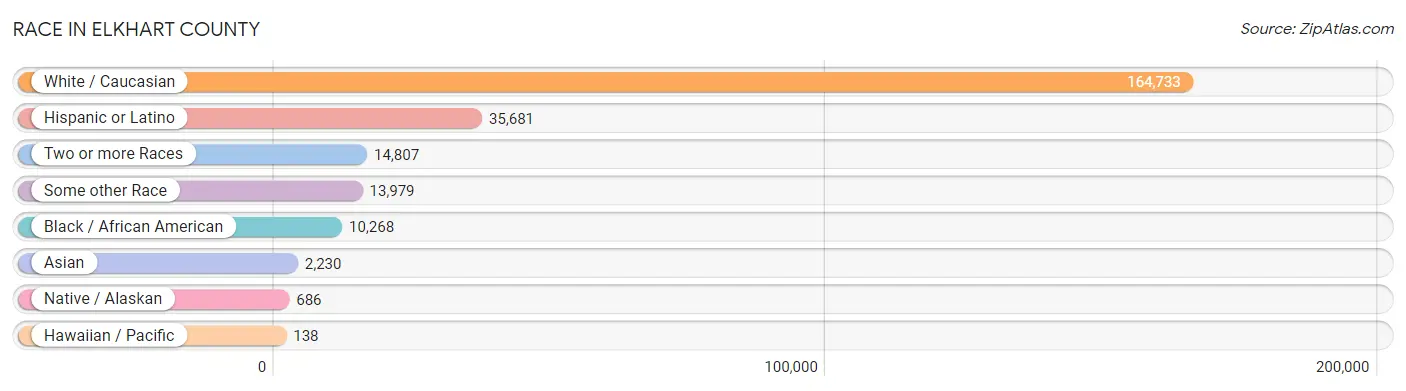
| Race | # Population | % Population |
| Asian | 2,230 | 1.1% |
| Black / African American | 10,268 | 5.0% |
| Hawaiian / Pacific | 138 | 0.1% |
| Hispanic or Latino | 35,681 | 17.2% |
| Native / Alaskan | 686 | 0.3% |
| White / Caucasian | 164,733 | 79.6% |
| Two or more Races | 14,807 | 7.2% |
| Some other Race | 13,979 | 6.8% |
| Total | 206,841 | 100.0% |
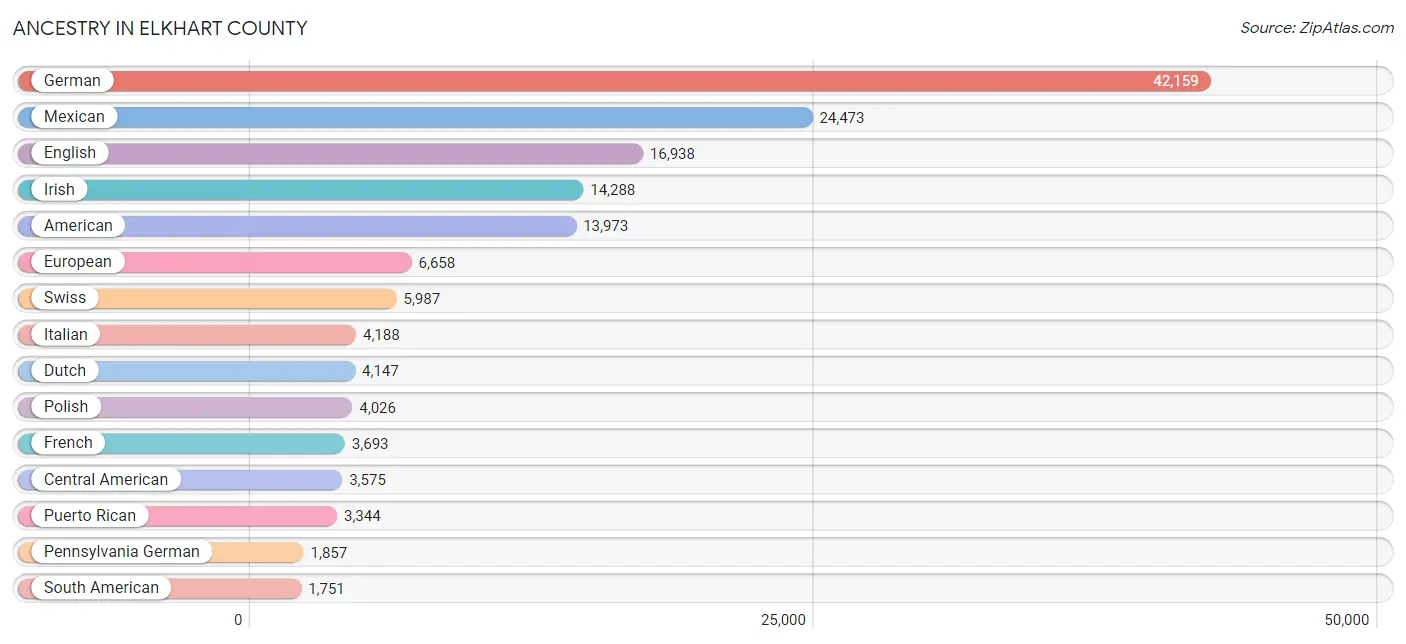
Ancestry in Elkhart County
The most populous ancestries reported in Elkhart County are German (42,159 | 20.4%), Mexican (24,473 | 11.8%), English (16,938 | 8.2%), Irish (14,288 | 6.9%), and American (13,973 | 6.8%), together accounting for 54.1% of all Elkhart County residents.
| Ancestry | # Population | % Population |
| African | 1,089 | 0.5% |
| Alsatian | 7 | 0.0% |
| American | 13,973 | 6.8% |
| Arab | 400 | 0.2% |
| Argentinean | 21 | 0.0% |
| Armenian | 11 | 0.0% |
| Australian | 7 | 0.0% |
| Austrian | 325 | 0.2% |
| Bahamian | 27 | 0.0% |
| Basque | 28 | 0.0% |
| Belgian | 476 | 0.2% |
| Belizean | 30 | 0.0% |
| Bhutanese | 126 | 0.1% |
| Blackfeet | 227 | 0.1% |
| Bolivian | 87 | 0.0% |
| Brazilian | 315 | 0.2% |
| British | 860 | 0.4% |
| Bulgarian | 16 | 0.0% |
| Burmese | 466 | 0.2% |
| Cambodian | 30 | 0.0% |
| Canadian | 297 | 0.1% |
| Celtic | 56 | 0.0% |
| Central American | 3,575 | 1.7% |
| Central American Indian | 27 | 0.0% |
| Cherokee | 888 | 0.4% |
| Chilean | 32 | 0.0% |
| Choctaw | 31 | 0.0% |
| Colombian | 231 | 0.1% |
| Comanche | 6 | 0.0% |
| Costa Rican | 15 | 0.0% |
| Cree | 4 | 0.0% |
| Creek | 6 | 0.0% |
| Croatian | 92 | 0.0% |
| Cuban | 363 | 0.2% |
| Czech | 321 | 0.2% |
| Czechoslovakian | 83 | 0.0% |
| Danish | 220 | 0.1% |
| Delaware | 11 | 0.0% |
| Dominican | 244 | 0.1% |
| Dutch | 4,147 | 2.0% |
| Eastern European | 256 | 0.1% |
| Ecuadorian | 170 | 0.1% |
| Egyptian | 9 | 0.0% |
| English | 16,938 | 8.2% |
| Estonian | 18 | 0.0% |
| Ethiopian | 34 | 0.0% |
| European | 6,658 | 3.2% |
| Fijian | 68 | 0.0% |
| Finnish | 131 | 0.1% |
| French | 3,693 | 1.8% |
| French Canadian | 683 | 0.3% |
| German | 42,159 | 20.4% |
| Ghanaian | 23 | 0.0% |
| Greek | 222 | 0.1% |
| Guamanian / Chamorro | 7 | 0.0% |
| Guatemalan | 855 | 0.4% |
| Haitian | 214 | 0.1% |
| Honduran | 1,650 | 0.8% |
| Hungarian | 1,536 | 0.7% |
| Indian (Asian) | 433 | 0.2% |
| Iranian | 14 | 0.0% |
| Irish | 14,288 | 6.9% |
| Iroquois | 21 | 0.0% |
| Italian | 4,188 | 2.0% |
| Jamaican | 165 | 0.1% |
| Japanese | 97 | 0.1% |
| Kenyan | 46 | 0.0% |
| Korean | 617 | 0.3% |
| Laotian | 33 | 0.0% |
| Latvian | 7 | 0.0% |
| Lebanese | 159 | 0.1% |
| Lithuanian | 190 | 0.1% |
| Malaysian | 544 | 0.3% |
| Mexican | 24,473 | 11.8% |
| Mexican American Indian | 311 | 0.2% |
| Native Hawaiian | 3 | 0.0% |
| Navajo | 10 | 0.0% |
| Nicaraguan | 10 | 0.0% |
| Nigerian | 18 | 0.0% |
| Northern European | 195 | 0.1% |
| Norwegian | 902 | 0.4% |
| Ottawa | 2 | 0.0% |
| Pakistani | 115 | 0.1% |
| Panamanian | 97 | 0.1% |
| Pennsylvania German | 1,857 | 0.9% |
| Peruvian | 307 | 0.2% |
| Polish | 4,026 | 1.9% |
| Portuguese | 37 | 0.0% |
| Potawatomi | 29 | 0.0% |
| Puerto Rican | 3,344 | 1.6% |
| Romanian | 62 | 0.0% |
| Russian | 433 | 0.2% |
| Salvadoran | 948 | 0.5% |
| Samoan | 53 | 0.0% |
| Scandinavian | 156 | 0.1% |
| Scotch-Irish | 984 | 0.5% |
| Scottish | 1,558 | 0.7% |
| Seminole | 5 | 0.0% |
| Serbian | 67 | 0.0% |
| Sioux | 130 | 0.1% |
| Slavic | 85 | 0.0% |
| Slovak | 415 | 0.2% |
| South African | 20 | 0.0% |
| South American | 1,751 | 0.9% |
| South American Indian | 47 | 0.0% |
| Spaniard | 171 | 0.1% |
| Spanish | 295 | 0.1% |
| Spanish American | 24 | 0.0% |
| Sri Lankan | 66 | 0.0% |
| Subsaharan African | 1,496 | 0.7% |
| Swedish | 1,563 | 0.8% |
| Swiss | 5,987 | 2.9% |
| Syrian | 87 | 0.0% |
| Thai | 636 | 0.3% |
| Trinidadian and Tobagonian | 74 | 0.0% |
| Turkish | 32 | 0.0% |
| Ukrainian | 516 | 0.3% |
| Uruguayan | 14 | 0.0% |
| Venezuelan | 889 | 0.4% |
| Vietnamese | 32 | 0.0% |
| Welsh | 857 | 0.4% |
| West Indian | 39 | 0.0% | View All 122 Rows |
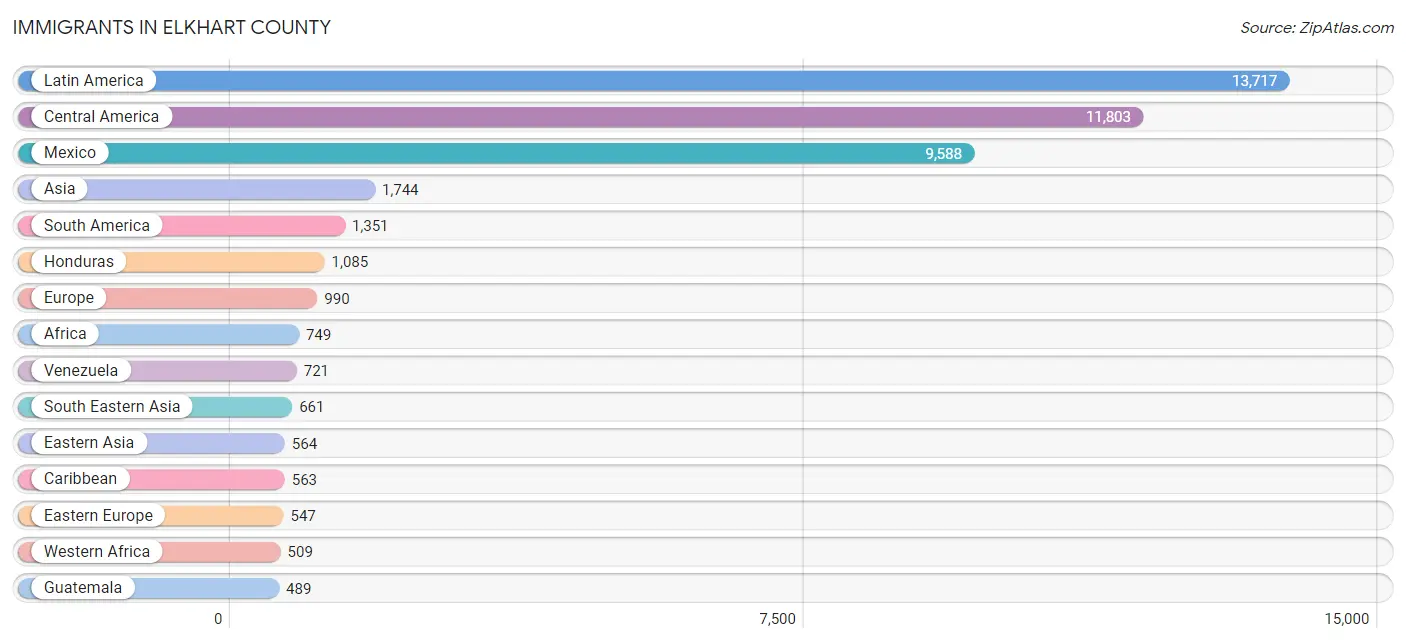
Immigrants in Elkhart County
The most numerous immigrant groups reported in Elkhart County came from Latin America (13,717 | 6.6%), Central America (11,803 | 5.7%), Mexico (9,588 | 4.6%), Asia (1,744 | 0.8%), and South America (1,351 | 0.6%), together accounting for 18.5% of all Elkhart County residents.
| Immigration Origin | # Population | % Population |
| Africa | 749 | 0.4% |
| Argentina | 21 | 0.0% |
| Asia | 1,744 | 0.8% |
| Australia | 19 | 0.0% |
| Bangladesh | 43 | 0.0% |
| Belize | 118 | 0.1% |
| Bolivia | 71 | 0.0% |
| Brazil | 96 | 0.1% |
| Cambodia | 29 | 0.0% |
| Canada | 390 | 0.2% |
| Caribbean | 563 | 0.3% |
| Central America | 11,803 | 5.7% |
| Chile | 9 | 0.0% |
| China | 215 | 0.1% |
| Colombia | 209 | 0.1% |
| Costa Rica | 56 | 0.0% |
| Cuba | 19 | 0.0% |
| Dominican Republic | 185 | 0.1% |
| Eastern Africa | 73 | 0.0% |
| Eastern Asia | 564 | 0.3% |
| Eastern Europe | 547 | 0.3% |
| Ecuador | 31 | 0.0% |
| El Salvador | 414 | 0.2% |
| England | 15 | 0.0% |
| Ethiopia | 34 | 0.0% |
| Europe | 990 | 0.5% |
| France | 12 | 0.0% |
| Germany | 209 | 0.1% |
| Ghana | 239 | 0.1% |
| Guatemala | 489 | 0.2% |
| Haiti | 213 | 0.1% |
| Honduras | 1,085 | 0.5% |
| Hong Kong | 17 | 0.0% |
| Hungary | 66 | 0.0% |
| India | 289 | 0.1% |
| Indonesia | 42 | 0.0% |
| Iraq | 88 | 0.0% |
| Italy | 36 | 0.0% |
| Jamaica | 19 | 0.0% |
| Japan | 22 | 0.0% |
| Kenya | 32 | 0.0% |
| Korea | 327 | 0.2% |
| Laos | 223 | 0.1% |
| Latin America | 13,717 | 6.6% |
| Lebanon | 19 | 0.0% |
| Liberia | 46 | 0.0% |
| Mexico | 9,588 | 4.6% |
| Middle Africa | 59 | 0.0% |
| Nepal | 12 | 0.0% |
| Netherlands | 74 | 0.0% |
| Nicaragua | 37 | 0.0% |
| Nigeria | 224 | 0.1% |
| Northern Europe | 92 | 0.0% |
| Oceania | 62 | 0.0% |
| Pakistan | 28 | 0.0% |
| Panama | 16 | 0.0% |
| Peru | 179 | 0.1% |
| Philippines | 320 | 0.2% |
| Poland | 18 | 0.0% |
| Romania | 13 | 0.0% |
| Russia | 44 | 0.0% |
| Scotland | 19 | 0.0% |
| South Africa | 20 | 0.0% |
| South America | 1,351 | 0.6% |
| South Central Asia | 383 | 0.2% |
| South Eastern Asia | 661 | 0.3% |
| Southern Europe | 56 | 0.0% |
| Spain | 20 | 0.0% |
| Syria | 16 | 0.0% |
| Thailand | 32 | 0.0% |
| Trinidad and Tobago | 41 | 0.0% |
| Ukraine | 304 | 0.2% |
| Uruguay | 14 | 0.0% |
| Venezuela | 721 | 0.4% |
| Vietnam | 15 | 0.0% |
| West Indies | 66 | 0.0% |
| Western Africa | 509 | 0.3% |
| Western Asia | 136 | 0.1% |
| Western Europe | 295 | 0.1% |
| Yemen | 13 | 0.0% |
| Zaire | 59 | 0.0% | View All 81 Rows |
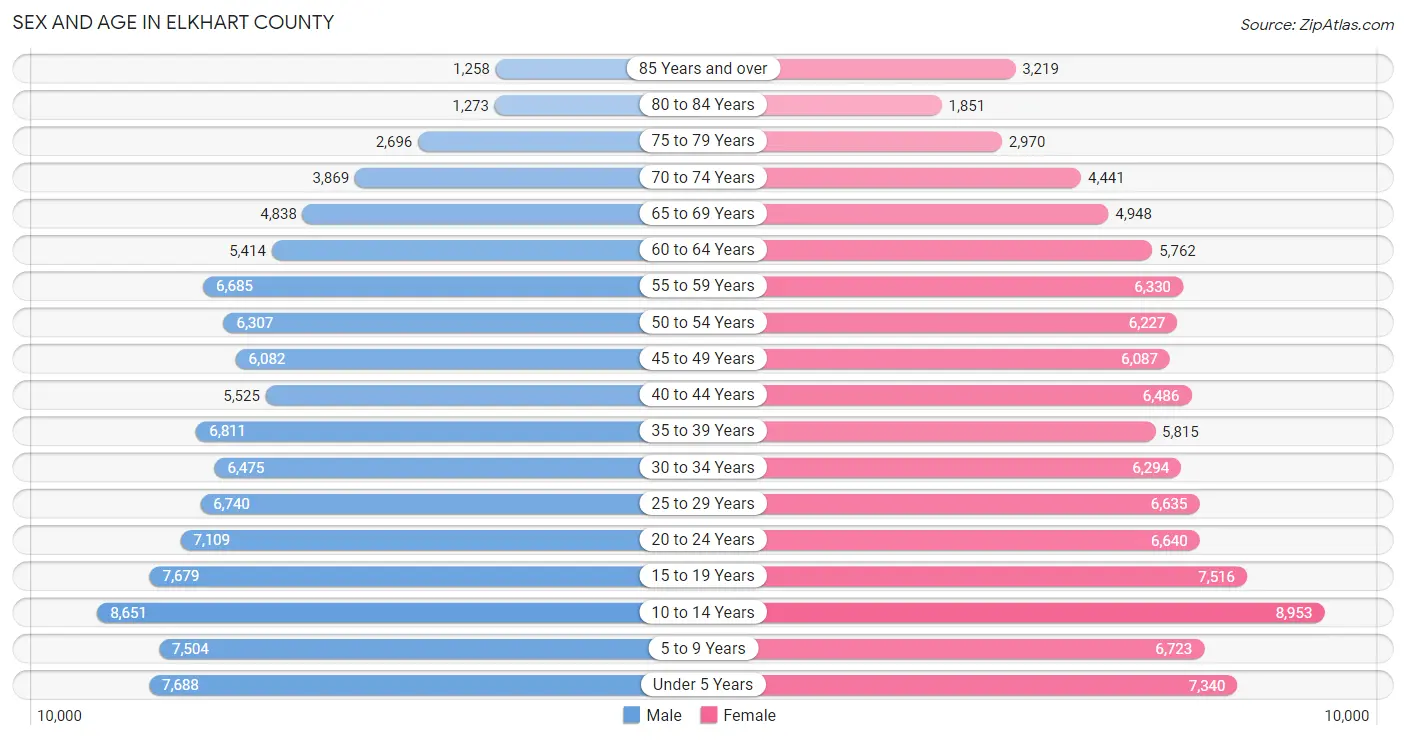
Sex and Age in Elkhart County
Sex and Age in Elkhart County
The most populous age groups in Elkhart County are 10 to 14 Years (8,651 | 8.4%) for men and 10 to 14 Years (8,953 | 8.6%) for women.
| Age Bracket | Male | Female |
| Under 5 Years | 7,688 (7.5%) | 7,340 (7.0%) |
| 5 to 9 Years | 7,504 (7.3%) | 6,723 (6.5%) |
| 10 to 14 Years | 8,651 (8.4%) | 8,953 (8.6%) |
| 15 to 19 Years | 7,679 (7.5%) | 7,516 (7.2%) |
| 20 to 24 Years | 7,109 (6.9%) | 6,640 (6.4%) |
| 25 to 29 Years | 6,740 (6.6%) | 6,635 (6.4%) |
| 30 to 34 Years | 6,475 (6.3%) | 6,294 (6.0%) |
| 35 to 39 Years | 6,811 (6.6%) | 5,815 (5.6%) |
| 40 to 44 Years | 5,525 (5.4%) | 6,486 (6.2%) |
| 45 to 49 Years | 6,082 (5.9%) | 6,087 (5.8%) |
| 50 to 54 Years | 6,307 (6.1%) | 6,227 (6.0%) |
| 55 to 59 Years | 6,685 (6.5%) | 6,330 (6.1%) |
| 60 to 64 Years | 5,414 (5.3%) | 5,762 (5.5%) |
| 65 to 69 Years | 4,838 (4.7%) | 4,948 (4.8%) |
| 70 to 74 Years | 3,869 (3.8%) | 4,441 (4.3%) |
| 75 to 79 Years | 2,696 (2.6%) | 2,970 (2.9%) |
| 80 to 84 Years | 1,273 (1.2%) | 1,851 (1.8%) |
| 85 Years and over | 1,258 (1.2%) | 3,219 (3.1%) |
| Total | 102,604 (100.0%) | 104,237 (100.0%) |
Families and Households in Elkhart County
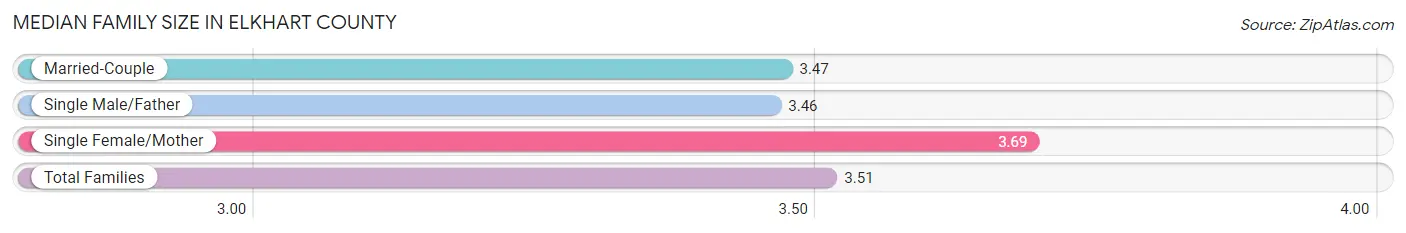
Median Family Size in Elkhart County
The median family size in Elkhart County is 3.51 persons per family, with single female/mother families (8,906 | 18.4%) accounting for the largest median family size of 3.69 persons per family. On the other hand, single male/father families (3,068 | 6.3%) represent the smallest median family size with 3.46 persons per family.
| Family Type | # Families | Family Size |
| Married-Couple | 36,473 (75.3%) | 3.47 |
| Single Male/Father | 3,068 (6.3%) | 3.46 |
| Single Female/Mother | 8,906 (18.4%) | 3.69 |
| Total Families | 48,447 (100.0%) | 3.51 |
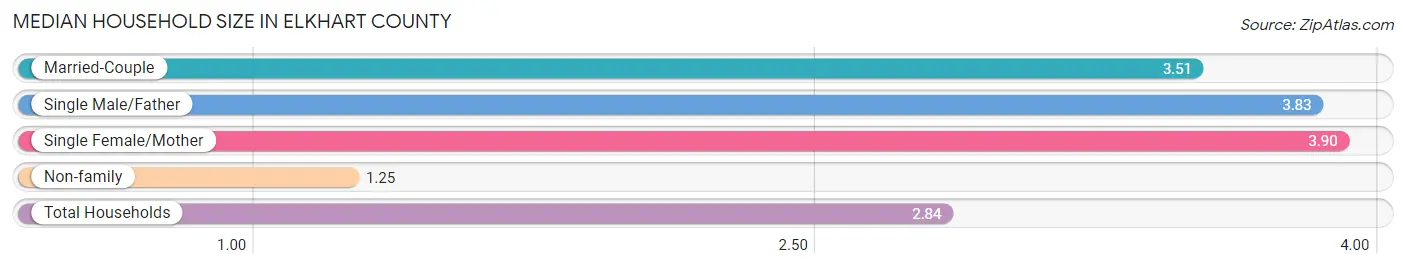
Median Household Size in Elkhart County
The median household size in Elkhart County is 2.84 persons per household, with single female/mother households (8,906 | 12.4%) accounting for the largest median household size of 3.9 persons per household. non-family households (23,304 | 32.5%) represent the smallest median household size with 1.25 persons per household.
| Household Type | # Households | Household Size |
| Married-Couple | 36,473 (50.8%) | 3.51 |
| Single Male/Father | 3,068 (4.3%) | 3.83 |
| Single Female/Mother | 8,906 (12.4%) | 3.90 |
| Non-family | 23,304 (32.5%) | 1.25 |
| Total Households | 71,751 (100.0%) | 2.84 |
Household Size by Marriage Status in Elkhart County
Out of a total of 71,751 households in Elkhart County, 48,447 (67.5%) are family households, while 23,304 (32.5%) are nonfamily households. The most numerous type of family households are 2-person households, comprising 21,427, and the most common type of nonfamily households are 1-person households, comprising 19,696.
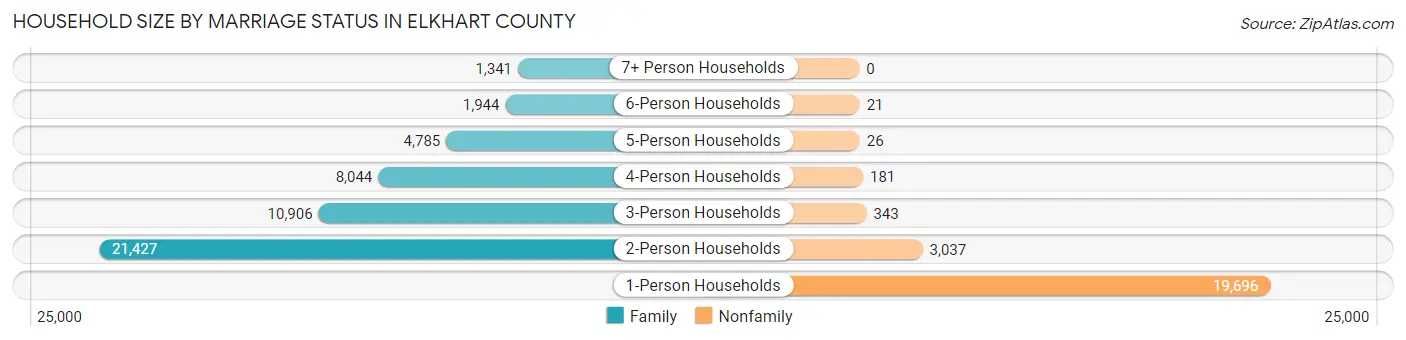
| Household Size | Family Households | Nonfamily Households |
| 1-Person Households | - | 19,696 (27.5%) |
| 2-Person Households | 21,427 (29.9%) | 3,037 (4.2%) |
| 3-Person Households | 10,906 (15.2%) | 343 (0.5%) |
| 4-Person Households | 8,044 (11.2%) | 181 (0.3%) |
| 5-Person Households | 4,785 (6.7%) | 26 (0.0%) |
| 6-Person Households | 1,944 (2.7%) | 21 (0.0%) |
| 7+ Person Households | 1,341 (1.9%) | 0 (0.0%) |
| Total | 48,447 (67.5%) | 23,304 (32.5%) |
Female Fertility in Elkhart County
Fertility by Age in Elkhart County
Average fertility rate in Elkhart County is 47.0 births per 1,000 women. Women in the age bracket of 20 to 34 years have the highest fertility rate with 84.0 births per 1,000 women. Women in the age bracket of 20 to 34 years acount for 75.6% of all women with births.
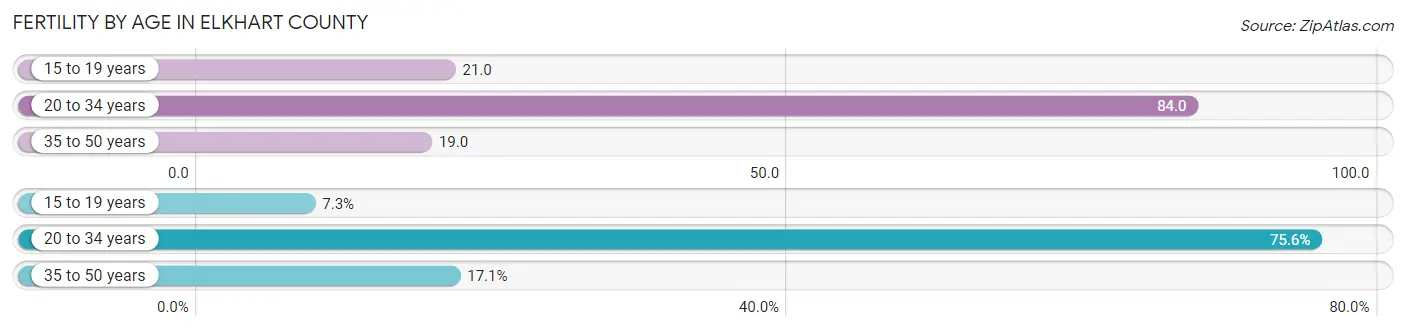
| Age Bracket | Women with Births | Births / 1,000 Women |
| 15 to 19 years | 159 (7.3%) | 21.0 |
| 20 to 34 years | 1,651 (75.6%) | 84.0 |
| 35 to 50 years | 374 (17.1%) | 19.0 |
| Total | 2,184 (100.0%) | 47.0 |
Fertility by Age by Marriage Status in Elkhart County
60.5% of women with births (2,184) in Elkhart County are married. The highest percentage of unmarried women with births falls into 15 to 19 years age bracket with 100.0% of them unmarried at the time of birth, while the lowest percentage of unmarried women with births belong to 35 to 50 years age bracket with 5.9% of them unmarried.
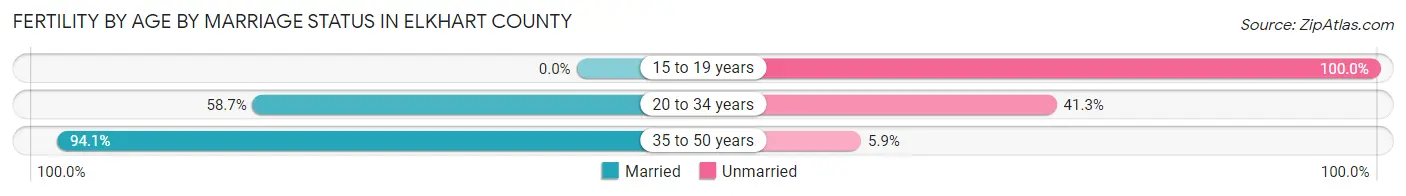
| Age Bracket | Married | Unmarried |
| 15 to 19 years | 0 (0.0%) | 159 (100.0%) |
| 20 to 34 years | 969 (58.7%) | 682 (41.3%) |
| 35 to 50 years | 352 (94.1%) | 22 (5.9%) |
| Total | 1,321 (60.5%) | 863 (39.5%) |
Fertility by Education in Elkhart County
Average fertility rate in Elkhart County is 47.0 births per 1,000 women. Women with the education attainment of less than high school have the highest fertility rate of 63.0 births per 1,000 women, while women with the education attainment of graduate degree have the lowest fertility at 25.0 births per 1,000 women. Women with the education attainment of less than high school represent 39.5% of all women with births.
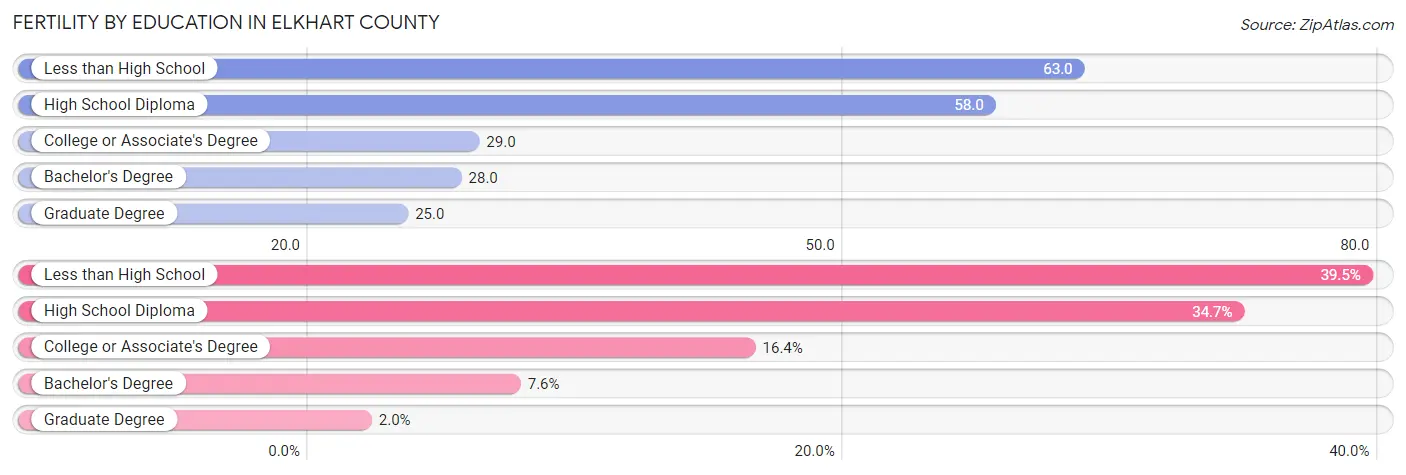
| Educational Attainment | Women with Births | Births / 1,000 Women |
| Less than High School | 862 (39.5%) | 63.0 |
| High School Diploma | 757 (34.7%) | 58.0 |
| College or Associate's Degree | 357 (16.4%) | 29.0 |
| Bachelor's Degree | 165 (7.5%) | 28.0 |
| Graduate Degree | 43 (2.0%) | 25.0 |
| Total | 2,184 (100.0%) | 47.0 |
Fertility by Education by Marriage Status in Elkhart County
39.5% of women with births in Elkhart County are unmarried. Women with the educational attainment of bachelor's degree are most likely to be married with 100.0% of them married at childbirth, while women with the educational attainment of high school diploma are least likely to be married with 57.1% of them unmarried at childbirth.
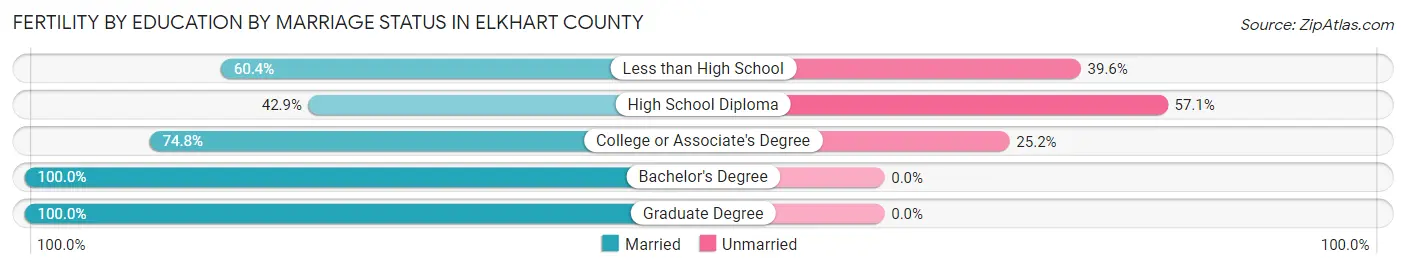
| Educational Attainment | Married | Unmarried |
| Less than High School | 521 (60.4%) | 341 (39.6%) |
| High School Diploma | 325 (42.9%) | 432 (57.1%) |
| College or Associate's Degree | 267 (74.8%) | 90 (25.2%) |
| Bachelor's Degree | 165 (100.0%) | 0 (0.0%) |
| Graduate Degree | 43 (100.0%) | 0 (0.0%) |
| Total | 1,321 (60.5%) | 863 (39.5%) |
Employment Characteristics in Elkhart County
Employment by Class of Employer in Elkhart County
Among the 97,136 employed individuals in Elkhart County, private company employees (71,901 | 74.0%), not-for-profit organizations (8,970 | 9.2%), and local government employees (5,371 | 5.5%) make up the most common classes of employment.
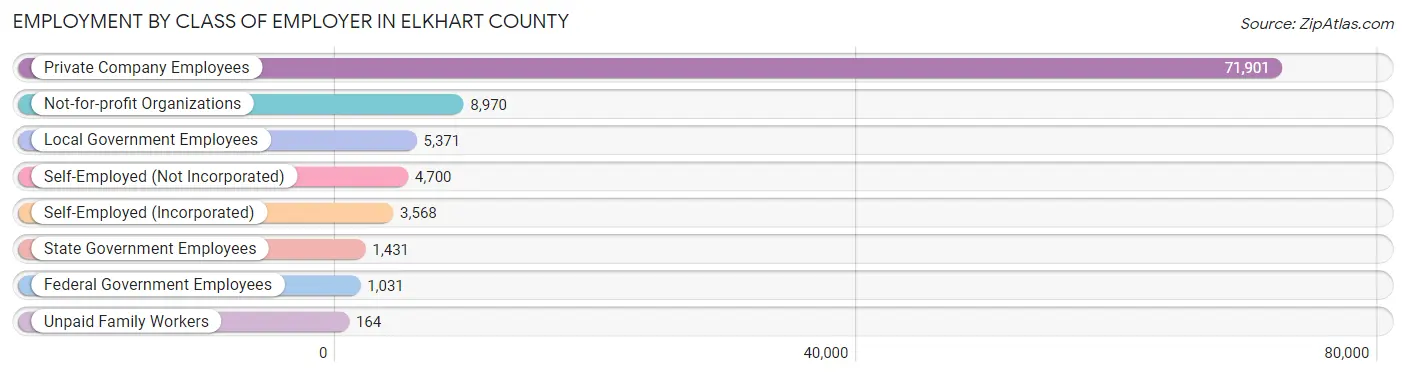
| Employer Class | # Employees | % Employees |
| Private Company Employees | 71,901 | 74.0% |
| Self-Employed (Incorporated) | 3,568 | 3.7% |
| Self-Employed (Not Incorporated) | 4,700 | 4.8% |
| Not-for-profit Organizations | 8,970 | 9.2% |
| Local Government Employees | 5,371 | 5.5% |
| State Government Employees | 1,431 | 1.5% |
| Federal Government Employees | 1,031 | 1.1% |
| Unpaid Family Workers | 164 | 0.2% |
| Total | 97,136 | 100.0% |
Employment Status by Age in Elkhart County
According to the labor force statistics for Elkhart County, out of the total population over 16 years of age (156,775), 65.6% or 102,844 individuals are in the labor force, with 3.8% or 3,908 of them unemployed. The age group with the highest labor force participation rate is 45 to 54 years, with 83.4% or 20,602 individuals in the labor force. Within the labor force, the 20 to 24 years age range has the highest percentage of unemployed individuals, with 7.0% or 762 of them being unemployed.
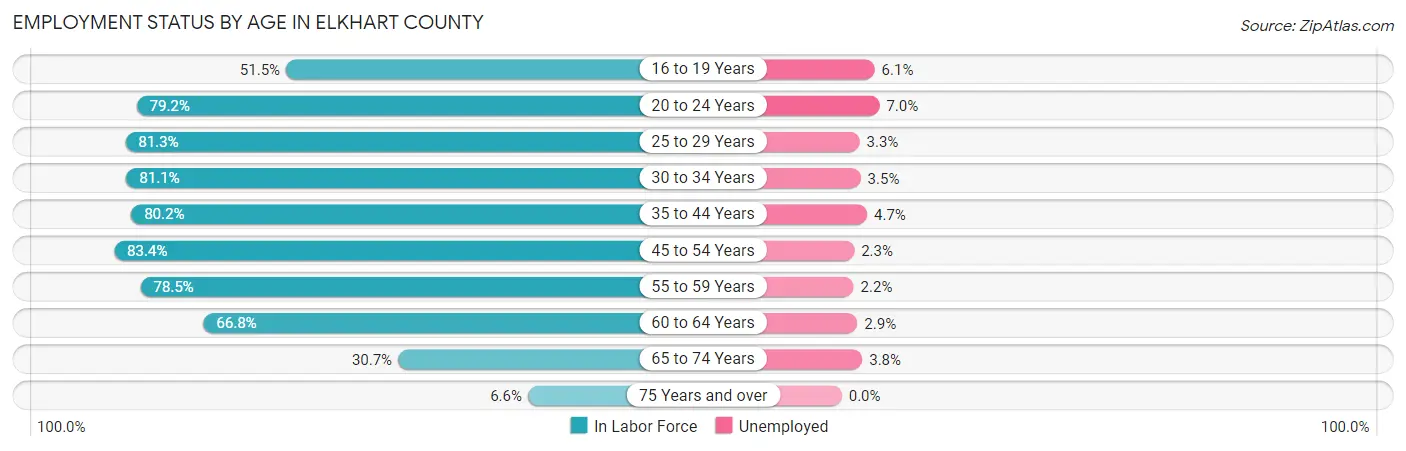
| Age Bracket | In Labor Force | Unemployed |
| 16 to 19 Years | 6,174 (51.5%) | 377 (6.1%) |
| 20 to 24 Years | 10,889 (79.2%) | 762 (7.0%) |
| 25 to 29 Years | 10,874 (81.3%) | 359 (3.3%) |
| 30 to 34 Years | 10,356 (81.1%) | 362 (3.5%) |
| 35 to 44 Years | 19,759 (80.2%) | 929 (4.7%) |
| 45 to 54 Years | 20,602 (83.4%) | 474 (2.3%) |
| 55 to 59 Years | 10,217 (78.5%) | 225 (2.2%) |
| 60 to 64 Years | 7,466 (66.8%) | 217 (2.9%) |
| 65 to 74 Years | 5,555 (30.7%) | 211 (3.8%) |
| 75 Years and over | 876 (6.6%) | 0 (0.0%) |
| Total | 102,844 (65.6%) | 3,908 (3.8%) |
Employment Status by Educational Attainment in Elkhart County
According to labor force statistics for Elkhart County, 79.5% of individuals (79,242) out of the total population between 25 and 64 years of age (99,675) are in the labor force, with 3.2% or 2,536 of them being unemployed. The group with the highest labor force participation rate are those with the educational attainment of bachelor's degree or higher, with 90.6% or 17,616 individuals in the labor force. Within the labor force, individuals with less than high school education have the highest percentage of unemployment, with 5.7% or 668 of them being unemployed.
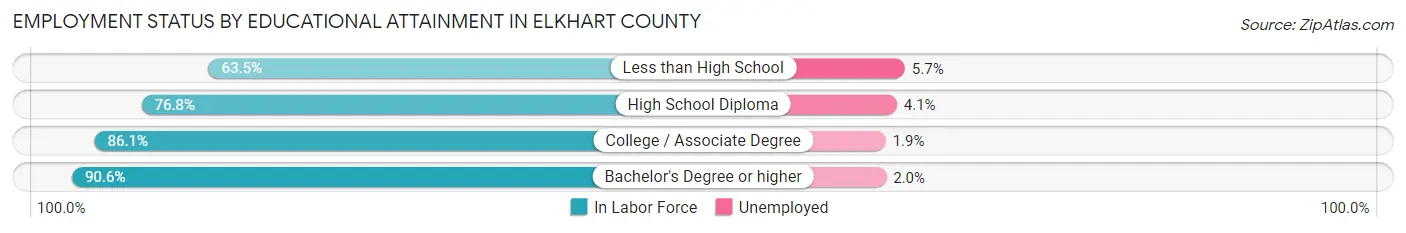
| Educational Attainment | In Labor Force | Unemployed |
| Less than High School | 11,711 (63.5%) | 1,051 (5.7%) |
| High School Diploma | 26,680 (76.8%) | 1,424 (4.1%) |
| College / Associate Degree | 23,289 (86.1%) | 514 (1.9%) |
| Bachelor's Degree or higher | 17,616 (90.6%) | 389 (2.0%) |
| Total | 79,242 (79.5%) | 3,190 (3.2%) |
Employment Occupations by Sex in Elkhart County
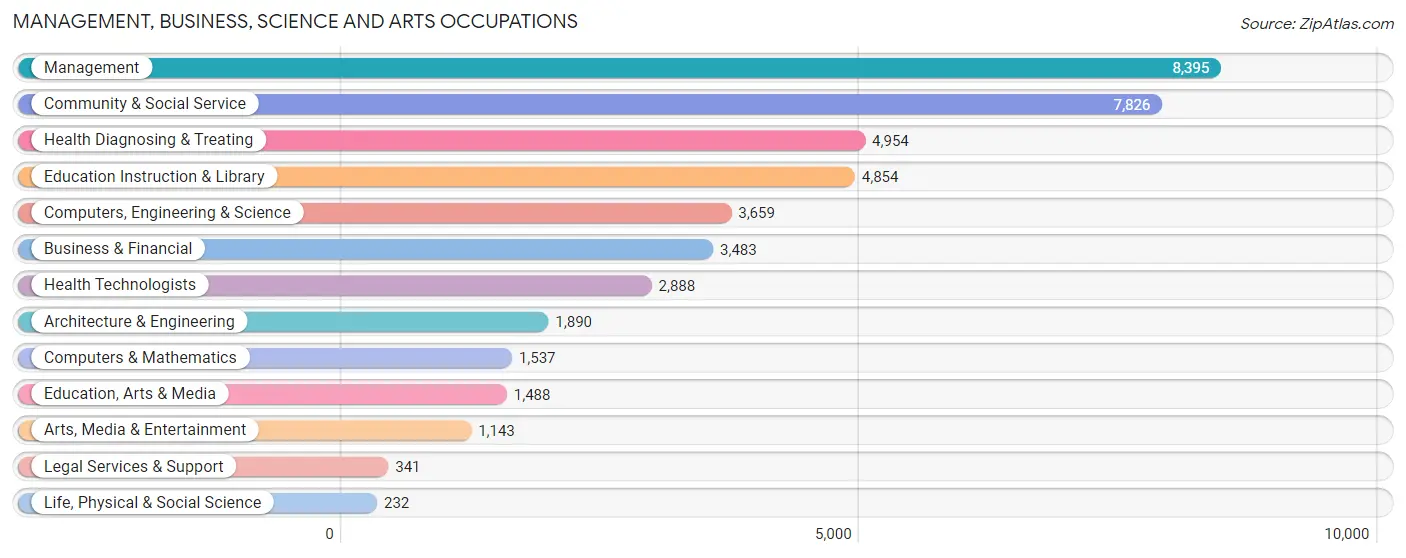
Management, Business, Science and Arts Occupations
The most common Management, Business, Science and Arts occupations in Elkhart County are Management (8,395 | 8.5%), Community & Social Service (7,826 | 7.9%), Health Diagnosing & Treating (4,954 | 5.0%), Education Instruction & Library (4,854 | 4.9%), and Computers, Engineering & Science (3,659 | 3.7%).
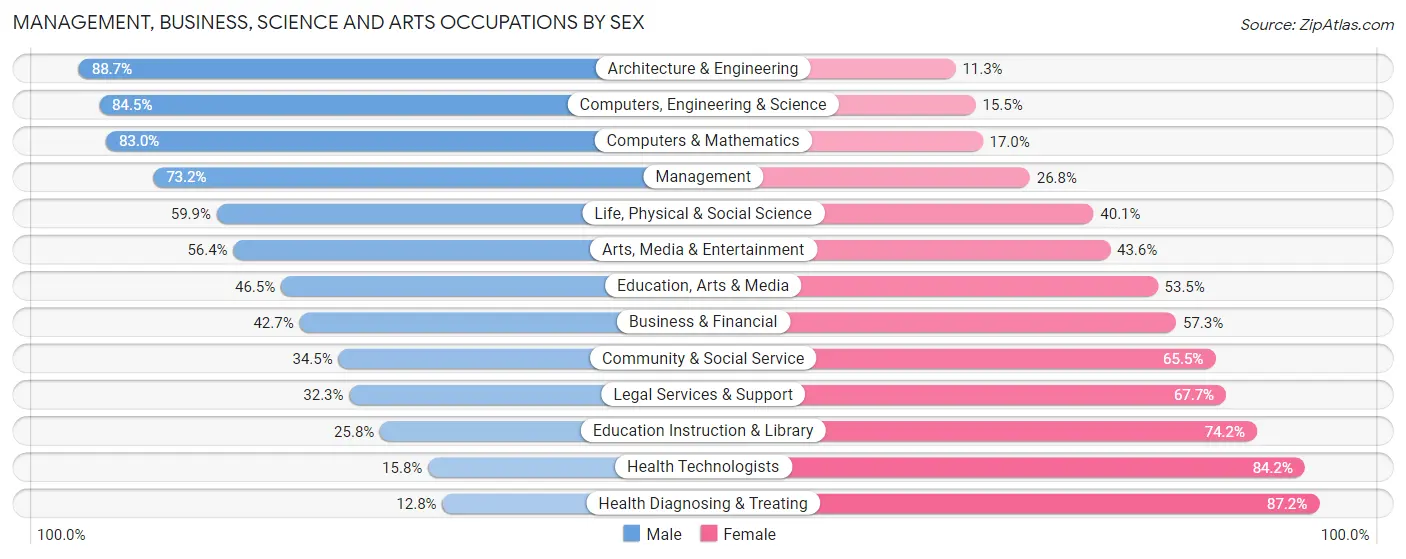
Management, Business, Science and Arts Occupations by Sex
Within the Management, Business, Science and Arts occupations in Elkhart County, the most male-oriented occupations are Architecture & Engineering (88.7%), Computers, Engineering & Science (84.5%), and Computers & Mathematics (83.0%), while the most female-oriented occupations are Health Diagnosing & Treating (87.2%), Health Technologists (84.2%), and Education Instruction & Library (74.2%).
| Occupation | Male | Female |
| Management | 6,143 (73.2%) | 2,252 (26.8%) |
| Business & Financial | 1,486 (42.7%) | 1,997 (57.3%) |
| Computers, Engineering & Science | 3,091 (84.5%) | 568 (15.5%) |
| Computers & Mathematics | 1,276 (83.0%) | 261 (17.0%) |
| Architecture & Engineering | 1,676 (88.7%) | 214 (11.3%) |
| Life, Physical & Social Science | 139 (59.9%) | 93 (40.1%) |
| Community & Social Service | 2,701 (34.5%) | 5,125 (65.5%) |
| Education, Arts & Media | 692 (46.5%) | 796 (53.5%) |
| Legal Services & Support | 110 (32.3%) | 231 (67.7%) |
| Education Instruction & Library | 1,254 (25.8%) | 3,600 (74.2%) |
| Arts, Media & Entertainment | 645 (56.4%) | 498 (43.6%) |
| Health Diagnosing & Treating | 636 (12.8%) | 4,318 (87.2%) |
| Health Technologists | 457 (15.8%) | 2,431 (84.2%) |
| Total (Category) | 14,057 (49.6%) | 14,260 (50.4%) |
| Total (Overall) | 54,179 (54.8%) | 44,683 (45.2%) |
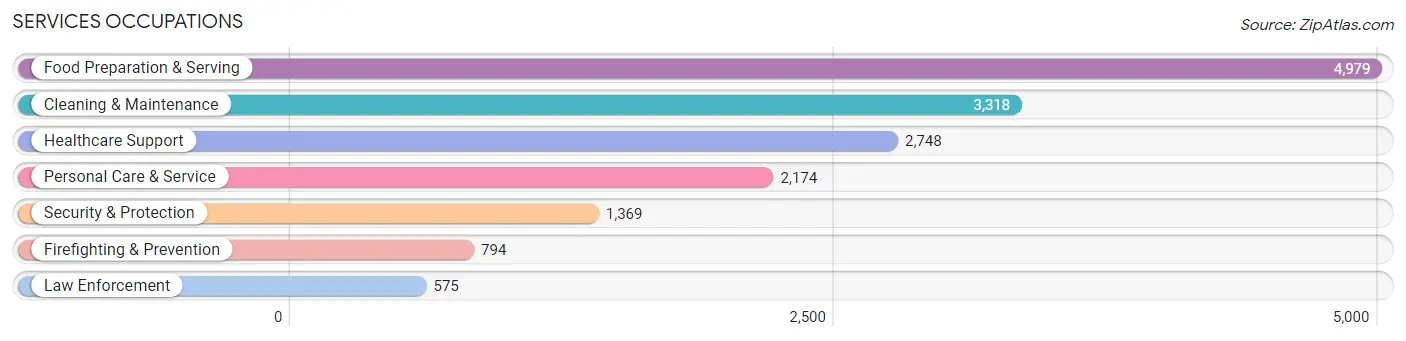
Services Occupations
The most common Services occupations in Elkhart County are Food Preparation & Serving (4,979 | 5.0%), Cleaning & Maintenance (3,318 | 3.4%), Healthcare Support (2,748 | 2.8%), Personal Care & Service (2,174 | 2.2%), and Security & Protection (1,369 | 1.4%).
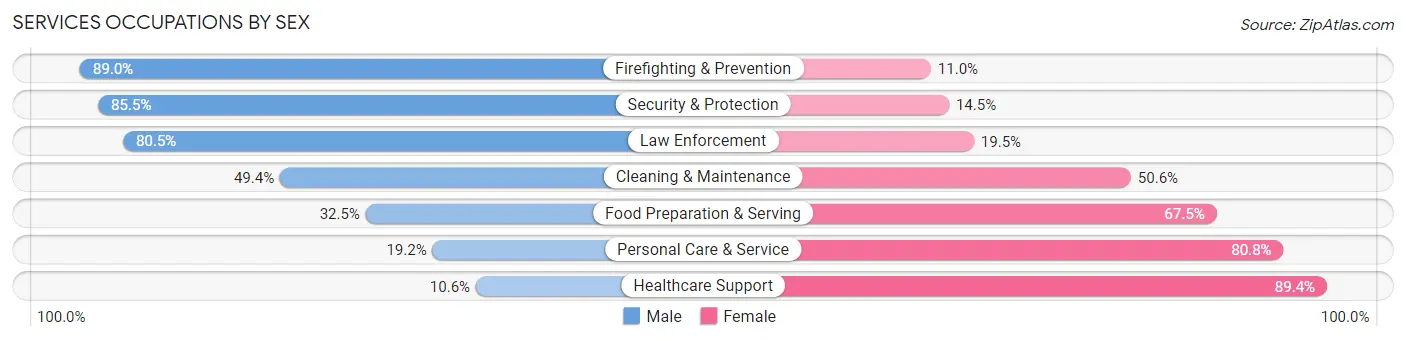
Services Occupations by Sex
Within the Services occupations in Elkhart County, the most male-oriented occupations are Firefighting & Prevention (89.0%), Security & Protection (85.5%), and Law Enforcement (80.5%), while the most female-oriented occupations are Healthcare Support (89.4%), Personal Care & Service (80.8%), and Food Preparation & Serving (67.5%).
| Occupation | Male | Female |
| Healthcare Support | 292 (10.6%) | 2,456 (89.4%) |
| Security & Protection | 1,170 (85.5%) | 199 (14.5%) |
| Firefighting & Prevention | 707 (89.0%) | 87 (11.0%) |
| Law Enforcement | 463 (80.5%) | 112 (19.5%) |
| Food Preparation & Serving | 1,616 (32.5%) | 3,363 (67.5%) |
| Cleaning & Maintenance | 1,640 (49.4%) | 1,678 (50.6%) |
| Personal Care & Service | 418 (19.2%) | 1,756 (80.8%) |
| Total (Category) | 5,136 (35.2%) | 9,452 (64.8%) |
| Total (Overall) | 54,179 (54.8%) | 44,683 (45.2%) |
Sales and Office Occupations
The most common Sales and Office occupations in Elkhart County are Office & Administration (10,612 | 10.7%), and Sales & Related (8,654 | 8.7%).
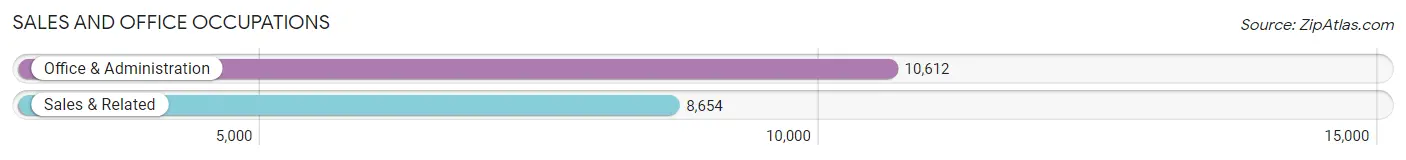
Sales and Office Occupations by Sex
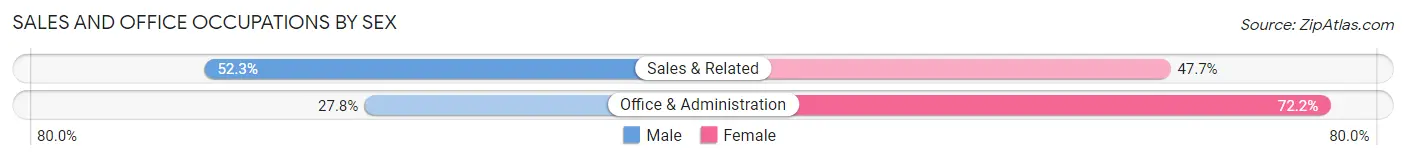
| Occupation | Male | Female |
| Sales & Related | 4,528 (52.3%) | 4,126 (47.7%) |
| Office & Administration | 2,947 (27.8%) | 7,665 (72.2%) |
| Total (Category) | 7,475 (38.8%) | 11,791 (61.2%) |
| Total (Overall) | 54,179 (54.8%) | 44,683 (45.2%) |
Natural Resources, Construction and Maintenance Occupations
The most common Natural Resources, Construction and Maintenance occupations in Elkhart County are Construction & Extraction (4,420 | 4.5%), Installation, Maintenance & Repair (3,297 | 3.3%), and Farming, Fishing & Forestry (479 | 0.5%).

Natural Resources, Construction and Maintenance Occupations by Sex
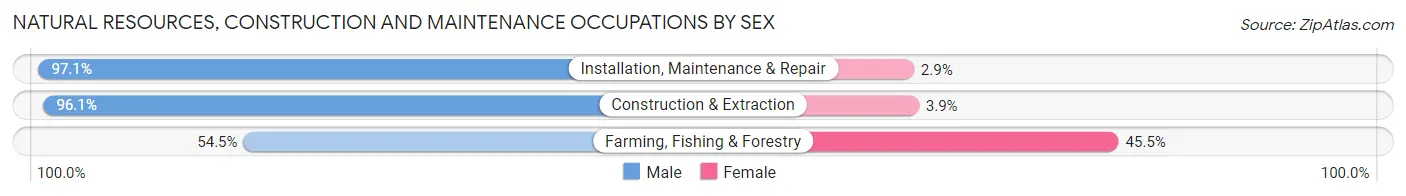
| Occupation | Male | Female |
| Farming, Fishing & Forestry | 261 (54.5%) | 218 (45.5%) |
| Construction & Extraction | 4,246 (96.1%) | 174 (3.9%) |
| Installation, Maintenance & Repair | 3,201 (97.1%) | 96 (2.9%) |
| Total (Category) | 7,708 (94.1%) | 488 (5.9%) |
| Total (Overall) | 54,179 (54.8%) | 44,683 (45.2%) |
Production, Transportation and Moving Occupations
The most common Production, Transportation and Moving occupations in Elkhart County are Production (19,216 | 19.4%), Material Moving (5,811 | 5.9%), and Transportation (3,468 | 3.5%).
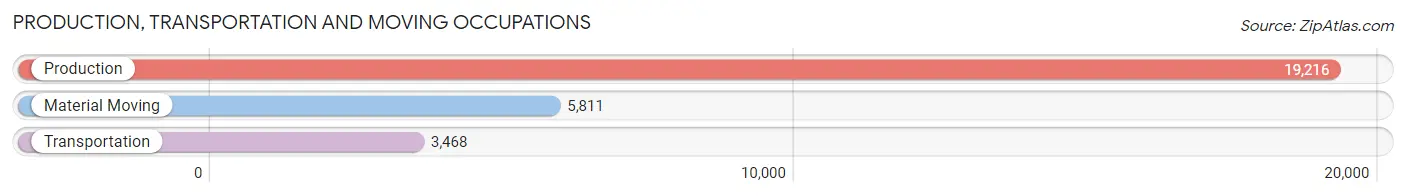
Production, Transportation and Moving Occupations by Sex
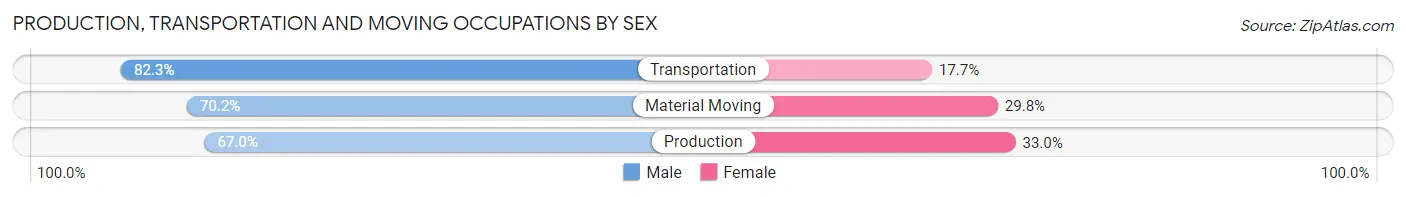
| Occupation | Male | Female |
| Production | 12,869 (67.0%) | 6,347 (33.0%) |
| Transportation | 2,854 (82.3%) | 614 (17.7%) |
| Material Moving | 4,080 (70.2%) | 1,731 (29.8%) |
| Total (Category) | 19,803 (69.5%) | 8,692 (30.5%) |
| Total (Overall) | 54,179 (54.8%) | 44,683 (45.2%) |
Employment Industries by Sex in Elkhart County
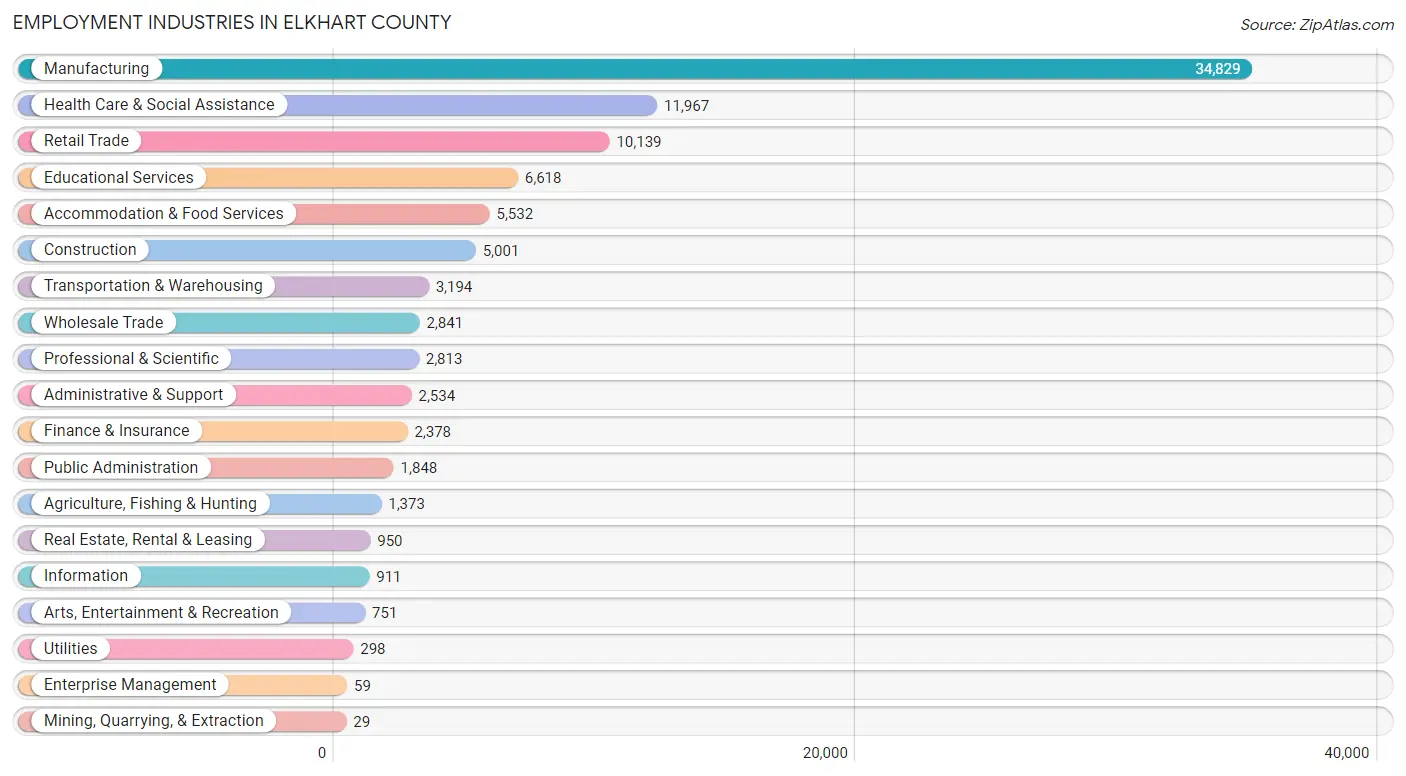
Employment Industries in Elkhart County
The major employment industries in Elkhart County include Manufacturing (34,829 | 35.2%), Health Care & Social Assistance (11,967 | 12.1%), Retail Trade (10,139 | 10.3%), Educational Services (6,618 | 6.7%), and Accommodation & Food Services (5,532 | 5.6%).
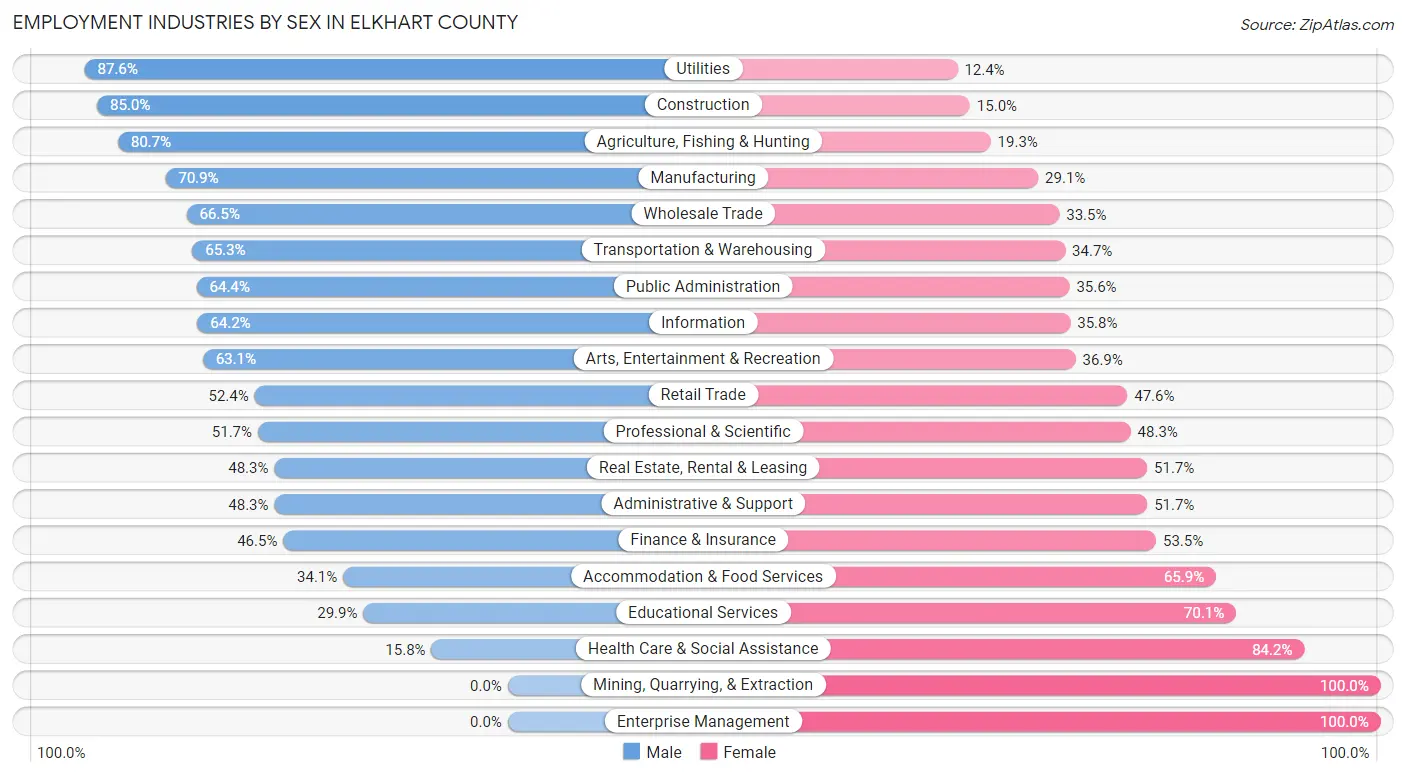
Employment Industries by Sex in Elkhart County
The Elkhart County industries that see more men than women are Utilities (87.6%), Construction (85.0%), and Agriculture, Fishing & Hunting (80.7%), whereas the industries that tend to have a higher number of women are Mining, Quarrying, & Extraction (100.0%), Enterprise Management (100.0%), and Health Care & Social Assistance (84.2%).
| Industry | Male | Female |
| Agriculture, Fishing & Hunting | 1,108 (80.7%) | 265 (19.3%) |
| Mining, Quarrying, & Extraction | 0 (0.0%) | 29 (100.0%) |
| Construction | 4,251 (85.0%) | 750 (15.0%) |
| Manufacturing | 24,685 (70.9%) | 10,144 (29.1%) |
| Wholesale Trade | 1,889 (66.5%) | 952 (33.5%) |
| Retail Trade | 5,314 (52.4%) | 4,825 (47.6%) |
| Transportation & Warehousing | 2,085 (65.3%) | 1,109 (34.7%) |
| Utilities | 261 (87.6%) | 37 (12.4%) |
| Information | 585 (64.2%) | 326 (35.8%) |
| Finance & Insurance | 1,105 (46.5%) | 1,273 (53.5%) |
| Real Estate, Rental & Leasing | 459 (48.3%) | 491 (51.7%) |
| Professional & Scientific | 1,455 (51.7%) | 1,358 (48.3%) |
| Enterprise Management | 0 (0.0%) | 59 (100.0%) |
| Administrative & Support | 1,224 (48.3%) | 1,310 (51.7%) |
| Educational Services | 1,979 (29.9%) | 4,639 (70.1%) |
| Health Care & Social Assistance | 1,891 (15.8%) | 10,076 (84.2%) |
| Arts, Entertainment & Recreation | 474 (63.1%) | 277 (36.9%) |
| Accommodation & Food Services | 1,885 (34.1%) | 3,647 (65.9%) |
| Public Administration | 1,190 (64.4%) | 658 (35.6%) |
| Total | 54,179 (54.8%) | 44,683 (45.2%) |
Education in Elkhart County
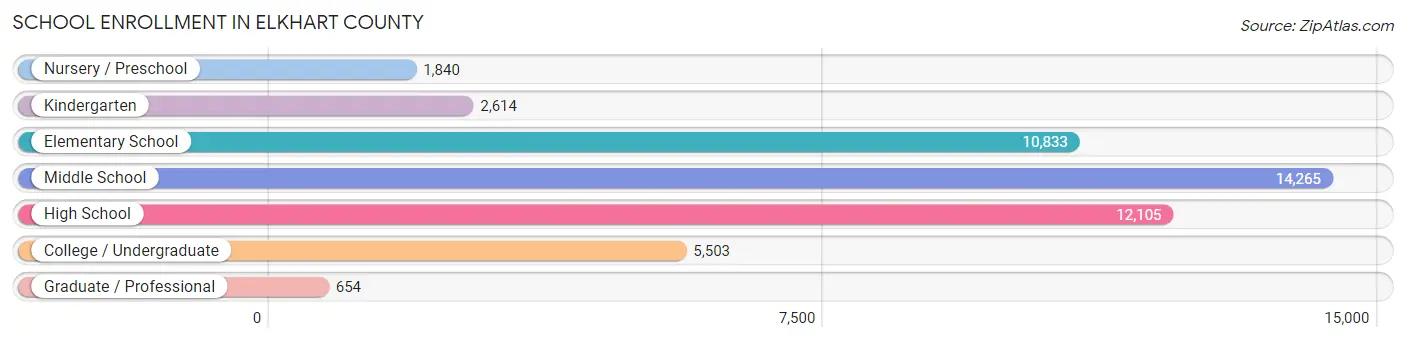
School Enrollment in Elkhart County
The most common levels of schooling among the 47,814 students in Elkhart County are middle school (14,265 | 29.8%), high school (12,105 | 25.3%), and elementary school (10,833 | 22.7%).
| School Level | # Students | % Students |
| Nursery / Preschool | 1,840 | 3.8% |
| Kindergarten | 2,614 | 5.5% |
| Elementary School | 10,833 | 22.7% |
| Middle School | 14,265 | 29.8% |
| High School | 12,105 | 25.3% |
| College / Undergraduate | 5,503 | 11.5% |
| Graduate / Professional | 654 | 1.4% |
| Total | 47,814 | 100.0% |
School Enrollment by Age by Funding Source in Elkhart County
Out of a total of 47,814 students who are enrolled in schools in Elkhart County, 7,937 (16.6%) attend a private institution, while the remaining 39,877 (83.4%) are enrolled in public schools. The age group of 3 to 4 year olds has the highest likelihood of being enrolled in private schools, with 524 (47.2% in the age bracket) enrolled. Conversely, the age group of 15 to 17 year olds has the lowest likelihood of being enrolled in a private school, with 7,748 (89.4% in the age bracket) attending a public institution.
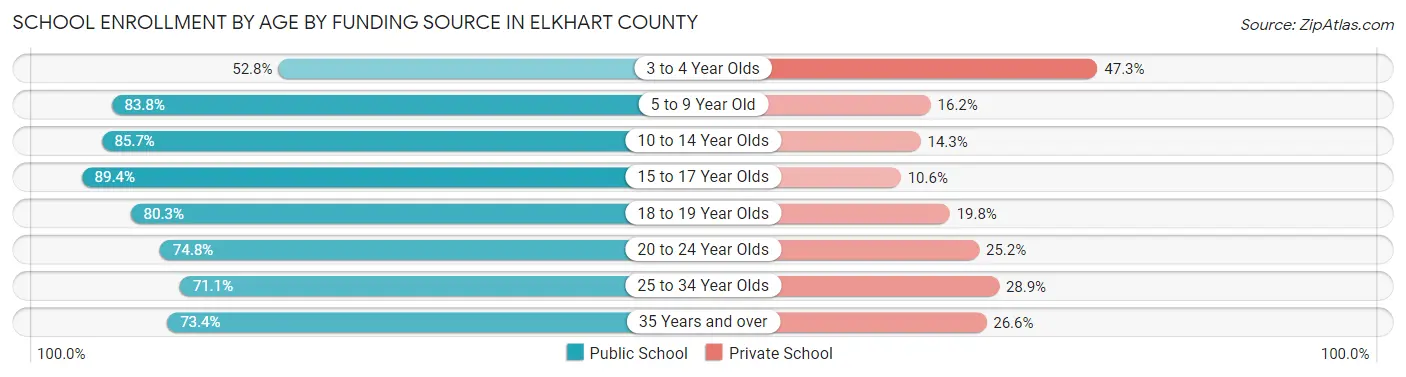
| Age Bracket | Public School | Private School |
| 3 to 4 Year Olds | 585 (52.7%) | 524 (47.2%) |
| 5 to 9 Year Old | 10,471 (83.8%) | 2,023 (16.2%) |
| 10 to 14 Year Olds | 14,768 (85.7%) | 2,468 (14.3%) |
| 15 to 17 Year Olds | 7,748 (89.4%) | 922 (10.6%) |
| 18 to 19 Year Olds | 2,369 (80.2%) | 583 (19.8%) |
| 20 to 24 Year Olds | 2,017 (74.8%) | 680 (25.2%) |
| 25 to 34 Year Olds | 735 (71.1%) | 299 (28.9%) |
| 35 Years and over | 1,191 (73.4%) | 431 (26.6%) |
| Total | 39,877 (83.4%) | 7,937 (16.6%) |
Educational Attainment by Field of Study in Elkhart County
Education (5,920 | 20.8%), business (5,526 | 19.4%), science & technology (3,389 | 11.9%), liberal arts & history (2,165 | 7.6%), and arts & humanities (1,835 | 6.4%) are the most common fields of study among 28,520 individuals in Elkhart County who have obtained a bachelor's degree or higher.
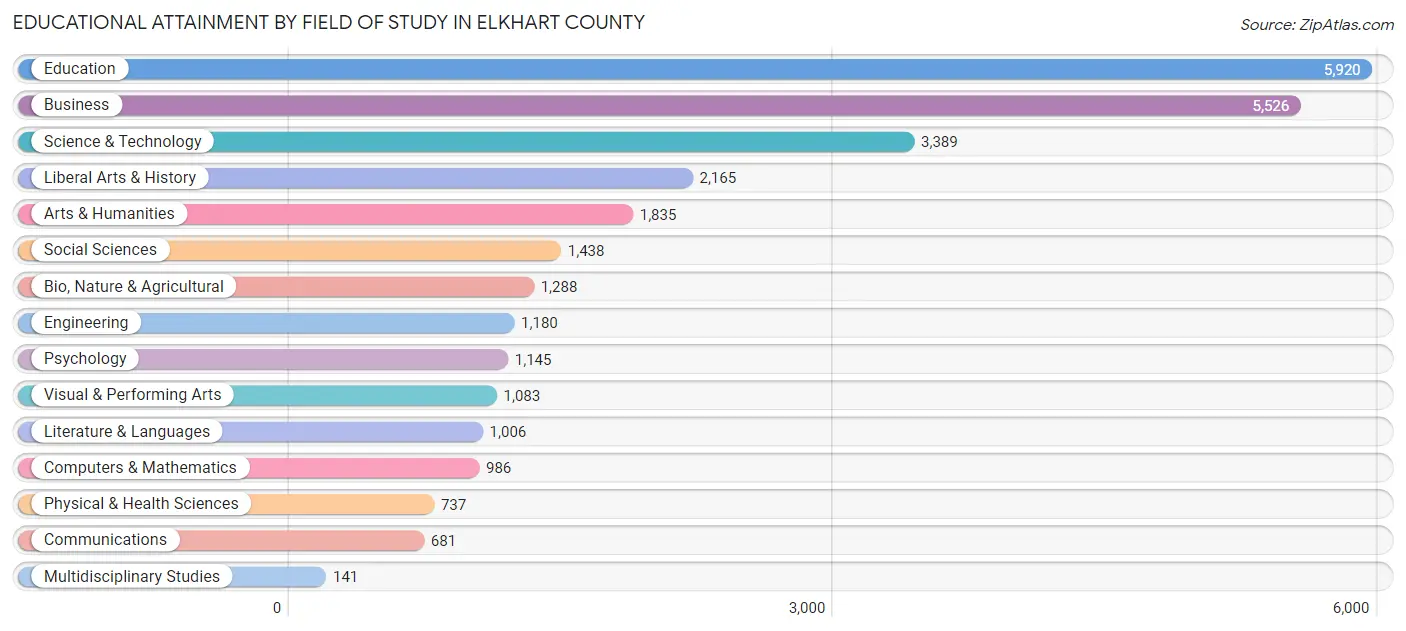
| Field of Study | # Graduates | % Graduates |
| Computers & Mathematics | 986 | 3.5% |
| Bio, Nature & Agricultural | 1,288 | 4.5% |
| Physical & Health Sciences | 737 | 2.6% |
| Psychology | 1,145 | 4.0% |
| Social Sciences | 1,438 | 5.0% |
| Engineering | 1,180 | 4.1% |
| Multidisciplinary Studies | 141 | 0.5% |
| Science & Technology | 3,389 | 11.9% |
| Business | 5,526 | 19.4% |
| Education | 5,920 | 20.8% |
| Literature & Languages | 1,006 | 3.5% |
| Liberal Arts & History | 2,165 | 7.6% |
| Visual & Performing Arts | 1,083 | 3.8% |
| Communications | 681 | 2.4% |
| Arts & Humanities | 1,835 | 6.4% |
| Total | 28,520 | 100.0% |
Transportation & Commute in Elkhart County
Vehicle Availability by Sex in Elkhart County
The most prevalent vehicle ownership categories in Elkhart County are males with 2 vehicles (21,137, accounting for 39.6%) and females with 2 vehicles (18,065, making up 48.6%).
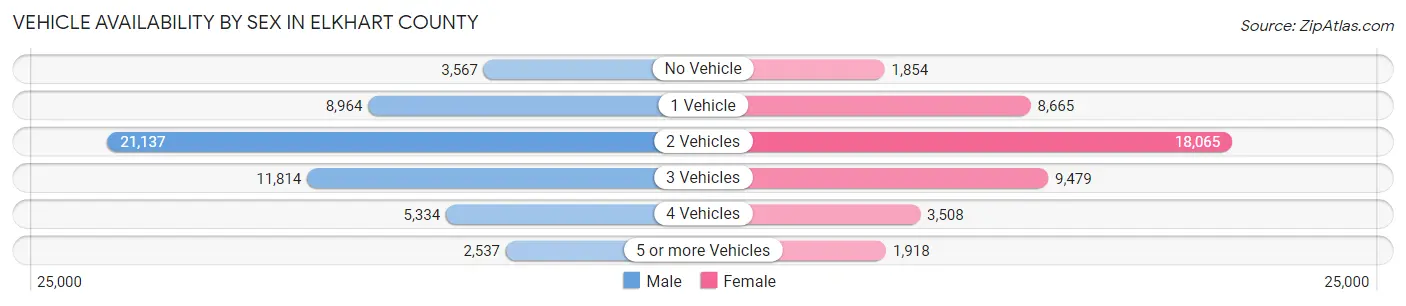
| Vehicles Available | Male | Female |
| No Vehicle | 3,567 (6.7%) | 1,854 (4.3%) |
| 1 Vehicle | 8,964 (16.8%) | 8,665 (19.9%) |
| 2 Vehicles | 21,137 (39.6%) | 18,065 (41.5%) |
| 3 Vehicles | 11,814 (22.1%) | 9,479 (21.8%) |
| 4 Vehicles | 5,334 (10.0%) | 3,508 (8.1%) |
| 5 or more Vehicles | 2,537 (4.8%) | 1,918 (4.4%) |
| Total | 53,353 (100.0%) | 43,489 (100.0%) |
Commute Time in Elkhart County
The most frequently occuring commute durations in Elkhart County are 15 to 19 minutes (18,432 commuters, 20.0%), 10 to 14 minutes (16,827 commuters, 18.2%), and 20 to 24 minutes (13,958 commuters, 15.1%).
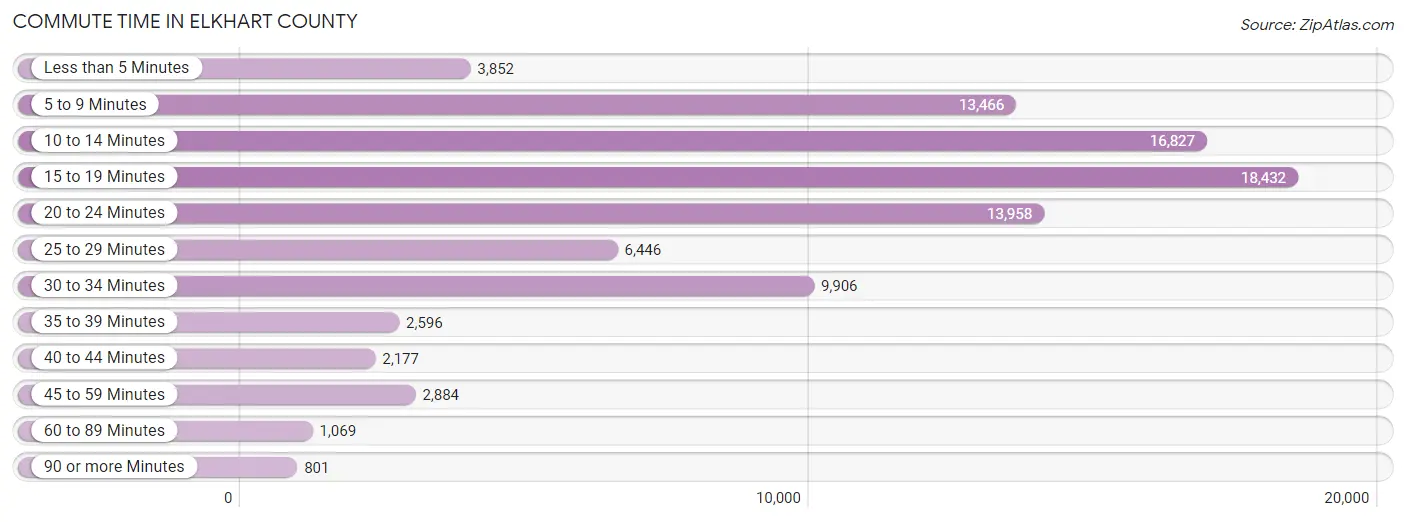
| Commute Time | # Commuters | % Commuters |
| Less than 5 Minutes | 3,852 | 4.2% |
| 5 to 9 Minutes | 13,466 | 14.6% |
| 10 to 14 Minutes | 16,827 | 18.2% |
| 15 to 19 Minutes | 18,432 | 20.0% |
| 20 to 24 Minutes | 13,958 | 15.1% |
| 25 to 29 Minutes | 6,446 | 7.0% |
| 30 to 34 Minutes | 9,906 | 10.7% |
| 35 to 39 Minutes | 2,596 | 2.8% |
| 40 to 44 Minutes | 2,177 | 2.4% |
| 45 to 59 Minutes | 2,884 | 3.1% |
| 60 to 89 Minutes | 1,069 | 1.2% |
| 90 or more Minutes | 801 | 0.9% |
Commute Time by Sex in Elkhart County
The most common commute times in Elkhart County are 10 to 14 minutes (9,645 commuters, 18.9%) for males and 15 to 19 minutes (8,813 commuters, 21.3%) for females.
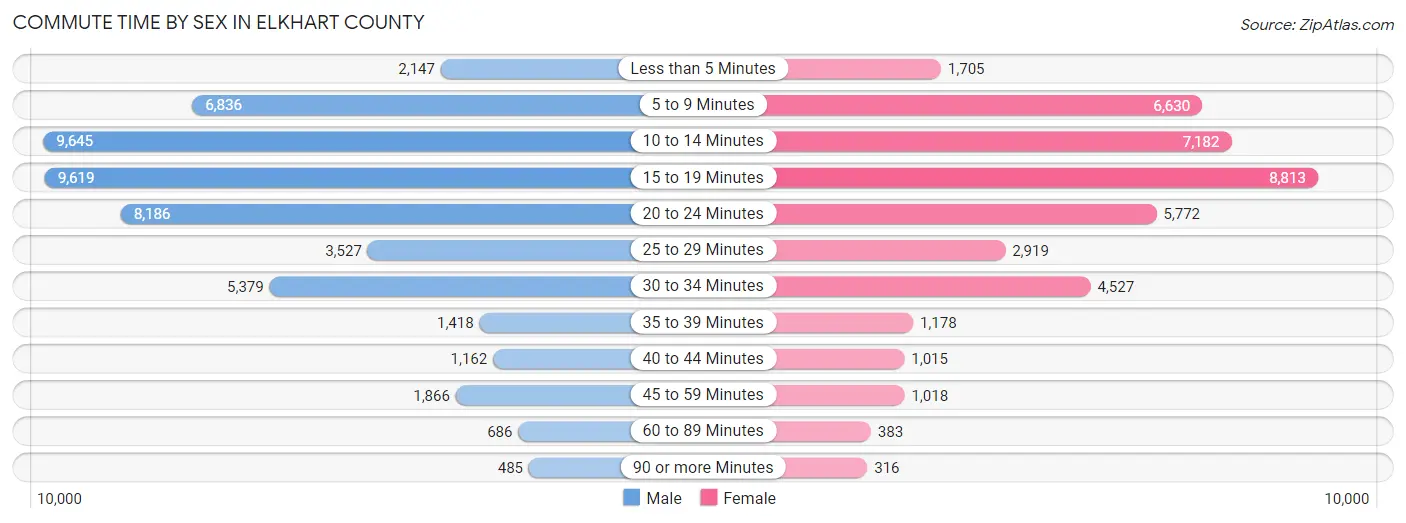
| Commute Time | Male | Female |
| Less than 5 Minutes | 2,147 (4.2%) | 1,705 (4.1%) |
| 5 to 9 Minutes | 6,836 (13.4%) | 6,630 (16.0%) |
| 10 to 14 Minutes | 9,645 (18.9%) | 7,182 (17.3%) |
| 15 to 19 Minutes | 9,619 (18.9%) | 8,813 (21.3%) |
| 20 to 24 Minutes | 8,186 (16.1%) | 5,772 (13.9%) |
| 25 to 29 Minutes | 3,527 (6.9%) | 2,919 (7.0%) |
| 30 to 34 Minutes | 5,379 (10.6%) | 4,527 (10.9%) |
| 35 to 39 Minutes | 1,418 (2.8%) | 1,178 (2.8%) |
| 40 to 44 Minutes | 1,162 (2.3%) | 1,015 (2.5%) |
| 45 to 59 Minutes | 1,866 (3.7%) | 1,018 (2.5%) |
| 60 to 89 Minutes | 686 (1.3%) | 383 (0.9%) |
| 90 or more Minutes | 485 (0.9%) | 316 (0.8%) |
Time of Departure to Work by Sex in Elkhart County
The most frequent times of departure to work in Elkhart County are 12:00 AM to 4:59 AM (12,850, 25.2%) for males and 7:30 AM to 7:59 AM (5,992, 14.4%) for females.
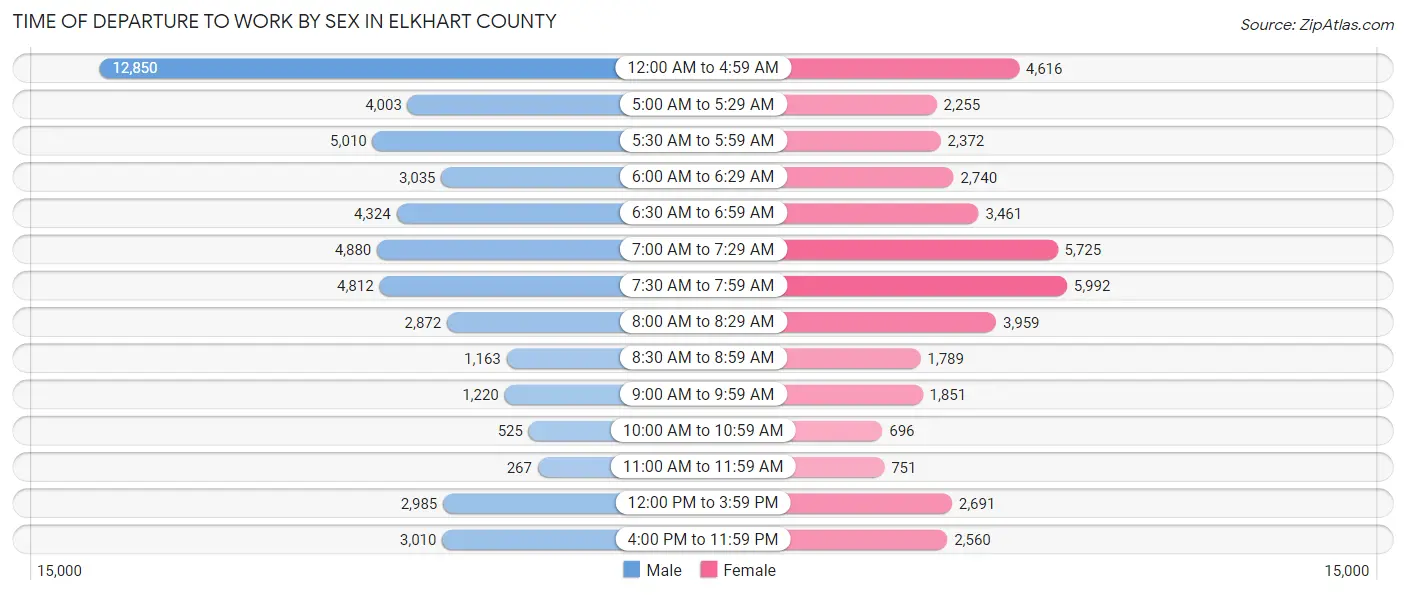
| Time of Departure | Male | Female |
| 12:00 AM to 4:59 AM | 12,850 (25.2%) | 4,616 (11.1%) |
| 5:00 AM to 5:29 AM | 4,003 (7.9%) | 2,255 (5.4%) |
| 5:30 AM to 5:59 AM | 5,010 (9.8%) | 2,372 (5.7%) |
| 6:00 AM to 6:29 AM | 3,035 (6.0%) | 2,740 (6.6%) |
| 6:30 AM to 6:59 AM | 4,324 (8.5%) | 3,461 (8.4%) |
| 7:00 AM to 7:29 AM | 4,880 (9.6%) | 5,725 (13.8%) |
| 7:30 AM to 7:59 AM | 4,812 (9.4%) | 5,992 (14.4%) |
| 8:00 AM to 8:29 AM | 2,872 (5.6%) | 3,959 (9.6%) |
| 8:30 AM to 8:59 AM | 1,163 (2.3%) | 1,789 (4.3%) |
| 9:00 AM to 9:59 AM | 1,220 (2.4%) | 1,851 (4.5%) |
| 10:00 AM to 10:59 AM | 525 (1.0%) | 696 (1.7%) |
| 11:00 AM to 11:59 AM | 267 (0.5%) | 751 (1.8%) |
| 12:00 PM to 3:59 PM | 2,985 (5.9%) | 2,691 (6.5%) |
| 4:00 PM to 11:59 PM | 3,010 (5.9%) | 2,560 (6.2%) |
| Total | 50,956 (100.0%) | 41,458 (100.0%) |
Housing Occupancy in Elkhart County
Occupancy by Ownership in Elkhart County
Of the total 71,751 dwellings in Elkhart County, owner-occupied units account for 51,118 (71.2%), while renter-occupied units make up 20,633 (28.8%).
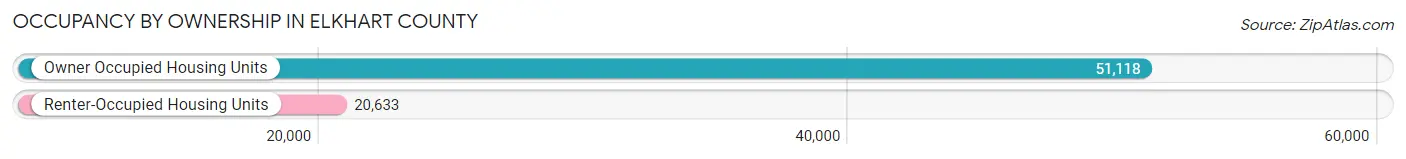
| Occupancy | # Housing Units | % Housing Units |
| Owner Occupied Housing Units | 51,118 | 71.2% |
| Renter-Occupied Housing Units | 20,633 | 28.8% |
| Total Occupied Housing Units | 71,751 | 100.0% |
Occupancy by Household Size in Elkhart County
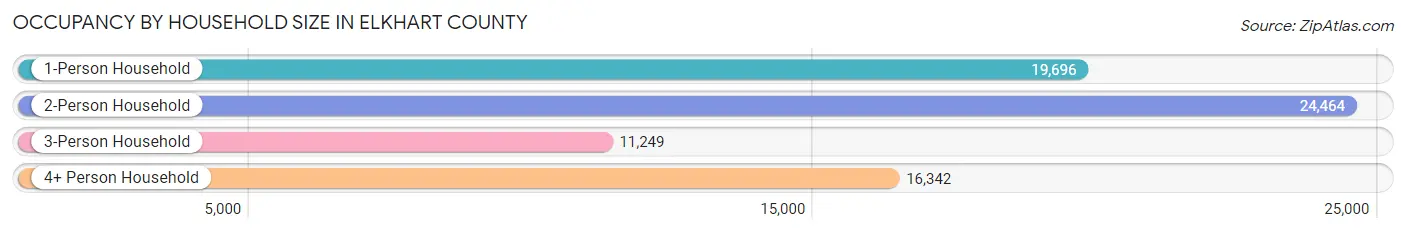
| Household Size | # Housing Units | % Housing Units |
| 1-Person Household | 19,696 | 27.5% |
| 2-Person Household | 24,464 | 34.1% |
| 3-Person Household | 11,249 | 15.7% |
| 4+ Person Household | 16,342 | 22.8% |
| Total Housing Units | 71,751 | 100.0% |
Occupancy by Ownership by Household Size in Elkhart County
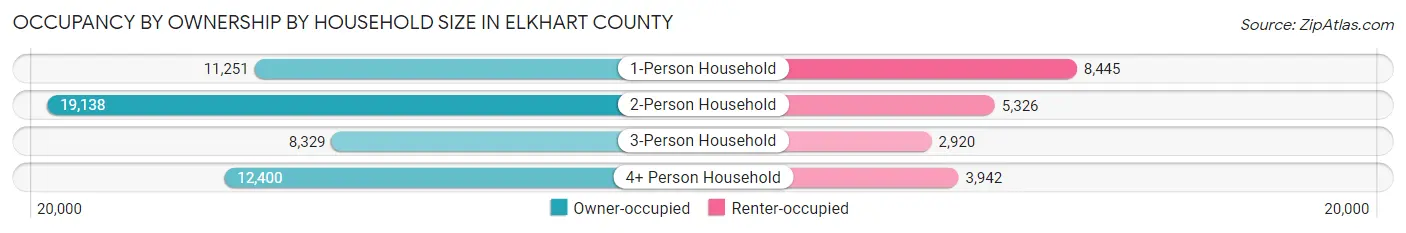
| Household Size | Owner-occupied | Renter-occupied |
| 1-Person Household | 11,251 (57.1%) | 8,445 (42.9%) |
| 2-Person Household | 19,138 (78.2%) | 5,326 (21.8%) |
| 3-Person Household | 8,329 (74.0%) | 2,920 (26.0%) |
| 4+ Person Household | 12,400 (75.9%) | 3,942 (24.1%) |
| Total Housing Units | 51,118 (71.2%) | 20,633 (28.8%) |
Occupancy by Educational Attainment in Elkhart County
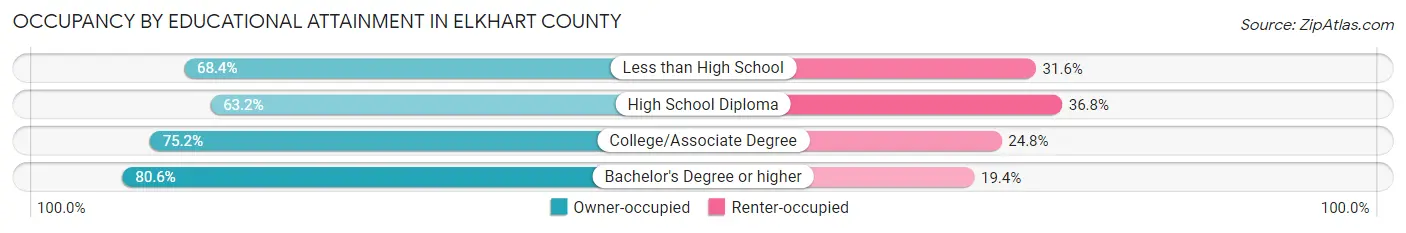
| Household Size | Owner-occupied | Renter-occupied |
| Less than High School | 7,498 (68.4%) | 3,467 (31.6%) |
| High School Diploma | 15,366 (63.2%) | 8,953 (36.8%) |
| College/Associate Degree | 15,801 (75.2%) | 5,216 (24.8%) |
| Bachelor's Degree or higher | 12,453 (80.6%) | 2,997 (19.4%) |
Occupancy by Age of Householder in Elkhart County
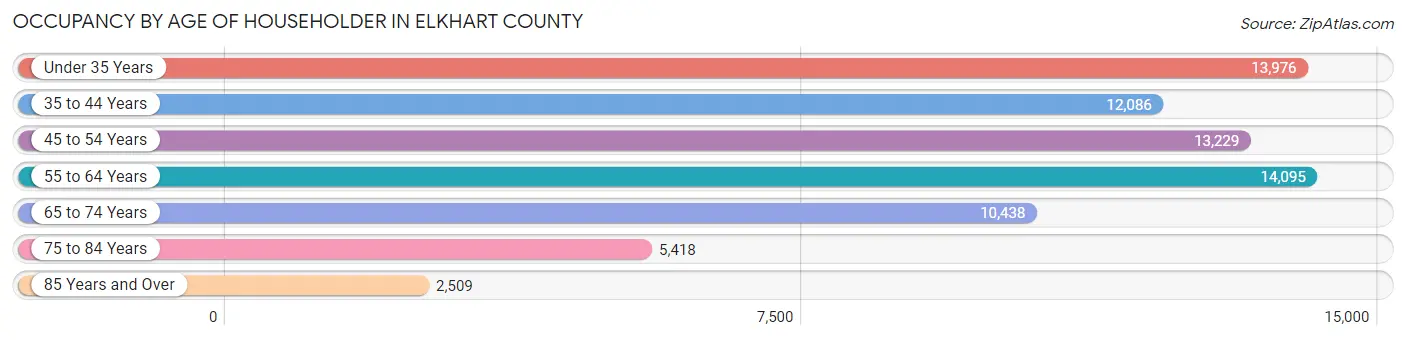
| Age Bracket | # Households | % Households |
| Under 35 Years | 13,976 | 19.5% |
| 35 to 44 Years | 12,086 | 16.8% |
| 45 to 54 Years | 13,229 | 18.4% |
| 55 to 64 Years | 14,095 | 19.6% |
| 65 to 74 Years | 10,438 | 14.5% |
| 75 to 84 Years | 5,418 | 7.5% |
| 85 Years and Over | 2,509 | 3.5% |
| Total | 71,751 | 100.0% |
Housing Finances in Elkhart County
Median Income by Occupancy in Elkhart County
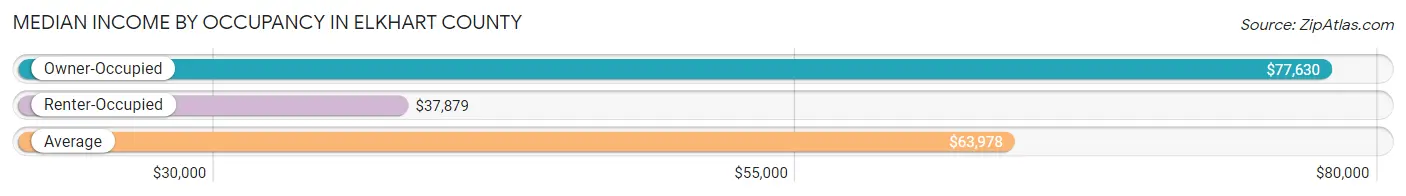
| Occupancy Type | # Households | Median Income |
| Owner-Occupied | 51,118 (71.2%) | $77,630 |
| Renter-Occupied | 20,633 (28.8%) | $37,879 |
| Average | 71,751 (100.0%) | $63,978 |
Occupancy by Householder Income Bracket in Elkhart County
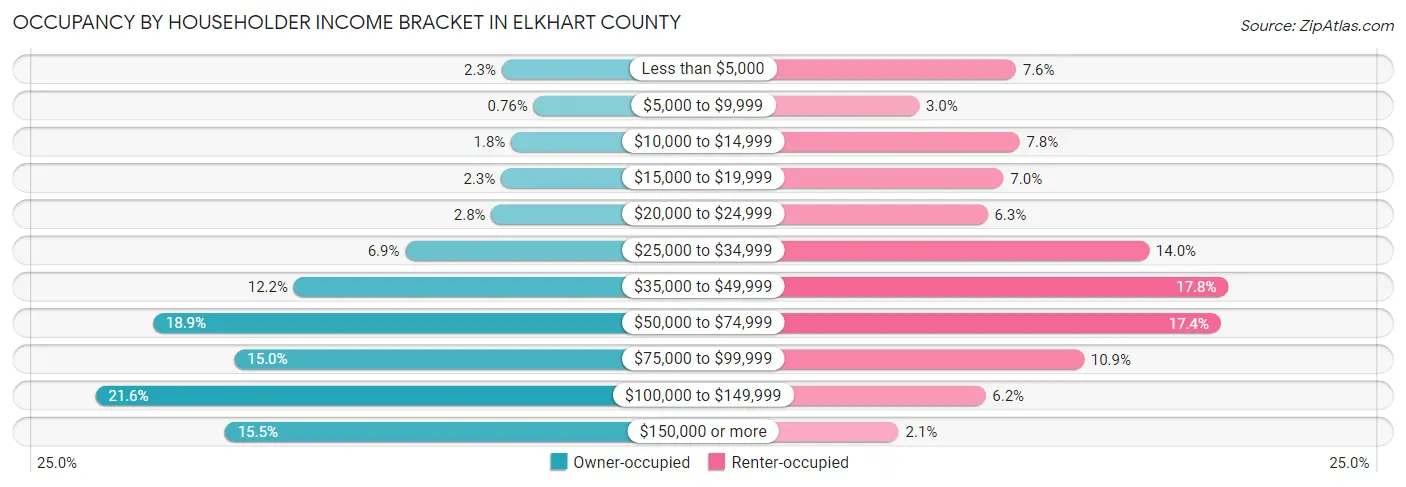
| Income Bracket | Owner-occupied | Renter-occupied |
| Less than $5,000 | 1,167 (2.3%) | 1,575 (7.6%) |
| $5,000 to $9,999 | 390 (0.8%) | 623 (3.0%) |
| $10,000 to $14,999 | 936 (1.8%) | 1,611 (7.8%) |
| $15,000 to $19,999 | 1,180 (2.3%) | 1,452 (7.0%) |
| $20,000 to $24,999 | 1,415 (2.8%) | 1,296 (6.3%) |
| $25,000 to $34,999 | 3,513 (6.9%) | 2,883 (14.0%) |
| $35,000 to $49,999 | 6,224 (12.2%) | 3,663 (17.7%) |
| $50,000 to $74,999 | 9,655 (18.9%) | 3,589 (17.4%) |
| $75,000 to $99,999 | 7,673 (15.0%) | 2,243 (10.9%) |
| $100,000 to $149,999 | 11,056 (21.6%) | 1,275 (6.2%) |
| $150,000 or more | 7,909 (15.5%) | 423 (2.1%) |
| Total | 51,118 (100.0%) | 20,633 (100.0%) |
Monthly Housing Cost Tiers in Elkhart County
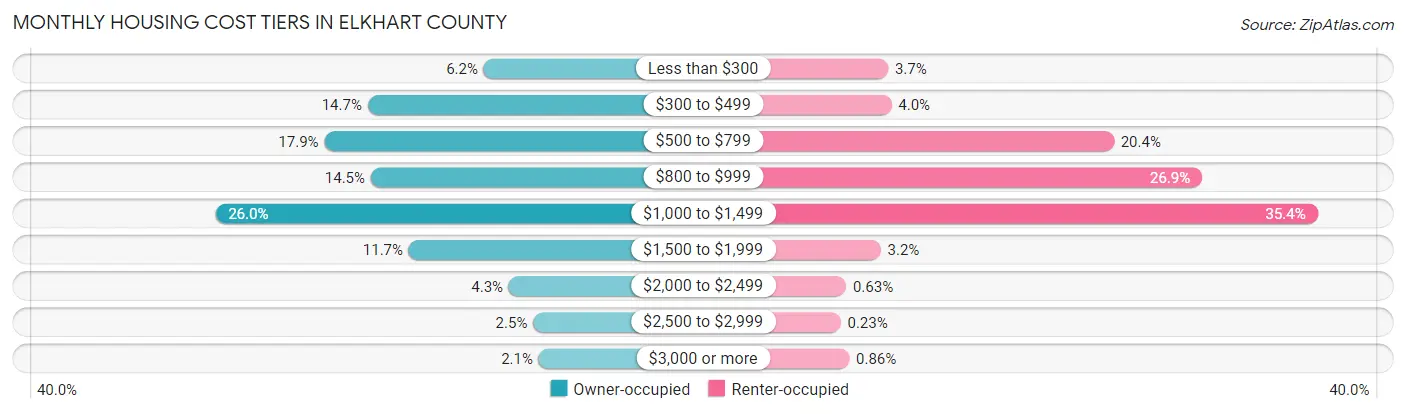
| Monthly Cost | Owner-occupied | Renter-occupied |
| Less than $300 | 3,161 (6.2%) | 768 (3.7%) |
| $300 to $499 | 7,529 (14.7%) | 819 (4.0%) |
| $500 to $799 | 9,162 (17.9%) | 4,199 (20.3%) |
| $800 to $999 | 7,413 (14.5%) | 5,539 (26.9%) |
| $1,000 to $1,499 | 13,271 (26.0%) | 7,295 (35.4%) |
| $1,500 to $1,999 | 5,982 (11.7%) | 657 (3.2%) |
| $2,000 to $2,499 | 2,214 (4.3%) | 131 (0.6%) |
| $2,500 to $2,999 | 1,297 (2.5%) | 47 (0.2%) |
| $3,000 or more | 1,089 (2.1%) | 178 (0.9%) |
| Total | 51,118 (100.0%) | 20,633 (100.0%) |
Physical Housing Characteristics in Elkhart County
Housing Structures in Elkhart County
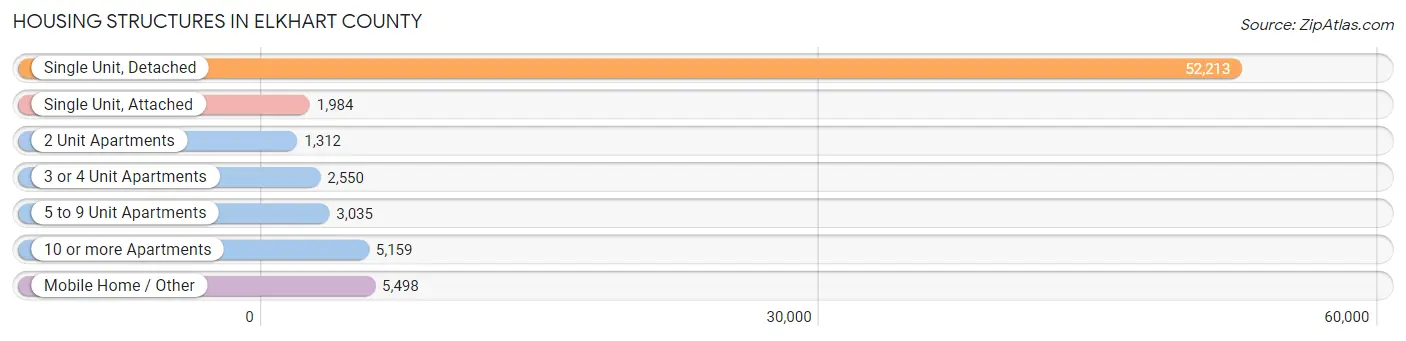
| Structure Type | # Housing Units | % Housing Units |
| Single Unit, Detached | 52,213 | 72.8% |
| Single Unit, Attached | 1,984 | 2.8% |
| 2 Unit Apartments | 1,312 | 1.8% |
| 3 or 4 Unit Apartments | 2,550 | 3.5% |
| 5 to 9 Unit Apartments | 3,035 | 4.2% |
| 10 or more Apartments | 5,159 | 7.2% |
| Mobile Home / Other | 5,498 | 7.7% |
| Total | 71,751 | 100.0% |
Housing Structures by Occupancy in Elkhart County
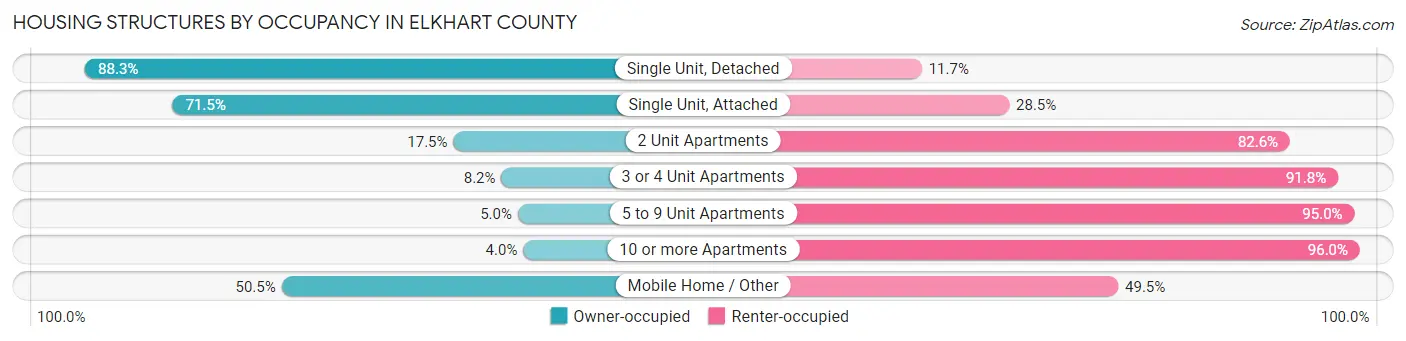
| Structure Type | Owner-occupied | Renter-occupied |
| Single Unit, Detached | 46,124 (88.3%) | 6,089 (11.7%) |
| Single Unit, Attached | 1,419 (71.5%) | 565 (28.5%) |
| 2 Unit Apartments | 229 (17.4%) | 1,083 (82.6%) |
| 3 or 4 Unit Apartments | 209 (8.2%) | 2,341 (91.8%) |
| 5 to 9 Unit Apartments | 153 (5.0%) | 2,882 (95.0%) |
| 10 or more Apartments | 206 (4.0%) | 4,953 (96.0%) |
| Mobile Home / Other | 2,778 (50.5%) | 2,720 (49.5%) |
| Total | 51,118 (71.2%) | 20,633 (28.8%) |
Housing Structures by Number of Rooms in Elkhart County
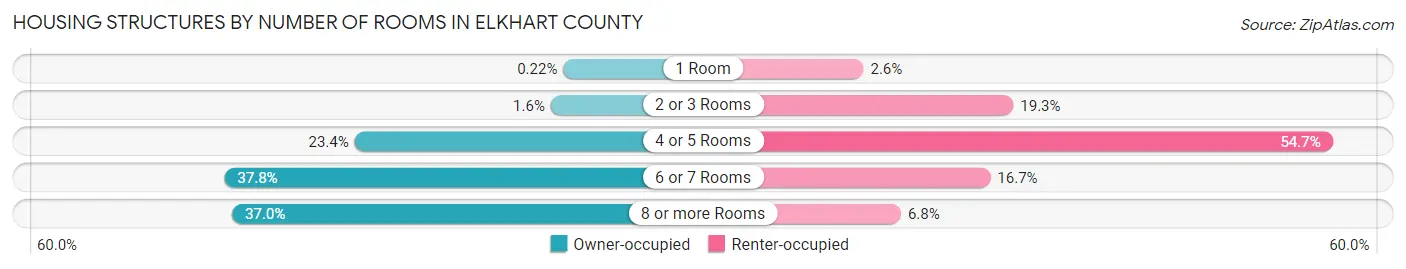
| Number of Rooms | Owner-occupied | Renter-occupied |
| 1 Room | 111 (0.2%) | 540 (2.6%) |
| 2 or 3 Rooms | 825 (1.6%) | 3,971 (19.3%) |
| 4 or 5 Rooms | 11,950 (23.4%) | 11,278 (54.7%) |
| 6 or 7 Rooms | 19,331 (37.8%) | 3,445 (16.7%) |
| 8 or more Rooms | 18,901 (37.0%) | 1,399 (6.8%) |
| Total | 51,118 (100.0%) | 20,633 (100.0%) |
Housing Structure by Heating Type in Elkhart County
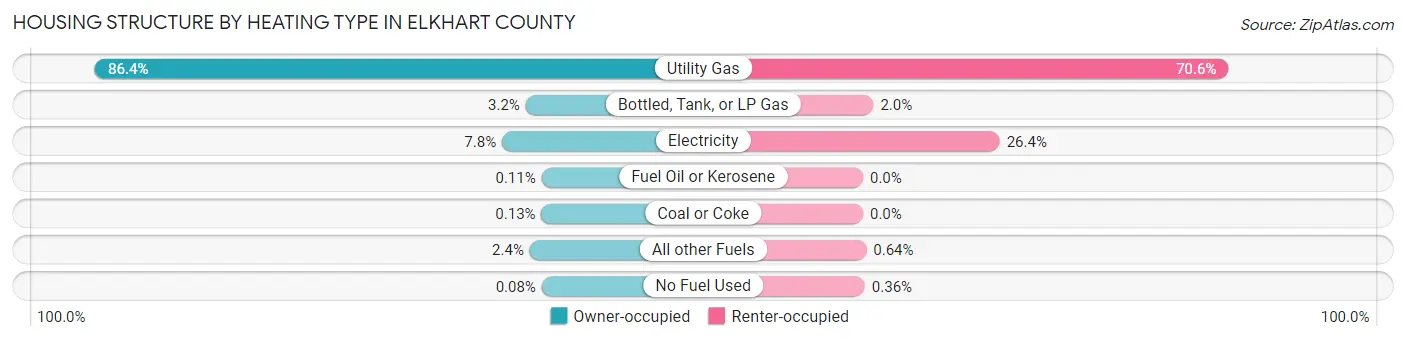
| Heating Type | Owner-occupied | Renter-occupied |
| Utility Gas | 44,143 (86.4%) | 14,559 (70.6%) |
| Bottled, Tank, or LP Gas | 1,625 (3.2%) | 417 (2.0%) |
| Electricity | 3,963 (7.7%) | 5,449 (26.4%) |
| Fuel Oil or Kerosene | 58 (0.1%) | 0 (0.0%) |
| Coal or Coke | 65 (0.1%) | 0 (0.0%) |
| All other Fuels | 1,221 (2.4%) | 133 (0.6%) |
| No Fuel Used | 43 (0.1%) | 75 (0.4%) |
| Total | 51,118 (100.0%) | 20,633 (100.0%) |
Household Vehicle Usage in Elkhart County
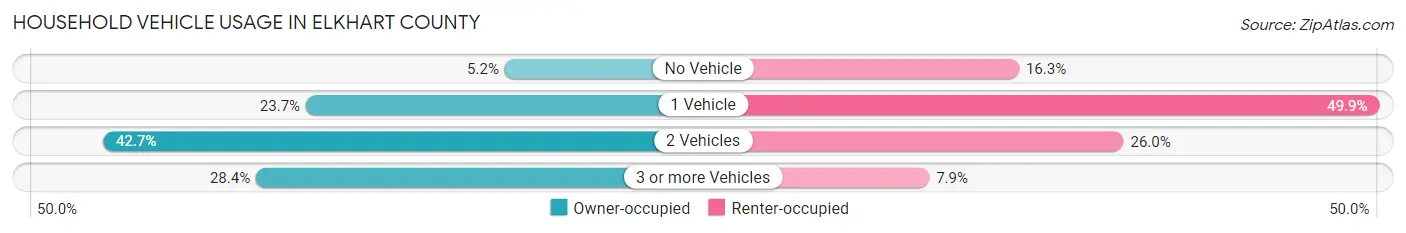
| Vehicles per Household | Owner-occupied | Renter-occupied |
| No Vehicle | 2,649 (5.2%) | 3,352 (16.3%) |
| 1 Vehicle | 12,134 (23.7%) | 10,291 (49.9%) |
| 2 Vehicles | 21,818 (42.7%) | 5,366 (26.0%) |
| 3 or more Vehicles | 14,517 (28.4%) | 1,624 (7.9%) |
| Total | 51,118 (100.0%) | 20,633 (100.0%) |
Real Estate & Mortgages in Elkhart County
Real Estate and Mortgage Overview in Elkhart County
| Characteristic | Without Mortgage | With Mortgage |
| Housing Units | 18,047 | 33,071 |
| Median Property Value | $173,200 | $186,500 |
| Median Household Income | $63,110 | $5,670 |
| Monthly Housing Costs | $465 | $1,089 |
| Real Estate Taxes | $1,421 | $530 |
Property Value by Mortgage Status in Elkhart County
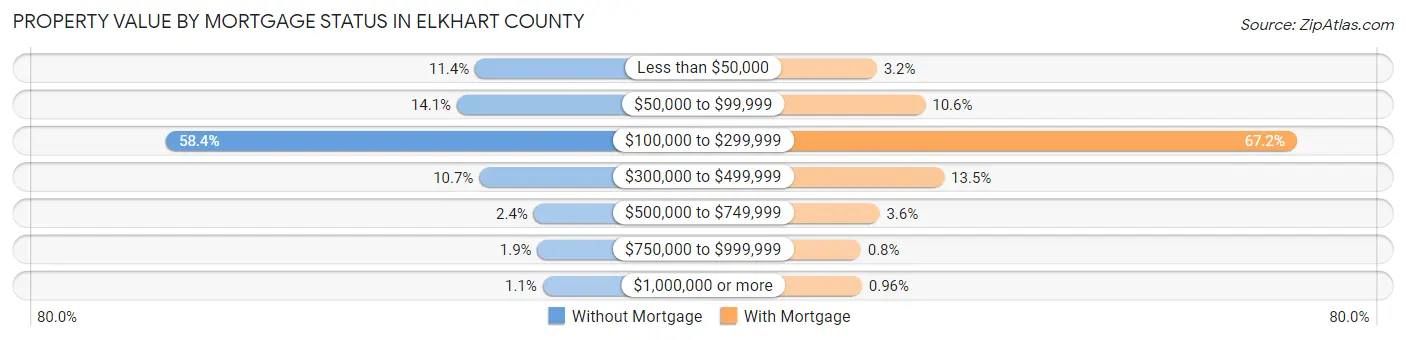
| Property Value | Without Mortgage | With Mortgage |
| Less than $50,000 | 2,051 (11.4%) | 1,069 (3.2%) |
| $50,000 to $99,999 | 2,549 (14.1%) | 3,514 (10.6%) |
| $100,000 to $299,999 | 10,547 (58.4%) | 22,235 (67.2%) |
| $300,000 to $499,999 | 1,937 (10.7%) | 4,463 (13.5%) |
| $500,000 to $749,999 | 437 (2.4%) | 1,205 (3.6%) |
| $750,000 to $999,999 | 336 (1.9%) | 266 (0.8%) |
| $1,000,000 or more | 190 (1.1%) | 319 (1.0%) |
| Total | 18,047 (100.0%) | 33,071 (100.0%) |
Household Income by Mortgage Status in Elkhart County
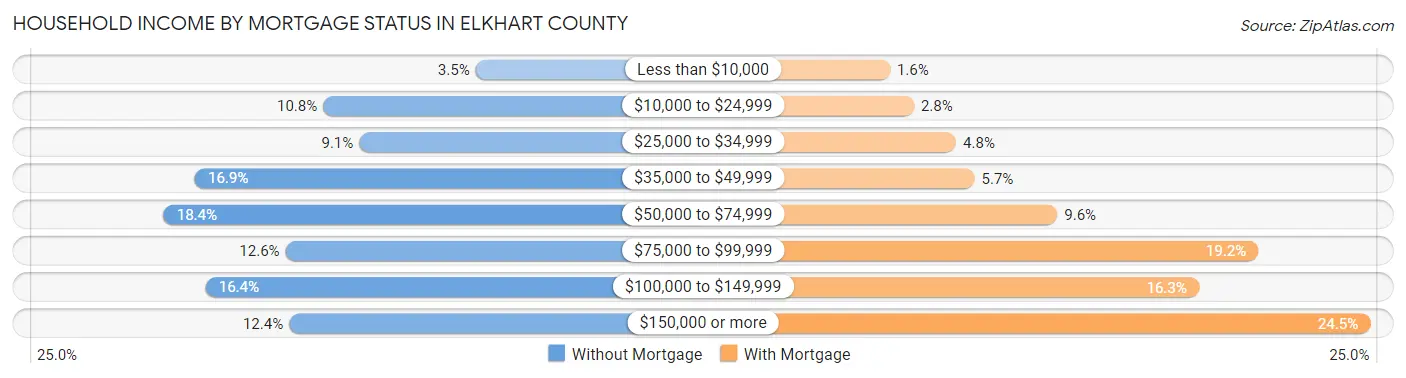
| Household Income | Without Mortgage | With Mortgage |
| Less than $10,000 | 637 (3.5%) | 543 (1.6%) |
| $10,000 to $24,999 | 1,947 (10.8%) | 920 (2.8%) |
| $25,000 to $34,999 | 1,637 (9.1%) | 1,584 (4.8%) |
| $35,000 to $49,999 | 3,046 (16.9%) | 1,876 (5.7%) |
| $50,000 to $74,999 | 3,316 (18.4%) | 3,178 (9.6%) |
| $75,000 to $99,999 | 2,270 (12.6%) | 6,339 (19.2%) |
| $100,000 to $149,999 | 2,955 (16.4%) | 5,403 (16.3%) |
| $150,000 or more | 2,239 (12.4%) | 8,101 (24.5%) |
| Total | 18,047 (100.0%) | 33,071 (100.0%) |
Property Value to Household Income Ratio in Elkhart County
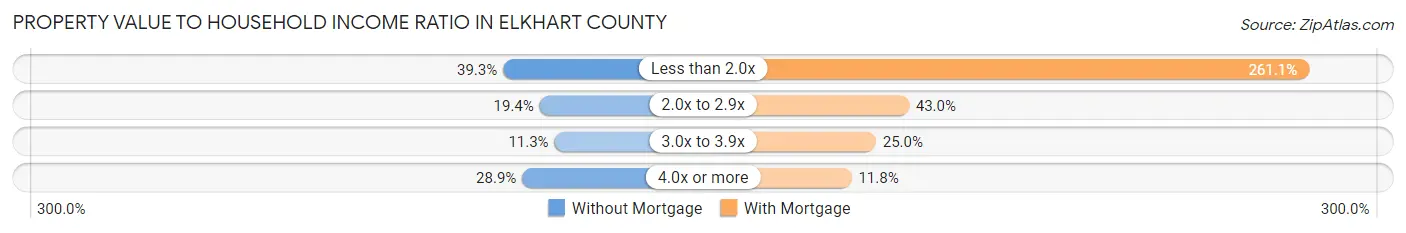
| Value-to-Income Ratio | Without Mortgage | With Mortgage |
| Less than 2.0x | 7,099 (39.3%) | 86,338 (261.1%) |
| 2.0x to 2.9x | 3,502 (19.4%) | 14,207 (43.0%) |
| 3.0x to 3.9x | 2,045 (11.3%) | 8,265 (25.0%) |
| 4.0x or more | 5,219 (28.9%) | 3,885 (11.7%) |
| Total | 18,047 (100.0%) | 33,071 (100.0%) |
Real Estate Taxes by Mortgage Status in Elkhart County
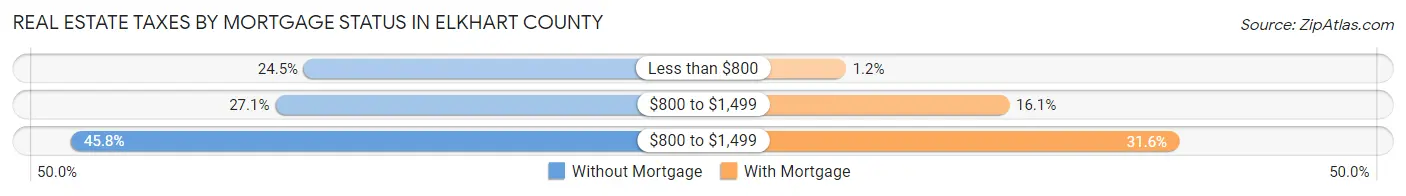
| Property Taxes | Without Mortgage | With Mortgage |
| Less than $800 | 4,420 (24.5%) | 384 (1.2%) |
| $800 to $1,499 | 4,893 (27.1%) | 5,316 (16.1%) |
| $800 to $1,499 | 8,258 (45.8%) | 10,444 (31.6%) |
| Total | 18,047 (100.0%) | 33,071 (100.0%) |
Health & Disability in Elkhart County
Health Insurance Coverage by Age in Elkhart County
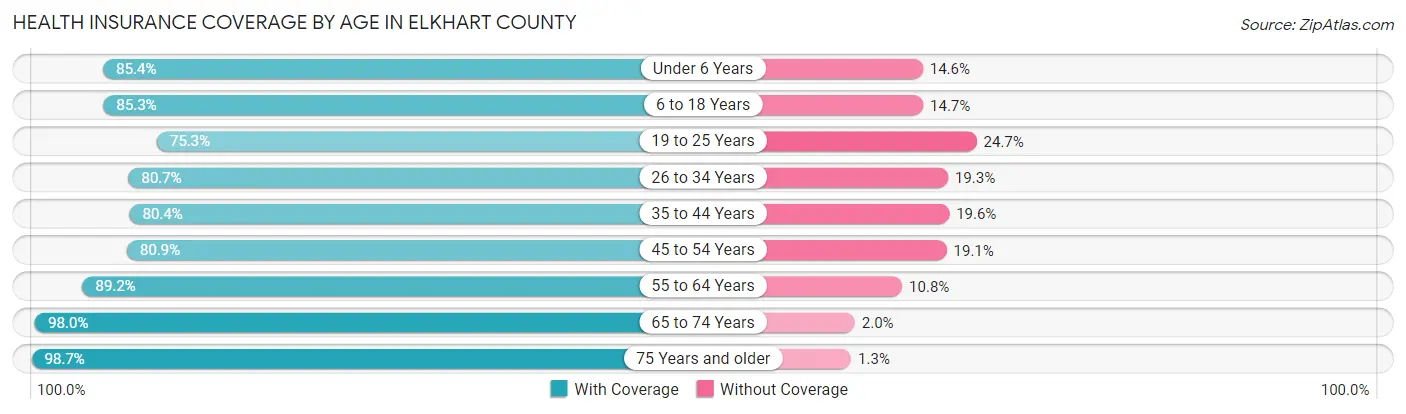
| Age Bracket | With Coverage | Without Coverage |
| Under 6 Years | 15,347 (85.4%) | 2,632 (14.6%) |
| 6 to 18 Years | 35,213 (85.3%) | 6,070 (14.7%) |
| 19 to 25 Years | 14,131 (75.3%) | 4,628 (24.7%) |
| 26 to 34 Years | 18,889 (80.7%) | 4,530 (19.3%) |
| 35 to 44 Years | 19,667 (80.4%) | 4,782 (19.6%) |
| 45 to 54 Years | 19,885 (80.9%) | 4,690 (19.1%) |
| 55 to 64 Years | 21,423 (89.2%) | 2,592 (10.8%) |
| 65 to 74 Years | 17,506 (98.0%) | 350 (2.0%) |
| 75 Years and older | 12,070 (98.7%) | 157 (1.3%) |
| Total | 174,131 (85.1%) | 30,431 (14.9%) |
Health Insurance Coverage by Citizenship Status in Elkhart County
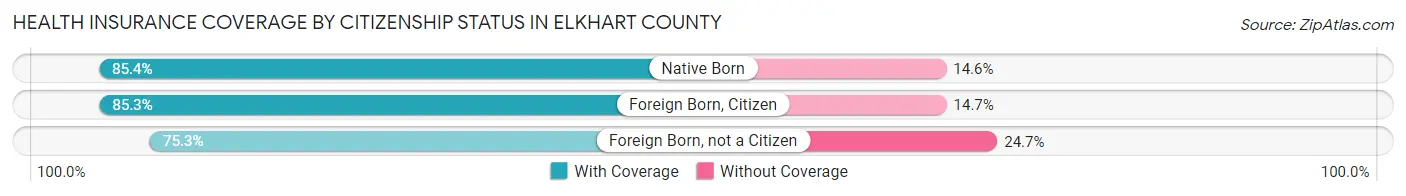
| Citizenship Status | With Coverage | Without Coverage |
| Native Born | 15,347 (85.4%) | 2,632 (14.6%) |
| Foreign Born, Citizen | 35,213 (85.3%) | 6,070 (14.7%) |
| Foreign Born, not a Citizen | 14,131 (75.3%) | 4,628 (24.7%) |
Health Insurance Coverage by Household Income in Elkhart County
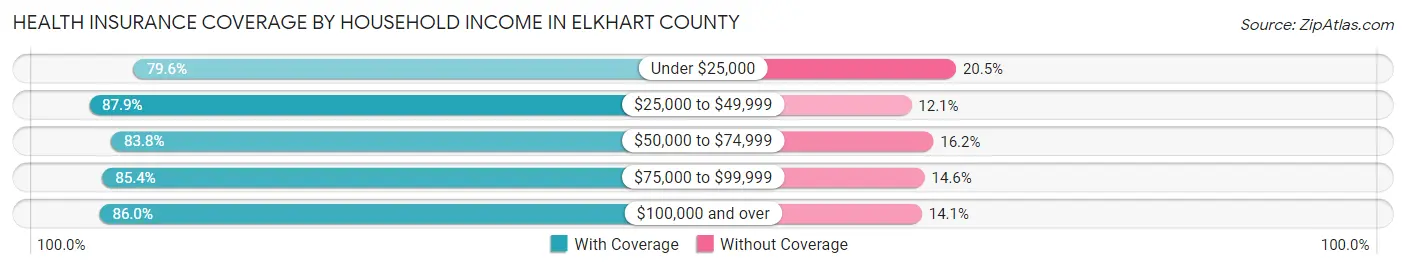
| Household Income | With Coverage | Without Coverage |
| Under $25,000 | 17,480 (79.5%) | 4,494 (20.4%) |
| $25,000 to $49,999 | 32,244 (87.9%) | 4,437 (12.1%) |
| $50,000 to $74,999 | 31,040 (83.8%) | 6,004 (16.2%) |
| $75,000 to $99,999 | 29,025 (85.4%) | 4,956 (14.6%) |
| $100,000 and over | 63,549 (86.0%) | 10,388 (14.1%) |
Public vs Private Health Insurance Coverage by Age in Elkhart County
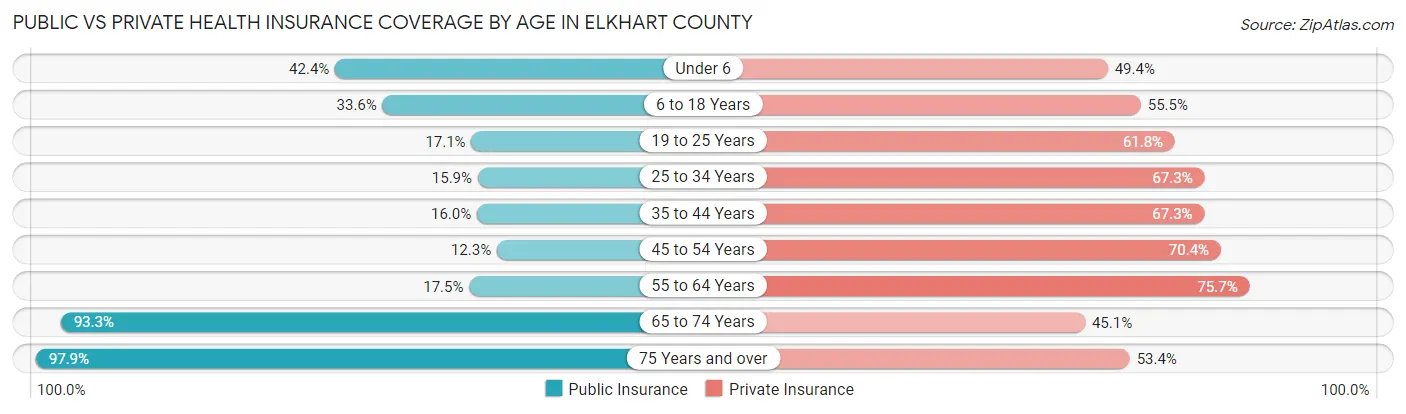
| Age Bracket | Public Insurance | Private Insurance |
| Under 6 | 7,616 (42.4%) | 8,874 (49.4%) |
| 6 to 18 Years | 13,851 (33.6%) | 22,913 (55.5%) |
| 19 to 25 Years | 3,200 (17.1%) | 11,598 (61.8%) |
| 25 to 34 Years | 3,716 (15.9%) | 15,769 (67.3%) |
| 35 to 44 Years | 3,916 (16.0%) | 16,455 (67.3%) |
| 45 to 54 Years | 3,027 (12.3%) | 17,291 (70.4%) |
| 55 to 64 Years | 4,194 (17.5%) | 18,172 (75.7%) |
| 65 to 74 Years | 16,657 (93.3%) | 8,061 (45.1%) |
| 75 Years and over | 11,971 (97.9%) | 6,534 (53.4%) |
| Total | 68,148 (33.3%) | 125,667 (61.4%) |
Disability Status by Sex by Age in Elkhart County
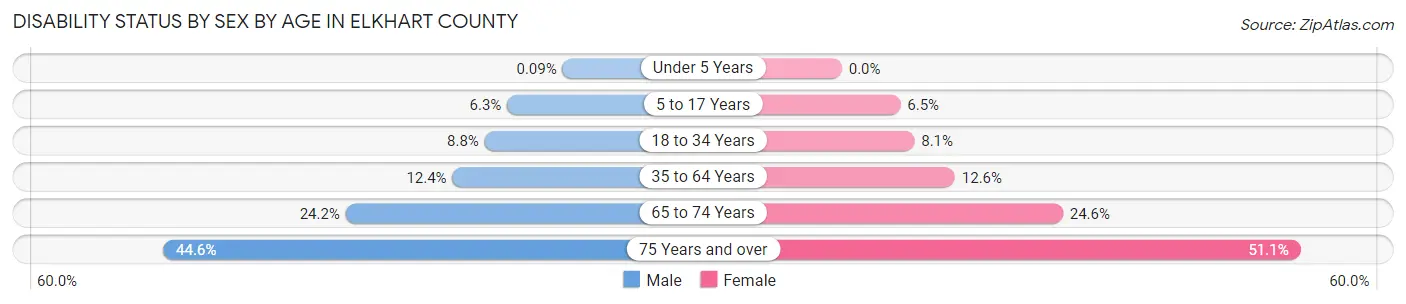
| Age Bracket | Male | Female |
| Under 5 Years | 7 (0.1%) | 0 (0.0%) |
| 5 to 17 Years | 1,314 (6.3%) | 1,336 (6.5%) |
| 18 to 34 Years | 1,992 (8.8%) | 1,789 (8.1%) |
| 35 to 64 Years | 4,502 (12.3%) | 4,605 (12.6%) |
| 65 to 74 Years | 2,064 (24.2%) | 2,299 (24.6%) |
| 75 Years and over | 2,181 (44.6%) | 3,746 (51.1%) |
Disability Class by Sex by Age in Elkhart County
Disability Class: Hearing Difficulty
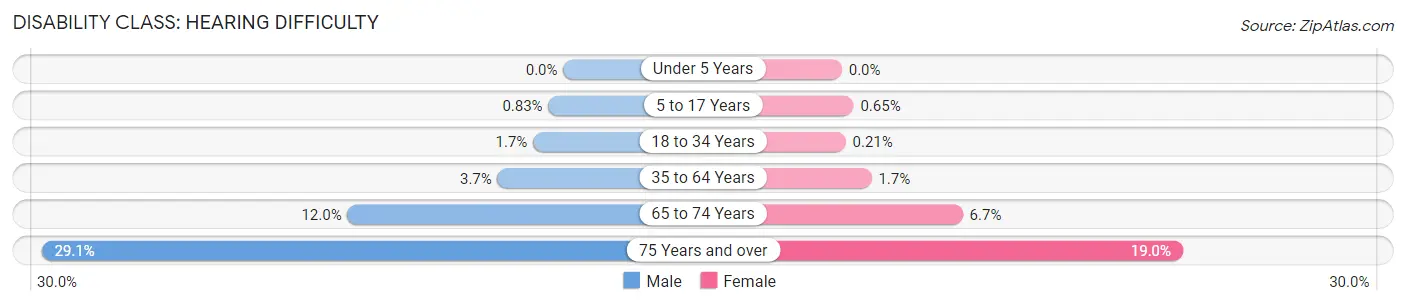
| Age Bracket | Male | Female |
| Under 5 Years | 0 (0.0%) | 0 (0.0%) |
| 5 to 17 Years | 174 (0.8%) | 134 (0.6%) |
| 18 to 34 Years | 382 (1.7%) | 46 (0.2%) |
| 35 to 64 Years | 1,334 (3.7%) | 605 (1.7%) |
| 65 to 74 Years | 1,024 (12.0%) | 629 (6.7%) |
| 75 Years and over | 1,422 (29.1%) | 1,393 (19.0%) |
Disability Class: Vision Difficulty
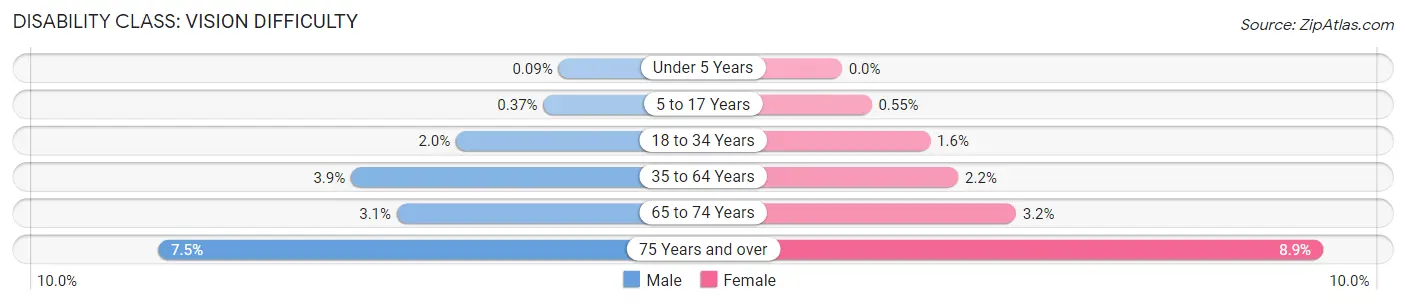
| Age Bracket | Male | Female |
| Under 5 Years | 7 (0.1%) | 0 (0.0%) |
| 5 to 17 Years | 78 (0.4%) | 112 (0.5%) |
| 18 to 34 Years | 452 (2.0%) | 363 (1.6%) |
| 35 to 64 Years | 1,436 (3.9%) | 790 (2.2%) |
| 65 to 74 Years | 263 (3.1%) | 302 (3.2%) |
| 75 Years and over | 368 (7.5%) | 655 (8.9%) |
Disability Class: Cognitive Difficulty
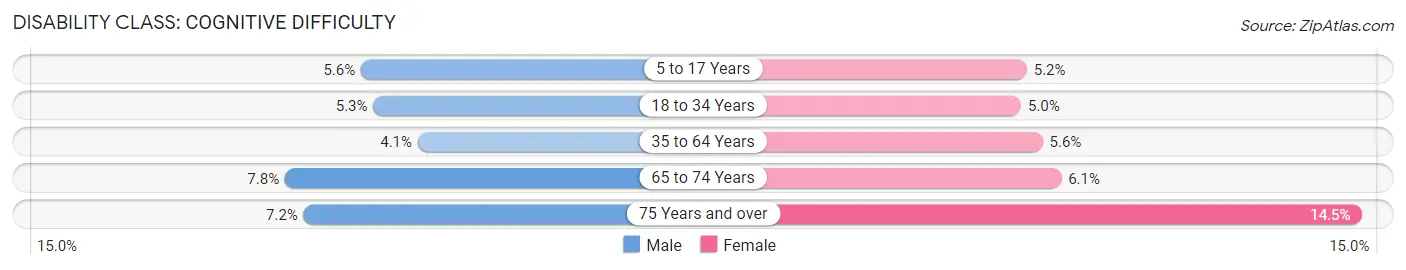
| Age Bracket | Male | Female |
| 5 to 17 Years | 1,181 (5.6%) | 1,055 (5.1%) |
| 18 to 34 Years | 1,203 (5.3%) | 1,107 (5.0%) |
| 35 to 64 Years | 1,478 (4.1%) | 2,047 (5.6%) |
| 65 to 74 Years | 660 (7.7%) | 571 (6.1%) |
| 75 Years and over | 354 (7.2%) | 1,063 (14.5%) |
Disability Class: Ambulatory Difficulty
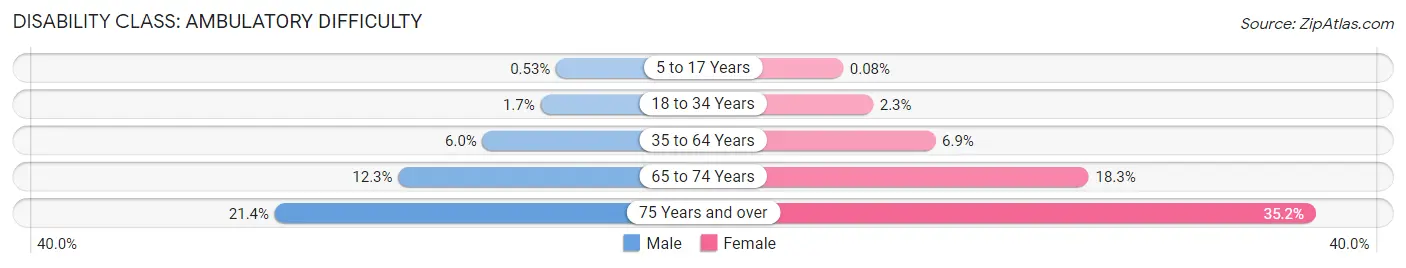
| Age Bracket | Male | Female |
| 5 to 17 Years | 111 (0.5%) | 16 (0.1%) |
| 18 to 34 Years | 384 (1.7%) | 509 (2.3%) |
| 35 to 64 Years | 2,184 (6.0%) | 2,534 (6.9%) |
| 65 to 74 Years | 1,043 (12.2%) | 1,711 (18.3%) |
| 75 Years and over | 1,048 (21.4%) | 2,581 (35.2%) |
Disability Class: Self-Care Difficulty
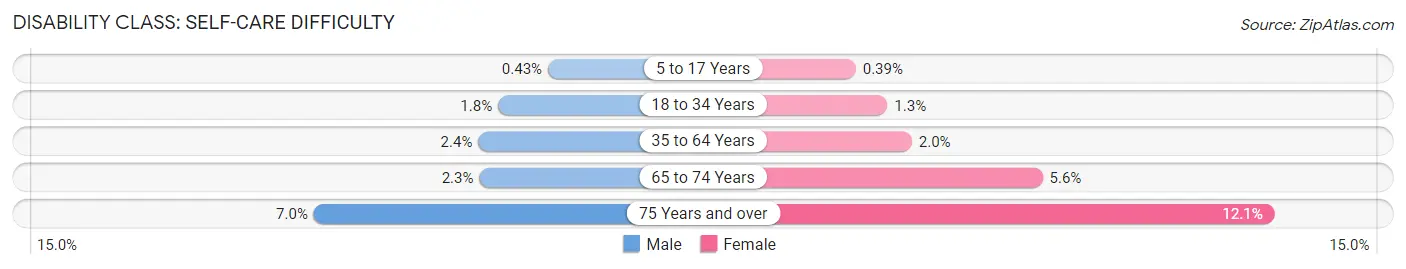
| Age Bracket | Male | Female |
| 5 to 17 Years | 91 (0.4%) | 79 (0.4%) |
| 18 to 34 Years | 415 (1.8%) | 281 (1.3%) |
| 35 to 64 Years | 865 (2.4%) | 712 (1.9%) |
| 65 to 74 Years | 199 (2.3%) | 522 (5.6%) |
| 75 Years and over | 340 (7.0%) | 884 (12.0%) |
Technology Access in Elkhart County
Computing Device Access in Elkhart County
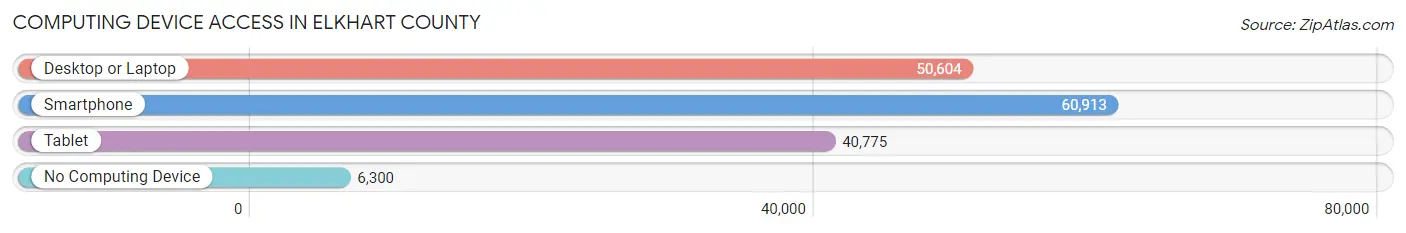
| Device Type | # Households | % Households |
| Desktop or Laptop | 50,604 | 70.5% |
| Smartphone | 60,913 | 84.9% |
| Tablet | 40,775 | 56.8% |
| No Computing Device | 6,300 | 8.8% |
| Total | 71,751 | 100.0% |
Internet Access in Elkhart County
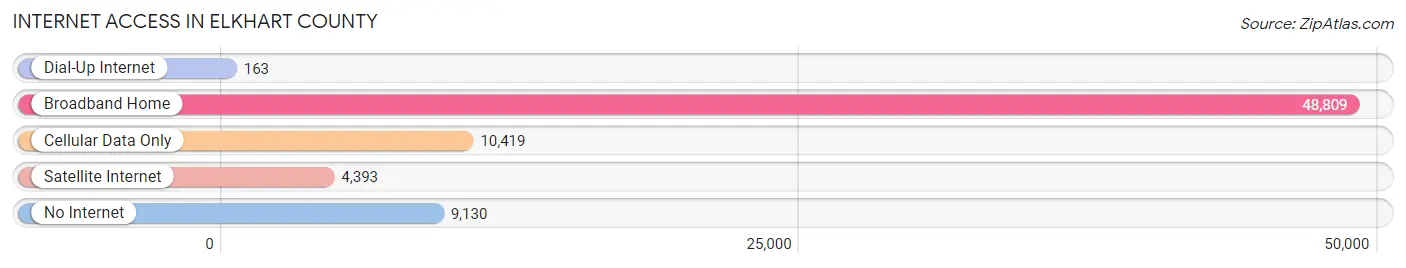
| Internet Type | # Households | % Households |
| Dial-Up Internet | 163 | 0.2% |
| Broadband Home | 48,809 | 68.0% |
| Cellular Data Only | 10,419 | 14.5% |
| Satellite Internet | 4,393 | 6.1% |
| No Internet | 9,130 | 12.7% |
| Total | 71,751 | 100.0% |
Elkhart County Summary
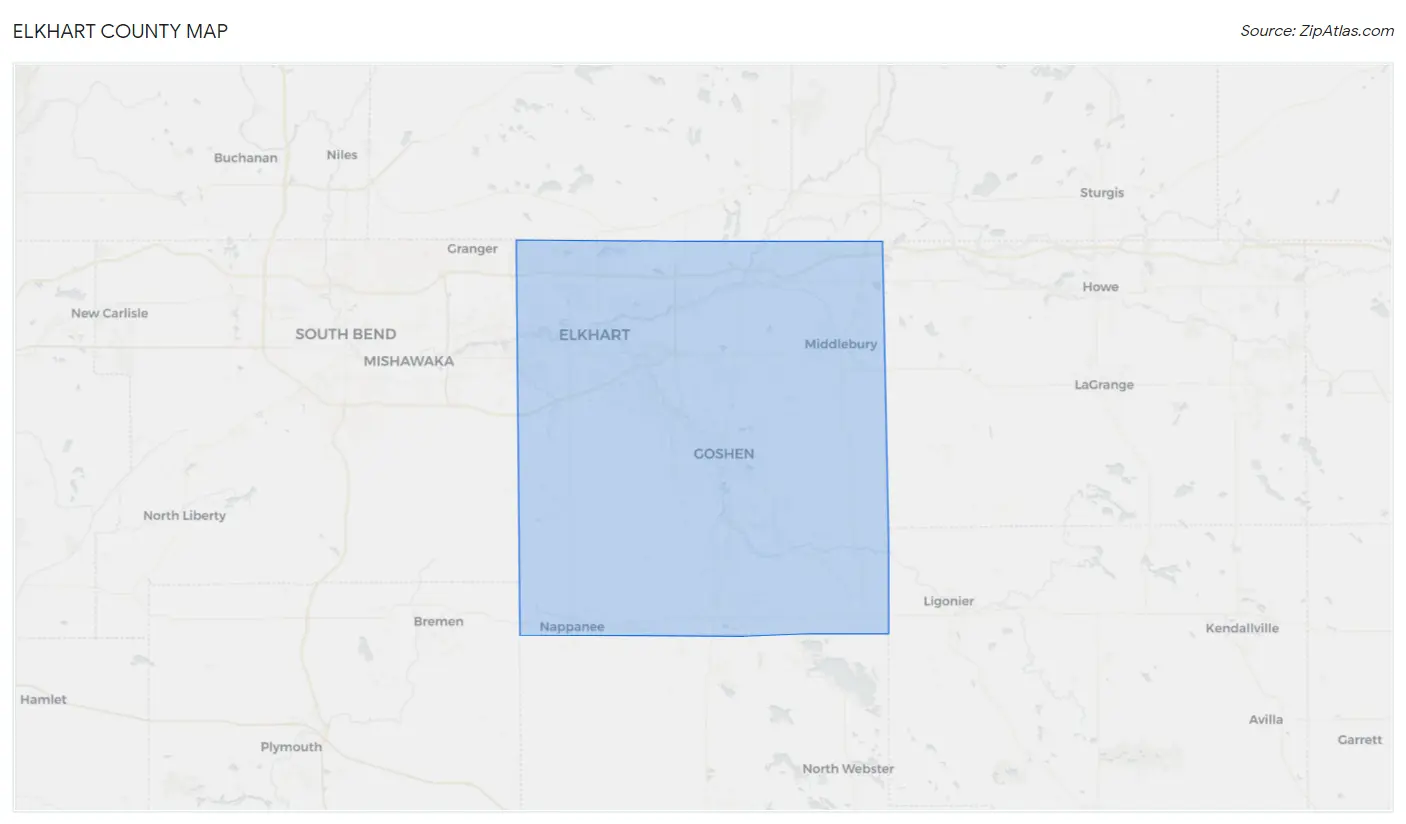
Elkhart County, Indiana is located in the northern part of the state, just east of the Michigan border. It is part of the South Bend-Elkhart-Mishawaka metropolitan area, and is the second most populous county in Indiana. The county seat is Goshen, and the largest city is Elkhart.
History
Elkhart County was formed in 1830 from parts of St. Joseph and LaGrange counties. It was named after the Elkhart River, which was named by French traders in the late 1700s. The county was originally home to the Potawatomi and Miami Native American tribes.
In the mid-1800s, the county experienced a period of rapid growth due to the construction of the Michigan Central Railroad. This led to the development of several small towns, including Elkhart, Goshen, and Nappanee.
In the late 1800s, the county became a major center for the production of carriages and wagons. This industry was replaced by the production of automobiles in the early 1900s. The county also became a major center for the production of recreational vehicles in the 1950s.
Geography
Elkhart County is located in the northern part of Indiana, just east of the Michigan border. It is bordered by St. Joseph County to the north, LaGrange County to the east, Kosciusko County to the south, and Marshall County to the west.
The county has a total area of 545 square miles, of which 543 square miles is land and 2 square miles is water. The terrain is generally flat, with some rolling hills in the northern part of the county. The Elkhart River runs through the county, and there are several small lakes and ponds.
Economy
Elkhart County has a diverse economy, with a mix of manufacturing, agriculture, and services. The county is home to several large companies, including recreational vehicle manufacturer Thor Industries, musical instrument manufacturer Conn-Selmer, and medical device manufacturer Zimmer Biomet.
Agriculture is also an important part of the county’s economy. The county is home to several large farms, and the main crops grown are corn, soybeans, and wheat.
Demographics
As of the 2010 census, Elkhart County had a population of 197,559. The population was spread out with a median age of 37.7 years. The racial makeup of the county was 87.2% White, 8.2% African American, 0.7% Native American, 1.2% Asian, 0.1% Pacific Islander, 1.3% from other races, and 1.5% from two or more races. Hispanic or Latino of any race were 4.2% of the population.
The median household income was $48,945, and the median family income was $58,945. The per capita income was $24,845. About 8.7% of the population was below the poverty line.
Elkhart County is a diverse and vibrant community, with a strong economy and a rich history. It is home to several large companies, and is a major center for the production of recreational vehicles. The county is also home to several large farms, and is a major producer of corn, soybeans, and wheat. The population is diverse, with a mix of races and ethnicities. Elkhart County is a great place to live, work, and play.
Common Questions
What is Per Capita Income in Elkhart County?
Per Capita income in Elkhart County is $30,708.
What is the Median Family Income in Elkhart County?
Median Family Income in Elkhart County is $78,757.
What is the Median Household income in Elkhart County?
Median Household Income in Elkhart County is $63,978.
What is Income or Wage Gap in Elkhart County?
Income or Wage Gap in Elkhart County is 38.1%.
Women in Elkhart County earn 61.9 cents for every dollar earned by a man.
What is Family Income Deficit in Elkhart County?
Family Income Deficit in Elkhart County is $12,410.
Families that are below poverty line in Elkhart County earn $12,410 less on average than the poverty threshold level.
What is Inequality or Gini Index in Elkhart County?
Inequality or Gini Index in Elkhart County is 0.44.
What is the Total Population of Elkhart County?
Total Population of Elkhart County is 206,841.
What is the Total Male Population of Elkhart County?
Total Male Population of Elkhart County is 102,604.
What is the Total Female Population of Elkhart County?
Total Female Population of Elkhart County is 104,237.
What is the Ratio of Males per 100 Females in Elkhart County?
There are 98.43 Males per 100 Females in Elkhart County.
What is the Ratio of Females per 100 Males in Elkhart County?
There are 101.59 Females per 100 Males in Elkhart County.
What is the Median Population Age in Elkhart County?
Median Population Age in Elkhart County is 35.6 Years.
What is the Average Family Size in Elkhart County
Average Family Size in Elkhart County is 3.5 People.
What is the Average Household Size in Elkhart County
Average Household Size in Elkhart County is 2.8 People.
How Large is the Labor Force in Elkhart County?
There are 102,844 People in the Labor Forcein in Elkhart County.
What is the Percentage of People in the Labor Force in Elkhart County?
65.6% of People are in the Labor Force in Elkhart County.
What is the Unemployment Rate in Elkhart County?
Unemployment Rate in Elkhart County is 3.8%.