Zip Codes with the Lowest Poverty Level Among Single Mothers in Iowa
RELATED REPORTS & OPTIONS
Lowest Poverty | Single Mother
Iowa
Compare Zip Codes
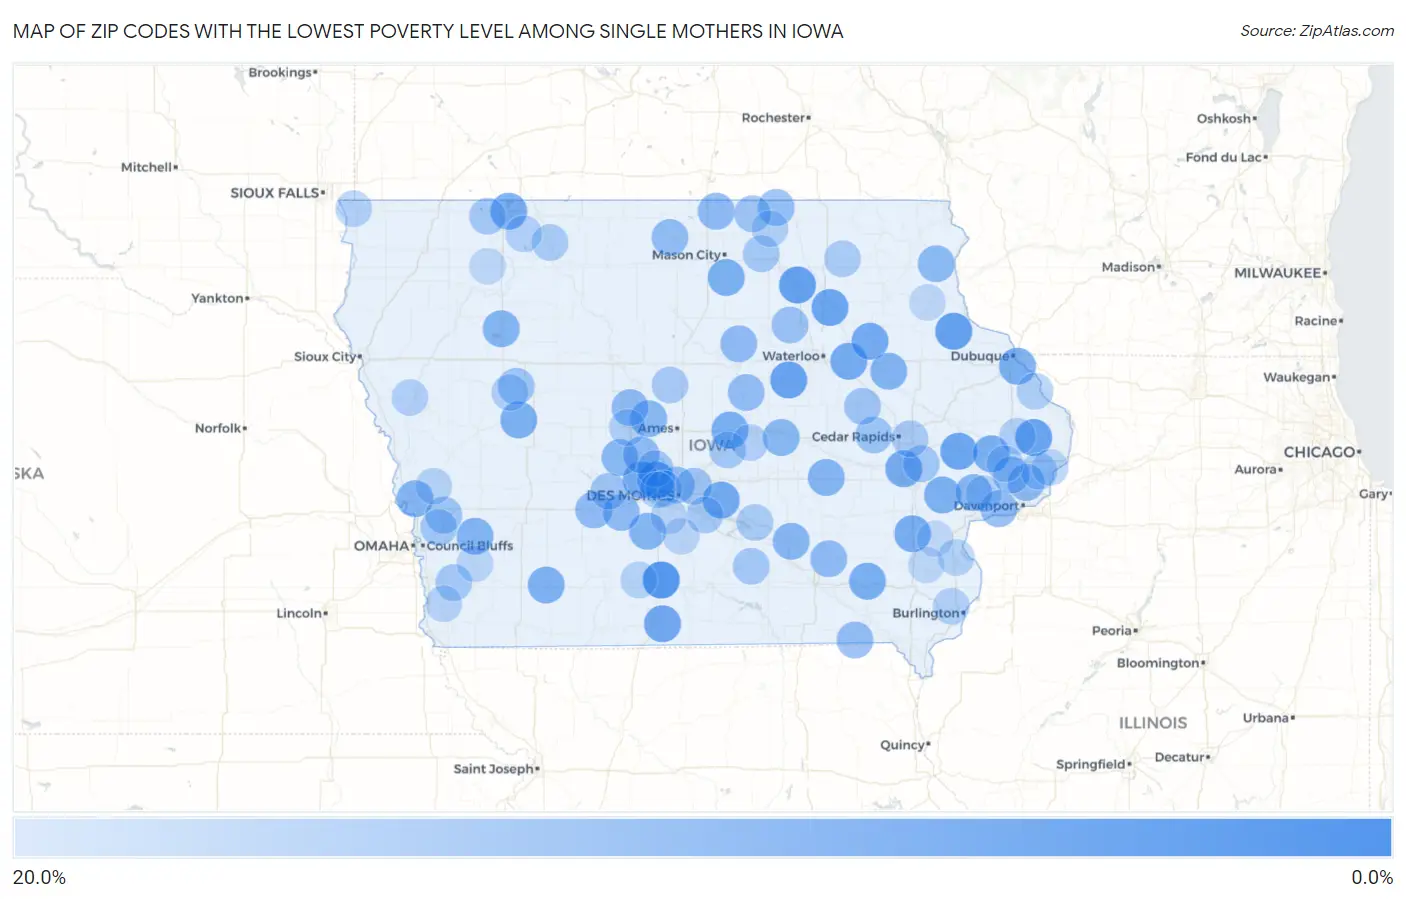
Map of Zip Codes with the Lowest Poverty Level Among Single Mothers in Iowa
20.0%
0.0%
Zip Codes with the Lowest Poverty Level Among Single Mothers in Iowa
| Zip Code | Single Mother Poverty | vs State | vs National | |
| 1. | 50213 | 0.49% | 32.4%(-31.9)#1 | 33.1%(-32.7)#2 |
| 2. | 50111 | 2.5% | 32.4%(-29.9)#2 | 33.1%(-30.6)#119 |
| 3. | 50658 | 2.7% | 32.4%(-29.7)#3 | 33.1%(-30.4)#143 |
| 4. | 52035 | 2.8% | 32.4%(-29.6)#4 | 33.1%(-30.4)#153 |
| 5. | 50669 | 3.2% | 32.4%(-29.2)#5 | 33.1%(-29.9)#205 |
| 6. | 52731 | 3.4% | 32.4%(-29.0)#6 | 33.1%(-29.7)#235 |
| 7. | 50676 | 3.6% | 32.4%(-28.8)#7 | 33.1%(-29.5)#266 |
| 8. | 52337 | 3.7% | 32.4%(-28.7)#8 | 33.1%(-29.4)#275 |
| 9. | 50144 | 4.4% | 32.4%(-28.0)#9 | 33.1%(-28.7)#389 |
| 10. | 50648 | 4.9% | 32.4%(-27.5)#10 | 33.1%(-28.3)#468 |
| 11. | 50228 | 4.9% | 32.4%(-27.5)#11 | 33.1%(-28.3)#470 |
| 12. | 50063 | 5.0% | 32.4%(-27.4)#12 | 33.1%(-28.1)#496 |
| 13. | 50641 | 5.1% | 32.4%(-27.4)#13 | 33.1%(-28.1)#500 |
| 14. | 52317 | 5.4% | 32.4%(-27.0)#14 | 33.1%(-27.8)#573 |
| 15. | 52201 | 5.6% | 32.4%(-26.9)#15 | 33.1%(-27.6)#610 |
| 16. | 51360 | 5.7% | 32.4%(-26.7)#16 | 33.1%(-27.4)#637 |
| 17. | 52556 | 5.8% | 32.4%(-26.6)#17 | 33.1%(-27.3)#656 |
| 18. | 52003 | 6.0% | 32.4%(-26.4)#18 | 33.1%(-27.1)#696 |
| 19. | 50247 | 6.1% | 32.4%(-26.3)#19 | 33.1%(-27.0)#726 |
| 20. | 52777 | 6.1% | 32.4%(-26.3)#20 | 33.1%(-27.0)#731 |
| 21. | 50469 | 6.2% | 32.4%(-26.2)#21 | 33.1%(-26.9)#756 |
| 22. | 52776 | 6.4% | 32.4%(-26.0)#22 | 33.1%(-26.7)#780 |
| 23. | 51430 | 6.4% | 32.4%(-26.0)#23 | 33.1%(-26.7)#785 |
| 24. | 50841 | 6.7% | 32.4%(-25.7)#24 | 33.1%(-26.5)#828 |
| 25. | 52326 | 7.1% | 32.4%(-25.3)#25 | 33.1%(-26.0)#960 |
| 26. | 51560 | 7.2% | 32.4%(-25.2)#26 | 33.1%(-25.9)#975 |
| 27. | 52778 | 7.5% | 32.4%(-24.9)#27 | 33.1%(-25.6)#1,047 |
| 28. | 51555 | 7.6% | 32.4%(-24.9)#28 | 33.1%(-25.6)#1,053 |
| 29. | 52347 | 7.7% | 32.4%(-24.7)#29 | 33.1%(-25.4)#1,097 |
| 30. | 50218 | 7.7% | 32.4%(-24.7)#30 | 33.1%(-25.4)#1,112 |
| 31. | 50588 | 7.7% | 32.4%(-24.7)#31 | 33.1%(-25.4)#1,116 |
| 32. | 52595 | 8.0% | 32.4%(-24.4)#32 | 33.1%(-25.1)#1,180 |
| 33. | 50036 | 8.2% | 32.4%(-24.2)#33 | 33.1%(-25.0)#1,213 |
| 34. | 50220 | 8.2% | 32.4%(-24.2)#34 | 33.1%(-24.9)#1,225 |
| 35. | 50173 | 8.3% | 32.4%(-24.1)#35 | 33.1%(-24.8)#1,251 |
| 36. | 52159 | 8.7% | 32.4%(-23.7)#36 | 33.1%(-24.4)#1,337 |
| 37. | 50459 | 8.8% | 32.4%(-23.6)#37 | 33.1%(-24.3)#1,373 |
| 38. | 50601 | 9.1% | 32.4%(-23.3)#38 | 33.1%(-24.0)#1,434 |
| 39. | 52563 | 9.1% | 32.4%(-23.3)#39 | 33.1%(-24.0)#1,441 |
| 40. | 50223 | 9.1% | 32.4%(-23.3)#40 | 33.1%(-24.0)#1,462 |
| 41. | 52726 | 9.2% | 32.4%(-23.3)#41 | 33.1%(-24.0)#1,476 |
| 42. | 50250 | 9.2% | 32.4%(-23.2)#42 | 33.1%(-23.9)#1,482 |
| 43. | 52748 | 9.3% | 32.4%(-23.1)#43 | 33.1%(-23.8)#1,505 |
| 44. | 50072 | 9.4% | 32.4%(-23.0)#44 | 33.1%(-23.8)#1,529 |
| 45. | 50276 | 9.4% | 32.4%(-23.0)#45 | 33.1%(-23.8)#1,530 |
| 46. | 50313 | 9.4% | 32.4%(-23.0)#46 | 33.1%(-23.7)#1,541 |
| 47. | 50436 | 9.6% | 32.4%(-22.8)#47 | 33.1%(-23.5)#1,587 |
| 48. | 52746 | 10.0% | 32.4%(-22.4)#48 | 33.1%(-23.1)#1,701 |
| 49. | 52542 | 10.0% | 32.4%(-22.4)#49 | 33.1%(-23.1)#1,714 |
| 50. | 50269 | 10.0% | 32.4%(-22.4)#50 | 33.1%(-23.1)#1,721 |
| 51. | 50476 | 10.3% | 32.4%(-22.1)#51 | 33.1%(-22.8)#1,799 |
| 52. | 50670 | 10.8% | 32.4%(-21.6)#52 | 33.1%(-22.3)#1,922 |
| 53. | 52206 | 11.1% | 32.4%(-21.3)#53 | 33.1%(-22.0)#2,000 |
| 54. | 51450 | 11.1% | 32.4%(-21.3)#54 | 33.1%(-22.0)#2,010 |
| 55. | 51559 | 11.3% | 32.4%(-21.1)#55 | 33.1%(-21.8)#2,091 |
| 56. | 52349 | 11.4% | 32.4%(-21.0)#56 | 33.1%(-21.7)#2,112 |
| 57. | 50233 | 11.4% | 32.4%(-21.0)#57 | 33.1%(-21.7)#2,124 |
| 58. | 50472 | 11.5% | 32.4%(-20.9)#58 | 33.1%(-21.6)#2,147 |
| 59. | 50009 | 11.6% | 32.4%(-20.8)#59 | 33.1%(-21.5)#2,177 |
| 60. | 52333 | 11.8% | 32.4%(-20.7)#60 | 33.1%(-21.4)#2,202 |
| 61. | 50109 | 11.8% | 32.4%(-20.6)#61 | 33.1%(-21.3)#2,235 |
| 62. | 51576 | 12.1% | 32.4%(-20.3)#62 | 33.1%(-21.0)#2,313 |
| 63. | 51347 | 12.5% | 32.4%(-19.9)#63 | 33.1%(-20.6)#2,438 |
| 64. | 51551 | 12.5% | 32.4%(-19.9)#64 | 33.1%(-20.6)#2,439 |
| 65. | 50150 | 12.5% | 32.4%(-19.9)#65 | 33.1%(-20.6)#2,451 |
| 66. | 50118 | 12.5% | 32.4%(-19.9)#66 | 33.1%(-20.6)#2,453 |
| 67. | 50471 | 12.5% | 32.4%(-19.9)#67 | 33.1%(-20.6)#2,455 |
| 68. | 50234 | 12.5% | 32.4%(-19.9)#68 | 33.1%(-20.6)#2,460 |
| 69. | 52403 | 13.1% | 32.4%(-19.4)#69 | 33.1%(-20.1)#2,621 |
| 70. | 50130 | 13.2% | 32.4%(-19.2)#70 | 33.1%(-19.9)#2,668 |
| 71. | 50219 | 13.3% | 32.4%(-19.1)#71 | 33.1%(-19.8)#2,694 |
| 72. | 51342 | 13.3% | 32.4%(-19.1)#72 | 33.1%(-19.8)#2,713 |
| 73. | 52154 | 13.3% | 32.4%(-19.1)#73 | 33.1%(-19.8)#2,725 |
| 74. | 52758 | 13.3% | 32.4%(-19.1)#74 | 33.1%(-19.8)#2,729 |
| 75. | 51466 | 13.6% | 32.4%(-18.8)#75 | 33.1%(-19.5)#2,826 |
| 76. | 52031 | 14.0% | 32.4%(-18.4)#76 | 33.1%(-19.1)#2,967 |
| 77. | 50212 | 14.1% | 32.4%(-18.3)#77 | 33.1%(-19.0)#2,978 |
| 78. | 50322 | 14.3% | 32.4%(-18.1)#78 | 33.1%(-18.9)#3,014 |
| 79. | 50461 | 14.3% | 32.4%(-18.1)#79 | 33.1%(-18.8)#3,031 |
| 80. | 51241 | 14.3% | 32.4%(-18.1)#80 | 33.1%(-18.8)#3,050 |
| 81. | 52037 | 14.3% | 32.4%(-18.1)#81 | 33.1%(-18.8)#3,070 |
| 82. | 52729 | 14.3% | 32.4%(-18.1)#82 | 33.1%(-18.8)#3,071 |
| 83. | 51364 | 14.3% | 32.4%(-18.1)#83 | 33.1%(-18.8)#3,075 |
| 84. | 50120 | 14.3% | 32.4%(-18.1)#84 | 33.1%(-18.8)#3,081 |
| 85. | 51056 | 14.3% | 32.4%(-18.1)#85 | 33.1%(-18.8)#3,085 |
| 86. | 52655 | 14.5% | 32.4%(-17.9)#86 | 33.1%(-18.7)#3,140 |
| 87. | 52730 | 14.6% | 32.4%(-17.8)#87 | 33.1%(-18.6)#3,165 |
| 88. | 50174 | 14.6% | 32.4%(-17.8)#88 | 33.1%(-18.6)#3,169 |
| 89. | 50325 | 14.8% | 32.4%(-17.7)#89 | 33.1%(-18.4)#3,215 |
| 90. | 52653 | 14.8% | 32.4%(-17.6)#90 | 33.1%(-18.3)#3,234 |
| 91. | 51546 | 14.8% | 32.4%(-17.6)#91 | 33.1%(-18.3)#3,235 |
| 92. | 52747 | 15.0% | 32.4%(-17.4)#92 | 33.1%(-18.1)#3,305 |
| 93. | 51653 | 15.0% | 32.4%(-17.4)#93 | 33.1%(-18.1)#3,308 |
| 94. | 50125 | 15.3% | 32.4%(-17.1)#94 | 33.1%(-17.9)#3,393 |
| 95. | 51541 | 15.4% | 32.4%(-17.0)#95 | 33.1%(-17.8)#3,460 |
| 96. | 50211 | 15.5% | 32.4%(-16.9)#96 | 33.1%(-17.6)#3,499 |
| 97. | 52043 | 16.0% | 32.4%(-16.4)#97 | 33.1%(-17.1)#3,661 |
| 98. | 52659 | 16.0% | 32.4%(-16.4)#98 | 33.1%(-17.1)#3,665 |
| 99. | 51357 | 16.0% | 32.4%(-16.4)#99 | 33.1%(-17.1)#3,669 |
| 100. | 52738 | 16.7% | 32.4%(-15.7)#100 | 33.1%(-16.5)#3,867 |
Common Questions
What are the Top 10 Zip Codes with the Lowest Poverty Level Among Single Mothers in Iowa?
Top 10 Zip Codes with the Lowest Poverty Level Among Single Mothers in Iowa are:
What zip code has the Lowest Poverty Level Among Single Mothers in Iowa?
50213 has the Lowest Poverty Level Among Single Mothers in Iowa with 0.49%.
What is the Poverty Level Among Single Mothers in the State of Iowa?
Poverty Level Among Single Mothers in Iowa is 32.4%.
What is the Poverty Level Among Single Mothers in the United States?
Poverty Level Among Single Mothers in the United States is 33.1%.