High Point, FL Map & Demographics
High Point Map
High Point Overview
$30,390
PER CAPITA INCOME
$59,016
AVG FAMILY INCOME
$46,083
AVG HOUSEHOLD INCOME
18.5%
WAGE / INCOME GAP [ % ]
81.5¢/ $1
WAGE / INCOME GAP [ $ ]
0.41
INEQUALITY / GINI INDEX
3,685
TOTAL POPULATION
1,953
MALE POPULATION
1,732
FEMALE POPULATION
112.76
MALES / 100 FEMALES
88.68
FEMALES / 100 MALES
65.0
MEDIAN AGE
2.4
AVG FAMILY SIZE
1.8
AVG HOUSEHOLD SIZE
1,206
LABOR FORCE [ PEOPLE ]
36.5%
PERCENT IN LABOR FORCE
11.5%
UNEMPLOYMENT RATE
Income in High Point
Income Overview in High Point
Per Capita Income in High Point is $30,390, while median incomes of families and households are $59,016 and $46,083 respectively.
| Characteristic | Number | Measure |
| Per Capita Income | 3,685 | $30,390 |
| Median Family Income | 978 | $59,016 |
| Mean Family Income | 978 | $64,738 |
| Median Household Income | 2,054 | $46,083 |
| Mean Household Income | 2,054 | $53,624 |
| Income Deficit | 978 | $0 |
| Wage / Income Gap (%) | 3,685 | 18.53% |
| Wage / Income Gap ($) | 3,685 | 81.47¢ per $1 |
| Gini / Inequality Index | 3,685 | 0.41 |
Earnings by Sex in High Point
Average Earnings in High Point are $43,703, $45,520 for men and $37,083 for women, a difference of 18.5%.

| Sex | Number | Average Earnings |
| Male | 813 (63.6%) | $45,520 |
| Female | 466 (36.4%) | $37,083 |
| Total | 1,279 (100.0%) | $43,703 |
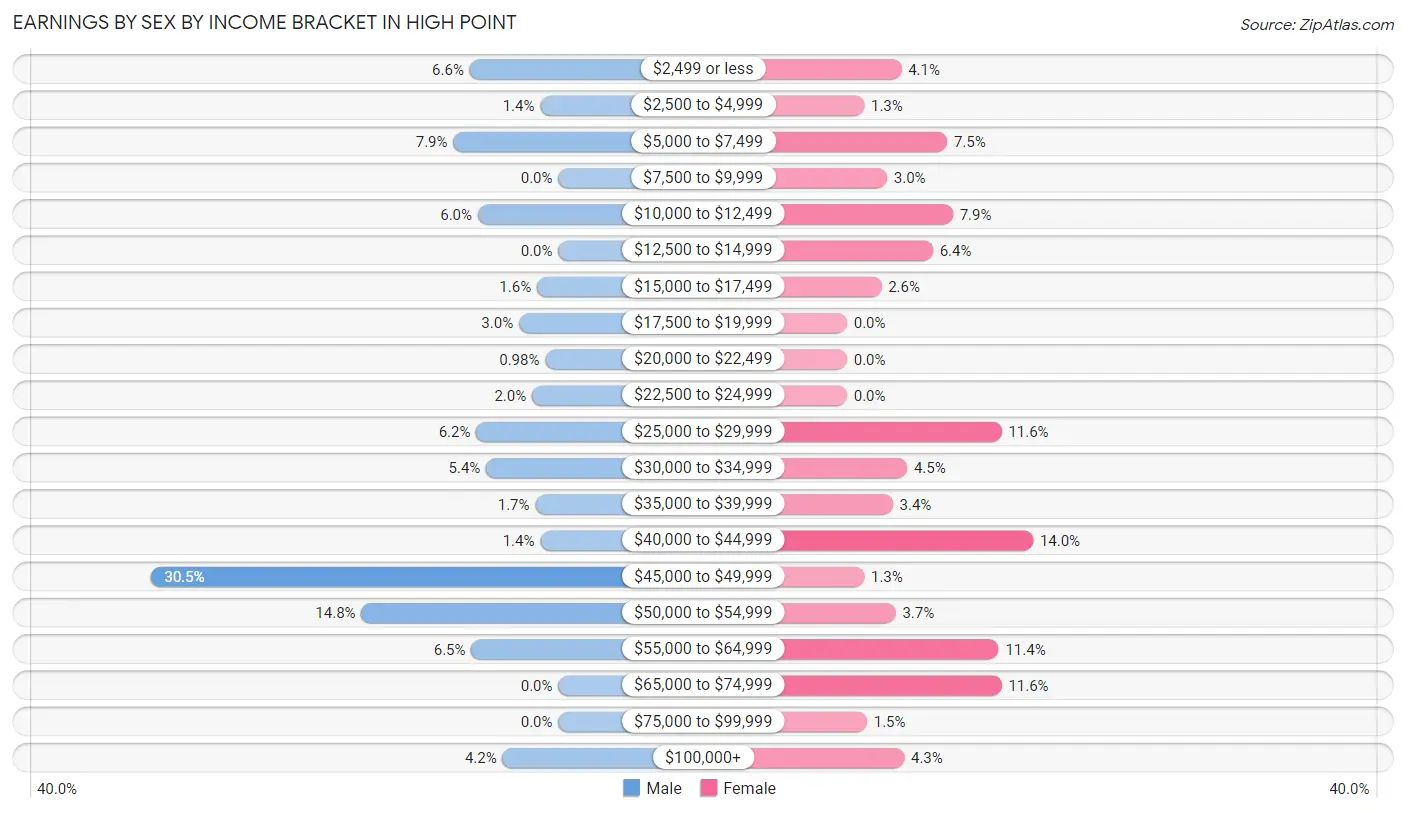
Earnings by Sex by Income Bracket in High Point
The most common earnings brackets in High Point are $45,000 to $49,999 for men (248 | 30.5%) and $40,000 to $44,999 for women (65 | 14.0%).
| Income | Male | Female |
| $2,499 or less | 54 (6.6%) | 19 (4.1%) |
| $2,500 to $4,999 | 11 (1.3%) | 6 (1.3%) |
| $5,000 to $7,499 | 64 (7.9%) | 35 (7.5%) |
| $7,500 to $9,999 | 0 (0.0%) | 14 (3.0%) |
| $10,000 to $12,499 | 49 (6.0%) | 37 (7.9%) |
| $12,500 to $14,999 | 0 (0.0%) | 30 (6.4%) |
| $15,000 to $17,499 | 13 (1.6%) | 12 (2.6%) |
| $17,500 to $19,999 | 24 (2.9%) | 0 (0.0%) |
| $20,000 to $22,499 | 8 (1.0%) | 0 (0.0%) |
| $22,500 to $24,999 | 16 (2.0%) | 0 (0.0%) |
| $25,000 to $29,999 | 50 (6.1%) | 54 (11.6%) |
| $30,000 to $34,999 | 44 (5.4%) | 21 (4.5%) |
| $35,000 to $39,999 | 14 (1.7%) | 16 (3.4%) |
| $40,000 to $44,999 | 11 (1.3%) | 65 (14.0%) |
| $45,000 to $49,999 | 248 (30.5%) | 6 (1.3%) |
| $50,000 to $54,999 | 120 (14.8%) | 17 (3.6%) |
| $55,000 to $64,999 | 53 (6.5%) | 53 (11.4%) |
| $65,000 to $74,999 | 0 (0.0%) | 54 (11.6%) |
| $75,000 to $99,999 | 0 (0.0%) | 7 (1.5%) |
| $100,000+ | 34 (4.2%) | 20 (4.3%) |
| Total | 813 (100.0%) | 466 (100.0%) |
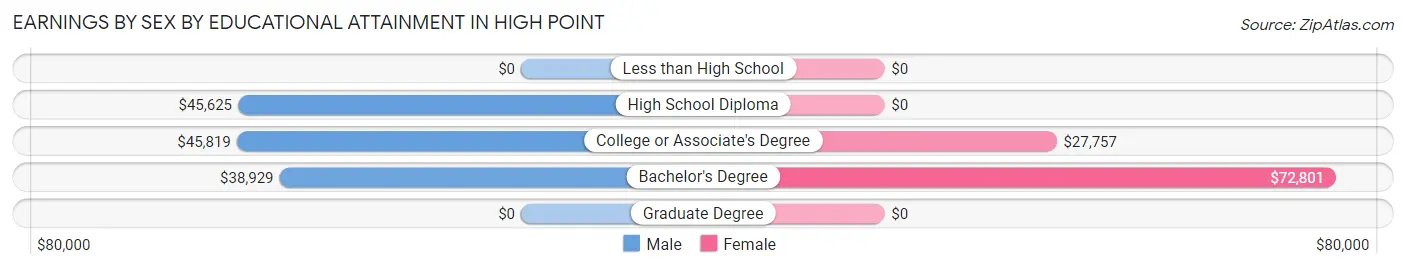
Earnings by Sex by Educational Attainment in High Point
Average earnings in High Point are $45,853 for men and $39,625 for women, a difference of 13.6%. Men with an educational attainment of college or associate's degree enjoy the highest average annual earnings of $45,819, while those with bachelor's degree education earn the least with $38,929. Women with an educational attainment of bachelor's degree earn the most with the average annual earnings of $72,801, while those with college or associate's degree education have the smallest earnings of $27,757.
| Educational Attainment | Male Income | Female Income |
| Less than High School | - | - |
| High School Diploma | $45,625 | $0 |
| College or Associate's Degree | $45,819 | $27,757 |
| Bachelor's Degree | $38,929 | $72,801 |
| Graduate Degree | - | - |
| Total | $45,853 | $39,625 |
Family Income in High Point
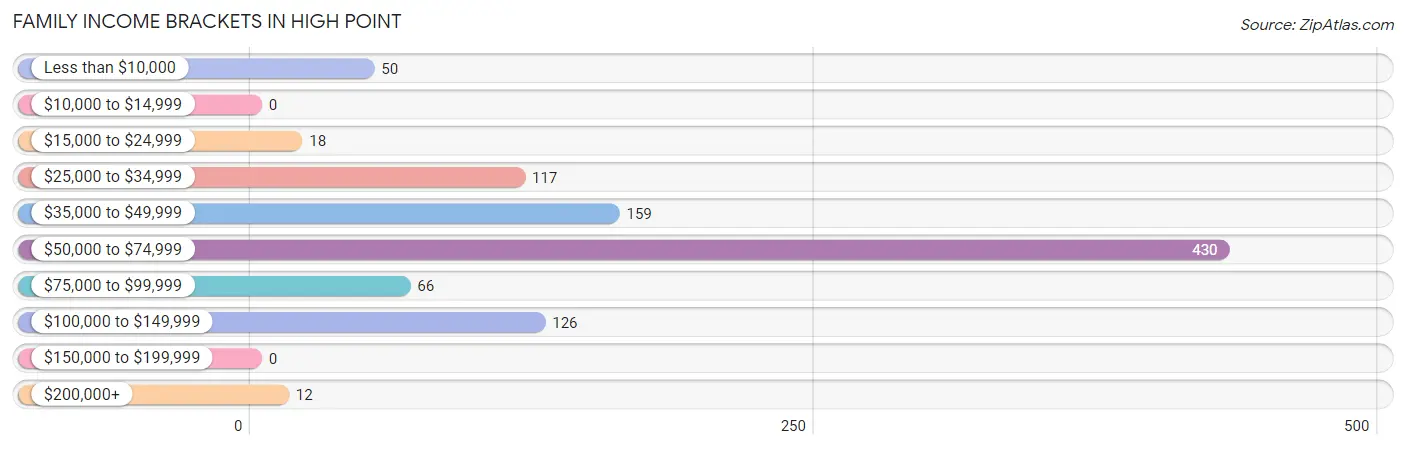
Family Income Brackets in High Point
According to the High Point family income data, there are 430 families falling into the $50,000 to $74,999 income range, which is the most common income bracket and makes up 44.0% of all families.
| Income Bracket | # Families | % Families |
| Less than $10,000 | 50 | 5.1% |
| $10,000 to $14,999 | 0 | 0.0% |
| $15,000 to $24,999 | 18 | 1.8% |
| $25,000 to $34,999 | 117 | 12.0% |
| $35,000 to $49,999 | 159 | 16.3% |
| $50,000 to $74,999 | 430 | 44.0% |
| $75,000 to $99,999 | 66 | 6.7% |
| $100,000 to $149,999 | 126 | 12.9% |
| $150,000 to $199,999 | 0 | 0.0% |
| $200,000+ | 12 | 1.2% |
Family Income by Famaliy Size in High Point
4-person families (84 | 8.6%) account for the highest median family income in High Point with $101,458 per family, while 2-person families (788 | 80.6%) have the highest median income of $28,934 per family member.
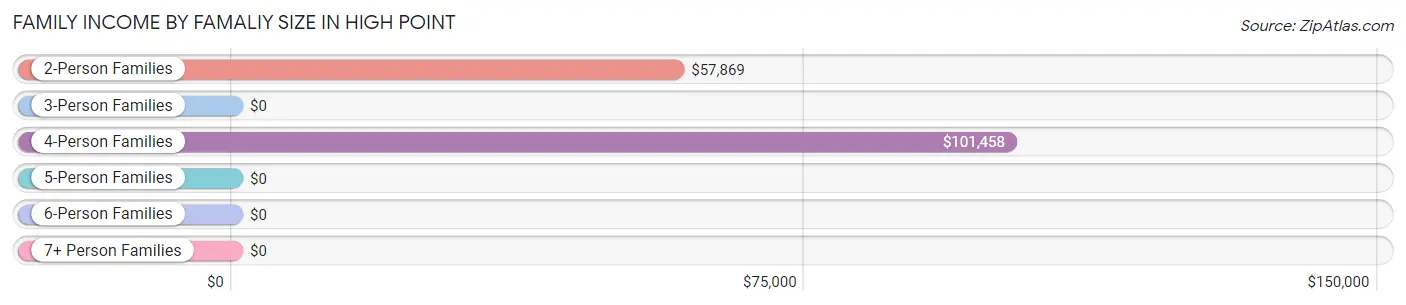
| Income Bracket | # Families | Median Income |
| 2-Person Families | 788 (80.6%) | $57,869 |
| 3-Person Families | 97 (9.9%) | $0 |
| 4-Person Families | 84 (8.6%) | $101,458 |
| 5-Person Families | 0 (0.0%) | $0 |
| 6-Person Families | 9 (0.9%) | $0 |
| 7+ Person Families | 0 (0.0%) | $0 |
| Total | 978 (100.0%) | $59,016 |
Family Income by Number of Earners in High Point
The median family income in High Point is $59,016, with families comprising 3+ earners (55) having the highest median family income of $121,510, while families with no earners (481) have the lowest median family income of $53,702, accounting for 5.6% and 49.2% of families, respectively.
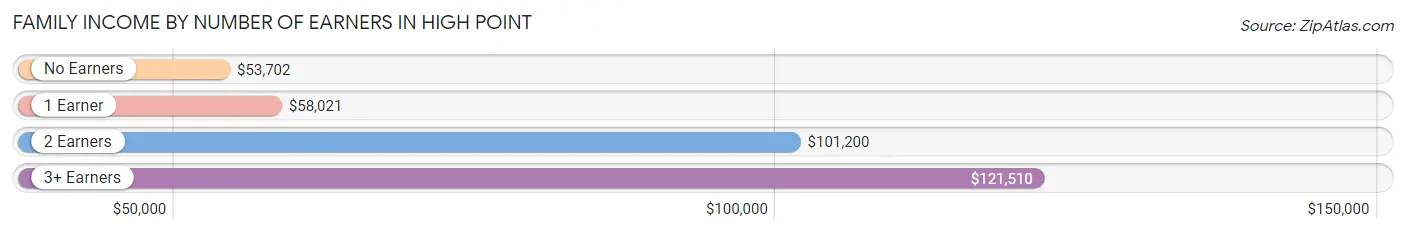
| Number of Earners | # Families | Median Income |
| No Earners | 481 (49.2%) | $53,702 |
| 1 Earner | 338 (34.6%) | $58,021 |
| 2 Earners | 104 (10.6%) | $101,200 |
| 3+ Earners | 55 (5.6%) | $121,510 |
| Total | 978 (100.0%) | $59,016 |
Household Income in High Point
Household Income Brackets in High Point
With 540 households falling in the category, the $50,000 to $74,999 income range is the most frequent in High Point, accounting for 26.3% of all households.
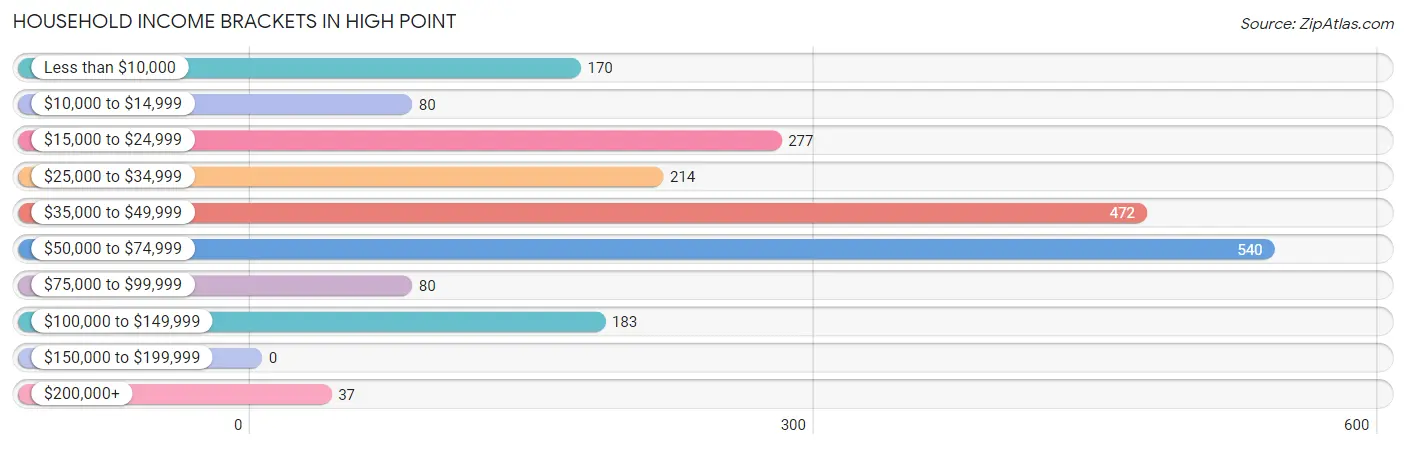
| Income Bracket | # Households | % Households |
| Less than $10,000 | 170 | 8.3% |
| $10,000 to $14,999 | 80 | 3.9% |
| $15,000 to $24,999 | 277 | 13.5% |
| $25,000 to $34,999 | 214 | 10.4% |
| $35,000 to $49,999 | 472 | 23.0% |
| $50,000 to $74,999 | 540 | 26.3% |
| $75,000 to $99,999 | 80 | 3.9% |
| $100,000 to $149,999 | 183 | 8.9% |
| $150,000 to $199,999 | 0 | 0.0% |
| $200,000+ | 37 | 1.8% |
Household Income by Householder Age in High Point
The median household income in High Point is $46,083, with the highest median household income of $46,846 found in the 25 to 44 years age bracket for the primary householder. A total of 347 households (16.9%) fall into this category.
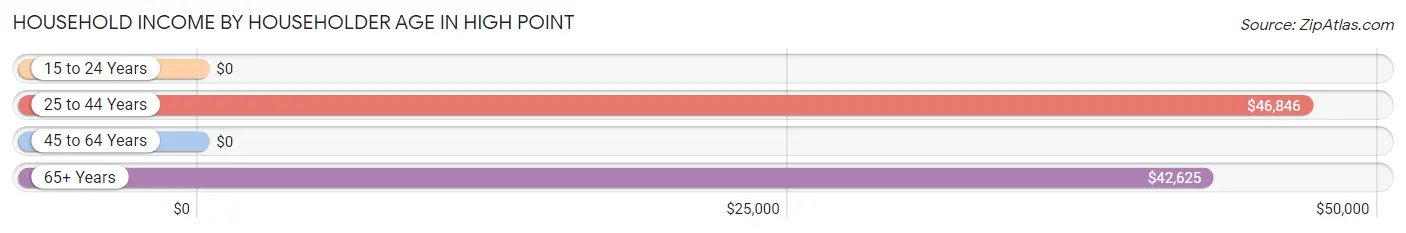
| Income Bracket | # Households | Median Income |
| 15 to 24 Years | 0 (0.0%) | $0 |
| 25 to 44 Years | 347 (16.9%) | $46,846 |
| 45 to 64 Years | 427 (20.8%) | $0 |
| 65+ Years | 1,280 (62.3%) | $42,625 |
| Total | 2,054 (100.0%) | $46,083 |
Poverty in High Point
Income Below Poverty by Sex and Age in High Point
With 10.0% poverty level for males and 11.8% for females among the residents of High Point, 55 to 64 year old males and 45 to 54 year old females are the most vulnerable to poverty, with 77 males (38.7%) and 43 females (33.9%) in their respective age groups living below the poverty level.
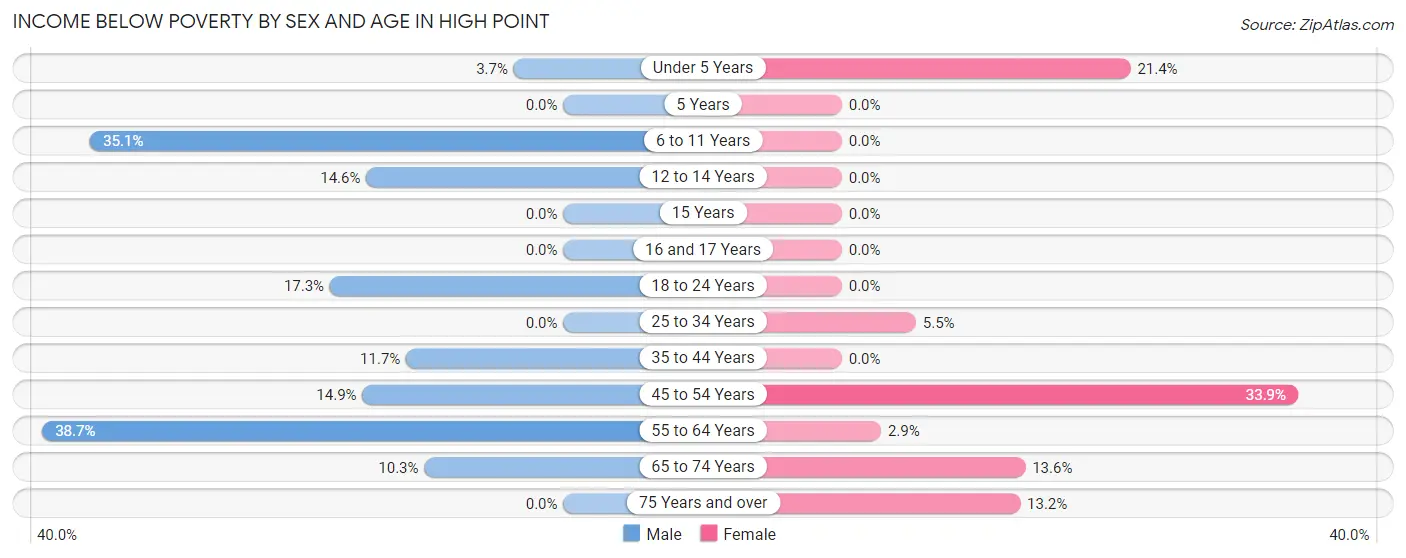
| Age Bracket | Male | Female |
| Under 5 Years | 7 (3.7%) | 9 (21.4%) |
| 5 Years | 0 (0.0%) | 0 (0.0%) |
| 6 to 11 Years | 13 (35.1%) | 0 (0.0%) |
| 12 to 14 Years | 6 (14.6%) | 0 (0.0%) |
| 15 Years | 0 (0.0%) | 0 (0.0%) |
| 16 and 17 Years | 0 (0.0%) | 0 (0.0%) |
| 18 to 24 Years | 13 (17.3%) | 0 (0.0%) |
| 25 to 34 Years | 0 (0.0%) | 6 (5.5%) |
| 35 to 44 Years | 7 (11.7%) | 0 (0.0%) |
| 45 to 54 Years | 27 (14.9%) | 43 (33.9%) |
| 55 to 64 Years | 77 (38.7%) | 8 (2.9%) |
| 65 to 74 Years | 45 (10.3%) | 70 (13.6%) |
| 75 Years and over | 0 (0.0%) | 69 (13.2%) |
| Total | 195 (10.0%) | 205 (11.8%) |
Income Above Poverty by Sex and Age in High Point
According to the poverty statistics in High Point, males aged 5 years and females aged 6 to 11 years are the age groups that are most secure financially, with 100.0% of males and 100.0% of females in these age groups living above the poverty line.
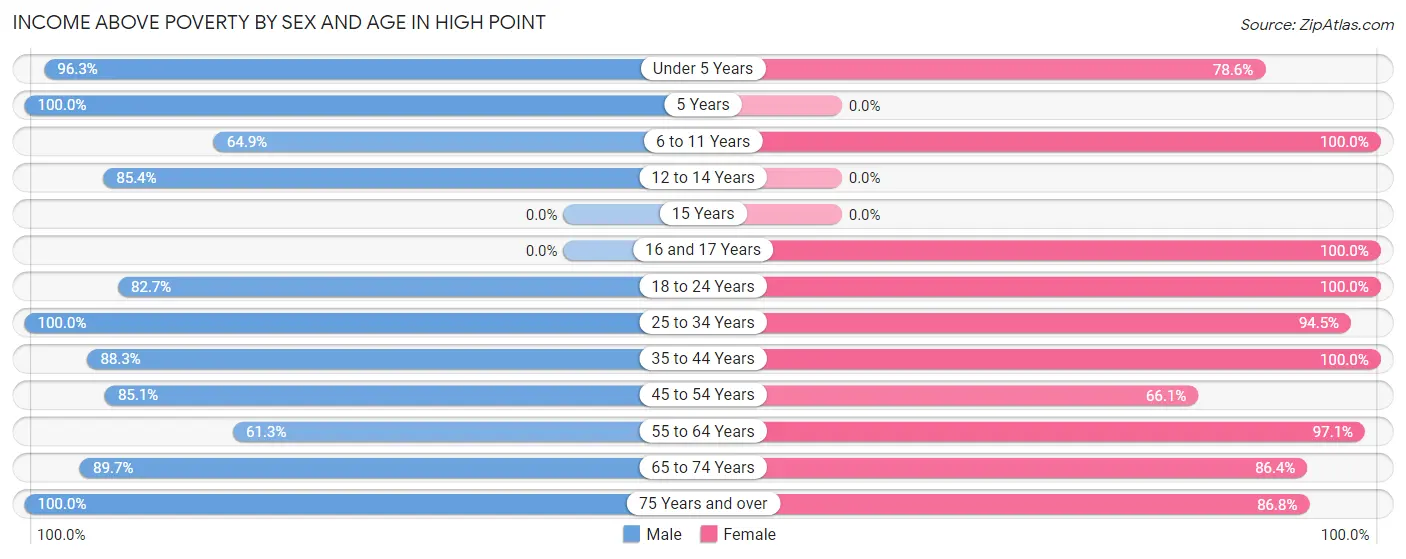
| Age Bracket | Male | Female |
| Under 5 Years | 183 (96.3%) | 33 (78.6%) |
| 5 Years | 16 (100.0%) | 0 (0.0%) |
| 6 to 11 Years | 24 (64.9%) | 56 (100.0%) |
| 12 to 14 Years | 35 (85.4%) | 0 (0.0%) |
| 15 Years | 0 (0.0%) | 0 (0.0%) |
| 16 and 17 Years | 0 (0.0%) | 13 (100.0%) |
| 18 to 24 Years | 62 (82.7%) | 19 (100.0%) |
| 25 to 34 Years | 346 (100.0%) | 103 (94.5%) |
| 35 to 44 Years | 53 (88.3%) | 56 (100.0%) |
| 45 to 54 Years | 154 (85.1%) | 84 (66.1%) |
| 55 to 64 Years | 122 (61.3%) | 267 (97.1%) |
| 65 to 74 Years | 391 (89.7%) | 444 (86.4%) |
| 75 Years and over | 372 (100.0%) | 452 (86.8%) |
| Total | 1,758 (90.0%) | 1,527 (88.2%) |
Income Below Poverty Among Married-Couple Families in High Point
The poverty statistics for married-couple families in High Point show that 4.4% or 37 of the total 831 families live below the poverty line. Families with no children have the highest poverty rate of 5.1%, comprising of 37 families. On the other hand, families with 1 or 2 children have the lowest poverty rate of 0.0%, which includes 0 families.
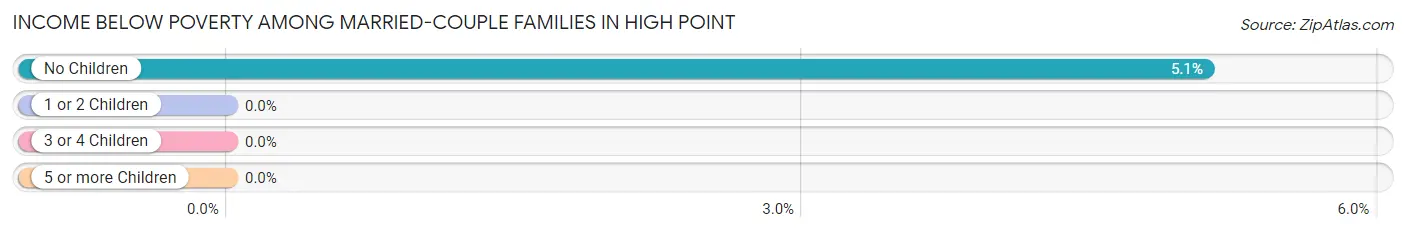
| Children | Above Poverty | Below Poverty |
| No Children | 689 (94.9%) | 37 (5.1%) |
| 1 or 2 Children | 96 (100.0%) | 0 (0.0%) |
| 3 or 4 Children | 9 (100.0%) | 0 (0.0%) |
| 5 or more Children | 0 (0.0%) | 0 (0.0%) |
| Total | 794 (95.6%) | 37 (4.4%) |
Income Below Poverty Among Single-Parent Households in High Point
According to the poverty data in High Point, 21.2% or 7 single-father households and 10.5% or 12 single-mother households are living below the poverty line. Among single-father households, those with 1 or 2 children have the highest poverty rate, with 7 households (100.0%) experiencing poverty. Likewise, among single-mother households, those with 3 or 4 children have the highest poverty rate, with 6 households (100.0%) falling below the poverty line.
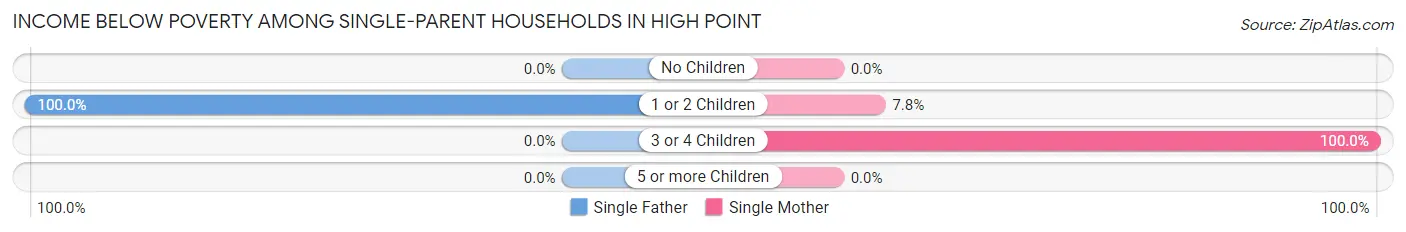
| Children | Single Father | Single Mother |
| No Children | 0 (0.0%) | 0 (0.0%) |
| 1 or 2 Children | 7 (100.0%) | 6 (7.8%) |
| 3 or 4 Children | 0 (0.0%) | 6 (100.0%) |
| 5 or more Children | 0 (0.0%) | 0 (0.0%) |
| Total | 7 (21.2%) | 12 (10.5%) |
Income Below Poverty Among Married-Couple vs Single-Parent Households in High Point
The poverty data for High Point shows that 37 of the married-couple family households (4.4%) and 19 of the single-parent households (12.9%) are living below the poverty level. Within the married-couple family households, those with no children have the highest poverty rate, with 37 households (5.1%) falling below the poverty line. Among the single-parent households, those with 3 or 4 children have the highest poverty rate, with 6 household (100.0%) living below poverty.
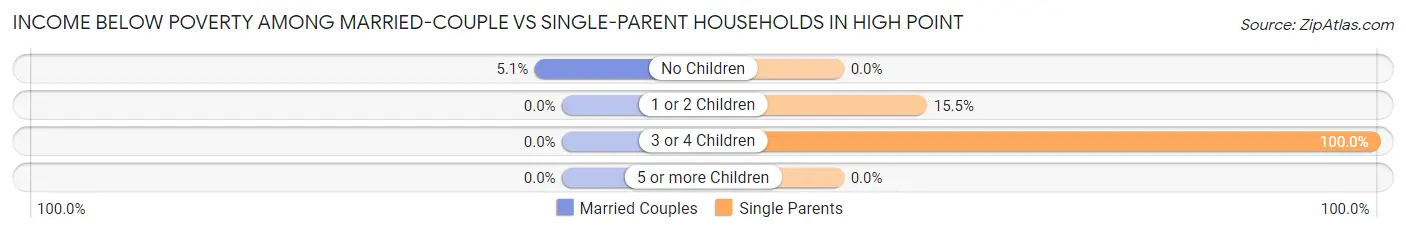
| Children | Married-Couple Families | Single-Parent Households |
| No Children | 37 (5.1%) | 0 (0.0%) |
| 1 or 2 Children | 0 (0.0%) | 13 (15.5%) |
| 3 or 4 Children | 0 (0.0%) | 6 (100.0%) |
| 5 or more Children | 0 (0.0%) | 0 (0.0%) |
| Total | 37 (4.4%) | 19 (12.9%) |
Race in High Point
The most populous races in High Point are White / Caucasian (3,410 | 92.5%), Hispanic or Latino (282 | 7.6%), and Two or more Races (113 | 3.1%).
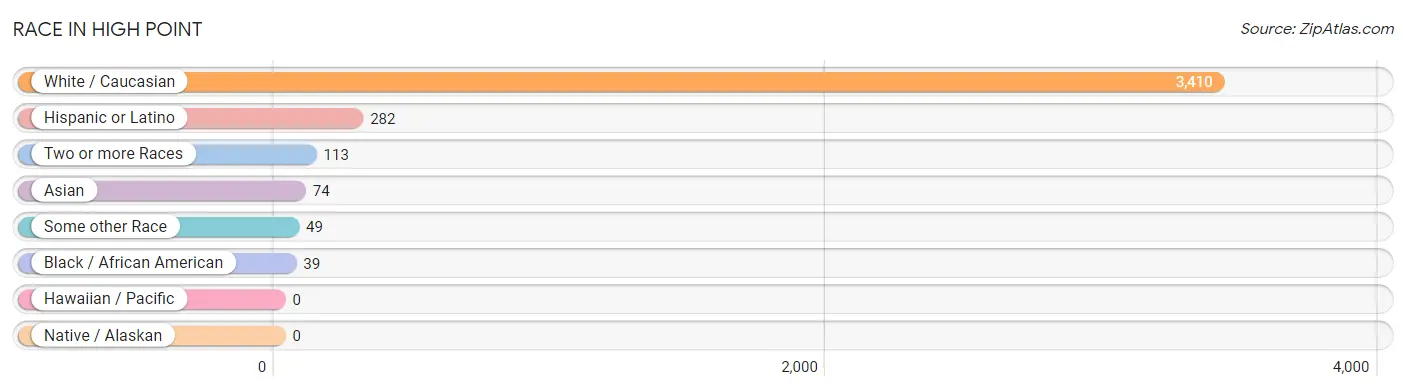
| Race | # Population | % Population |
| Asian | 74 | 2.0% |
| Black / African American | 39 | 1.1% |
| Hawaiian / Pacific | 0 | 0.0% |
| Hispanic or Latino | 282 | 7.6% |
| Native / Alaskan | 0 | 0.0% |
| White / Caucasian | 3,410 | 92.5% |
| Two or more Races | 113 | 3.1% |
| Some other Race | 49 | 1.3% |
| Total | 3,685 | 100.0% |
Ancestry in High Point
The most populous ancestries reported in High Point are English (732 | 19.9%), German (542 | 14.7%), Irish (401 | 10.9%), Italian (208 | 5.6%), and Ukrainian (207 | 5.6%), together accounting for 56.7% of all High Point residents.
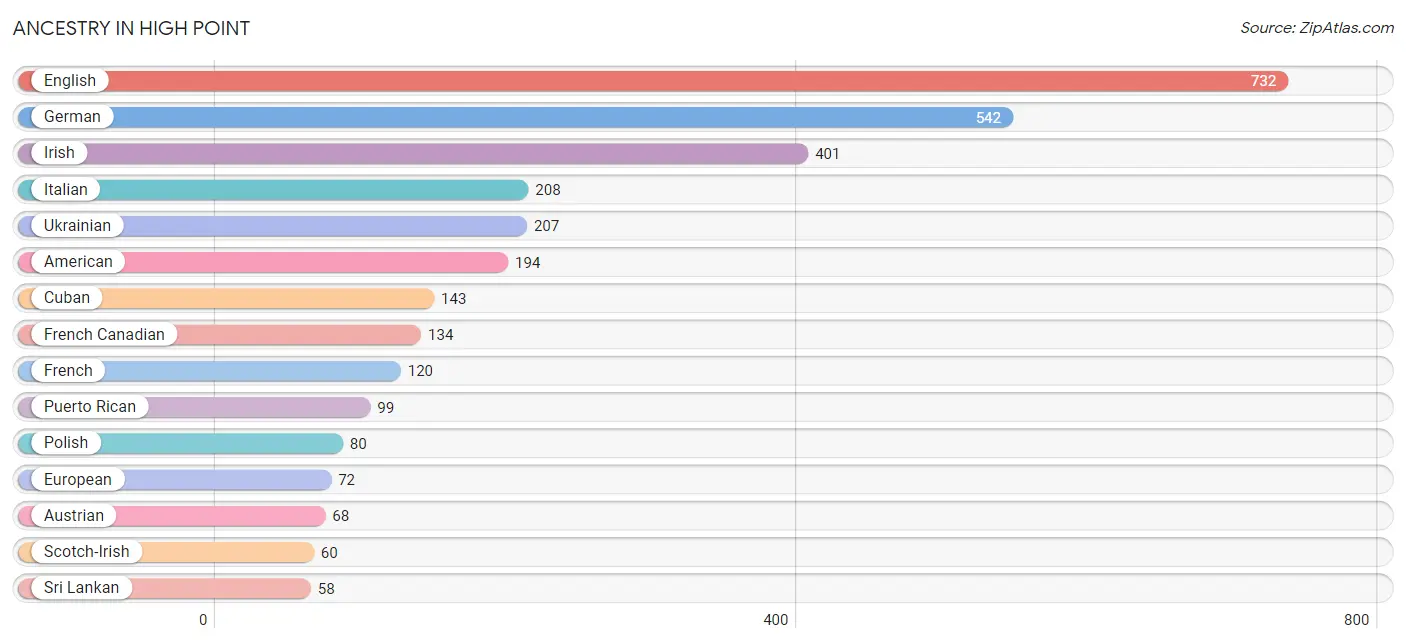
| Ancestry | # Population | % Population |
| American | 194 | 5.3% |
| Argentinean | 9 | 0.2% |
| Austrian | 68 | 1.8% |
| Canadian | 25 | 0.7% |
| Cuban | 143 | 3.9% |
| Czech | 19 | 0.5% |
| Dutch | 46 | 1.3% |
| English | 732 | 19.9% |
| European | 72 | 1.9% |
| French | 120 | 3.3% |
| French Canadian | 134 | 3.6% |
| German | 542 | 14.7% |
| Hungarian | 39 | 1.1% |
| Irish | 401 | 10.9% |
| Italian | 208 | 5.6% |
| Korean | 30 | 0.8% |
| Mexican | 31 | 0.8% |
| Norwegian | 35 | 0.9% |
| Pennsylvania German | 54 | 1.5% |
| Polish | 80 | 2.2% |
| Portuguese | 32 | 0.9% |
| Puerto Rican | 99 | 2.7% |
| Russian | 12 | 0.3% |
| Scandinavian | 11 | 0.3% |
| Scotch-Irish | 60 | 1.6% |
| Scottish | 37 | 1.0% |
| Slovak | 11 | 0.3% |
| South American | 9 | 0.2% |
| Sri Lankan | 58 | 1.6% |
| Swedish | 57 | 1.5% |
| Swiss | 9 | 0.2% |
| Ukrainian | 207 | 5.6% |
| Welsh | 16 | 0.4% |
| West Indian | 18 | 0.5% | View All 34 Rows |
Immigrants in High Point
The most numerous immigrant groups reported in High Point came from Canada (263 | 7.1%), Asia (74 | 2.0%), South Eastern Asia (74 | 2.0%), Vietnam (58 | 1.6%), and Latin America (52 | 1.4%), together accounting for 14.1% of all High Point residents.
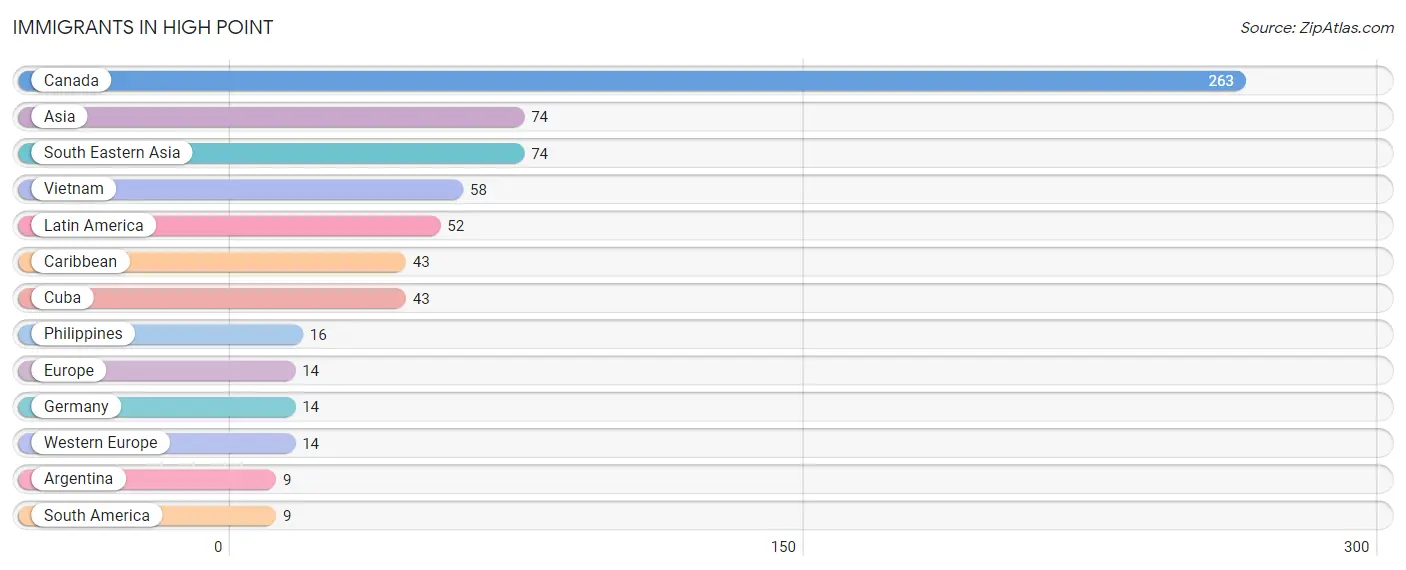
| Immigration Origin | # Population | % Population |
| Argentina | 9 | 0.2% |
| Asia | 74 | 2.0% |
| Canada | 263 | 7.1% |
| Caribbean | 43 | 1.2% |
| Cuba | 43 | 1.2% |
| Europe | 14 | 0.4% |
| Germany | 14 | 0.4% |
| Latin America | 52 | 1.4% |
| Philippines | 16 | 0.4% |
| South America | 9 | 0.2% |
| South Eastern Asia | 74 | 2.0% |
| Vietnam | 58 | 1.6% |
| Western Europe | 14 | 0.4% | View All 13 Rows |
Sex and Age in High Point
Sex and Age in High Point
The most populous age groups in High Point are 25 to 29 Years (296 | 15.2%) for men and 65 to 69 Years (273 | 15.8%) for women.
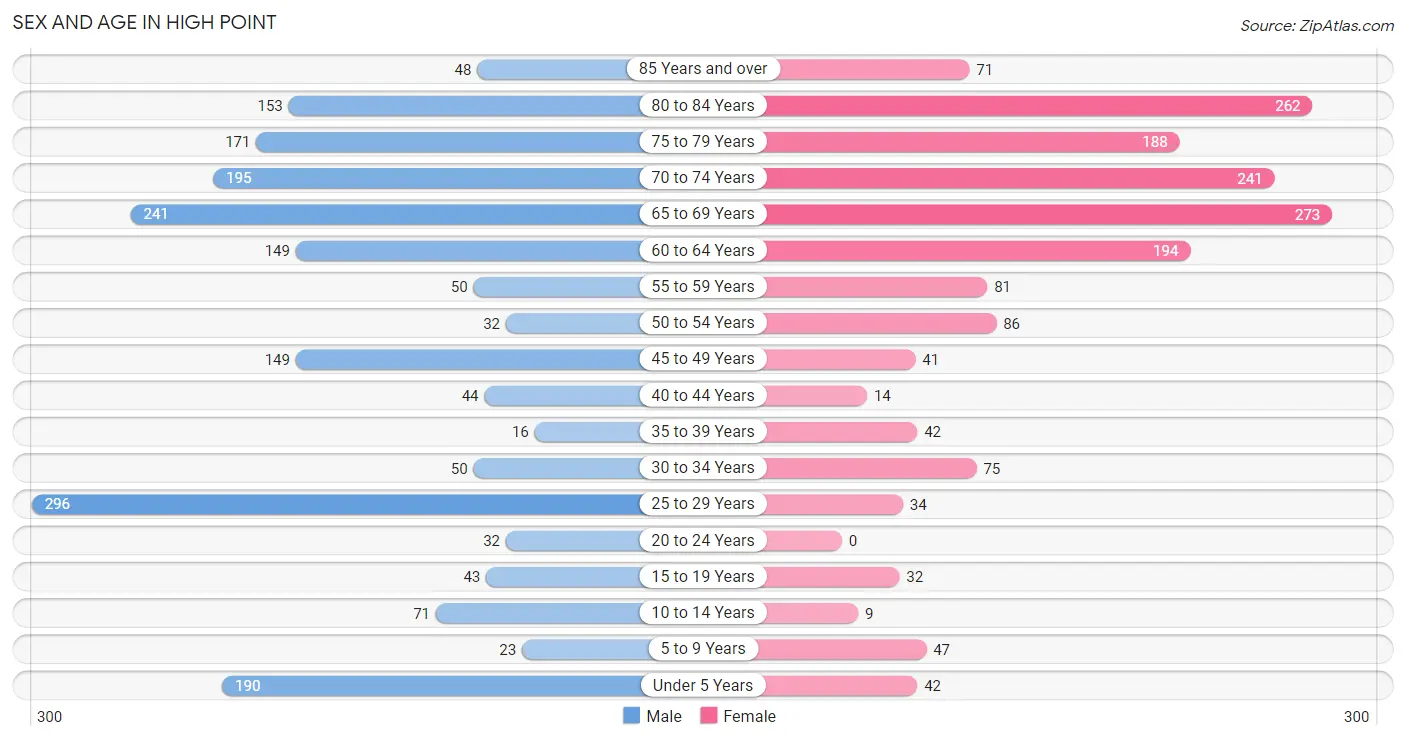
| Age Bracket | Male | Female |
| Under 5 Years | 190 (9.7%) | 42 (2.4%) |
| 5 to 9 Years | 23 (1.2%) | 47 (2.7%) |
| 10 to 14 Years | 71 (3.6%) | 9 (0.5%) |
| 15 to 19 Years | 43 (2.2%) | 32 (1.8%) |
| 20 to 24 Years | 32 (1.6%) | 0 (0.0%) |
| 25 to 29 Years | 296 (15.2%) | 34 (2.0%) |
| 30 to 34 Years | 50 (2.6%) | 75 (4.3%) |
| 35 to 39 Years | 16 (0.8%) | 42 (2.4%) |
| 40 to 44 Years | 44 (2.2%) | 14 (0.8%) |
| 45 to 49 Years | 149 (7.6%) | 41 (2.4%) |
| 50 to 54 Years | 32 (1.6%) | 86 (5.0%) |
| 55 to 59 Years | 50 (2.6%) | 81 (4.7%) |
| 60 to 64 Years | 149 (7.6%) | 194 (11.2%) |
| 65 to 69 Years | 241 (12.3%) | 273 (15.8%) |
| 70 to 74 Years | 195 (10.0%) | 241 (13.9%) |
| 75 to 79 Years | 171 (8.8%) | 188 (10.8%) |
| 80 to 84 Years | 153 (7.8%) | 262 (15.1%) |
| 85 Years and over | 48 (2.5%) | 71 (4.1%) |
| Total | 1,953 (100.0%) | 1,732 (100.0%) |
Families and Households in High Point
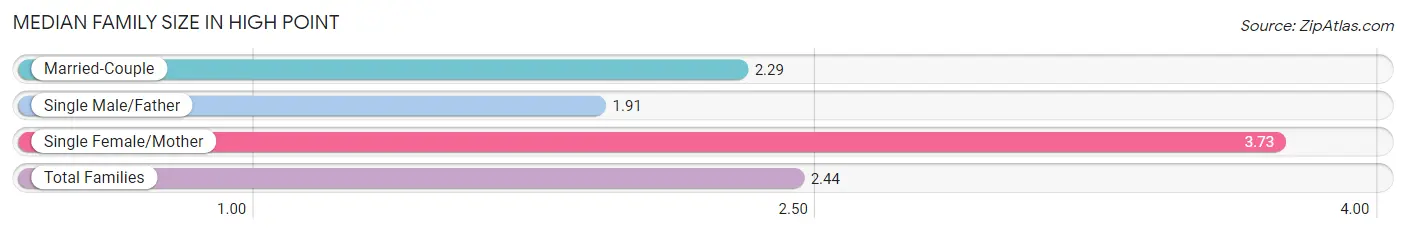
Median Family Size in High Point
The median family size in High Point is 2.44 persons per family, with single female/mother families (114 | 11.7%) accounting for the largest median family size of 3.73 persons per family. On the other hand, single male/father families (33 | 3.4%) represent the smallest median family size with 1.91 persons per family.
| Family Type | # Families | Family Size |
| Married-Couple | 831 (85.0%) | 2.29 |
| Single Male/Father | 33 (3.4%) | 1.91 |
| Single Female/Mother | 114 (11.7%) | 3.73 |
| Total Families | 978 (100.0%) | 2.44 |
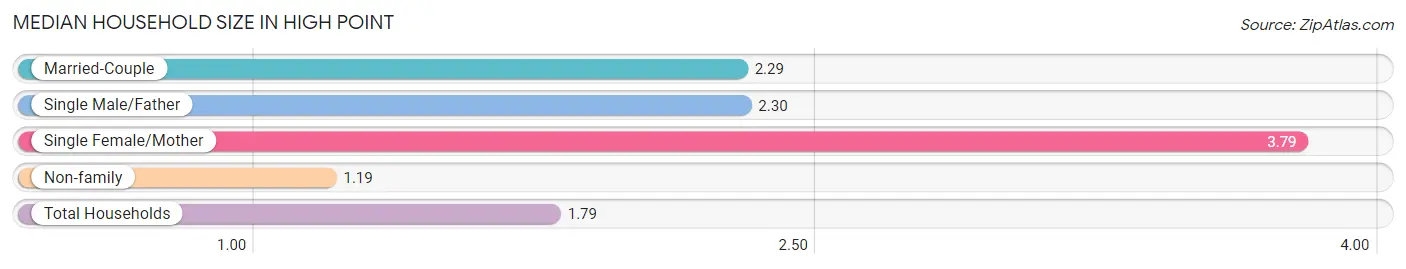
Median Household Size in High Point
The median household size in High Point is 1.79 persons per household, with single female/mother households (114 | 5.6%) accounting for the largest median household size of 3.79 persons per household. non-family households (1,076 | 52.4%) represent the smallest median household size with 1.19 persons per household.
| Household Type | # Households | Household Size |
| Married-Couple | 831 (40.5%) | 2.29 |
| Single Male/Father | 33 (1.6%) | 2.30 |
| Single Female/Mother | 114 (5.6%) | 3.79 |
| Non-family | 1,076 (52.4%) | 1.19 |
| Total Households | 2,054 (100.0%) | 1.79 |
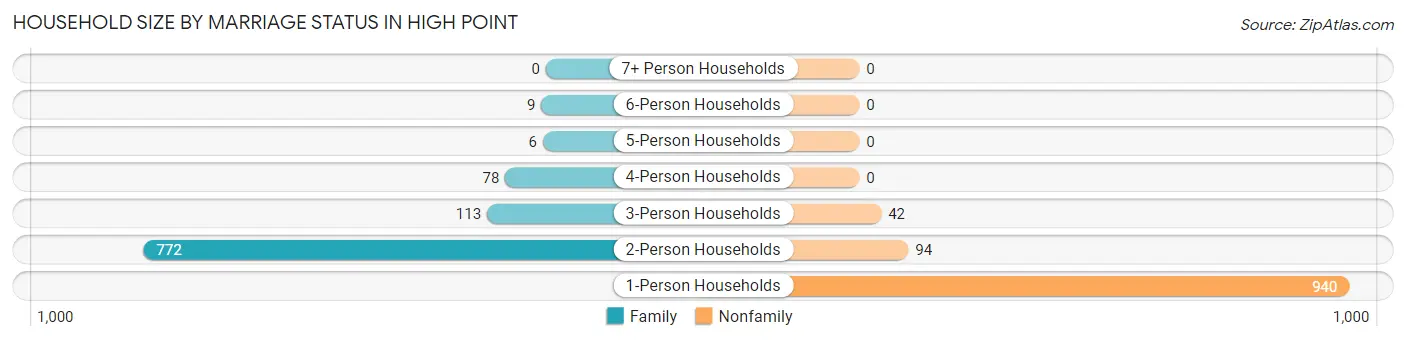
Household Size by Marriage Status in High Point
Out of a total of 2,054 households in High Point, 978 (47.6%) are family households, while 1,076 (52.4%) are nonfamily households. The most numerous type of family households are 2-person households, comprising 772, and the most common type of nonfamily households are 1-person households, comprising 940.
| Household Size | Family Households | Nonfamily Households |
| 1-Person Households | - | 940 (45.8%) |
| 2-Person Households | 772 (37.6%) | 94 (4.6%) |
| 3-Person Households | 113 (5.5%) | 42 (2.0%) |
| 4-Person Households | 78 (3.8%) | 0 (0.0%) |
| 5-Person Households | 6 (0.3%) | 0 (0.0%) |
| 6-Person Households | 9 (0.4%) | 0 (0.0%) |
| 7+ Person Households | 0 (0.0%) | 0 (0.0%) |
| Total | 978 (47.6%) | 1,076 (52.4%) |
Female Fertility in High Point
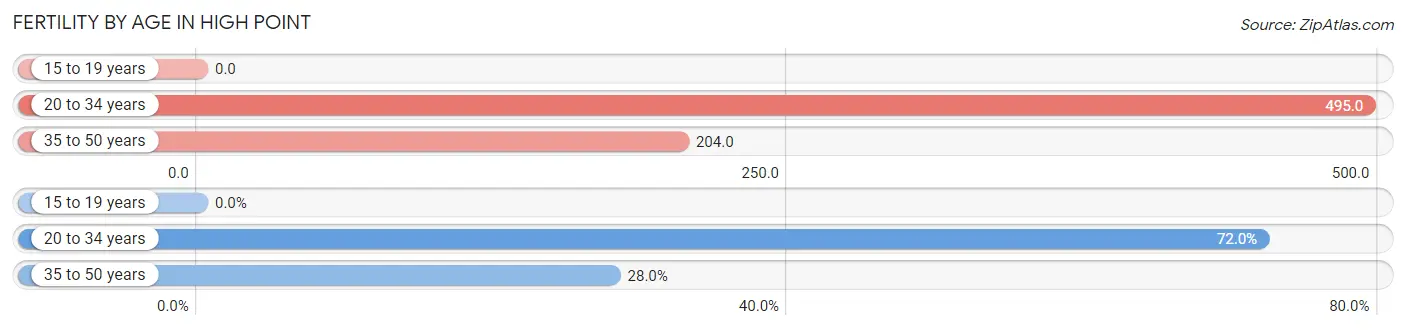
Fertility by Age in High Point
Average fertility rate in High Point is 307.0 births per 1,000 women. Women in the age bracket of 20 to 34 years have the highest fertility rate with 495.0 births per 1,000 women. Women in the age bracket of 20 to 34 years acount for 72.0% of all women with births.
| Age Bracket | Women with Births | Births / 1,000 Women |
| 15 to 19 years | 0 (0.0%) | 0.0 |
| 20 to 34 years | 54 (72.0%) | 495.0 |
| 35 to 50 years | 21 (28.0%) | 204.0 |
| Total | 75 (100.0%) | 307.0 |
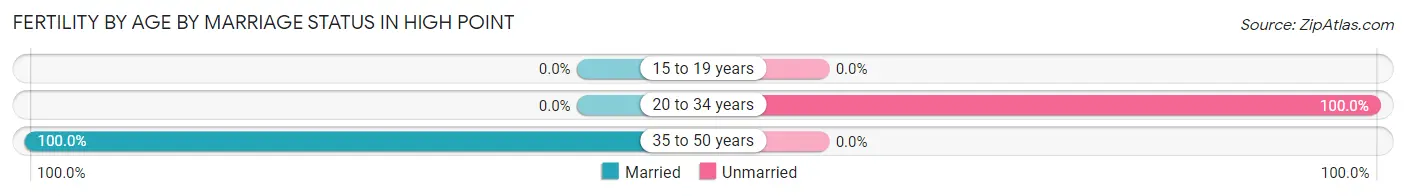
Fertility by Age by Marriage Status in High Point
28.0% of women with births (75) in High Point are married. The highest percentage of unmarried women with births falls into 20 to 34 years age bracket with 100.0% of them unmarried at the time of birth, while the lowest percentage of unmarried women with births belong to 35 to 50 years age bracket with 0.0% of them unmarried.
| Age Bracket | Married | Unmarried |
| 15 to 19 years | 0 (0.0%) | 0 (0.0%) |
| 20 to 34 years | 0 (0.0%) | 54 (100.0%) |
| 35 to 50 years | 21 (100.0%) | 0 (0.0%) |
| Total | 21 (28.0%) | 54 (72.0%) |
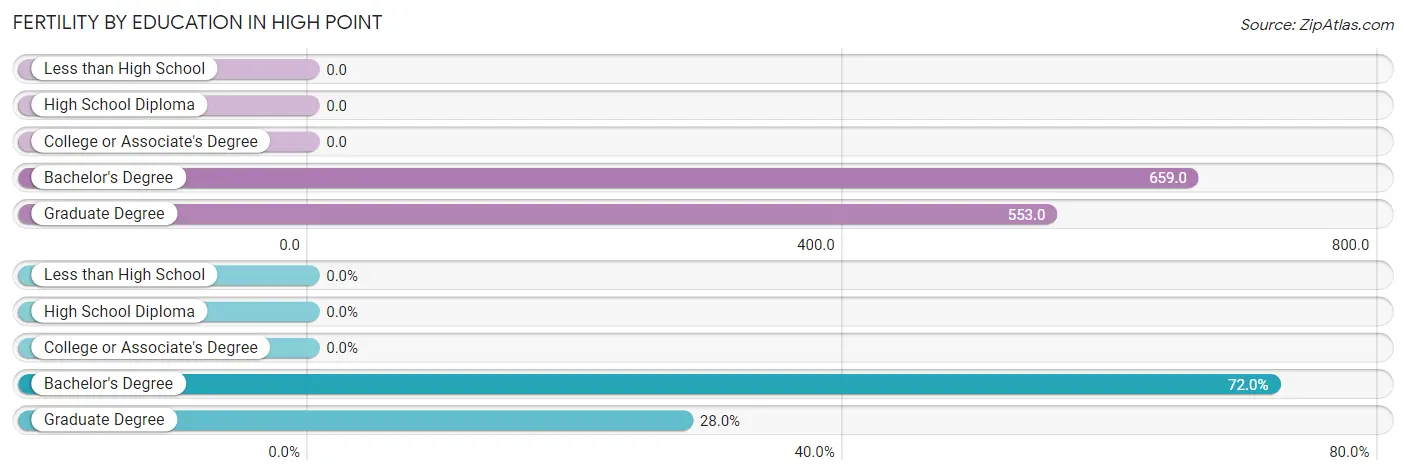
Fertility by Education in High Point
| Educational Attainment | Women with Births | Births / 1,000 Women |
| Less than High School | 0 (0.0%) | 0.0 |
| High School Diploma | 0 (0.0%) | 0.0 |
| College or Associate's Degree | 0 (0.0%) | 0.0 |
| Bachelor's Degree | 54 (72.0%) | 659.0 |
| Graduate Degree | 21 (28.0%) | 553.0 |
| Total | 75 (100.0%) | 307.0 |
Fertility by Education by Marriage Status in High Point
72.0% of women with births in High Point are unmarried. Women with the educational attainment of graduate degree are most likely to be married with 100.0% of them married at childbirth, while women with the educational attainment of bachelor's degree are least likely to be married with 100.0% of them unmarried at childbirth.
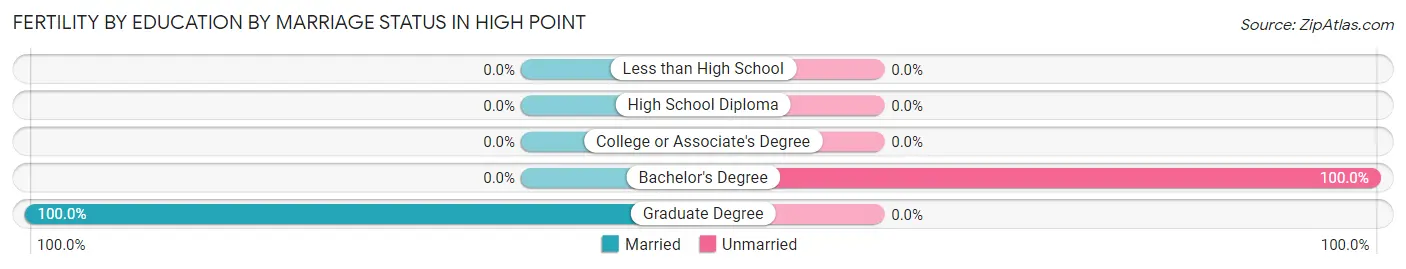
| Educational Attainment | Married | Unmarried |
| Less than High School | 0 (0.0%) | 0 (0.0%) |
| High School Diploma | 0 (0.0%) | 0 (0.0%) |
| College or Associate's Degree | 0 (0.0%) | 0 (0.0%) |
| Bachelor's Degree | 0 (0.0%) | 54 (100.0%) |
| Graduate Degree | 21 (100.0%) | 0 (0.0%) |
| Total | 21 (28.0%) | 54 (72.0%) |
Employment Characteristics in High Point
Employment by Class of Employer in High Point
Among the 1,066 employed individuals in High Point, private company employees (768 | 72.1%), self-employed (not incorporated) (90 | 8.4%), and local government employees (71 | 6.7%) make up the most common classes of employment.
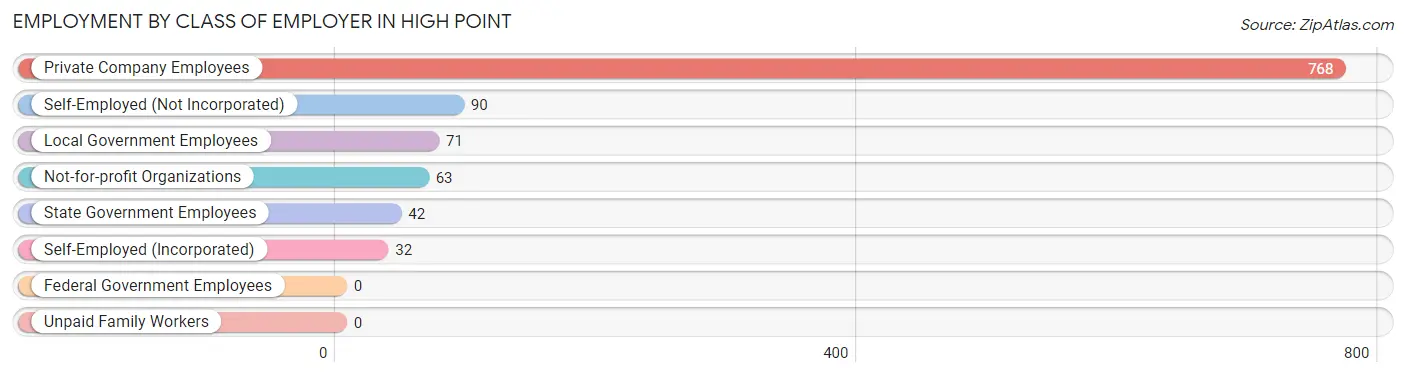
| Employer Class | # Employees | % Employees |
| Private Company Employees | 768 | 72.1% |
| Self-Employed (Incorporated) | 32 | 3.0% |
| Self-Employed (Not Incorporated) | 90 | 8.4% |
| Not-for-profit Organizations | 63 | 5.9% |
| Local Government Employees | 71 | 6.7% |
| State Government Employees | 42 | 3.9% |
| Federal Government Employees | 0 | 0.0% |
| Unpaid Family Workers | 0 | 0.0% |
| Total | 1,066 | 100.0% |
Employment Status by Age in High Point
According to the labor force statistics for High Point, out of the total population over 16 years of age (3,303), 36.5% or 1,206 individuals are in the labor force, with 11.5% or 139 of them unemployed. The age group with the highest labor force participation rate is 20 to 24 years, with 100.0% or 32 individuals in the labor force. Within the labor force, the 20 to 24 years age range has the highest percentage of unemployed individuals, with 100.0% or 32 of them being unemployed.
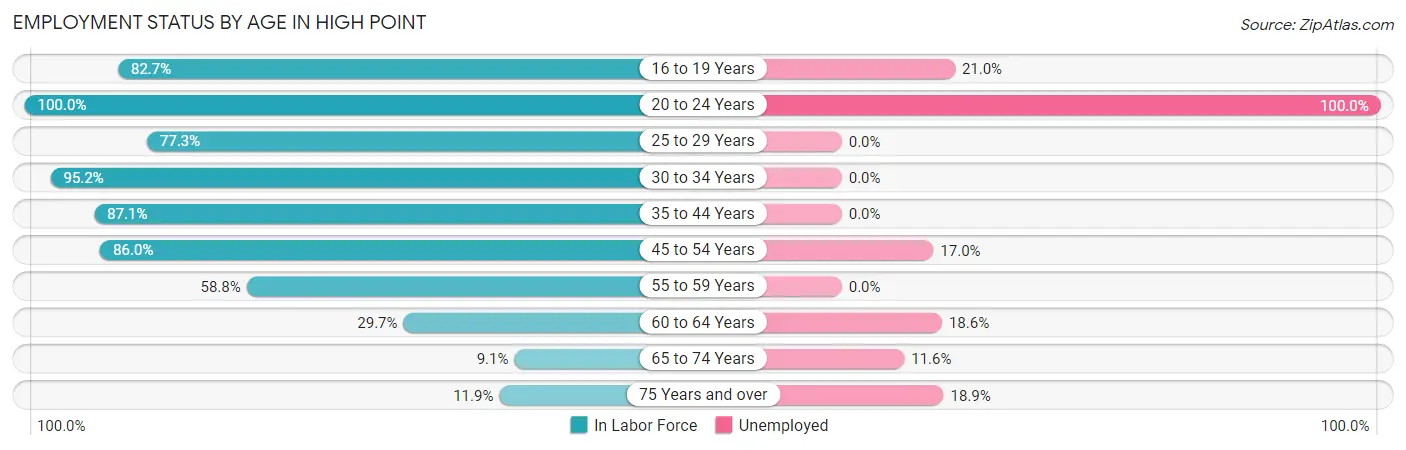
| Age Bracket | In Labor Force | Unemployed |
| 16 to 19 Years | 62 (82.7%) | 13 (21.0%) |
| 20 to 24 Years | 32 (100.0%) | 32 (100.0%) |
| 25 to 29 Years | 255 (77.3%) | 0 (0.0%) |
| 30 to 34 Years | 119 (95.2%) | 0 (0.0%) |
| 35 to 44 Years | 101 (87.1%) | 0 (0.0%) |
| 45 to 54 Years | 265 (86.0%) | 45 (17.0%) |
| 55 to 59 Years | 77 (58.8%) | 0 (0.0%) |
| 60 to 64 Years | 102 (29.7%) | 19 (18.6%) |
| 65 to 74 Years | 86 (9.1%) | 10 (11.6%) |
| 75 Years and over | 106 (11.9%) | 20 (18.9%) |
| Total | 1,206 (36.5%) | 139 (11.5%) |
Employment Status by Educational Attainment in High Point
According to labor force statistics for High Point, 67.9% of individuals (919) out of the total population between 25 and 64 years of age (1,353) are in the labor force, with 7.0% or 64 of them being unemployed. The group with the highest labor force participation rate are those with the educational attainment of college / associate degree, with 85.2% or 442 individuals in the labor force. Within the labor force, individuals with bachelor's degree or higher education have the highest percentage of unemployment, with 15.5% or 31 of them being unemployed.
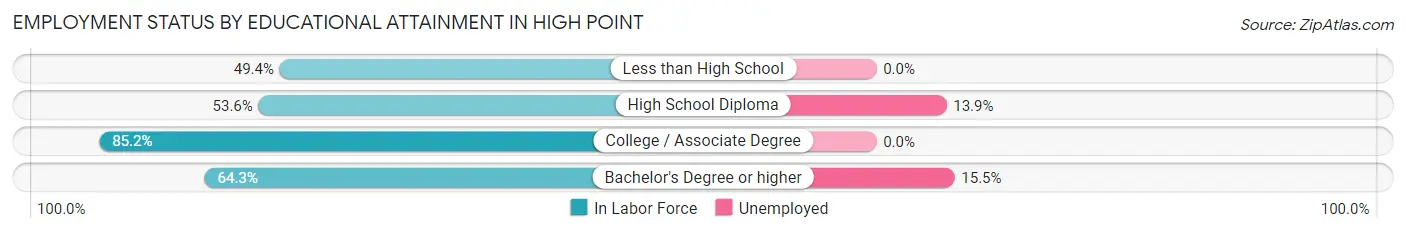
| Educational Attainment | In Labor Force | Unemployed |
| Less than High School | 39 (49.4%) | 0 (0.0%) |
| High School Diploma | 238 (53.6%) | 62 (13.9%) |
| College / Associate Degree | 442 (85.2%) | 0 (0.0%) |
| Bachelor's Degree or higher | 200 (64.3%) | 48 (15.5%) |
| Total | 919 (67.9%) | 95 (7.0%) |
Employment Occupations by Sex in High Point
Management, Business, Science and Arts Occupations
The most common Management, Business, Science and Arts occupations in High Point are Health Diagnosing & Treating (258 | 24.2%), Health Technologists (217 | 20.4%), Business & Financial (87 | 8.2%), Community & Social Service (38 | 3.6%), and Education Instruction & Library (38 | 3.6%).
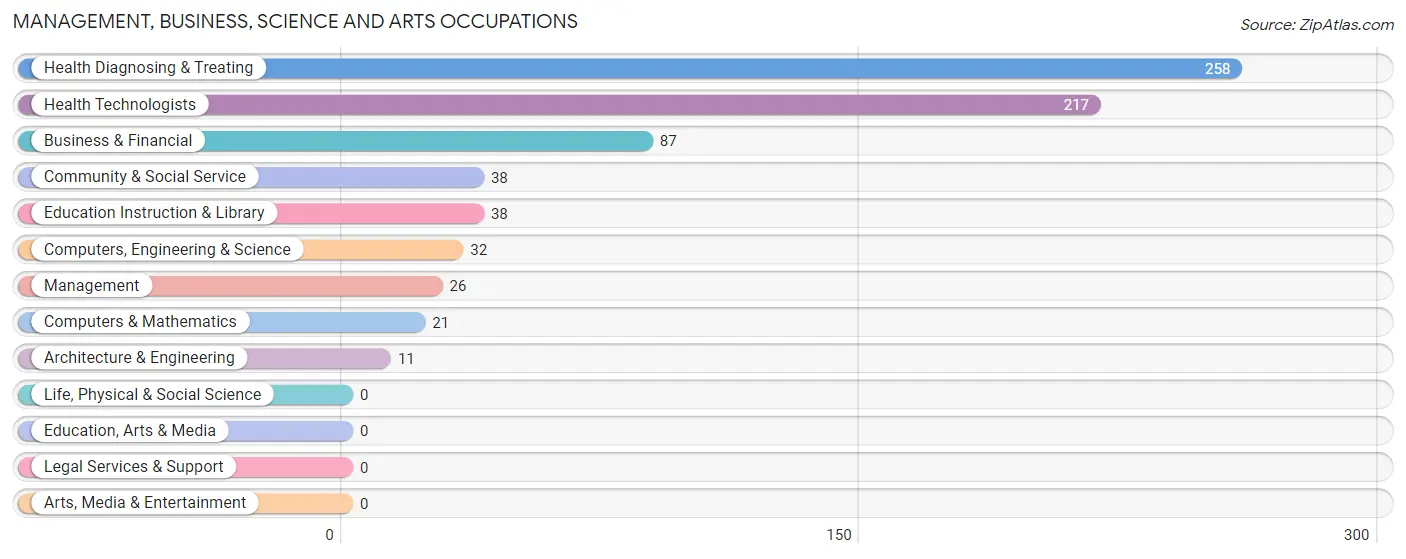
Management, Business, Science and Arts Occupations by Sex
Within the Management, Business, Science and Arts occupations in High Point, the most male-oriented occupations are Architecture & Engineering (100.0%), Health Technologists (95.4%), and Health Diagnosing & Treating (80.2%), while the most female-oriented occupations are Computers & Mathematics (100.0%), Business & Financial (86.2%), and Computers, Engineering & Science (65.6%).
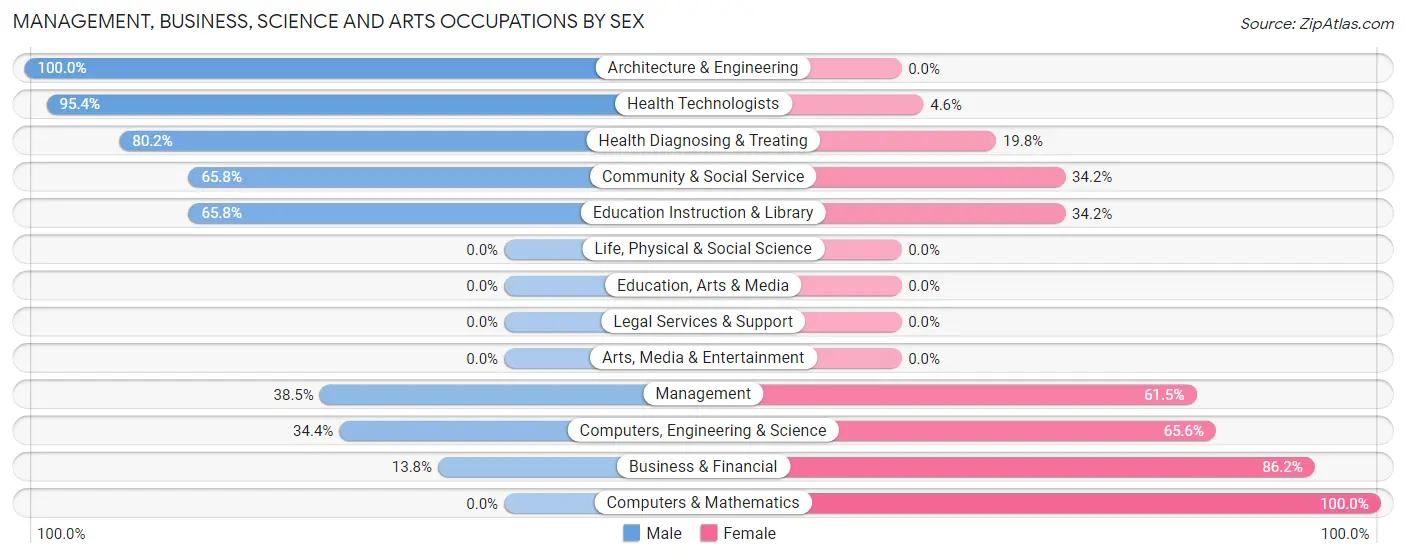
| Occupation | Male | Female |
| Management | 10 (38.5%) | 16 (61.5%) |
| Business & Financial | 12 (13.8%) | 75 (86.2%) |
| Computers, Engineering & Science | 11 (34.4%) | 21 (65.6%) |
| Computers & Mathematics | 0 (0.0%) | 21 (100.0%) |
| Architecture & Engineering | 11 (100.0%) | 0 (0.0%) |
| Life, Physical & Social Science | 0 (0.0%) | 0 (0.0%) |
| Community & Social Service | 25 (65.8%) | 13 (34.2%) |
| Education, Arts & Media | 0 (0.0%) | 0 (0.0%) |
| Legal Services & Support | 0 (0.0%) | 0 (0.0%) |
| Education Instruction & Library | 25 (65.8%) | 13 (34.2%) |
| Arts, Media & Entertainment | 0 (0.0%) | 0 (0.0%) |
| Health Diagnosing & Treating | 207 (80.2%) | 51 (19.8%) |
| Health Technologists | 207 (95.4%) | 10 (4.6%) |
| Total (Category) | 265 (60.1%) | 176 (39.9%) |
| Total (Overall) | 672 (63.0%) | 394 (37.0%) |
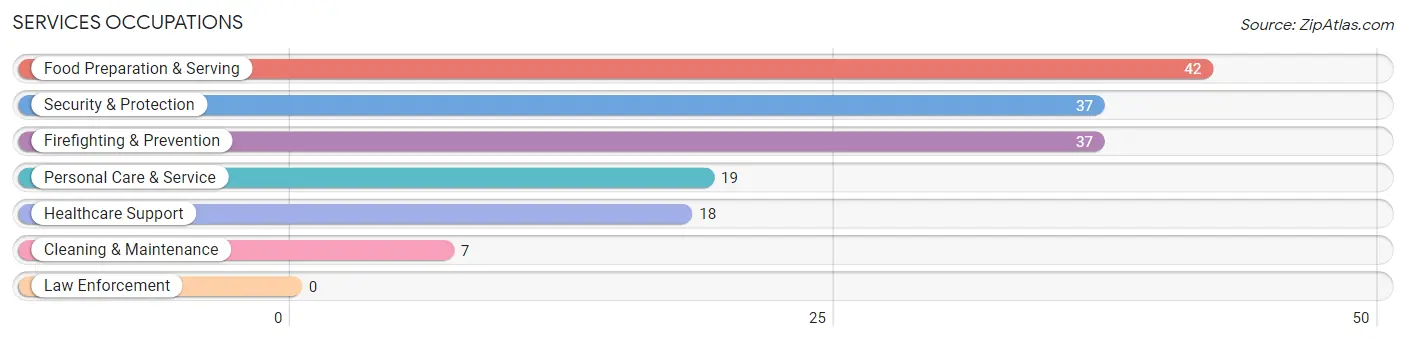
Services Occupations
The most common Services occupations in High Point are Food Preparation & Serving (42 | 3.9%), Security & Protection (37 | 3.5%), Firefighting & Prevention (37 | 3.5%), Personal Care & Service (19 | 1.8%), and Healthcare Support (18 | 1.7%).
Services Occupations by Sex
Within the Services occupations in High Point, the most male-oriented occupations are Food Preparation & Serving (100.0%), Cleaning & Maintenance (100.0%), and Security & Protection (21.6%), while the most female-oriented occupations are Healthcare Support (100.0%), Personal Care & Service (100.0%), and Security & Protection (78.4%).
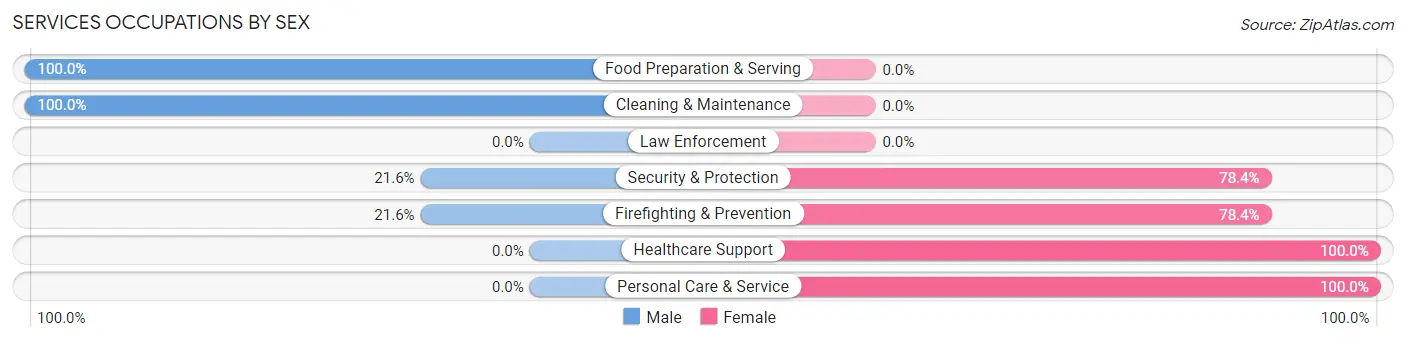
| Occupation | Male | Female |
| Healthcare Support | 0 (0.0%) | 18 (100.0%) |
| Security & Protection | 8 (21.6%) | 29 (78.4%) |
| Firefighting & Prevention | 8 (21.6%) | 29 (78.4%) |
| Law Enforcement | 0 (0.0%) | 0 (0.0%) |
| Food Preparation & Serving | 42 (100.0%) | 0 (0.0%) |
| Cleaning & Maintenance | 7 (100.0%) | 0 (0.0%) |
| Personal Care & Service | 0 (0.0%) | 19 (100.0%) |
| Total (Category) | 57 (46.3%) | 66 (53.7%) |
| Total (Overall) | 672 (63.0%) | 394 (37.0%) |
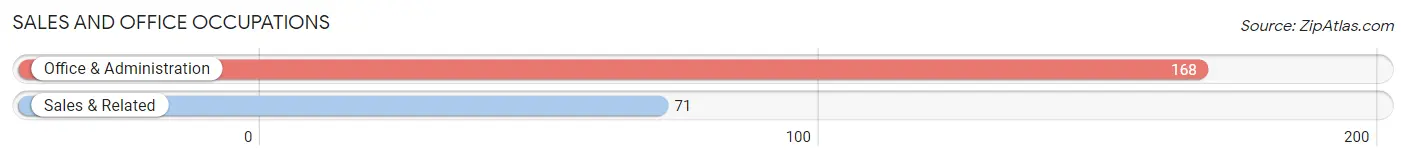
Sales and Office Occupations
The most common Sales and Office occupations in High Point are Office & Administration (168 | 15.8%), and Sales & Related (71 | 6.7%).
Sales and Office Occupations by Sex
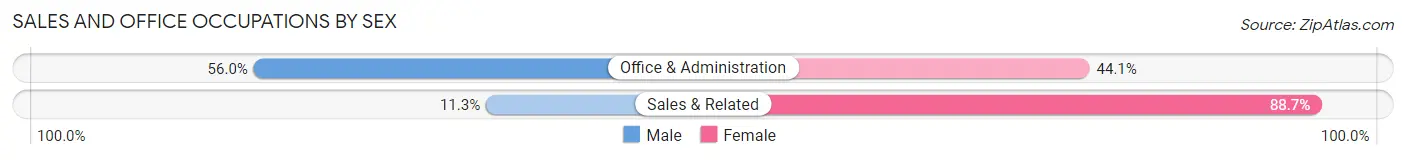
| Occupation | Male | Female |
| Sales & Related | 8 (11.3%) | 63 (88.7%) |
| Office & Administration | 94 (55.9%) | 74 (44.1%) |
| Total (Category) | 102 (42.7%) | 137 (57.3%) |
| Total (Overall) | 672 (63.0%) | 394 (37.0%) |
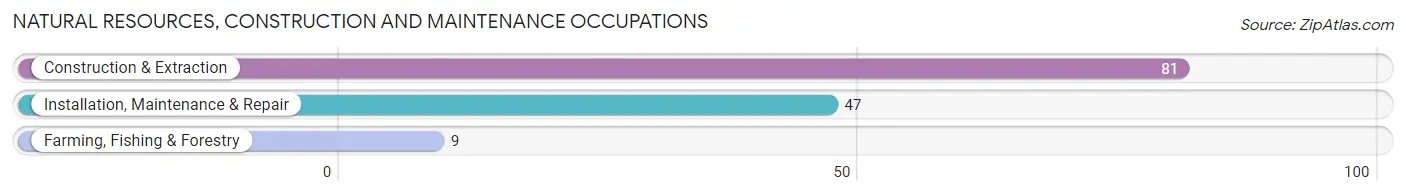
Natural Resources, Construction and Maintenance Occupations
The most common Natural Resources, Construction and Maintenance occupations in High Point are Construction & Extraction (81 | 7.6%), Installation, Maintenance & Repair (47 | 4.4%), and Farming, Fishing & Forestry (9 | 0.8%).
Natural Resources, Construction and Maintenance Occupations by Sex
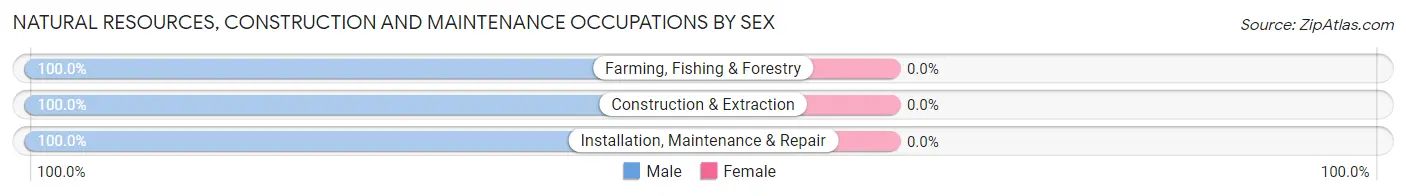
| Occupation | Male | Female |
| Farming, Fishing & Forestry | 9 (100.0%) | 0 (0.0%) |
| Construction & Extraction | 81 (100.0%) | 0 (0.0%) |
| Installation, Maintenance & Repair | 47 (100.0%) | 0 (0.0%) |
| Total (Category) | 137 (100.0%) | 0 (0.0%) |
| Total (Overall) | 672 (63.0%) | 394 (37.0%) |
Production, Transportation and Moving Occupations
The most common Production, Transportation and Moving occupations in High Point are Transportation (77 | 7.2%), Material Moving (34 | 3.2%), and Production (15 | 1.4%).
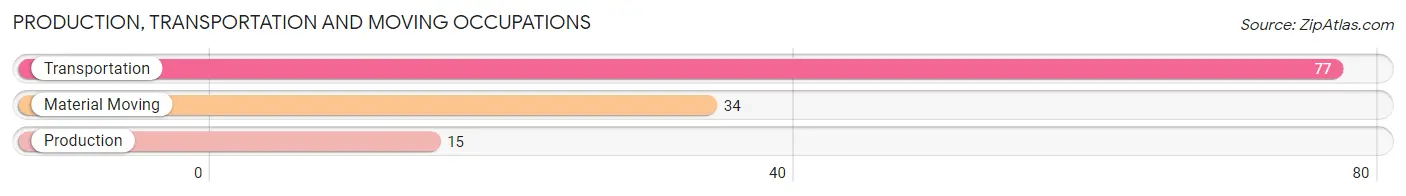
Production, Transportation and Moving Occupations by Sex
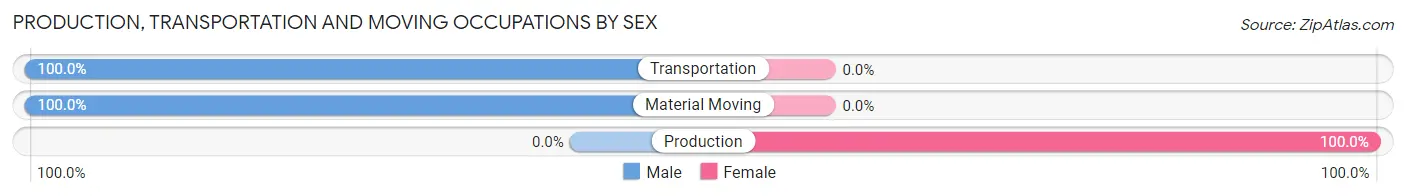
| Occupation | Male | Female |
| Production | 0 (0.0%) | 15 (100.0%) |
| Transportation | 77 (100.0%) | 0 (0.0%) |
| Material Moving | 34 (100.0%) | 0 (0.0%) |
| Total (Category) | 111 (88.1%) | 15 (11.9%) |
| Total (Overall) | 672 (63.0%) | 394 (37.0%) |
Employment Industries by Sex in High Point
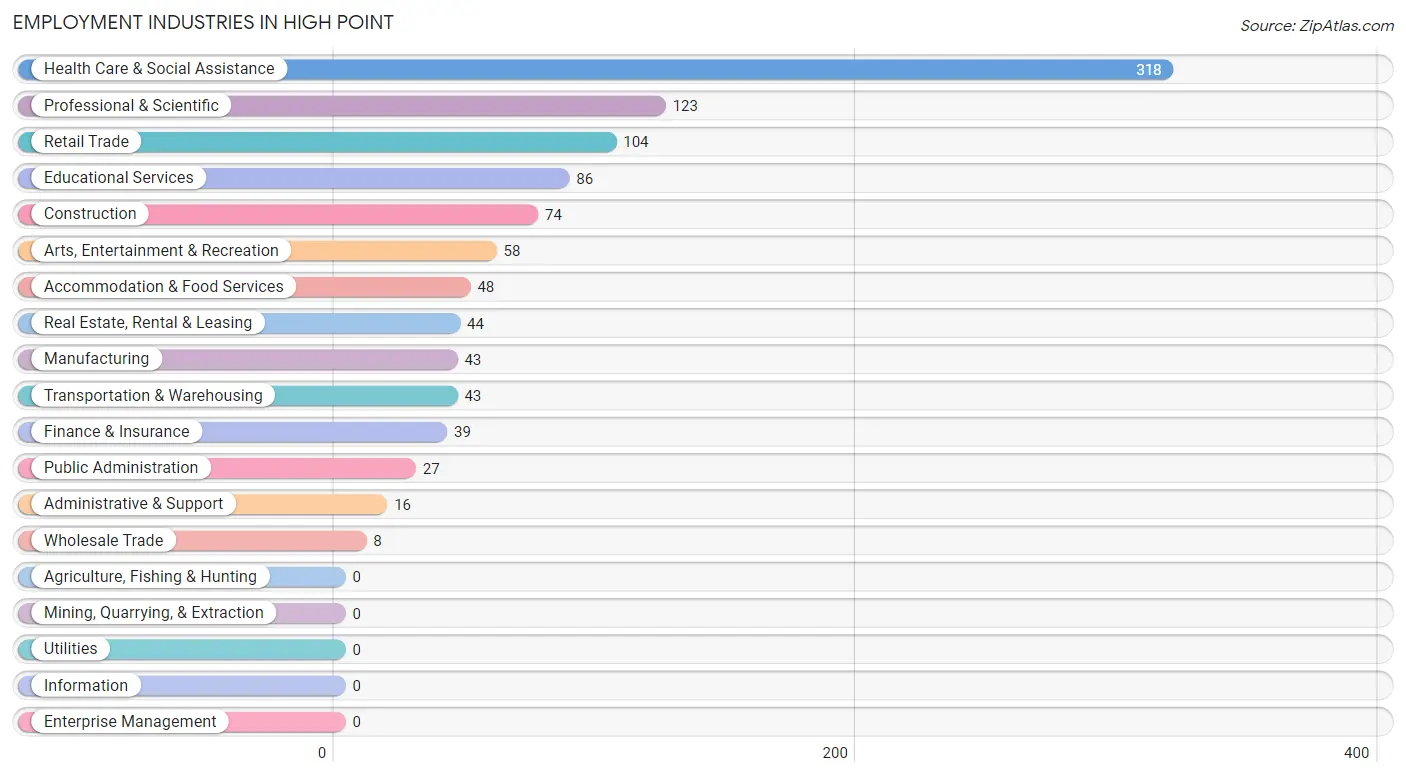
Employment Industries in High Point
The major employment industries in High Point include Health Care & Social Assistance (318 | 29.8%), Professional & Scientific (123 | 11.5%), Retail Trade (104 | 9.8%), Educational Services (86 | 8.1%), and Construction (74 | 6.9%).
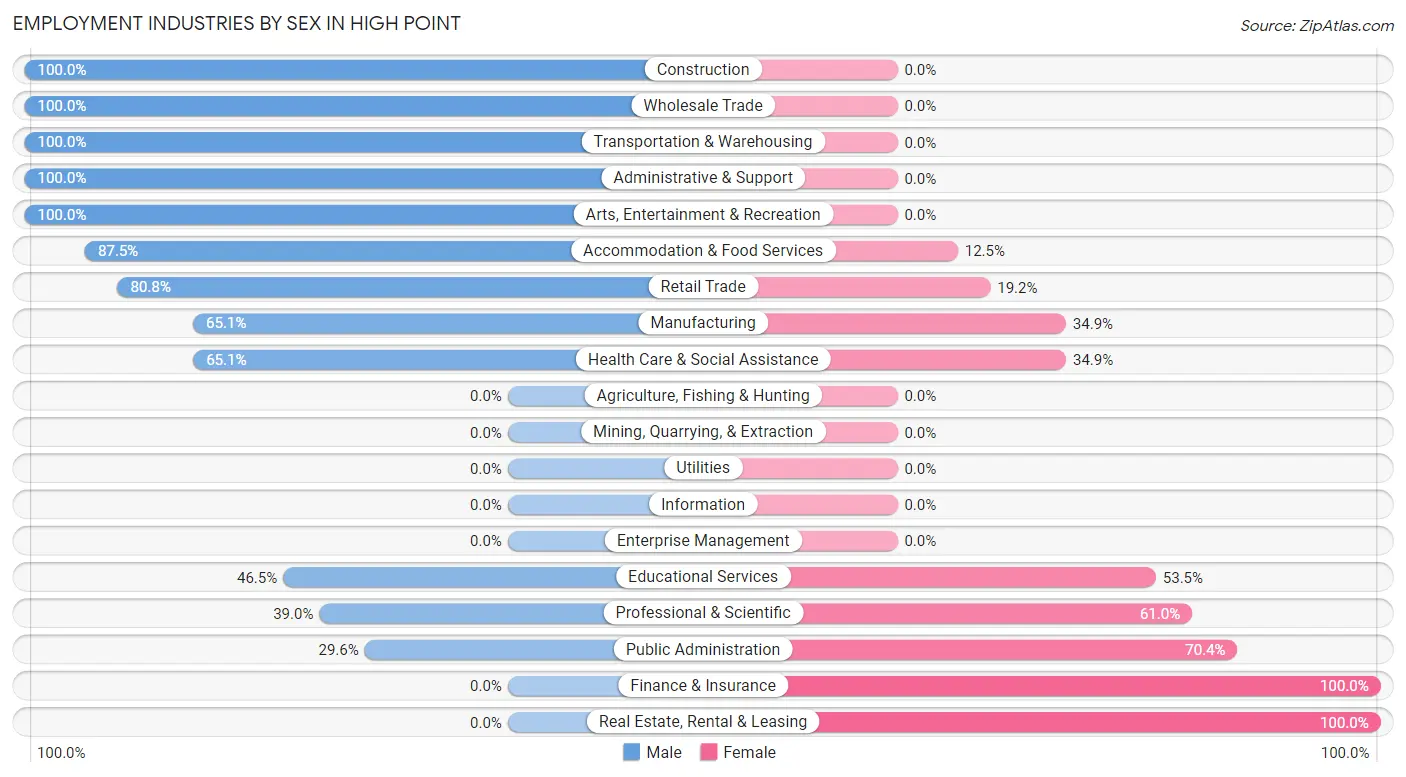
Employment Industries by Sex in High Point
The High Point industries that see more men than women are Construction (100.0%), Wholesale Trade (100.0%), and Transportation & Warehousing (100.0%), whereas the industries that tend to have a higher number of women are Finance & Insurance (100.0%), Real Estate, Rental & Leasing (100.0%), and Public Administration (70.4%).
| Industry | Male | Female |
| Agriculture, Fishing & Hunting | 0 (0.0%) | 0 (0.0%) |
| Mining, Quarrying, & Extraction | 0 (0.0%) | 0 (0.0%) |
| Construction | 74 (100.0%) | 0 (0.0%) |
| Manufacturing | 28 (65.1%) | 15 (34.9%) |
| Wholesale Trade | 8 (100.0%) | 0 (0.0%) |
| Retail Trade | 84 (80.8%) | 20 (19.2%) |
| Transportation & Warehousing | 43 (100.0%) | 0 (0.0%) |
| Utilities | 0 (0.0%) | 0 (0.0%) |
| Information | 0 (0.0%) | 0 (0.0%) |
| Finance & Insurance | 0 (0.0%) | 39 (100.0%) |
| Real Estate, Rental & Leasing | 0 (0.0%) | 44 (100.0%) |
| Professional & Scientific | 48 (39.0%) | 75 (61.0%) |
| Enterprise Management | 0 (0.0%) | 0 (0.0%) |
| Administrative & Support | 16 (100.0%) | 0 (0.0%) |
| Educational Services | 40 (46.5%) | 46 (53.5%) |
| Health Care & Social Assistance | 207 (65.1%) | 111 (34.9%) |
| Arts, Entertainment & Recreation | 58 (100.0%) | 0 (0.0%) |
| Accommodation & Food Services | 42 (87.5%) | 6 (12.5%) |
| Public Administration | 8 (29.6%) | 19 (70.4%) |
| Total | 672 (63.0%) | 394 (37.0%) |
Education in High Point
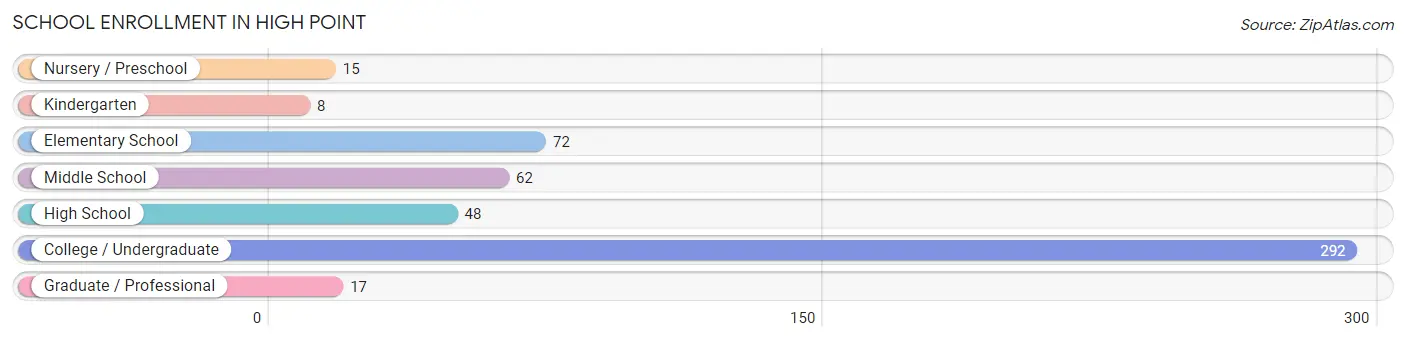
School Enrollment in High Point
The most common levels of schooling among the 514 students in High Point are college / undergraduate (292 | 56.8%), elementary school (72 | 14.0%), and middle school (62 | 12.1%).
| School Level | # Students | % Students |
| Nursery / Preschool | 15 | 2.9% |
| Kindergarten | 8 | 1.6% |
| Elementary School | 72 | 14.0% |
| Middle School | 62 | 12.1% |
| High School | 48 | 9.3% |
| College / Undergraduate | 292 | 56.8% |
| Graduate / Professional | 17 | 3.3% |
| Total | 514 | 100.0% |
School Enrollment by Age by Funding Source in High Point
Out of a total of 514 students who are enrolled in schools in High Point, 33 (6.4%) attend a private institution, while the remaining 481 (93.6%) are enrolled in public schools. The age group of 3 to 4 year olds has the highest likelihood of being enrolled in private schools, with 7 (100.0% in the age bracket) enrolled. Conversely, the age group of 10 to 14 year olds has the lowest likelihood of being enrolled in a private school, with 80 (100.0% in the age bracket) attending a public institution.
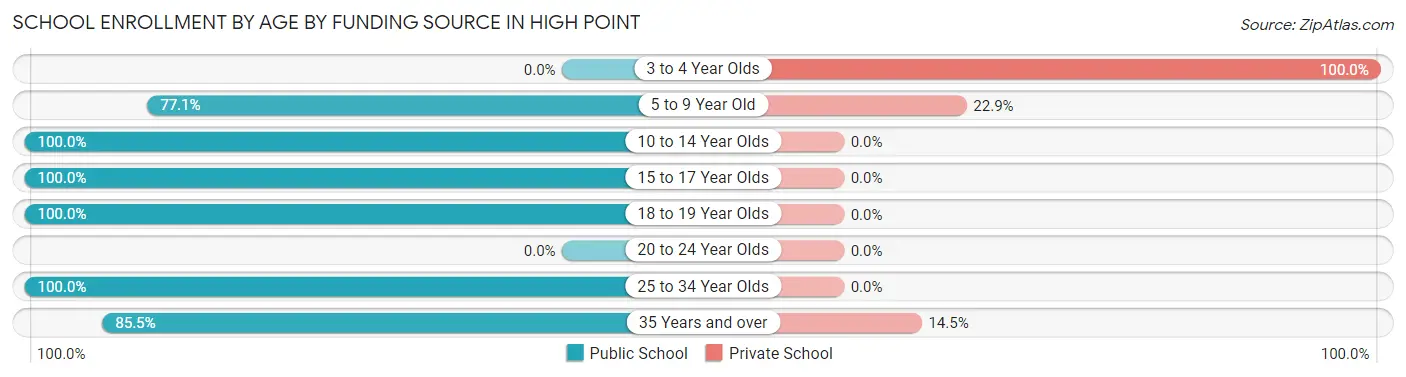
| Age Bracket | Public School | Private School |
| 3 to 4 Year Olds | 0 (0.0%) | 7 (100.0%) |
| 5 to 9 Year Old | 54 (77.1%) | 16 (22.9%) |
| 10 to 14 Year Olds | 80 (100.0%) | 0 (0.0%) |
| 15 to 17 Year Olds | 13 (100.0%) | 0 (0.0%) |
| 18 to 19 Year Olds | 49 (100.0%) | 0 (0.0%) |
| 20 to 24 Year Olds | 0 (0.0%) | 0 (0.0%) |
| 25 to 34 Year Olds | 226 (100.0%) | 0 (0.0%) |
| 35 Years and over | 59 (85.5%) | 10 (14.5%) |
| Total | 481 (93.6%) | 33 (6.4%) |
Educational Attainment by Field of Study in High Point
Business (117 | 20.6%), arts & humanities (117 | 20.6%), education (102 | 18.0%), engineering (76 | 13.4%), and social sciences (50 | 8.8%) are the most common fields of study among 567 individuals in High Point who have obtained a bachelor's degree or higher.
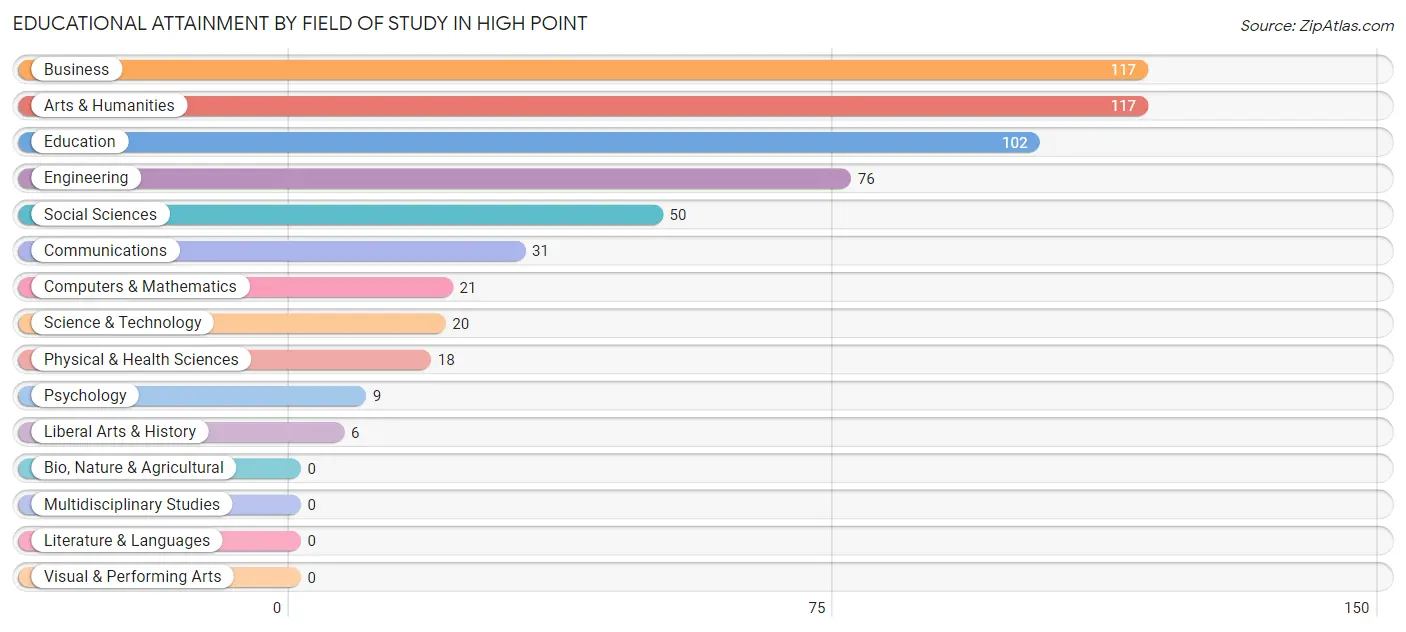
| Field of Study | # Graduates | % Graduates |
| Computers & Mathematics | 21 | 3.7% |
| Bio, Nature & Agricultural | 0 | 0.0% |
| Physical & Health Sciences | 18 | 3.2% |
| Psychology | 9 | 1.6% |
| Social Sciences | 50 | 8.8% |
| Engineering | 76 | 13.4% |
| Multidisciplinary Studies | 0 | 0.0% |
| Science & Technology | 20 | 3.5% |
| Business | 117 | 20.6% |
| Education | 102 | 18.0% |
| Literature & Languages | 0 | 0.0% |
| Liberal Arts & History | 6 | 1.1% |
| Visual & Performing Arts | 0 | 0.0% |
| Communications | 31 | 5.5% |
| Arts & Humanities | 117 | 20.6% |
| Total | 567 | 100.0% |
Transportation & Commute in High Point
Vehicle Availability by Sex in High Point
The most prevalent vehicle ownership categories in High Point are males with 3 vehicles (295, accounting for 43.9%) and females with 3 vehicles (30, making up 74.9%).
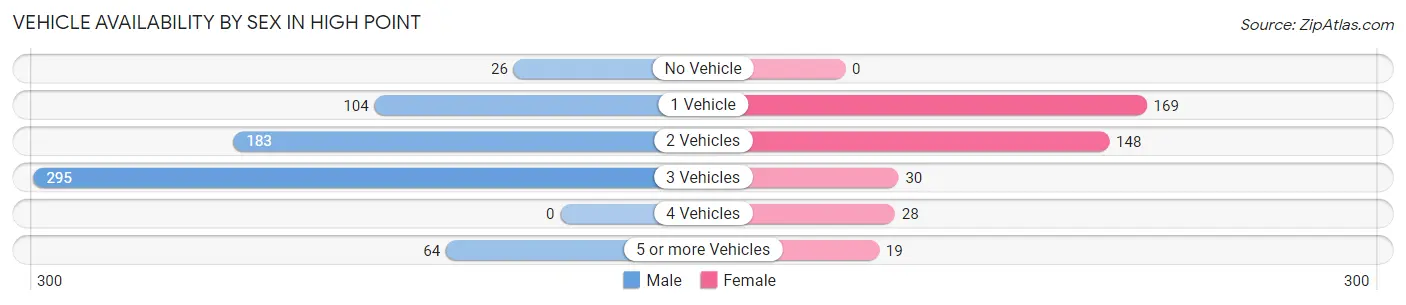
| Vehicles Available | Male | Female |
| No Vehicle | 26 (3.9%) | 0 (0.0%) |
| 1 Vehicle | 104 (15.5%) | 169 (42.9%) |
| 2 Vehicles | 183 (27.2%) | 148 (37.6%) |
| 3 Vehicles | 295 (43.9%) | 30 (7.6%) |
| 4 Vehicles | 0 (0.0%) | 28 (7.1%) |
| 5 or more Vehicles | 64 (9.5%) | 19 (4.8%) |
| Total | 672 (100.0%) | 394 (100.0%) |
Commute Time in High Point
The most frequently occuring commute durations in High Point are 10 to 14 minutes (235 commuters, 24.2%), 5 to 9 minutes (152 commuters, 15.7%), and 30 to 34 minutes (115 commuters, 11.8%).
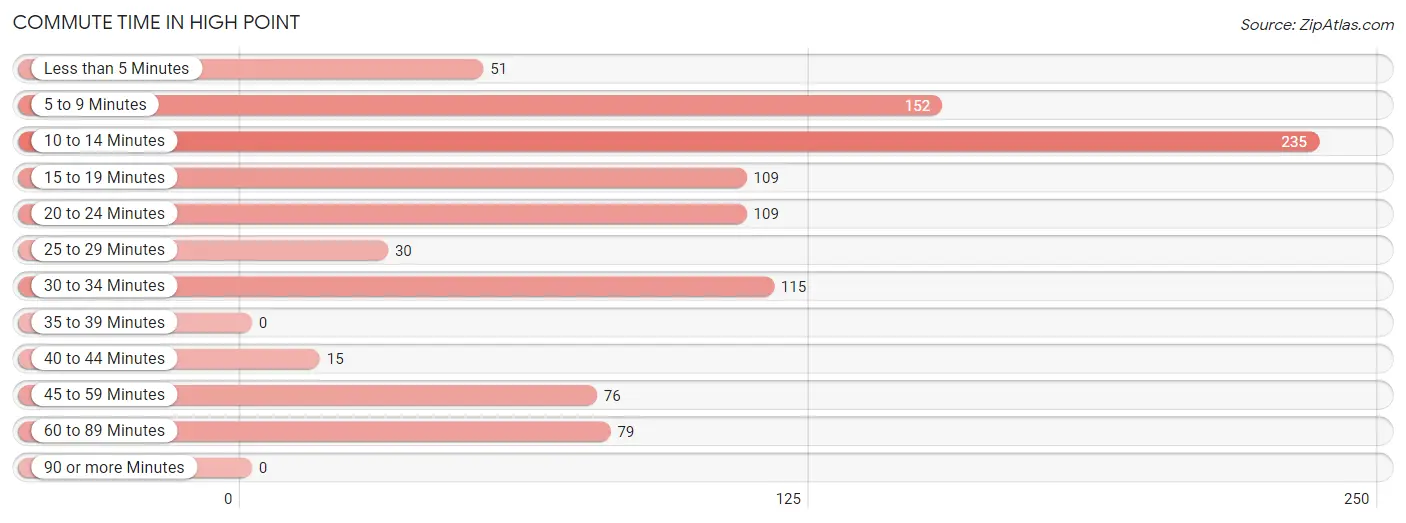
| Commute Time | # Commuters | % Commuters |
| Less than 5 Minutes | 51 | 5.2% |
| 5 to 9 Minutes | 152 | 15.7% |
| 10 to 14 Minutes | 235 | 24.2% |
| 15 to 19 Minutes | 109 | 11.2% |
| 20 to 24 Minutes | 109 | 11.2% |
| 25 to 29 Minutes | 30 | 3.1% |
| 30 to 34 Minutes | 115 | 11.8% |
| 35 to 39 Minutes | 0 | 0.0% |
| 40 to 44 Minutes | 15 | 1.5% |
| 45 to 59 Minutes | 76 | 7.8% |
| 60 to 89 Minutes | 79 | 8.1% |
| 90 or more Minutes | 0 | 0.0% |
Commute Time by Sex in High Point
The most common commute times in High Point are 10 to 14 minutes (227 commuters, 34.1%) for males and 15 to 19 minutes (71 commuters, 23.2%) for females.
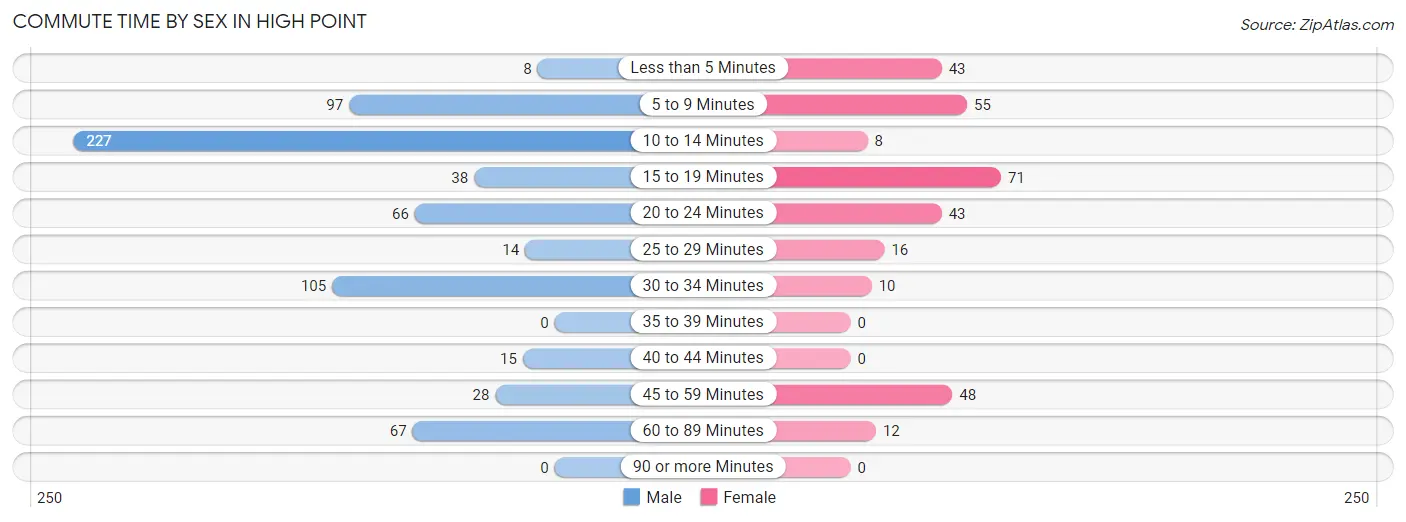
| Commute Time | Male | Female |
| Less than 5 Minutes | 8 (1.2%) | 43 (14.1%) |
| 5 to 9 Minutes | 97 (14.6%) | 55 (18.0%) |
| 10 to 14 Minutes | 227 (34.1%) | 8 (2.6%) |
| 15 to 19 Minutes | 38 (5.7%) | 71 (23.2%) |
| 20 to 24 Minutes | 66 (9.9%) | 43 (14.1%) |
| 25 to 29 Minutes | 14 (2.1%) | 16 (5.2%) |
| 30 to 34 Minutes | 105 (15.8%) | 10 (3.3%) |
| 35 to 39 Minutes | 0 (0.0%) | 0 (0.0%) |
| 40 to 44 Minutes | 15 (2.3%) | 0 (0.0%) |
| 45 to 59 Minutes | 28 (4.2%) | 48 (15.7%) |
| 60 to 89 Minutes | 67 (10.1%) | 12 (3.9%) |
| 90 or more Minutes | 0 (0.0%) | 0 (0.0%) |
Time of Departure to Work by Sex in High Point
The most frequent times of departure to work in High Point are 4:00 PM to 11:59 PM (213, 32.0%) for males and 6:30 AM to 6:59 AM (58, 19.0%) for females.
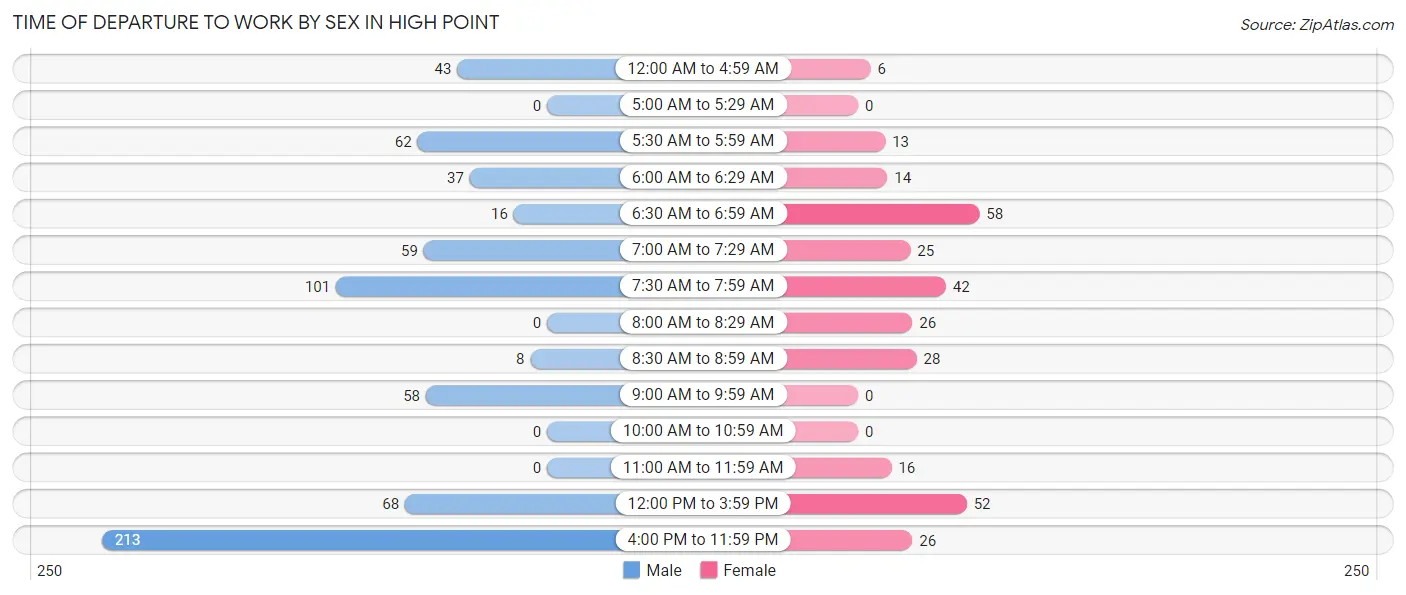
| Time of Departure | Male | Female |
| 12:00 AM to 4:59 AM | 43 (6.5%) | 6 (2.0%) |
| 5:00 AM to 5:29 AM | 0 (0.0%) | 0 (0.0%) |
| 5:30 AM to 5:59 AM | 62 (9.3%) | 13 (4.3%) |
| 6:00 AM to 6:29 AM | 37 (5.6%) | 14 (4.6%) |
| 6:30 AM to 6:59 AM | 16 (2.4%) | 58 (19.0%) |
| 7:00 AM to 7:29 AM | 59 (8.9%) | 25 (8.2%) |
| 7:30 AM to 7:59 AM | 101 (15.2%) | 42 (13.7%) |
| 8:00 AM to 8:29 AM | 0 (0.0%) | 26 (8.5%) |
| 8:30 AM to 8:59 AM | 8 (1.2%) | 28 (9.1%) |
| 9:00 AM to 9:59 AM | 58 (8.7%) | 0 (0.0%) |
| 10:00 AM to 10:59 AM | 0 (0.0%) | 0 (0.0%) |
| 11:00 AM to 11:59 AM | 0 (0.0%) | 16 (5.2%) |
| 12:00 PM to 3:59 PM | 68 (10.2%) | 52 (17.0%) |
| 4:00 PM to 11:59 PM | 213 (32.0%) | 26 (8.5%) |
| Total | 665 (100.0%) | 306 (100.0%) |
Housing Occupancy in High Point
Occupancy by Ownership in High Point
Of the total 2,054 dwellings in High Point, owner-occupied units account for 1,797 (87.5%), while renter-occupied units make up 257 (12.5%).
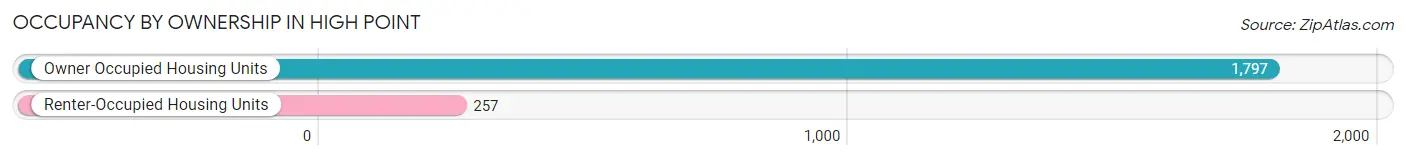
| Occupancy | # Housing Units | % Housing Units |
| Owner Occupied Housing Units | 1,797 | 87.5% |
| Renter-Occupied Housing Units | 257 | 12.5% |
| Total Occupied Housing Units | 2,054 | 100.0% |
Occupancy by Household Size in High Point
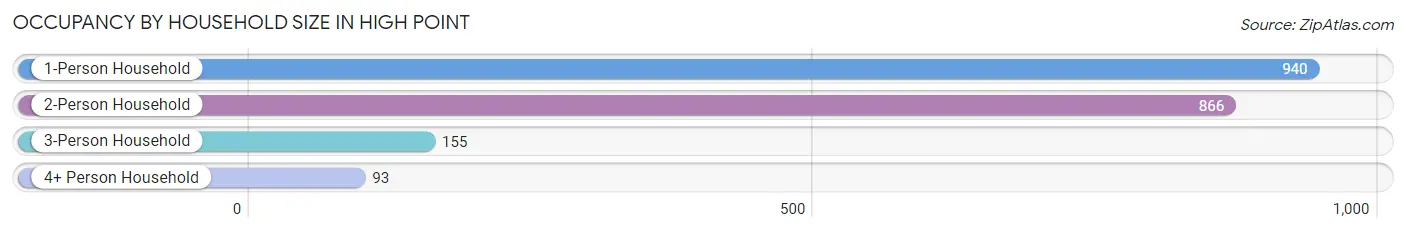
| Household Size | # Housing Units | % Housing Units |
| 1-Person Household | 940 | 45.8% |
| 2-Person Household | 866 | 42.2% |
| 3-Person Household | 155 | 7.5% |
| 4+ Person Household | 93 | 4.5% |
| Total Housing Units | 2,054 | 100.0% |
Occupancy by Ownership by Household Size in High Point
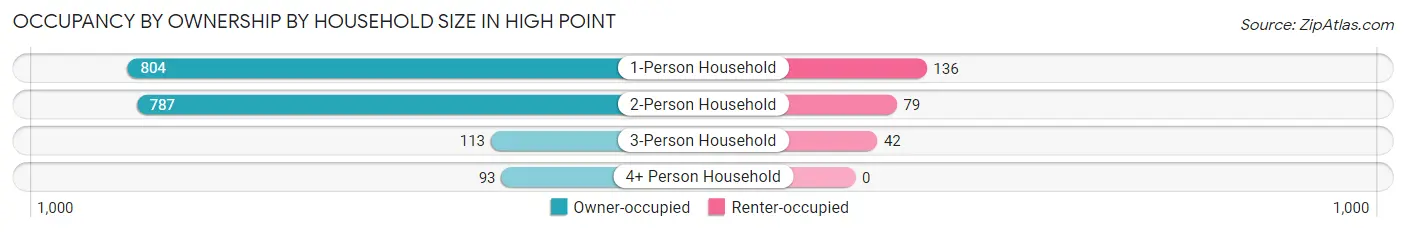
| Household Size | Owner-occupied | Renter-occupied |
| 1-Person Household | 804 (85.5%) | 136 (14.5%) |
| 2-Person Household | 787 (90.9%) | 79 (9.1%) |
| 3-Person Household | 113 (72.9%) | 42 (27.1%) |
| 4+ Person Household | 93 (100.0%) | 0 (0.0%) |
| Total Housing Units | 1,797 (87.5%) | 257 (12.5%) |
Occupancy by Educational Attainment in High Point
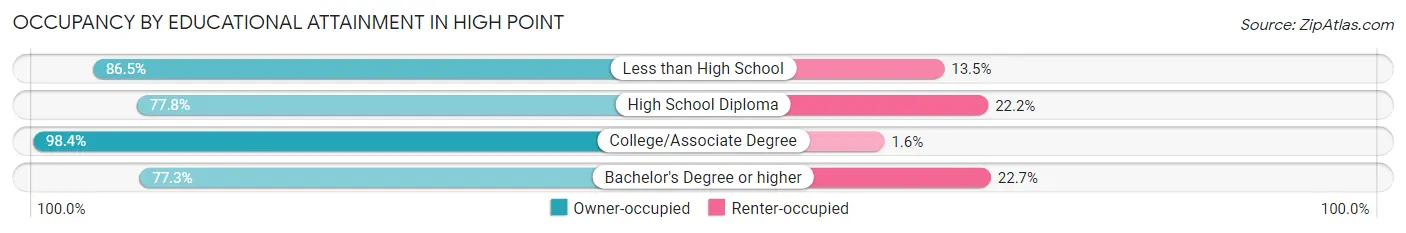
| Household Size | Owner-occupied | Renter-occupied |
| Less than High School | 128 (86.5%) | 20 (13.5%) |
| High School Diploma | 522 (77.8%) | 149 (22.2%) |
| College/Associate Degree | 899 (98.4%) | 15 (1.6%) |
| Bachelor's Degree or higher | 248 (77.3%) | 73 (22.7%) |
Occupancy by Age of Householder in High Point
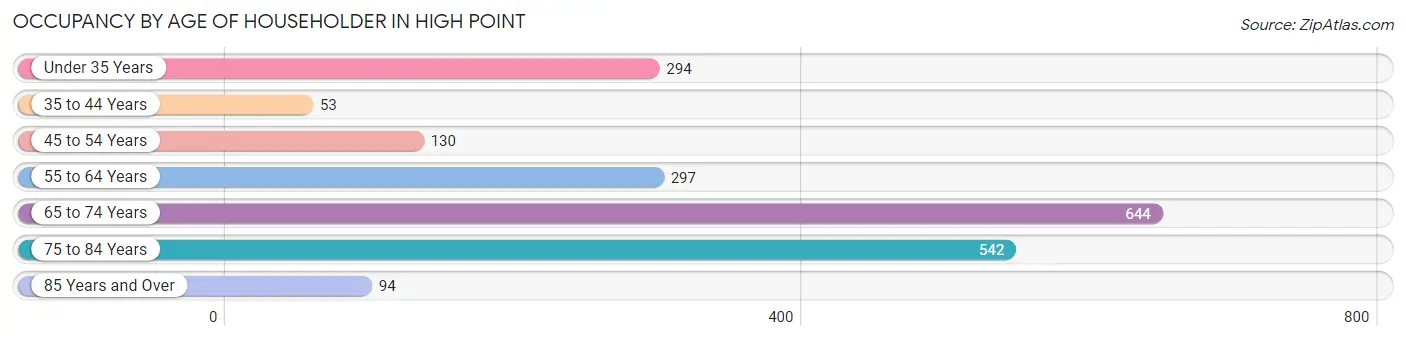
| Age Bracket | # Households | % Households |
| Under 35 Years | 294 | 14.3% |
| 35 to 44 Years | 53 | 2.6% |
| 45 to 54 Years | 130 | 6.3% |
| 55 to 64 Years | 297 | 14.5% |
| 65 to 74 Years | 644 | 31.4% |
| 75 to 84 Years | 542 | 26.4% |
| 85 Years and Over | 94 | 4.6% |
| Total | 2,054 | 100.0% |
Housing Finances in High Point
Median Income by Occupancy in High Point
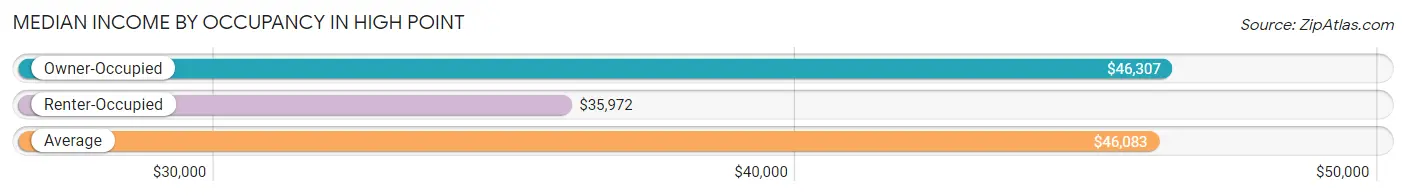
| Occupancy Type | # Households | Median Income |
| Owner-Occupied | 1,797 (87.5%) | $46,307 |
| Renter-Occupied | 257 (12.5%) | $35,972 |
| Average | 2,054 (100.0%) | $46,083 |
Occupancy by Householder Income Bracket in High Point
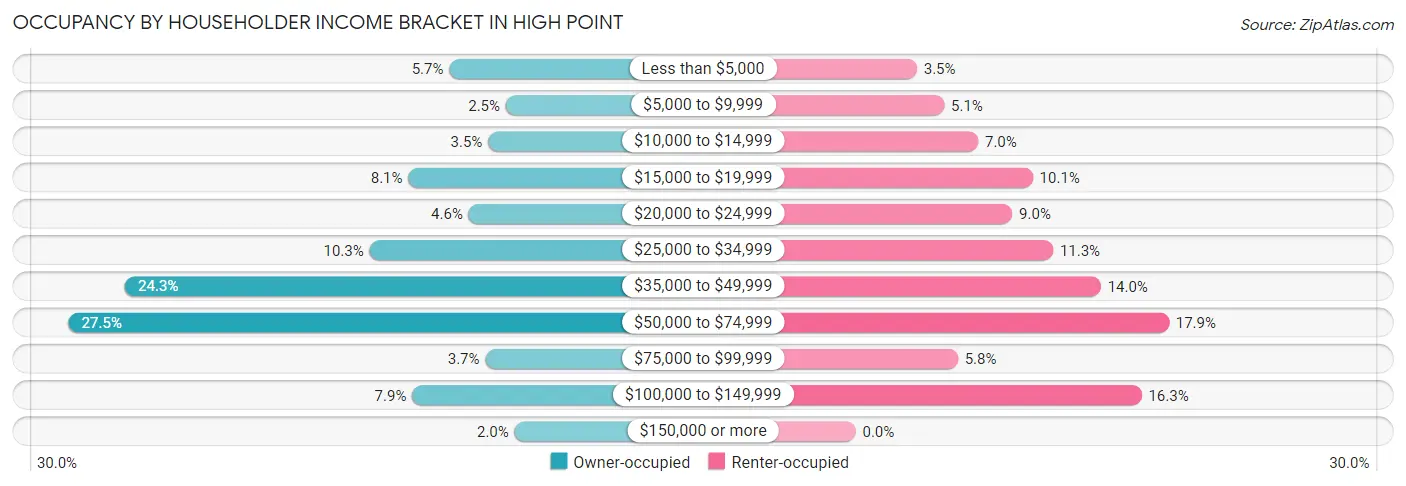
| Income Bracket | Owner-occupied | Renter-occupied |
| Less than $5,000 | 103 (5.7%) | 9 (3.5%) |
| $5,000 to $9,999 | 45 (2.5%) | 13 (5.1%) |
| $10,000 to $14,999 | 63 (3.5%) | 18 (7.0%) |
| $15,000 to $19,999 | 145 (8.1%) | 26 (10.1%) |
| $20,000 to $24,999 | 83 (4.6%) | 23 (8.9%) |
| $25,000 to $34,999 | 185 (10.3%) | 29 (11.3%) |
| $35,000 to $49,999 | 436 (24.3%) | 36 (14.0%) |
| $50,000 to $74,999 | 494 (27.5%) | 46 (17.9%) |
| $75,000 to $99,999 | 66 (3.7%) | 15 (5.8%) |
| $100,000 to $149,999 | 141 (7.9%) | 42 (16.3%) |
| $150,000 or more | 36 (2.0%) | 0 (0.0%) |
| Total | 1,797 (100.0%) | 257 (100.0%) |
Monthly Housing Cost Tiers in High Point
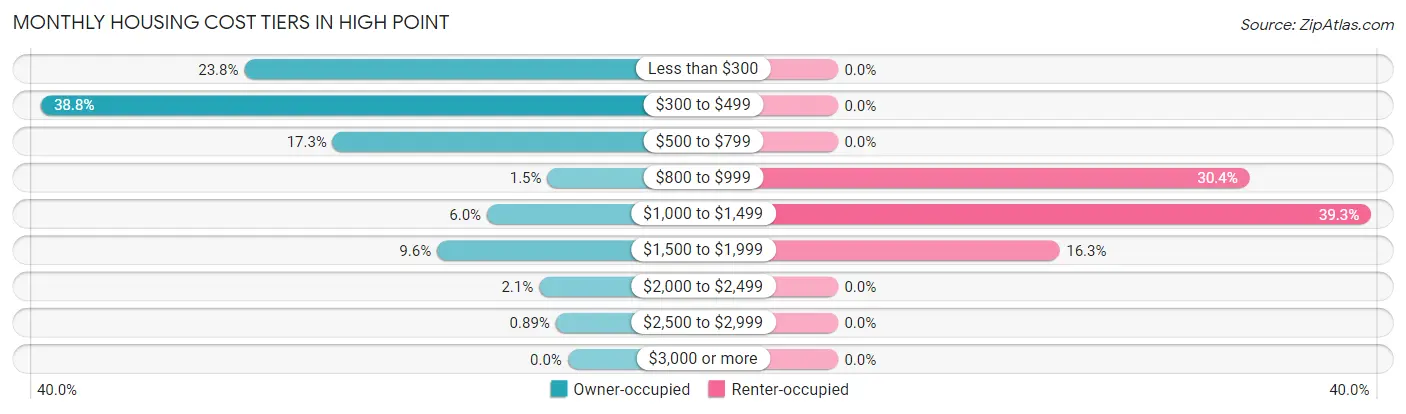
| Monthly Cost | Owner-occupied | Renter-occupied |
| Less than $300 | 428 (23.8%) | 0 (0.0%) |
| $300 to $499 | 697 (38.8%) | 0 (0.0%) |
| $500 to $799 | 311 (17.3%) | 0 (0.0%) |
| $800 to $999 | 27 (1.5%) | 78 (30.3%) |
| $1,000 to $1,499 | 107 (5.9%) | 101 (39.3%) |
| $1,500 to $1,999 | 173 (9.6%) | 42 (16.3%) |
| $2,000 to $2,499 | 38 (2.1%) | 0 (0.0%) |
| $2,500 to $2,999 | 16 (0.9%) | 0 (0.0%) |
| $3,000 or more | 0 (0.0%) | 0 (0.0%) |
| Total | 1,797 (100.0%) | 257 (100.0%) |
Physical Housing Characteristics in High Point
Housing Structures in High Point
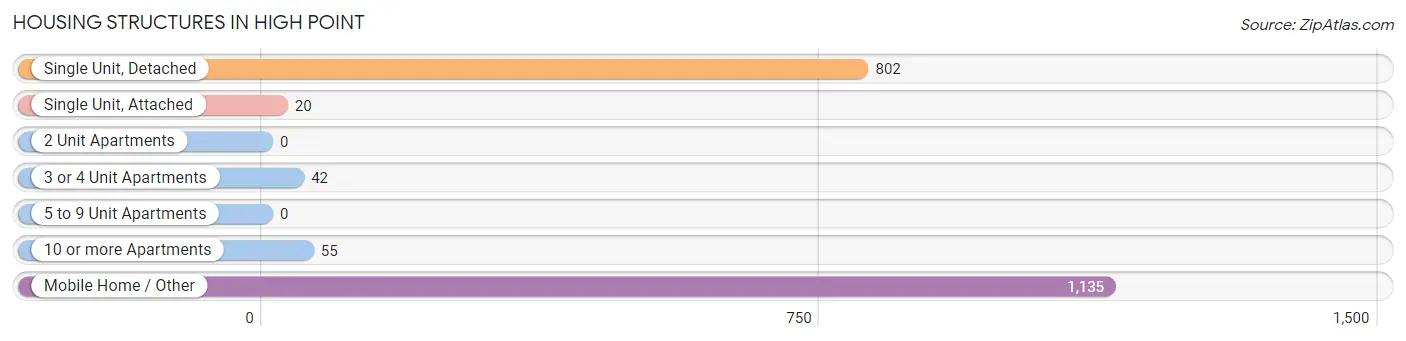
| Structure Type | # Housing Units | % Housing Units |
| Single Unit, Detached | 802 | 39.1% |
| Single Unit, Attached | 20 | 1.0% |
| 2 Unit Apartments | 0 | 0.0% |
| 3 or 4 Unit Apartments | 42 | 2.0% |
| 5 to 9 Unit Apartments | 0 | 0.0% |
| 10 or more Apartments | 55 | 2.7% |
| Mobile Home / Other | 1,135 | 55.3% |
| Total | 2,054 | 100.0% |
Housing Structures by Occupancy in High Point
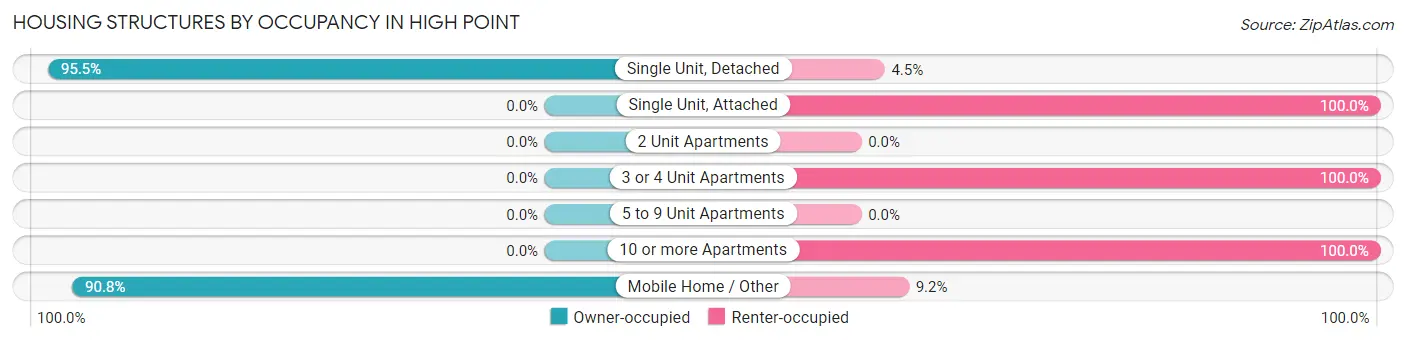
| Structure Type | Owner-occupied | Renter-occupied |
| Single Unit, Detached | 766 (95.5%) | 36 (4.5%) |
| Single Unit, Attached | 0 (0.0%) | 20 (100.0%) |
| 2 Unit Apartments | 0 (0.0%) | 0 (0.0%) |
| 3 or 4 Unit Apartments | 0 (0.0%) | 42 (100.0%) |
| 5 to 9 Unit Apartments | 0 (0.0%) | 0 (0.0%) |
| 10 or more Apartments | 0 (0.0%) | 55 (100.0%) |
| Mobile Home / Other | 1,031 (90.8%) | 104 (9.2%) |
| Total | 1,797 (87.5%) | 257 (12.5%) |
Housing Structures by Number of Rooms in High Point
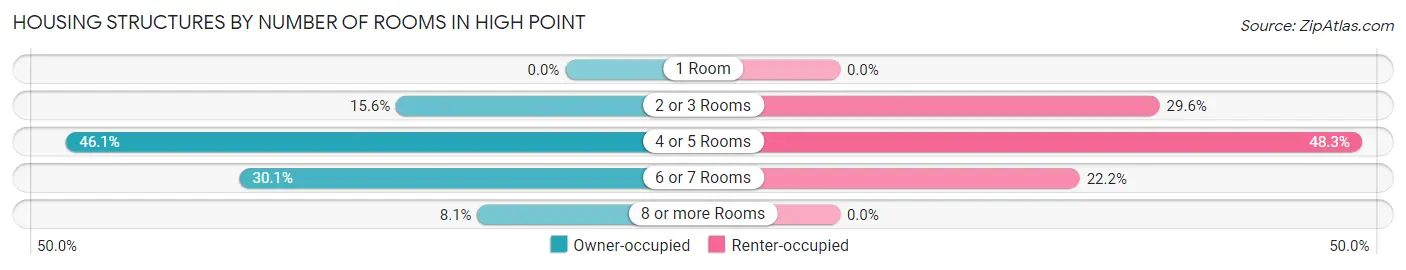
| Number of Rooms | Owner-occupied | Renter-occupied |
| 1 Room | 0 (0.0%) | 0 (0.0%) |
| 2 or 3 Rooms | 281 (15.6%) | 76 (29.6%) |
| 4 or 5 Rooms | 829 (46.1%) | 124 (48.2%) |
| 6 or 7 Rooms | 541 (30.1%) | 57 (22.2%) |
| 8 or more Rooms | 146 (8.1%) | 0 (0.0%) |
| Total | 1,797 (100.0%) | 257 (100.0%) |
Housing Structure by Heating Type in High Point
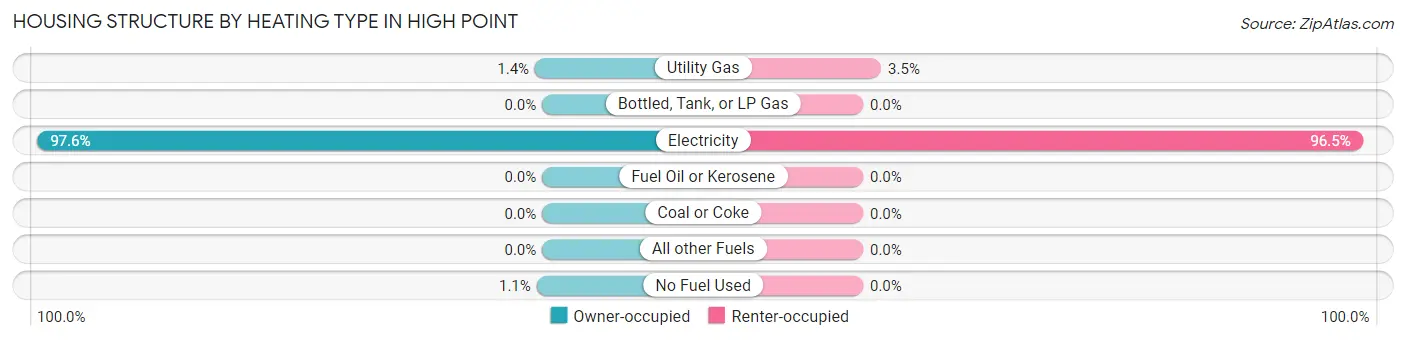
| Heating Type | Owner-occupied | Renter-occupied |
| Utility Gas | 25 (1.4%) | 9 (3.5%) |
| Bottled, Tank, or LP Gas | 0 (0.0%) | 0 (0.0%) |
| Electricity | 1,753 (97.6%) | 248 (96.5%) |
| Fuel Oil or Kerosene | 0 (0.0%) | 0 (0.0%) |
| Coal or Coke | 0 (0.0%) | 0 (0.0%) |
| All other Fuels | 0 (0.0%) | 0 (0.0%) |
| No Fuel Used | 19 (1.1%) | 0 (0.0%) |
| Total | 1,797 (100.0%) | 257 (100.0%) |
Household Vehicle Usage in High Point
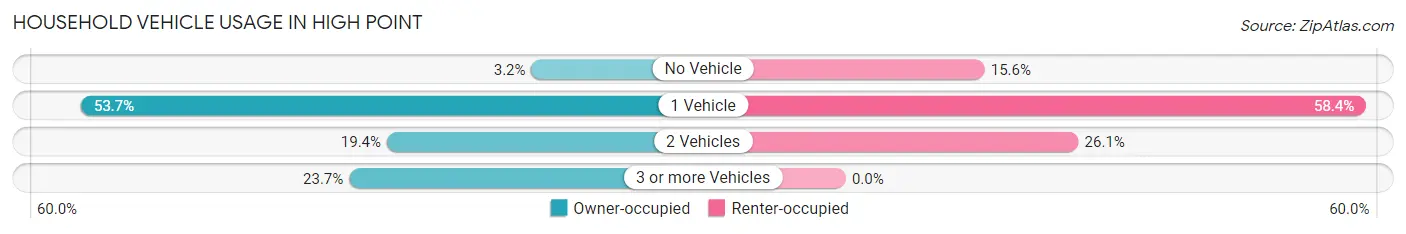
| Vehicles per Household | Owner-occupied | Renter-occupied |
| No Vehicle | 58 (3.2%) | 40 (15.6%) |
| 1 Vehicle | 965 (53.7%) | 150 (58.4%) |
| 2 Vehicles | 349 (19.4%) | 67 (26.1%) |
| 3 or more Vehicles | 425 (23.6%) | 0 (0.0%) |
| Total | 1,797 (100.0%) | 257 (100.0%) |
Real Estate & Mortgages in High Point
Real Estate and Mortgage Overview in High Point
| Characteristic | Without Mortgage | With Mortgage |
| Housing Units | 1,284 | 513 |
| Median Property Value | $104,300 | $172,500 |
| Median Household Income | $45,210 | $0 |
| Monthly Housing Costs | $355 | $0 |
| Real Estate Taxes | $852 | $19 |
Property Value by Mortgage Status in High Point
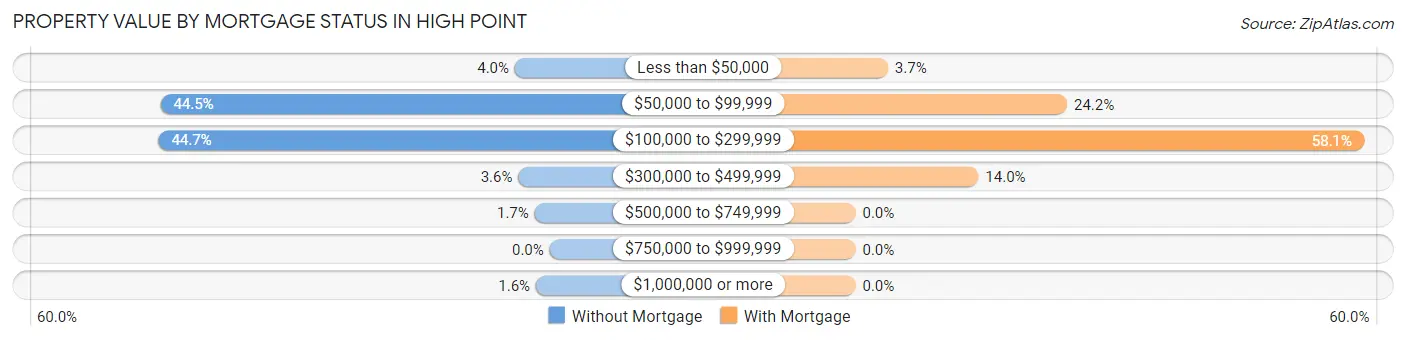
| Property Value | Without Mortgage | With Mortgage |
| Less than $50,000 | 51 (4.0%) | 19 (3.7%) |
| $50,000 to $99,999 | 571 (44.5%) | 124 (24.2%) |
| $100,000 to $299,999 | 574 (44.7%) | 298 (58.1%) |
| $300,000 to $499,999 | 46 (3.6%) | 72 (14.0%) |
| $500,000 to $749,999 | 22 (1.7%) | 0 (0.0%) |
| $750,000 to $999,999 | 0 (0.0%) | 0 (0.0%) |
| $1,000,000 or more | 20 (1.6%) | 0 (0.0%) |
| Total | 1,284 (100.0%) | 513 (100.0%) |
Household Income by Mortgage Status in High Point
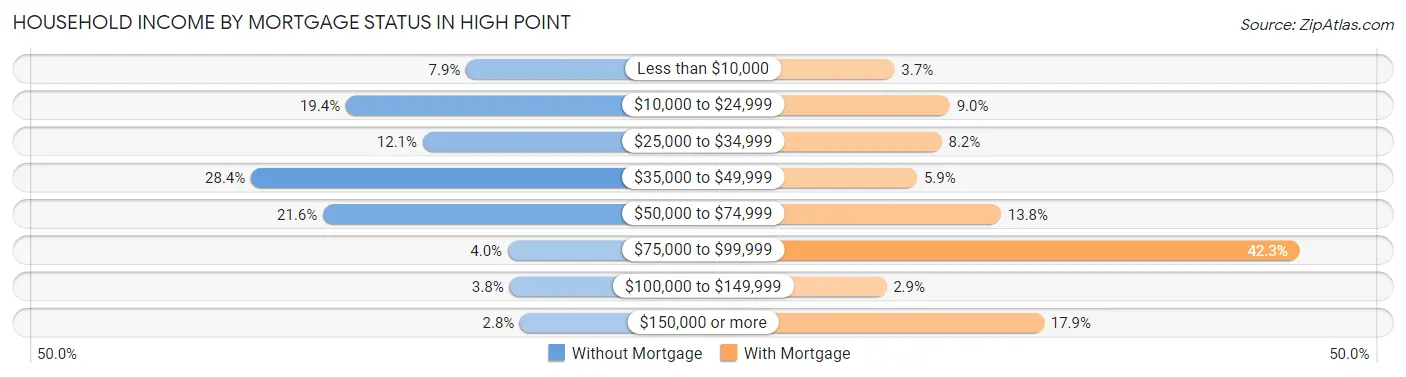
| Household Income | Without Mortgage | With Mortgage |
| Less than $10,000 | 102 (7.9%) | 19 (3.7%) |
| $10,000 to $24,999 | 249 (19.4%) | 46 (9.0%) |
| $25,000 to $34,999 | 155 (12.1%) | 42 (8.2%) |
| $35,000 to $49,999 | 365 (28.4%) | 30 (5.9%) |
| $50,000 to $74,999 | 277 (21.6%) | 71 (13.8%) |
| $75,000 to $99,999 | 51 (4.0%) | 217 (42.3%) |
| $100,000 to $149,999 | 49 (3.8%) | 15 (2.9%) |
| $150,000 or more | 36 (2.8%) | 92 (17.9%) |
| Total | 1,284 (100.0%) | 513 (100.0%) |
Property Value to Household Income Ratio in High Point
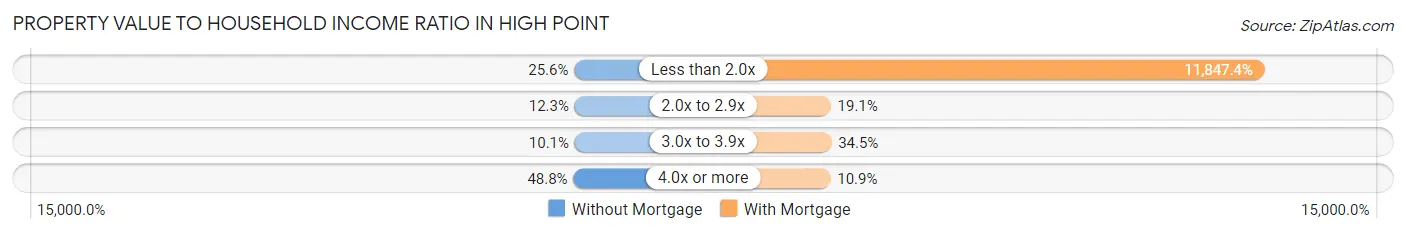
| Value-to-Income Ratio | Without Mortgage | With Mortgage |
| Less than 2.0x | 329 (25.6%) | 60,777 (11,847.4%) |
| 2.0x to 2.9x | 158 (12.3%) | 98 (19.1%) |
| 3.0x to 3.9x | 129 (10.1%) | 177 (34.5%) |
| 4.0x or more | 627 (48.8%) | 56 (10.9%) |
| Total | 1,284 (100.0%) | 513 (100.0%) |
Real Estate Taxes by Mortgage Status in High Point
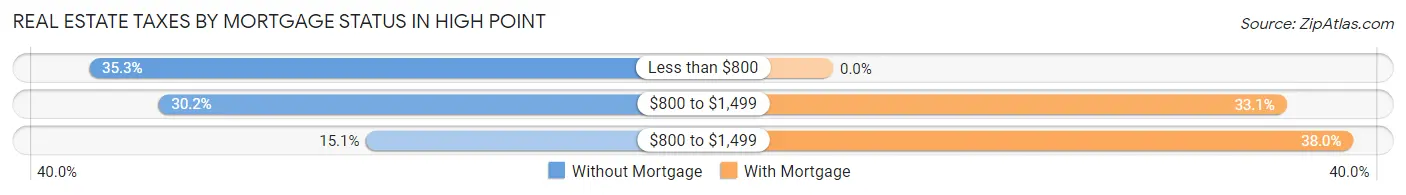
| Property Taxes | Without Mortgage | With Mortgage |
| Less than $800 | 453 (35.3%) | 0 (0.0%) |
| $800 to $1,499 | 388 (30.2%) | 170 (33.1%) |
| $800 to $1,499 | 194 (15.1%) | 195 (38.0%) |
| Total | 1,284 (100.0%) | 513 (100.0%) |
Health & Disability in High Point
Health Insurance Coverage by Age in High Point
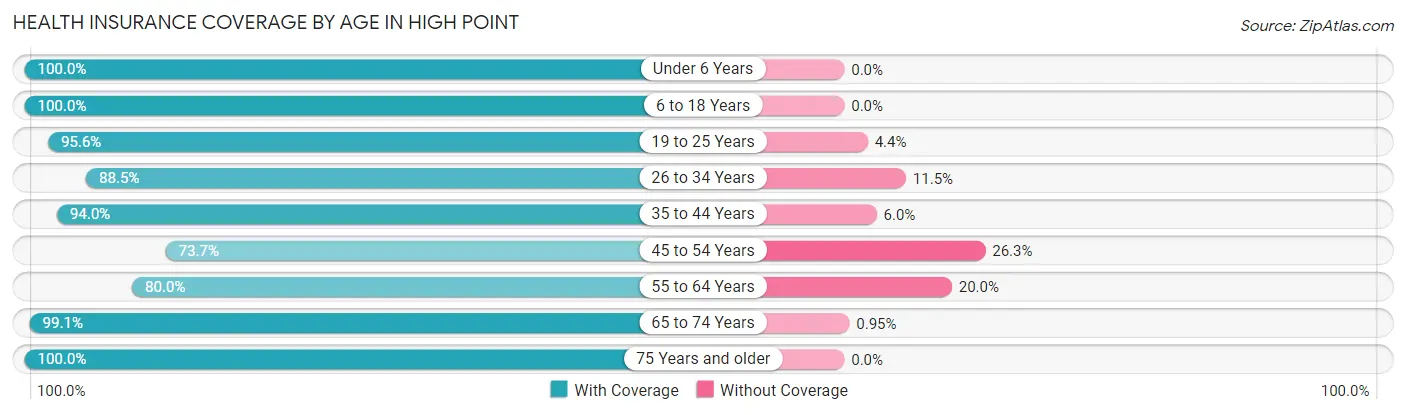
| Age Bracket | With Coverage | Without Coverage |
| Under 6 Years | 248 (100.0%) | 0 (0.0%) |
| 6 to 18 Years | 163 (100.0%) | 0 (0.0%) |
| 19 to 25 Years | 285 (95.6%) | 13 (4.4%) |
| 26 to 34 Years | 208 (88.5%) | 27 (11.5%) |
| 35 to 44 Years | 109 (94.0%) | 7 (6.0%) |
| 45 to 54 Years | 227 (73.7%) | 81 (26.3%) |
| 55 to 64 Years | 379 (80.0%) | 95 (20.0%) |
| 65 to 74 Years | 941 (99.1%) | 9 (0.9%) |
| 75 Years and older | 893 (100.0%) | 0 (0.0%) |
| Total | 3,453 (93.7%) | 232 (6.3%) |
Health Insurance Coverage by Citizenship Status in High Point
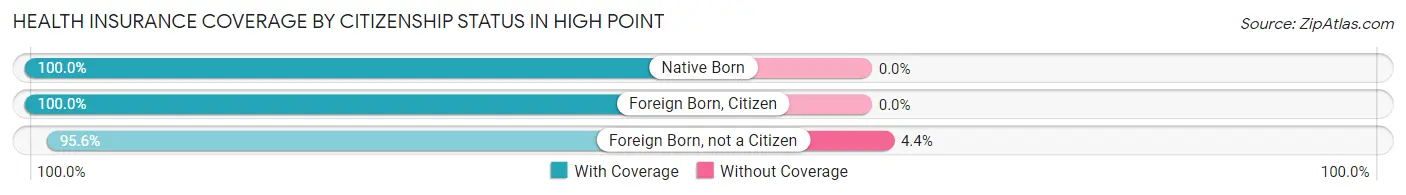
| Citizenship Status | With Coverage | Without Coverage |
| Native Born | 248 (100.0%) | 0 (0.0%) |
| Foreign Born, Citizen | 163 (100.0%) | 0 (0.0%) |
| Foreign Born, not a Citizen | 285 (95.6%) | 13 (4.4%) |
Health Insurance Coverage by Household Income in High Point
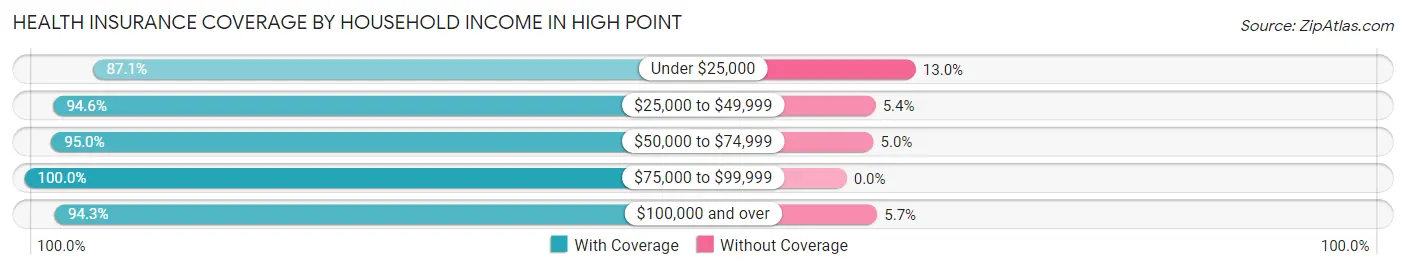
| Household Income | With Coverage | Without Coverage |
| Under $25,000 | 531 (87.1%) | 79 (13.0%) |
| $25,000 to $49,999 | 1,030 (94.6%) | 59 (5.4%) |
| $50,000 to $74,999 | 1,078 (95.0%) | 57 (5.0%) |
| $75,000 to $99,999 | 204 (100.0%) | 0 (0.0%) |
| $100,000 and over | 610 (94.3%) | 37 (5.7%) |
Public vs Private Health Insurance Coverage by Age in High Point
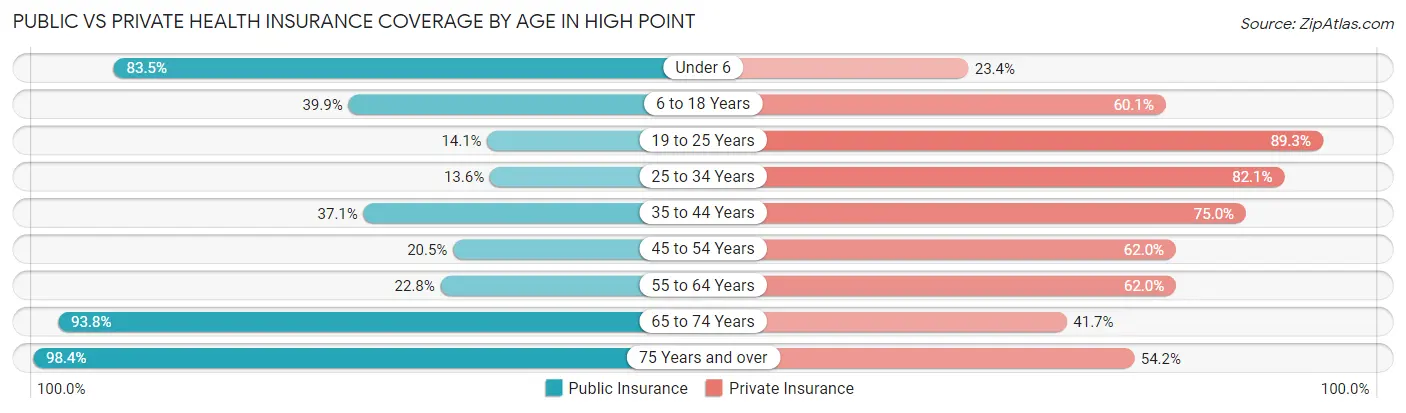
| Age Bracket | Public Insurance | Private Insurance |
| Under 6 | 207 (83.5%) | 58 (23.4%) |
| 6 to 18 Years | 65 (39.9%) | 98 (60.1%) |
| 19 to 25 Years | 42 (14.1%) | 266 (89.3%) |
| 25 to 34 Years | 32 (13.6%) | 193 (82.1%) |
| 35 to 44 Years | 43 (37.1%) | 87 (75.0%) |
| 45 to 54 Years | 63 (20.4%) | 191 (62.0%) |
| 55 to 64 Years | 108 (22.8%) | 294 (62.0%) |
| 65 to 74 Years | 891 (93.8%) | 396 (41.7%) |
| 75 Years and over | 879 (98.4%) | 484 (54.2%) |
| Total | 2,330 (63.2%) | 2,067 (56.1%) |
Disability Status by Sex by Age in High Point
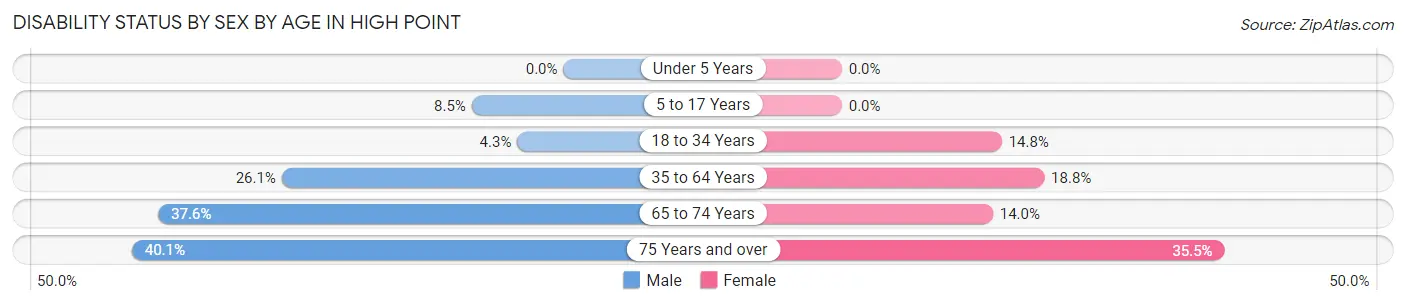
| Age Bracket | Male | Female |
| Under 5 Years | 0 (0.0%) | 0 (0.0%) |
| 5 to 17 Years | 8 (8.5%) | 0 (0.0%) |
| 18 to 34 Years | 18 (4.3%) | 19 (14.8%) |
| 35 to 64 Years | 115 (26.1%) | 86 (18.8%) |
| 65 to 74 Years | 164 (37.6%) | 72 (14.0%) |
| 75 Years and over | 149 (40.1%) | 185 (35.5%) |
Disability Class by Sex by Age in High Point
Disability Class: Hearing Difficulty
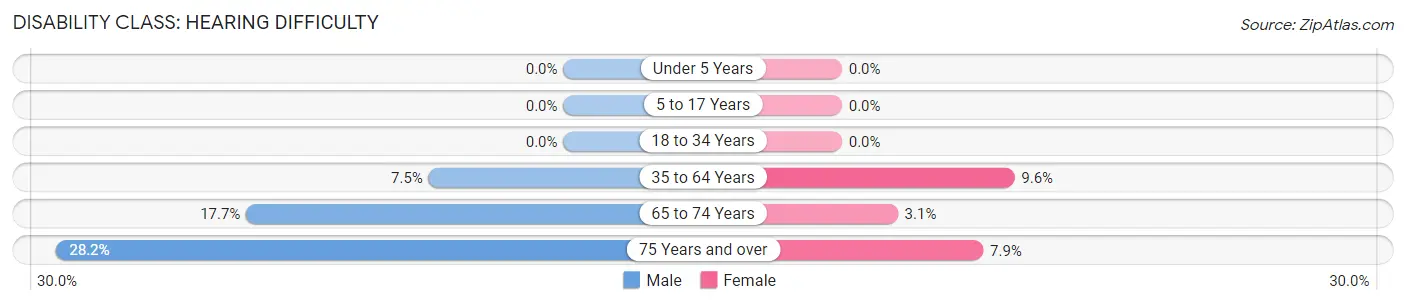
| Age Bracket | Male | Female |
| Under 5 Years | 0 (0.0%) | 0 (0.0%) |
| 5 to 17 Years | 0 (0.0%) | 0 (0.0%) |
| 18 to 34 Years | 0 (0.0%) | 0 (0.0%) |
| 35 to 64 Years | 33 (7.5%) | 44 (9.6%) |
| 65 to 74 Years | 77 (17.7%) | 16 (3.1%) |
| 75 Years and over | 105 (28.2%) | 41 (7.9%) |
Disability Class: Vision Difficulty
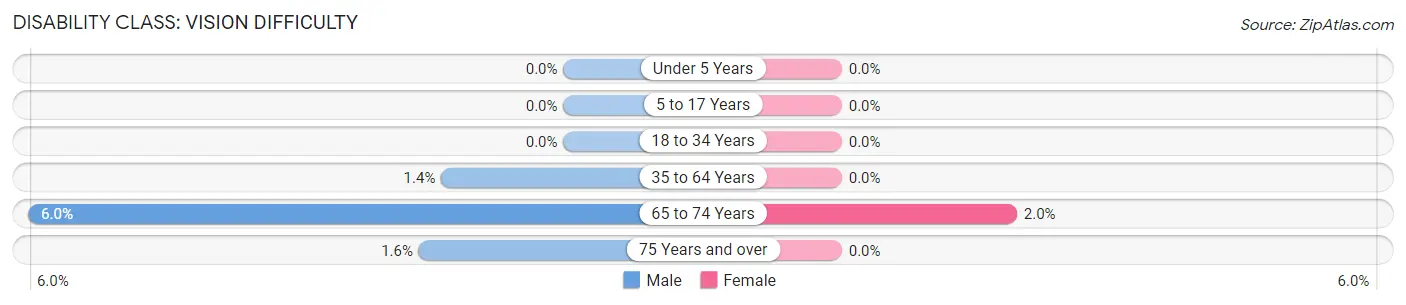
| Age Bracket | Male | Female |
| Under 5 Years | 0 (0.0%) | 0 (0.0%) |
| 5 to 17 Years | 0 (0.0%) | 0 (0.0%) |
| 18 to 34 Years | 0 (0.0%) | 0 (0.0%) |
| 35 to 64 Years | 6 (1.4%) | 0 (0.0%) |
| 65 to 74 Years | 26 (6.0%) | 10 (1.9%) |
| 75 Years and over | 6 (1.6%) | 0 (0.0%) |
Disability Class: Cognitive Difficulty
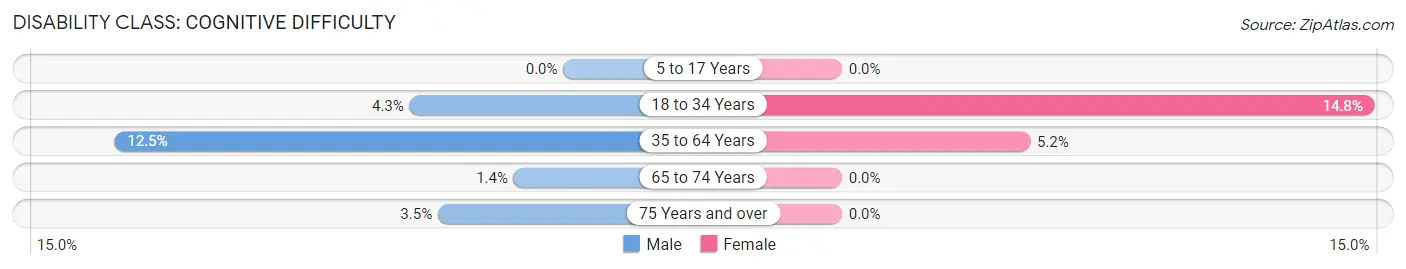
| Age Bracket | Male | Female |
| 5 to 17 Years | 0 (0.0%) | 0 (0.0%) |
| 18 to 34 Years | 18 (4.3%) | 19 (14.8%) |
| 35 to 64 Years | 55 (12.5%) | 24 (5.2%) |
| 65 to 74 Years | 6 (1.4%) | 0 (0.0%) |
| 75 Years and over | 13 (3.5%) | 0 (0.0%) |
Disability Class: Ambulatory Difficulty
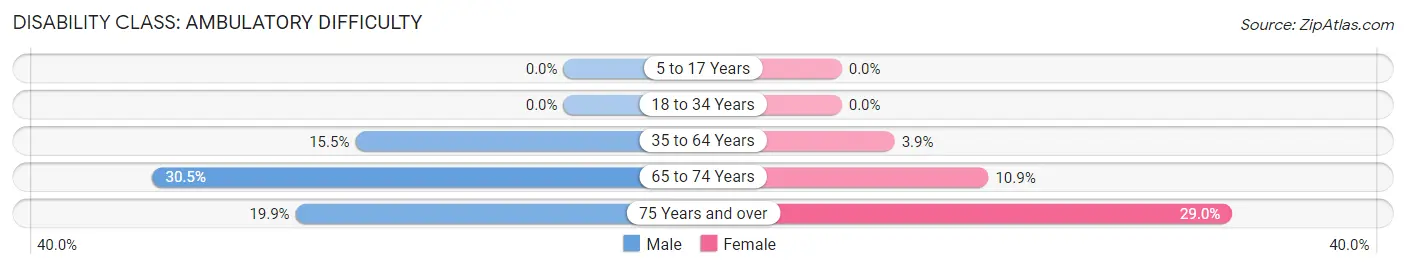
| Age Bracket | Male | Female |
| 5 to 17 Years | 0 (0.0%) | 0 (0.0%) |
| 18 to 34 Years | 0 (0.0%) | 0 (0.0%) |
| 35 to 64 Years | 68 (15.4%) | 18 (3.9%) |
| 65 to 74 Years | 133 (30.5%) | 56 (10.9%) |
| 75 Years and over | 74 (19.9%) | 151 (29.0%) |
Disability Class: Self-Care Difficulty
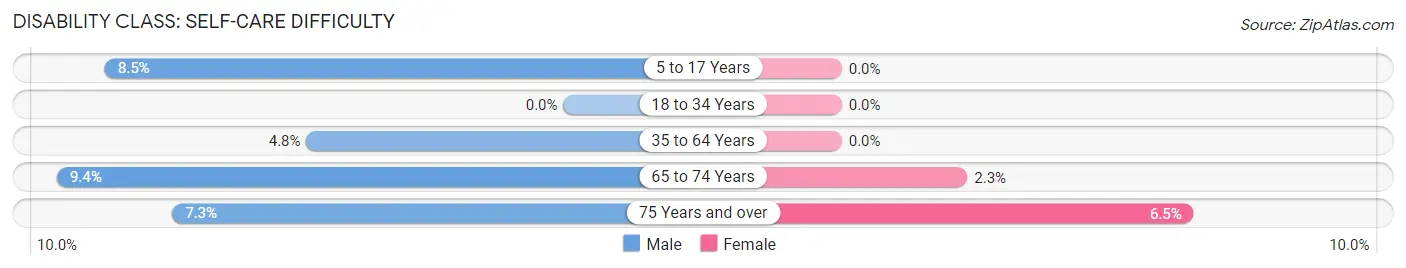
| Age Bracket | Male | Female |
| 5 to 17 Years | 8 (8.5%) | 0 (0.0%) |
| 18 to 34 Years | 0 (0.0%) | 0 (0.0%) |
| 35 to 64 Years | 21 (4.8%) | 0 (0.0%) |
| 65 to 74 Years | 41 (9.4%) | 12 (2.3%) |
| 75 Years and over | 27 (7.3%) | 34 (6.5%) |
Technology Access in High Point
Computing Device Access in High Point
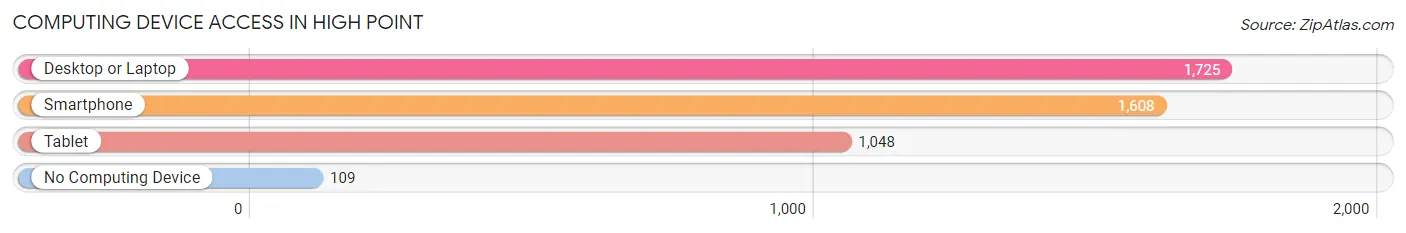
| Device Type | # Households | % Households |
| Desktop or Laptop | 1,725 | 84.0% |
| Smartphone | 1,608 | 78.3% |
| Tablet | 1,048 | 51.0% |
| No Computing Device | 109 | 5.3% |
| Total | 2,054 | 100.0% |
Internet Access in High Point
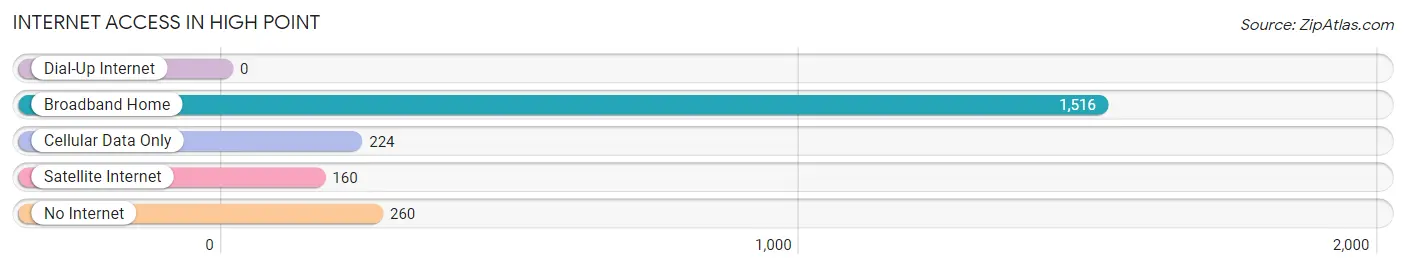
| Internet Type | # Households | % Households |
| Dial-Up Internet | 0 | 0.0% |
| Broadband Home | 1,516 | 73.8% |
| Cellular Data Only | 224 | 10.9% |
| Satellite Internet | 160 | 7.8% |
| No Internet | 260 | 12.7% |
| Total | 2,054 | 100.0% |
High Point Summary
High Point is a small unincorporated community located in the western part of Leon County, Florida. It is situated on the eastern edge of the Apalachicola National Forest, approximately 20 miles west of Tallahassee. The community is home to a population of approximately 1,000 people, and is a popular destination for outdoor recreation and relaxation.
History
High Point was first settled in the early 1800s by settlers from Georgia and Alabama. The community was originally known as “High Point” due to its location on a high point of land in the area. The first post office was established in 1845, and the community was officially incorporated in 1887.
High Point was a thriving agricultural community in the late 19th and early 20th centuries, with cotton, corn, and peanuts being the primary crops. The community also had a sawmill, a grist mill, and a general store.
In the early 20th century, the community began to decline as the railroad bypassed High Point and the population began to move away. The post office closed in the 1940s, and the town was officially unincorporated in the 1950s.
Geography
High Point is located in the western part of Leon County, Florida, approximately 20 miles west of Tallahassee. The community is situated on the eastern edge of the Apalachicola National Forest, and is surrounded by rolling hills and pine forests. The area is known for its natural beauty and abundance of wildlife.
The climate in High Point is mild and humid, with temperatures ranging from the mid-50s in the winter to the mid-80s in the summer. The area receives an average of 54 inches of rain per year, and is prone to occasional flooding.
Economy
High Point is a small, rural community with a limited economy. The primary industries in the area are agriculture and forestry. The community is home to several small farms, which produce a variety of crops including cotton, corn, and peanuts. The area is also home to several timber companies, which harvest pine and cypress trees from the surrounding forests.
In addition to agriculture and forestry, High Point is home to several small businesses, including a general store, a gas station, and a few restaurants. The community is also home to a small airport, which serves as a base for recreational pilots.
Demographics
As of the 2010 census, High Point had a population of 1,000 people. The racial makeup of the community was 94.7% White, 2.7% African American, 0.3% Native American, 0.3% Asian, and 1.7% from other races. The median household income was $37,500, and the median age was 44.
High Point is a small, rural community with a close-knit population. The community is home to several churches, and is known for its friendly atmosphere and strong sense of community. The area is also home to a variety of outdoor activities, including fishing, hunting, and camping.
Common Questions
What is Per Capita Income in High Point?
Per Capita income in High Point is $30,390.
What is the Median Family Income in High Point?
Median Family Income in High Point is $59,016.
What is the Median Household income in High Point?
Median Household Income in High Point is $46,083.
What is Income or Wage Gap in High Point?
Income or Wage Gap in High Point is 18.5%.
Women in High Point earn 81.5 cents for every dollar earned by a man.
What is Inequality or Gini Index in High Point?
Inequality or Gini Index in High Point is 0.41.
What is the Total Population of High Point?
Total Population of High Point is 3,685.
What is the Total Male Population of High Point?
Total Male Population of High Point is 1,953.
What is the Total Female Population of High Point?
Total Female Population of High Point is 1,732.
What is the Ratio of Males per 100 Females in High Point?
There are 112.76 Males per 100 Females in High Point.
What is the Ratio of Females per 100 Males in High Point?
There are 88.68 Females per 100 Males in High Point.
What is the Median Population Age in High Point?
Median Population Age in High Point is 65.0 Years.
What is the Average Family Size in High Point
Average Family Size in High Point is 2.4 People.
What is the Average Household Size in High Point
Average Household Size in High Point is 1.8 People.
How Large is the Labor Force in High Point?
There are 1,206 People in the Labor Forcein in High Point.
What is the Percentage of People in the Labor Force in High Point?
36.5% of People are in the Labor Force in High Point.
What is the Unemployment Rate in High Point?
Unemployment Rate in High Point is 11.5%.