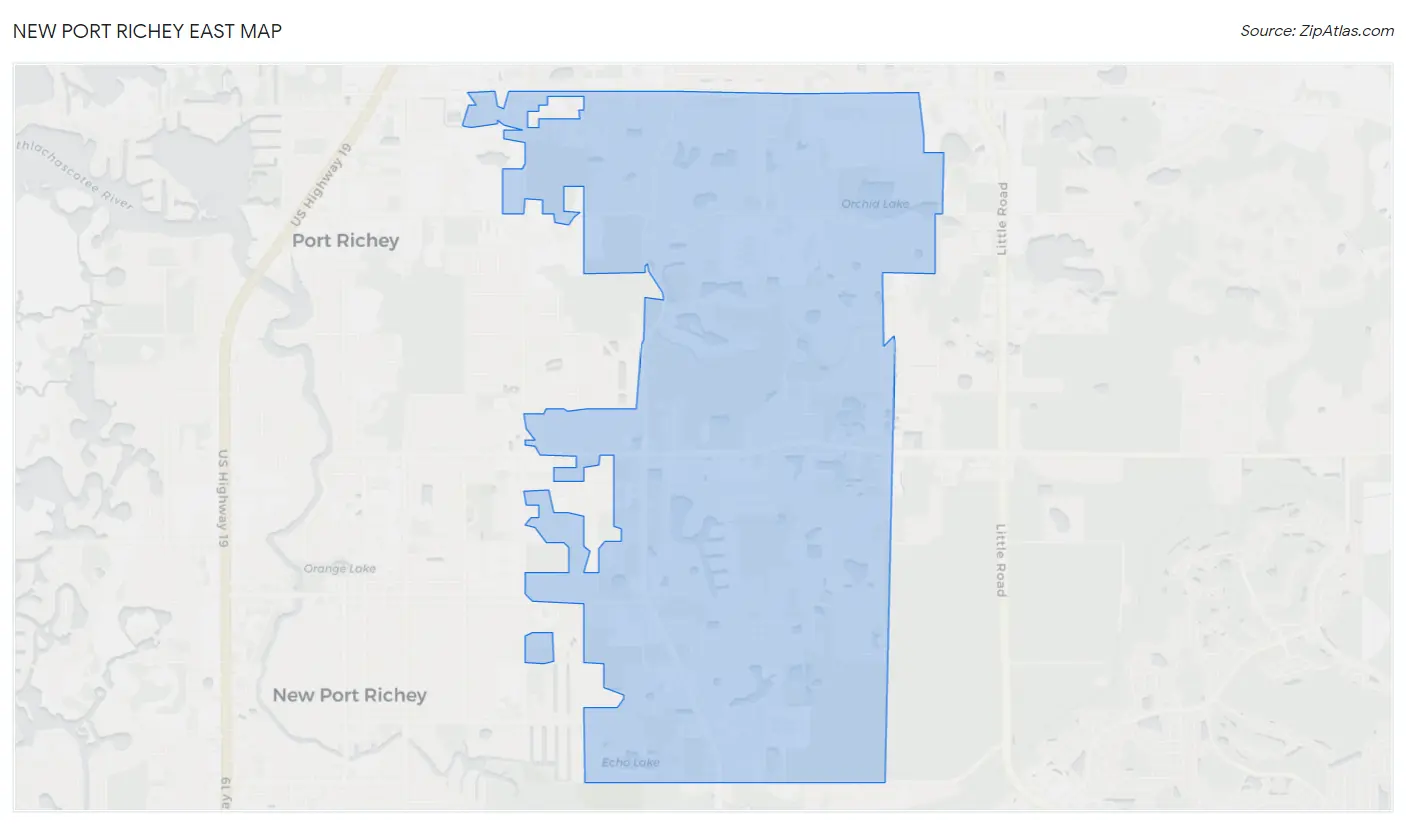
New Port Richey East, FL Map & Demographics
New Port Richey East Map
New Port Richey East Overview
$28,501
PER CAPITA INCOME
$62,083
AVG FAMILY INCOME
$44,294
AVG HOUSEHOLD INCOME
36.7%
WAGE / INCOME GAP [ % ]
63.3¢/ $1
WAGE / INCOME GAP [ $ ]
0.41
INEQUALITY / GINI INDEX
11,170
TOTAL POPULATION
5,652
MALE POPULATION
5,518
FEMALE POPULATION
102.43
MALES / 100 FEMALES
97.63
FEMALES / 100 MALES
52.5
MEDIAN AGE
2.9
AVG FAMILY SIZE
2.1
AVG HOUSEHOLD SIZE
4,797
LABOR FORCE [ PEOPLE ]
49.2%
PERCENT IN LABOR FORCE
13.0%
UNEMPLOYMENT RATE
Income in New Port Richey East
Income Overview in New Port Richey East
Per Capita Income in New Port Richey East is $28,501, while median incomes of families and households are $62,083 and $44,294 respectively.
| Characteristic | Number | Measure |
| Per Capita Income | 11,170 | $28,501 |
| Median Family Income | 2,478 | $62,083 |
| Mean Family Income | 2,478 | $65,475 |
| Median Household Income | 5,344 | $44,294 |
| Mean Household Income | 5,344 | $56,836 |
| Income Deficit | 2,478 | $0 |
| Wage / Income Gap (%) | 11,170 | 36.73% |
| Wage / Income Gap ($) | 11,170 | 63.27¢ per $1 |
| Gini / Inequality Index | 11,170 | 0.41 |
Earnings by Sex in New Port Richey East
Average Earnings in New Port Richey East are $31,721, $39,132 for men and $24,760 for women, a difference of 36.7%.
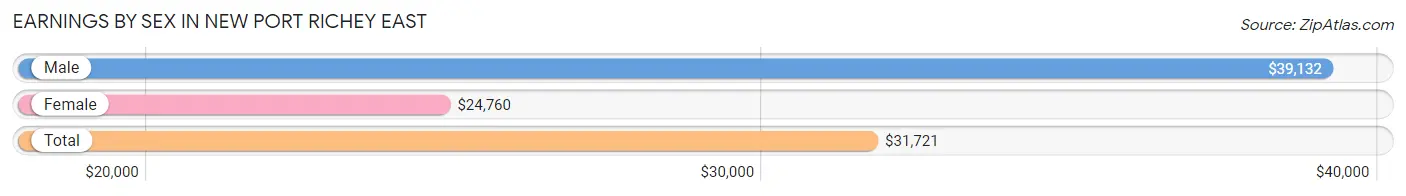
| Sex | Number | Average Earnings |
| Male | 2,648 (56.1%) | $39,132 |
| Female | 2,075 (43.9%) | $24,760 |
| Total | 4,723 (100.0%) | $31,721 |
Earnings by Sex by Income Bracket in New Port Richey East
The most common earnings brackets in New Port Richey East are $7,500 to $9,999 for men (305 | 11.5%) and $17,500 to $19,999 for women (387 | 18.6%).
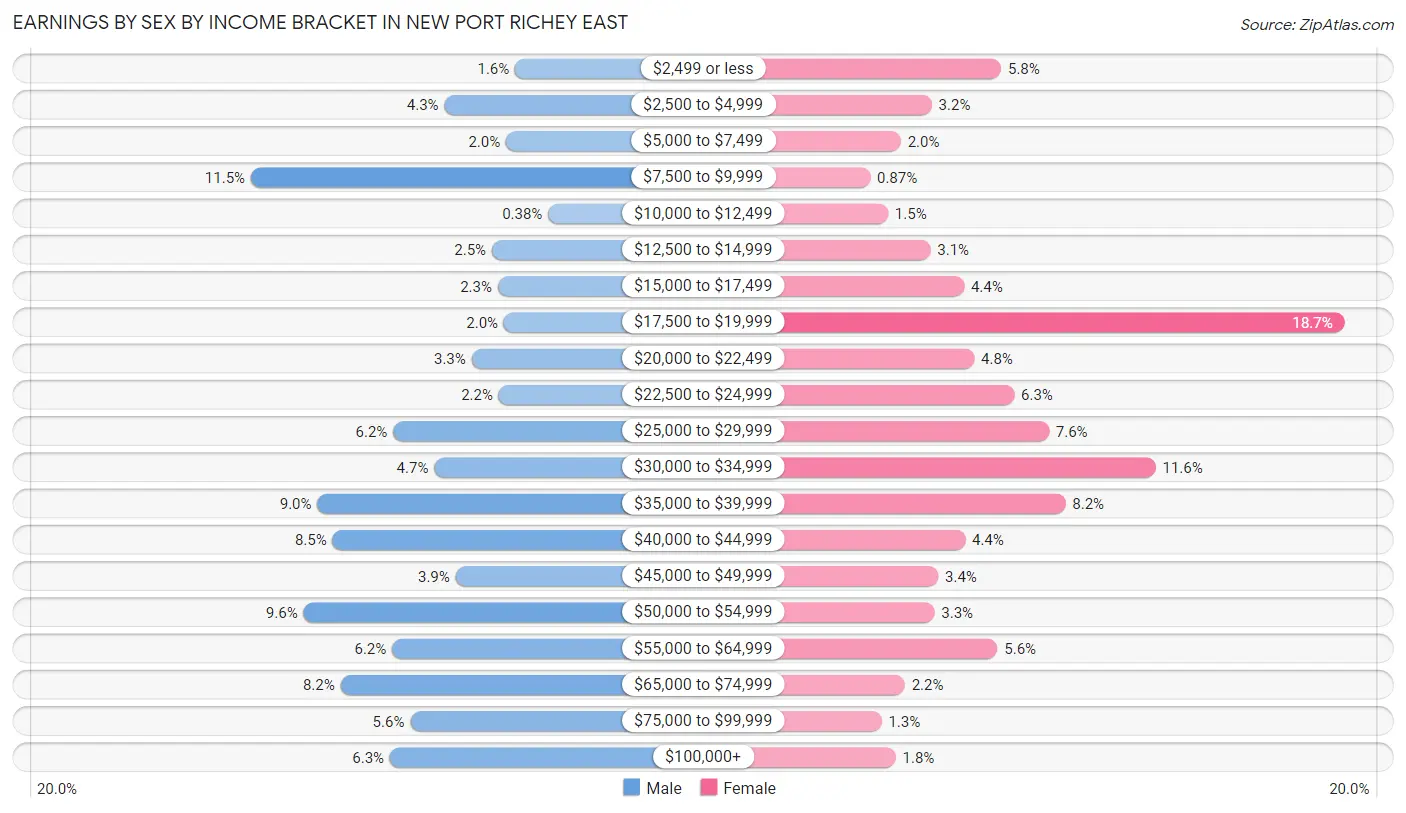
| Income | Male | Female |
| $2,499 or less | 43 (1.6%) | 120 (5.8%) |
| $2,500 to $4,999 | 113 (4.3%) | 66 (3.2%) |
| $5,000 to $7,499 | 52 (2.0%) | 42 (2.0%) |
| $7,500 to $9,999 | 305 (11.5%) | 18 (0.9%) |
| $10,000 to $12,499 | 10 (0.4%) | 32 (1.5%) |
| $12,500 to $14,999 | 66 (2.5%) | 65 (3.1%) |
| $15,000 to $17,499 | 60 (2.3%) | 91 (4.4%) |
| $17,500 to $19,999 | 54 (2.0%) | 387 (18.6%) |
| $20,000 to $22,499 | 86 (3.3%) | 99 (4.8%) |
| $22,500 to $24,999 | 59 (2.2%) | 130 (6.3%) |
| $25,000 to $29,999 | 164 (6.2%) | 157 (7.6%) |
| $30,000 to $34,999 | 123 (4.6%) | 240 (11.6%) |
| $35,000 to $39,999 | 239 (9.0%) | 170 (8.2%) |
| $40,000 to $44,999 | 224 (8.5%) | 92 (4.4%) |
| $45,000 to $49,999 | 102 (3.8%) | 71 (3.4%) |
| $50,000 to $54,999 | 253 (9.6%) | 68 (3.3%) |
| $55,000 to $64,999 | 165 (6.2%) | 117 (5.6%) |
| $65,000 to $74,999 | 216 (8.2%) | 45 (2.2%) |
| $75,000 to $99,999 | 147 (5.6%) | 27 (1.3%) |
| $100,000+ | 167 (6.3%) | 38 (1.8%) |
| Total | 2,648 (100.0%) | 2,075 (100.0%) |
Earnings by Sex by Educational Attainment in New Port Richey East
Average earnings in New Port Richey East are $41,184 for men and $28,125 for women, a difference of 31.7%. Men with an educational attainment of bachelor's degree enjoy the highest average annual earnings of $70,592, while those with less than high school education earn the least with $37,500. Women with an educational attainment of bachelor's degree earn the most with the average annual earnings of $36,955, while those with less than high school education have the smallest earnings of $19,288.
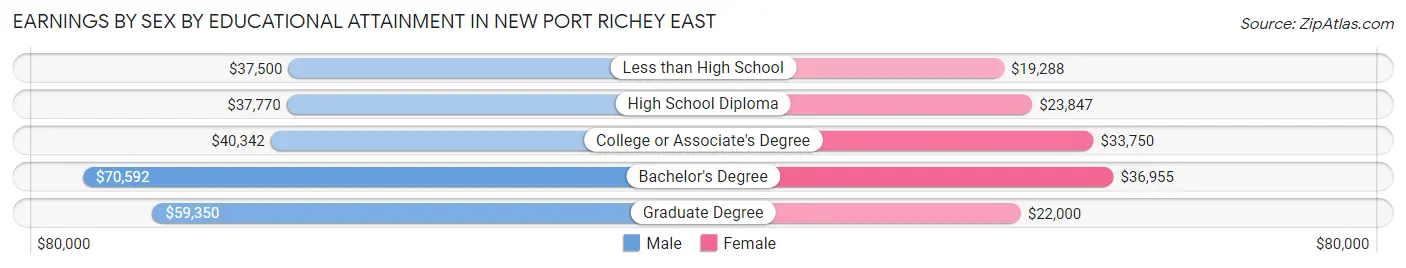
| Educational Attainment | Male Income | Female Income |
| Less than High School | $37,500 | $19,288 |
| High School Diploma | $37,770 | $23,847 |
| College or Associate's Degree | $40,342 | $33,750 |
| Bachelor's Degree | $70,592 | $36,955 |
| Graduate Degree | $59,350 | $22,000 |
| Total | $41,184 | $28,125 |
Family Income in New Port Richey East
Family Income Brackets in New Port Richey East
According to the New Port Richey East family income data, there are 615 families falling into the $75,000 to $99,999 income range, which is the most common income bracket and makes up 24.8% of all families. Conversely, the $200,000+ income bracket is the least frequent group with only 10 families (0.4%) belonging to this category.
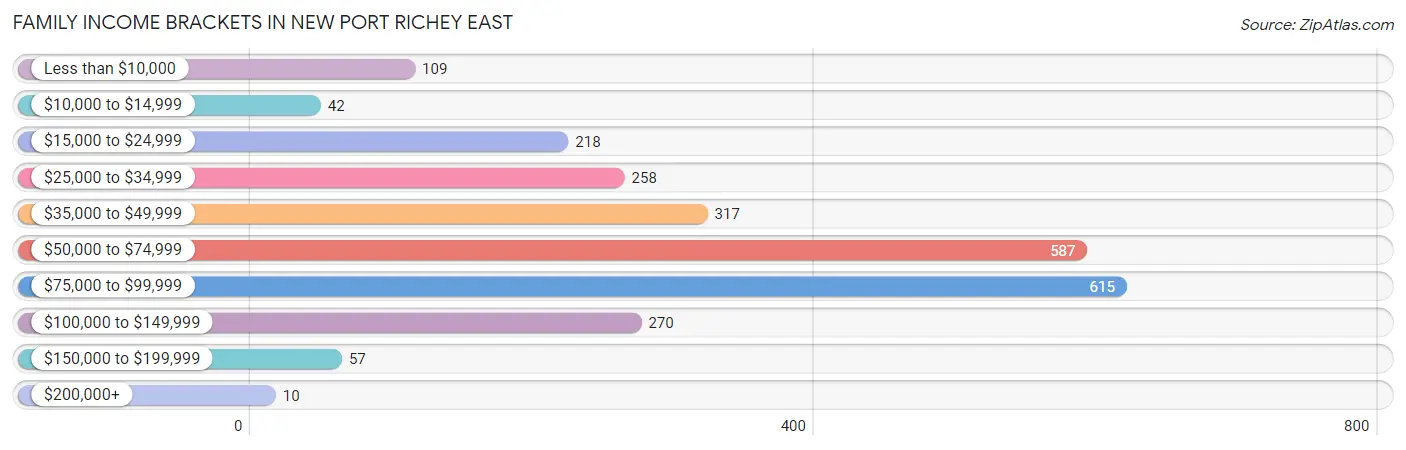
| Income Bracket | # Families | % Families |
| Less than $10,000 | 109 | 4.4% |
| $10,000 to $14,999 | 42 | 1.7% |
| $15,000 to $24,999 | 218 | 8.8% |
| $25,000 to $34,999 | 258 | 10.4% |
| $35,000 to $49,999 | 317 | 12.8% |
| $50,000 to $74,999 | 587 | 23.7% |
| $75,000 to $99,999 | 615 | 24.8% |
| $100,000 to $149,999 | 270 | 10.9% |
| $150,000 to $199,999 | 57 | 2.3% |
| $200,000+ | 10 | 0.4% |
Family Income by Famaliy Size in New Port Richey East
5-person families (119 | 4.8%) account for the highest median family income in New Port Richey East with $99,563 per family, while 2-person families (1,459 | 58.9%) have the highest median income of $27,942 per family member.
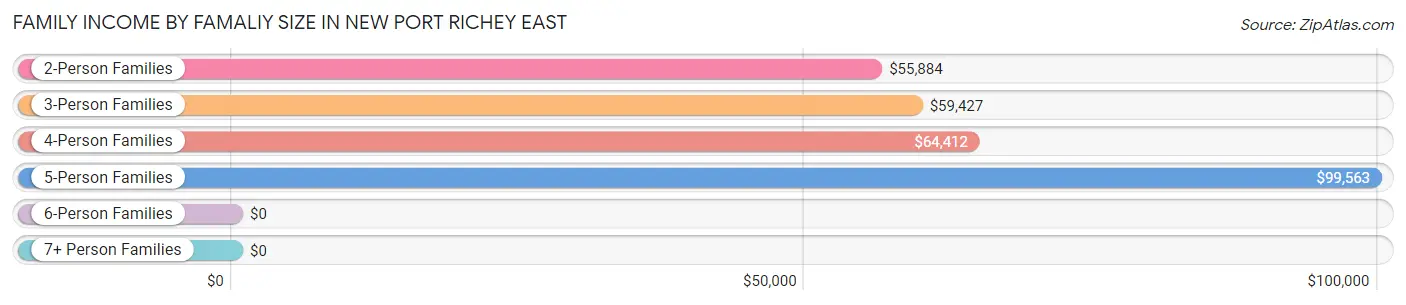
| Income Bracket | # Families | Median Income |
| 2-Person Families | 1,459 (58.9%) | $55,884 |
| 3-Person Families | 559 (22.6%) | $59,427 |
| 4-Person Families | 334 (13.5%) | $64,412 |
| 5-Person Families | 119 (4.8%) | $99,563 |
| 6-Person Families | 7 (0.3%) | $0 |
| 7+ Person Families | 0 (0.0%) | $0 |
| Total | 2,478 (100.0%) | $62,083 |
Family Income by Number of Earners in New Port Richey East
The median family income in New Port Richey East is $62,083, with families comprising 3+ earners (102) having the highest median family income of $88,696, while families with no earners (826) have the lowest median family income of $40,000, accounting for 4.1% and 33.3% of families, respectively.
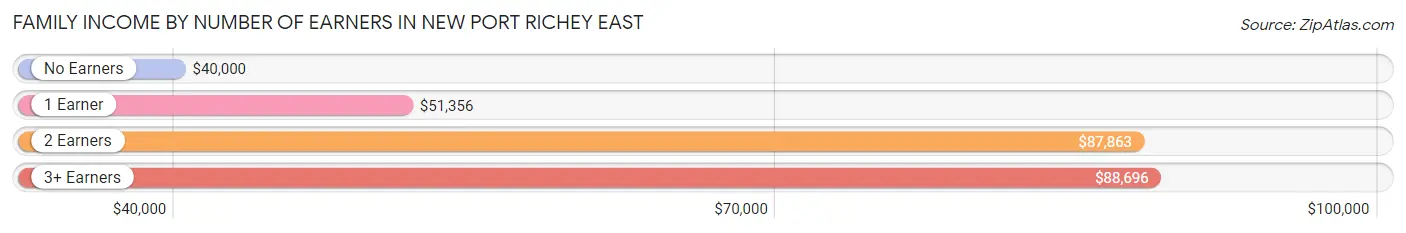
| Number of Earners | # Families | Median Income |
| No Earners | 826 (33.3%) | $40,000 |
| 1 Earner | 723 (29.2%) | $51,356 |
| 2 Earners | 827 (33.4%) | $87,863 |
| 3+ Earners | 102 (4.1%) | $88,696 |
| Total | 2,478 (100.0%) | $62,083 |
Household Income in New Port Richey East
Household Income Brackets in New Port Richey East
With 930 households falling in the category, the $50,000 to $74,999 income range is the most frequent in New Port Richey East, accounting for 17.4% of all households. In contrast, only 64 households (1.2%) fall into the $200,000+ income bracket, making it the least populous group.
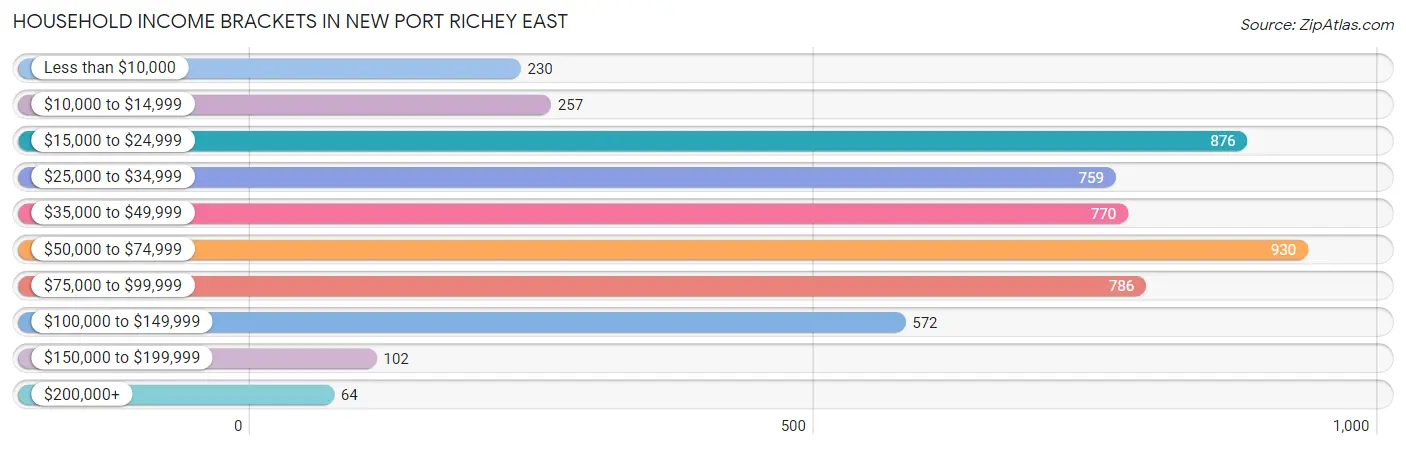
| Income Bracket | # Households | % Households |
| Less than $10,000 | 230 | 4.3% |
| $10,000 to $14,999 | 257 | 4.8% |
| $15,000 to $24,999 | 876 | 16.4% |
| $25,000 to $34,999 | 759 | 14.2% |
| $35,000 to $49,999 | 770 | 14.4% |
| $50,000 to $74,999 | 930 | 17.4% |
| $75,000 to $99,999 | 786 | 14.7% |
| $100,000 to $149,999 | 572 | 10.7% |
| $150,000 to $199,999 | 102 | 1.9% |
| $200,000+ | 64 | 1.2% |
Household Income by Householder Age in New Port Richey East
The median household income in New Port Richey East is $44,294, with the highest median household income of $51,767 found in the 25 to 44 years age bracket for the primary householder. A total of 993 households (18.6%) fall into this category. Meanwhile, the 65+ years age bracket for the primary householder has the lowest median household income of $38,603, with 2,274 households (42.5%) in this group.
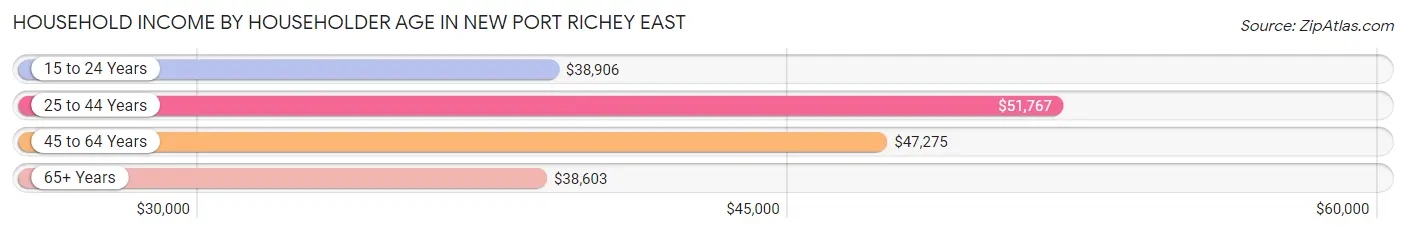
| Income Bracket | # Households | Median Income |
| 15 to 24 Years | 158 (3.0%) | $38,906 |
| 25 to 44 Years | 993 (18.6%) | $51,767 |
| 45 to 64 Years | 1,919 (35.9%) | $47,275 |
| 65+ Years | 2,274 (42.5%) | $38,603 |
| Total | 5,344 (100.0%) | $44,294 |
Poverty in New Port Richey East
Income Below Poverty by Sex and Age in New Port Richey East
With 16.2% poverty level for males and 16.8% for females among the residents of New Port Richey East, 12 to 14 year old males and 15 year old females are the most vulnerable to poverty, with 38 males (100.0%) and 17 females (60.7%) in their respective age groups living below the poverty level.
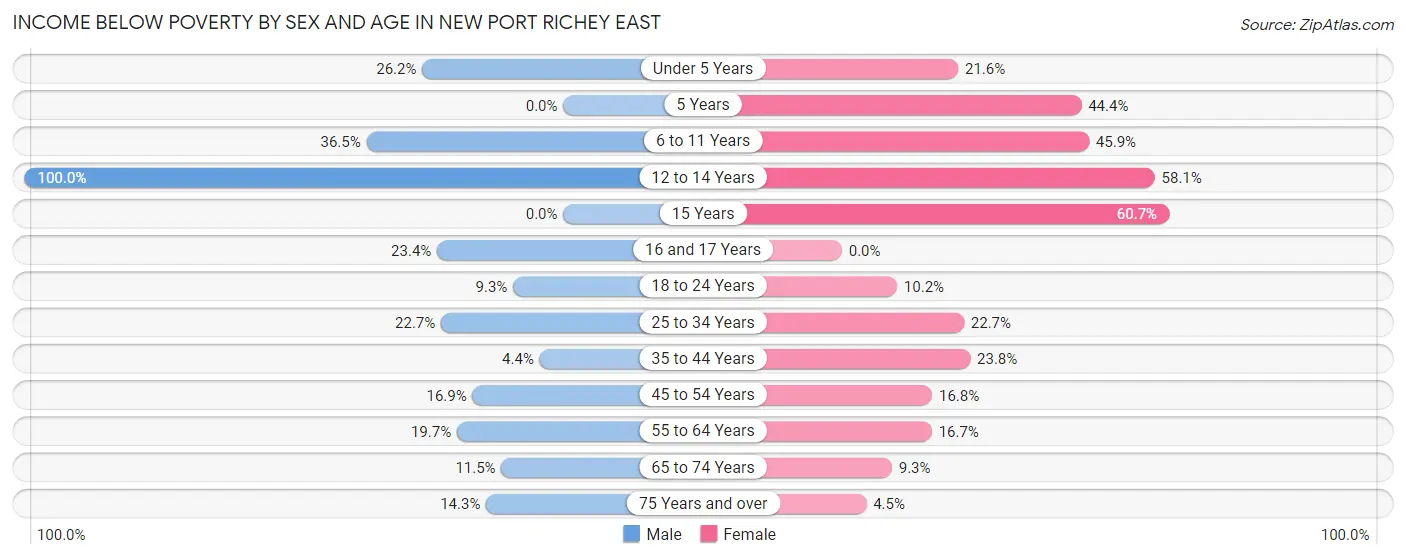
| Age Bracket | Male | Female |
| Under 5 Years | 83 (26.2%) | 63 (21.6%) |
| 5 Years | 0 (0.0%) | 12 (44.4%) |
| 6 to 11 Years | 61 (36.5%) | 139 (45.9%) |
| 12 to 14 Years | 38 (100.0%) | 36 (58.1%) |
| 15 Years | 0 (0.0%) | 17 (60.7%) |
| 16 and 17 Years | 26 (23.4%) | 0 (0.0%) |
| 18 to 24 Years | 35 (9.3%) | 36 (10.2%) |
| 25 to 34 Years | 145 (22.7%) | 145 (22.7%) |
| 35 to 44 Years | 32 (4.4%) | 91 (23.8%) |
| 45 to 54 Years | 118 (16.9%) | 97 (16.8%) |
| 55 to 64 Years | 180 (19.7%) | 140 (16.7%) |
| 65 to 74 Years | 95 (11.5%) | 99 (9.3%) |
| 75 Years and over | 96 (14.3%) | 38 (4.5%) |
| Total | 909 (16.2%) | 913 (16.8%) |
Income Above Poverty by Sex and Age in New Port Richey East
According to the poverty statistics in New Port Richey East, males aged 5 years and females aged 16 and 17 years are the age groups that are most secure financially, with 100.0% of males and 100.0% of females in these age groups living above the poverty line.
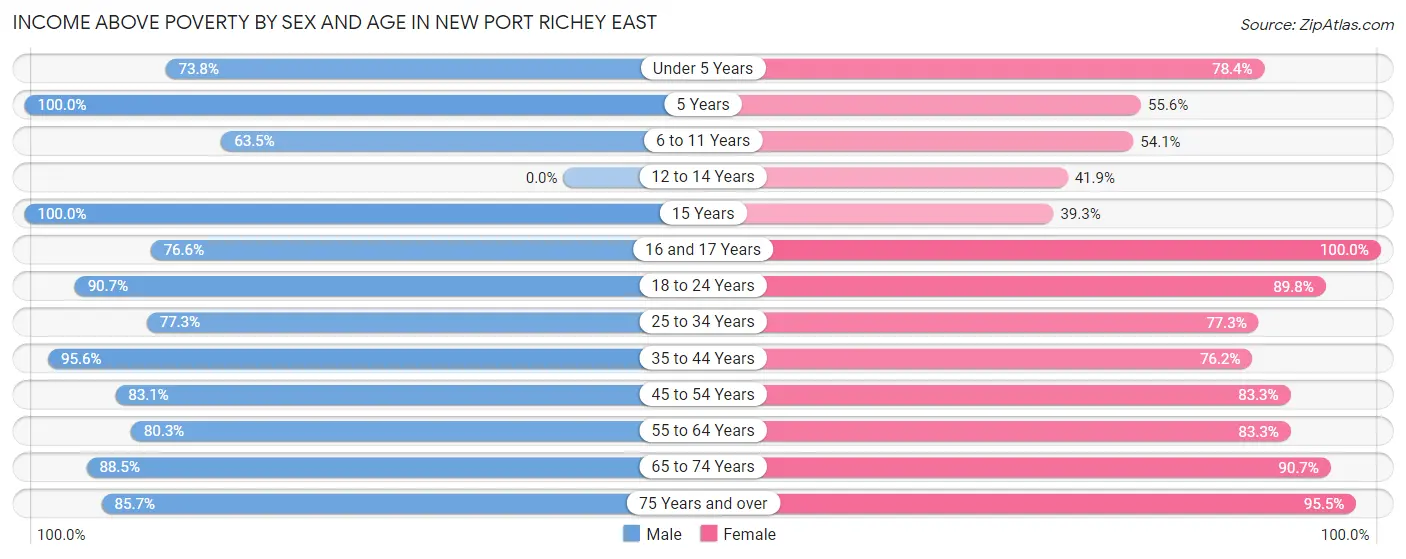
| Age Bracket | Male | Female |
| Under 5 Years | 234 (73.8%) | 229 (78.4%) |
| 5 Years | 106 (100.0%) | 15 (55.6%) |
| 6 to 11 Years | 106 (63.5%) | 164 (54.1%) |
| 12 to 14 Years | 0 (0.0%) | 26 (41.9%) |
| 15 Years | 33 (100.0%) | 11 (39.3%) |
| 16 and 17 Years | 85 (76.6%) | 28 (100.0%) |
| 18 to 24 Years | 341 (90.7%) | 316 (89.8%) |
| 25 to 34 Years | 494 (77.3%) | 495 (77.3%) |
| 35 to 44 Years | 698 (95.6%) | 291 (76.2%) |
| 45 to 54 Years | 582 (83.1%) | 482 (83.3%) |
| 55 to 64 Years | 732 (80.3%) | 699 (83.3%) |
| 65 to 74 Years | 732 (88.5%) | 968 (90.7%) |
| 75 Years and over | 575 (85.7%) | 801 (95.5%) |
| Total | 4,718 (83.9%) | 4,525 (83.2%) |
Income Below Poverty Among Married-Couple Families in New Port Richey East
The poverty statistics for married-couple families in New Port Richey East show that 6.9% or 121 of the total 1,753 families live below the poverty line. Families with 1 or 2 children have the highest poverty rate of 8.3%, comprising of 26 families. On the other hand, families with 3 or 4 children have the lowest poverty rate of 0.0%, which includes 0 families.
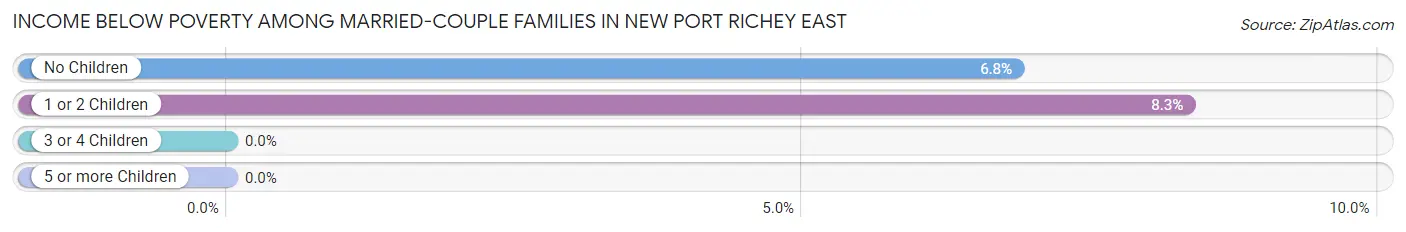
| Children | Above Poverty | Below Poverty |
| No Children | 1,293 (93.2%) | 95 (6.8%) |
| 1 or 2 Children | 286 (91.7%) | 26 (8.3%) |
| 3 or 4 Children | 53 (100.0%) | 0 (0.0%) |
| 5 or more Children | 0 (0.0%) | 0 (0.0%) |
| Total | 1,632 (93.1%) | 121 (6.9%) |
Income Below Poverty Among Single-Parent Households in New Port Richey East
According to the poverty data in New Port Richey East, 11.9% or 21 single-father households and 31.0% or 170 single-mother households are living below the poverty line. Among single-father households, those with 1 or 2 children have the highest poverty rate, with 21 households (16.4%) experiencing poverty. Likewise, among single-mother households, those with 3 or 4 children have the highest poverty rate, with 54 households (55.7%) falling below the poverty line.
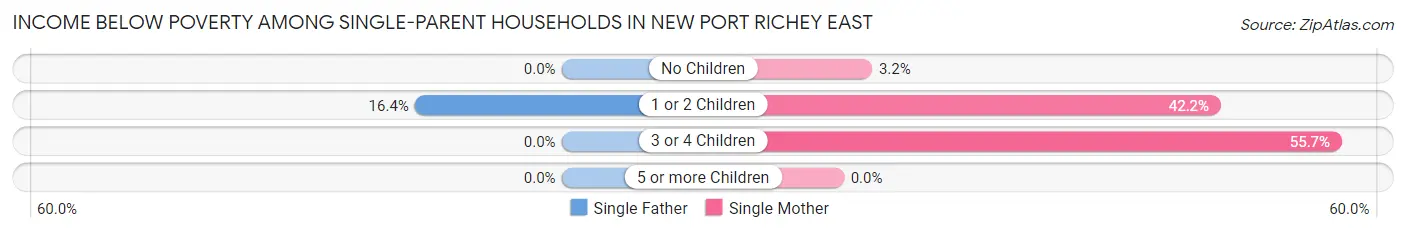
| Children | Single Father | Single Mother |
| No Children | 0 (0.0%) | 6 (3.2%) |
| 1 or 2 Children | 21 (16.4%) | 110 (42.1%) |
| 3 or 4 Children | 0 (0.0%) | 54 (55.7%) |
| 5 or more Children | 0 (0.0%) | 0 (0.0%) |
| Total | 21 (11.9%) | 170 (31.0%) |
Income Below Poverty Among Married-Couple vs Single-Parent Households in New Port Richey East
The poverty data for New Port Richey East shows that 121 of the married-couple family households (6.9%) and 191 of the single-parent households (26.3%) are living below the poverty level. Within the married-couple family households, those with 1 or 2 children have the highest poverty rate, with 26 households (8.3%) falling below the poverty line. Among the single-parent households, those with 3 or 4 children have the highest poverty rate, with 54 household (55.7%) living below poverty.
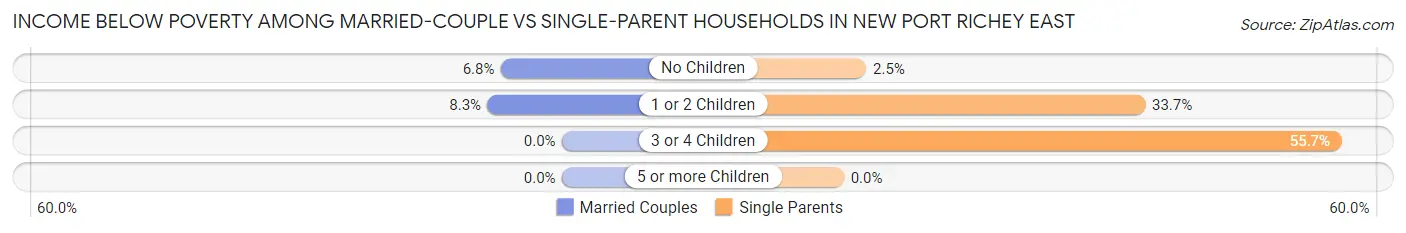
| Children | Married-Couple Families | Single-Parent Households |
| No Children | 95 (6.8%) | 6 (2.5%) |
| 1 or 2 Children | 26 (8.3%) | 131 (33.7%) |
| 3 or 4 Children | 0 (0.0%) | 54 (55.7%) |
| 5 or more Children | 0 (0.0%) | 0 (0.0%) |
| Total | 121 (6.9%) | 191 (26.3%) |
Race in New Port Richey East
The most populous races in New Port Richey East are White / Caucasian (9,978 | 89.3%), Hispanic or Latino (1,006 | 9.0%), and Two or more Races (515 | 4.6%).
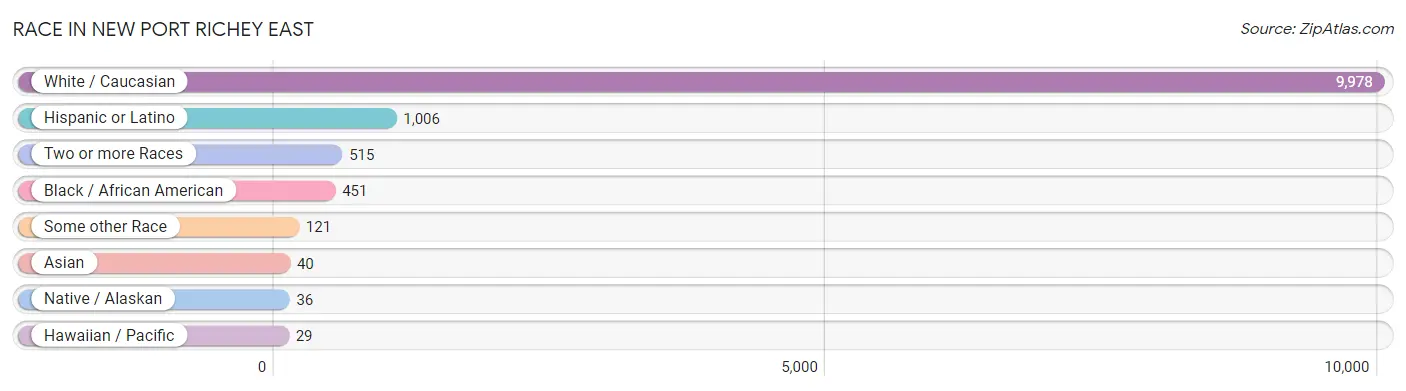
| Race | # Population | % Population |
| Asian | 40 | 0.4% |
| Black / African American | 451 | 4.0% |
| Hawaiian / Pacific | 29 | 0.3% |
| Hispanic or Latino | 1,006 | 9.0% |
| Native / Alaskan | 36 | 0.3% |
| White / Caucasian | 9,978 | 89.3% |
| Two or more Races | 515 | 4.6% |
| Some other Race | 121 | 1.1% |
| Total | 11,170 | 100.0% |
Ancestry in New Port Richey East
The most populous ancestries reported in New Port Richey East are American (2,057 | 18.4%), German (1,868 | 16.7%), Irish (1,450 | 13.0%), Italian (1,077 | 9.6%), and English (700 | 6.3%), together accounting for 64.0% of all New Port Richey East residents.
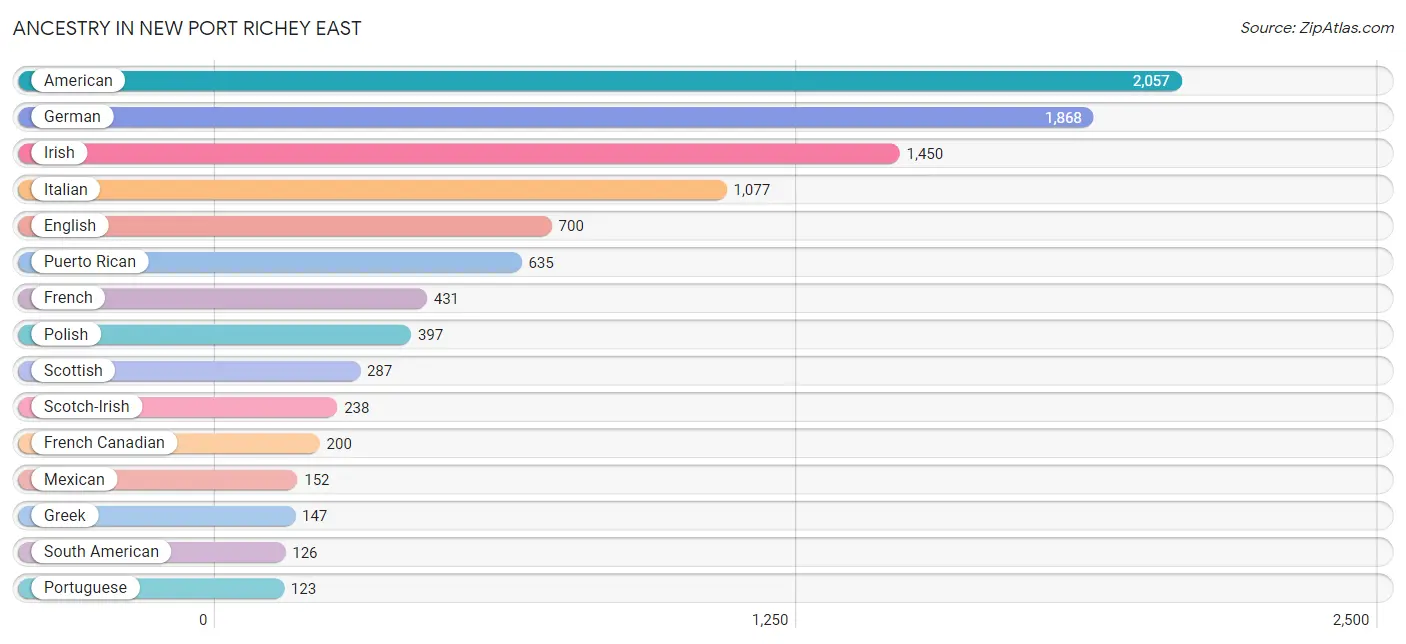
| Ancestry | # Population | % Population |
| Afghan | 14 | 0.1% |
| African | 44 | 0.4% |
| Alaska Native | 6 | 0.1% |
| Albanian | 10 | 0.1% |
| American | 2,057 | 18.4% |
| Arab | 1 | 0.0% |
| Austrian | 8 | 0.1% |
| Bangladeshi | 9 | 0.1% |
| Bhutanese | 23 | 0.2% |
| Blackfeet | 6 | 0.1% |
| Brazilian | 32 | 0.3% |
| British | 9 | 0.1% |
| Bulgarian | 50 | 0.4% |
| Burmese | 38 | 0.3% |
| Canadian | 101 | 0.9% |
| Central American | 7 | 0.1% |
| Central American Indian | 15 | 0.1% |
| Cherokee | 33 | 0.3% |
| Colombian | 59 | 0.5% |
| Cuban | 46 | 0.4% |
| Cypriot | 5 | 0.0% |
| Czech | 9 | 0.1% |
| Danish | 9 | 0.1% |
| Delaware | 4 | 0.0% |
| Dominican | 10 | 0.1% |
| Dutch | 101 | 0.9% |
| English | 700 | 6.3% |
| European | 24 | 0.2% |
| Finnish | 6 | 0.1% |
| French | 431 | 3.9% |
| French American Indian | 6 | 0.1% |
| French Canadian | 200 | 1.8% |
| German | 1,868 | 16.7% |
| Greek | 147 | 1.3% |
| Guatemalan | 6 | 0.1% |
| Haitian | 3 | 0.0% |
| Hungarian | 86 | 0.8% |
| Iranian | 25 | 0.2% |
| Irish | 1,450 | 13.0% |
| Israeli | 11 | 0.1% |
| Italian | 1,077 | 9.6% |
| Korean | 31 | 0.3% |
| Lithuanian | 13 | 0.1% |
| Mexican | 152 | 1.4% |
| Northern European | 8 | 0.1% |
| Norwegian | 118 | 1.1% |
| Panamanian | 1 | 0.0% |
| Pennsylvania German | 6 | 0.1% |
| Peruvian | 25 | 0.2% |
| Polish | 397 | 3.5% |
| Portuguese | 123 | 1.1% |
| Puerto Rican | 635 | 5.7% |
| Romanian | 39 | 0.4% |
| Russian | 44 | 0.4% |
| Scotch-Irish | 238 | 2.1% |
| Scottish | 287 | 2.6% |
| Slavic | 13 | 0.1% |
| Slovak | 16 | 0.1% |
| South American | 126 | 1.1% |
| South American Indian | 54 | 0.5% |
| Spanish | 7 | 0.1% |
| Subsaharan African | 44 | 0.4% |
| Swedish | 111 | 1.0% |
| Swiss | 9 | 0.1% |
| Ukrainian | 8 | 0.1% |
| Venezuelan | 42 | 0.4% |
| Welsh | 35 | 0.3% |
| West Indian | 20 | 0.2% |
| Yaqui | 9 | 0.1% | View All 69 Rows |
Immigrants in New Port Richey East
The most numerous immigrant groups reported in New Port Richey East came from Europe (384 | 3.4%), Latin America (184 | 1.7%), Eastern Europe (156 | 1.4%), South America (132 | 1.2%), and Germany (82 | 0.7%), together accounting for 8.4% of all New Port Richey East residents.
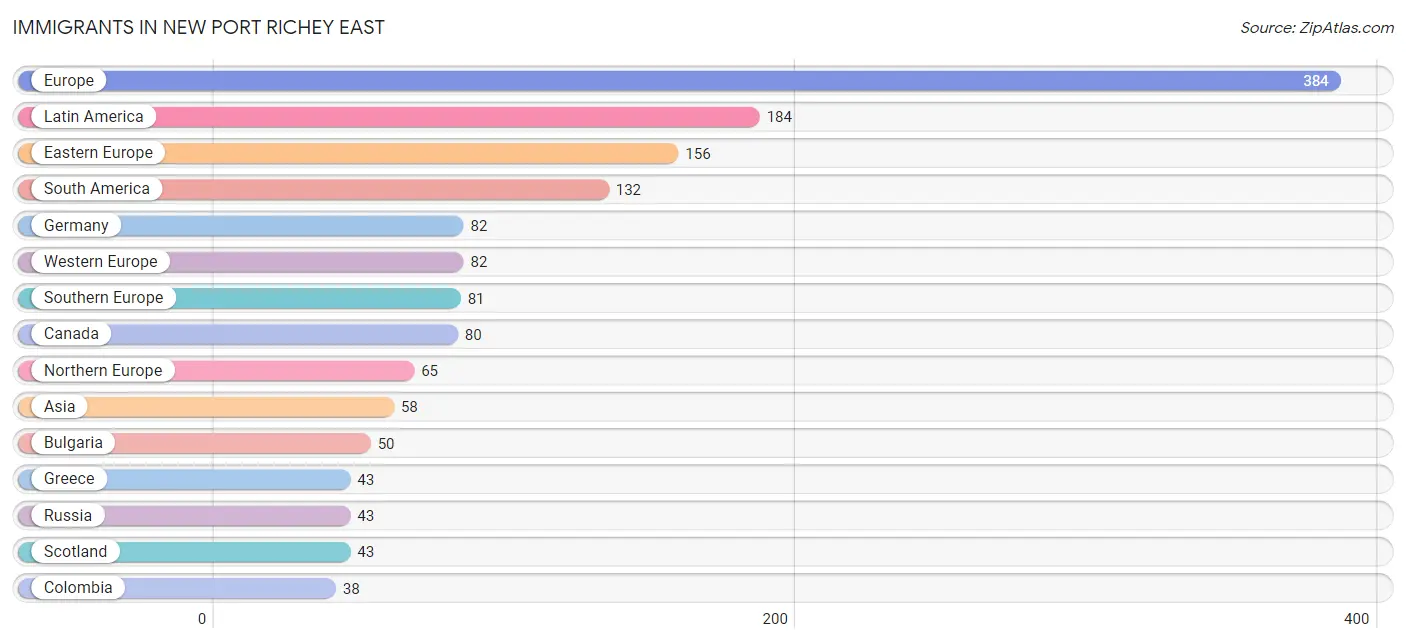
| Immigration Origin | # Population | % Population |
| Afghanistan | 14 | 0.1% |
| Albania | 8 | 0.1% |
| Asia | 58 | 0.5% |
| Australia | 5 | 0.0% |
| Brazil | 32 | 0.3% |
| Bulgaria | 50 | 0.4% |
| Canada | 80 | 0.7% |
| Caribbean | 26 | 0.2% |
| Central America | 26 | 0.2% |
| Colombia | 38 | 0.3% |
| Cuba | 23 | 0.2% |
| Eastern Europe | 156 | 1.4% |
| Europe | 384 | 3.4% |
| Germany | 82 | 0.7% |
| Greece | 43 | 0.4% |
| Guatemala | 6 | 0.1% |
| Guyana | 23 | 0.2% |
| Haiti | 3 | 0.0% |
| Ireland | 22 | 0.2% |
| Israel | 11 | 0.1% |
| Italy | 38 | 0.3% |
| Latin America | 184 | 1.7% |
| Mexico | 9 | 0.1% |
| Nicaragua | 10 | 0.1% |
| Northern Europe | 65 | 0.6% |
| Oceania | 5 | 0.0% |
| Panama | 1 | 0.0% |
| Peru | 6 | 0.1% |
| Philippines | 24 | 0.2% |
| Poland | 19 | 0.2% |
| Romania | 36 | 0.3% |
| Russia | 43 | 0.4% |
| Scotland | 43 | 0.4% |
| South America | 132 | 1.2% |
| South Central Asia | 14 | 0.1% |
| South Eastern Asia | 33 | 0.3% |
| Southern Europe | 81 | 0.7% |
| Thailand | 9 | 0.1% |
| Venezuela | 33 | 0.3% |
| Western Asia | 11 | 0.1% |
| Western Europe | 82 | 0.7% | View All 41 Rows |
Sex and Age in New Port Richey East
Sex and Age in New Port Richey East
The most populous age groups in New Port Richey East are 70 to 74 Years (528 | 9.3%) for men and 65 to 69 Years (675 | 12.2%) for women.
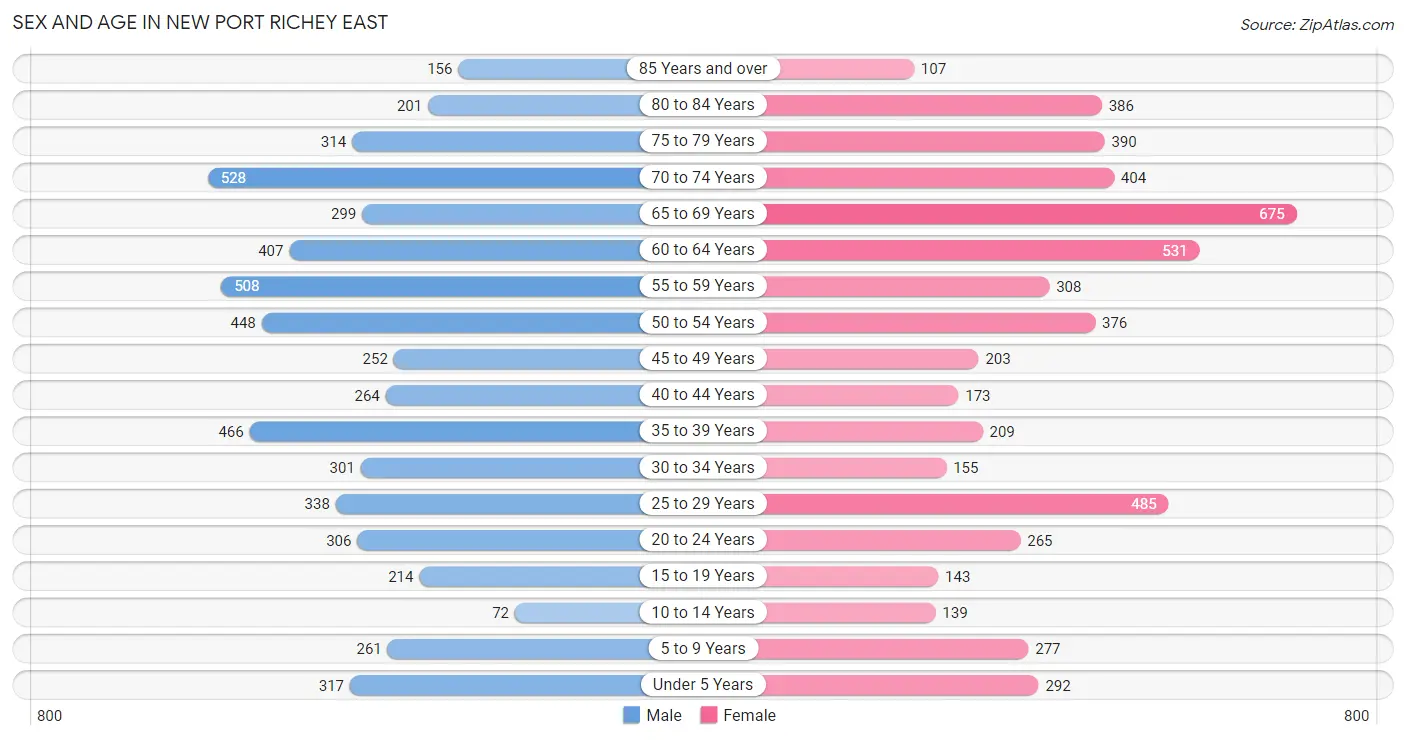
| Age Bracket | Male | Female |
| Under 5 Years | 317 (5.6%) | 292 (5.3%) |
| 5 to 9 Years | 261 (4.6%) | 277 (5.0%) |
| 10 to 14 Years | 72 (1.3%) | 139 (2.5%) |
| 15 to 19 Years | 214 (3.8%) | 143 (2.6%) |
| 20 to 24 Years | 306 (5.4%) | 265 (4.8%) |
| 25 to 29 Years | 338 (6.0%) | 485 (8.8%) |
| 30 to 34 Years | 301 (5.3%) | 155 (2.8%) |
| 35 to 39 Years | 466 (8.2%) | 209 (3.8%) |
| 40 to 44 Years | 264 (4.7%) | 173 (3.1%) |
| 45 to 49 Years | 252 (4.5%) | 203 (3.7%) |
| 50 to 54 Years | 448 (7.9%) | 376 (6.8%) |
| 55 to 59 Years | 508 (9.0%) | 308 (5.6%) |
| 60 to 64 Years | 407 (7.2%) | 531 (9.6%) |
| 65 to 69 Years | 299 (5.3%) | 675 (12.2%) |
| 70 to 74 Years | 528 (9.3%) | 404 (7.3%) |
| 75 to 79 Years | 314 (5.6%) | 390 (7.1%) |
| 80 to 84 Years | 201 (3.6%) | 386 (7.0%) |
| 85 Years and over | 156 (2.8%) | 107 (1.9%) |
| Total | 5,652 (100.0%) | 5,518 (100.0%) |
Families and Households in New Port Richey East
Median Family Size in New Port Richey East
The median family size in New Port Richey East is 2.85 persons per family, with single female/mother families (548 | 22.1%) accounting for the largest median family size of 3.33 persons per family. On the other hand, married-couple families (1,753 | 70.7%) represent the smallest median family size with 2.65 persons per family.
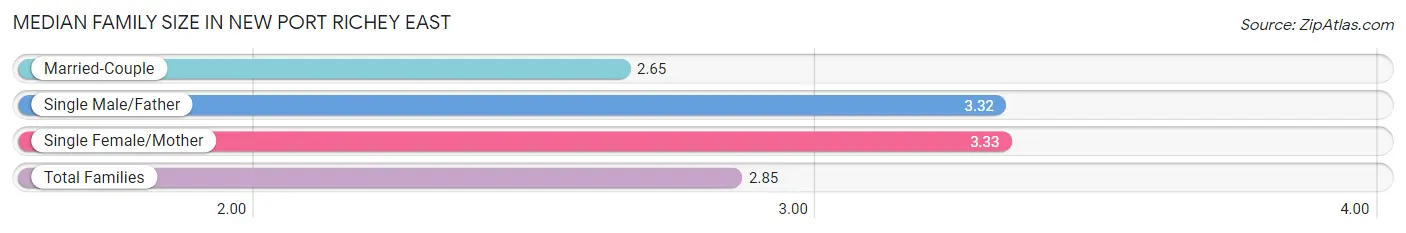
| Family Type | # Families | Family Size |
| Married-Couple | 1,753 (70.7%) | 2.65 |
| Single Male/Father | 177 (7.1%) | 3.32 |
| Single Female/Mother | 548 (22.1%) | 3.33 |
| Total Families | 2,478 (100.0%) | 2.85 |
Median Household Size in New Port Richey East
The median household size in New Port Richey East is 2.07 persons per household, with single female/mother households (548 | 10.2%) accounting for the largest median household size of 3.92 persons per household. non-family households (2,866 | 53.6%) represent the smallest median household size with 1.25 persons per household.
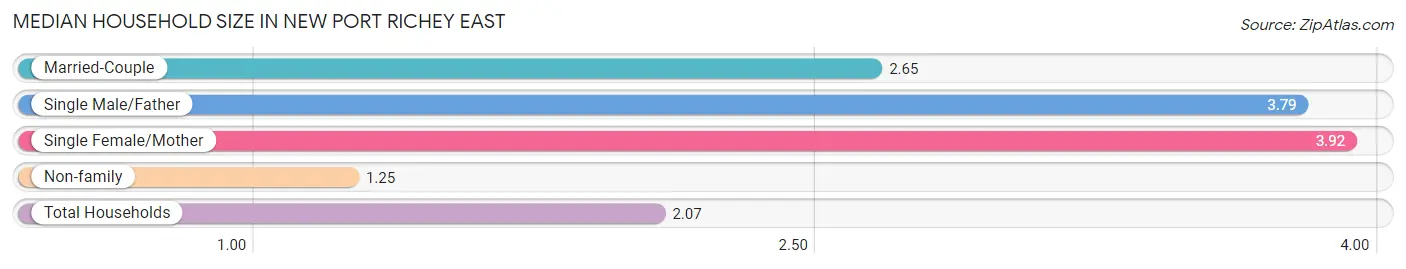
| Household Type | # Households | Household Size |
| Married-Couple | 1,753 (32.8%) | 2.65 |
| Single Male/Father | 177 (3.3%) | 3.79 |
| Single Female/Mother | 548 (10.2%) | 3.92 |
| Non-family | 2,866 (53.6%) | 1.25 |
| Total Households | 5,344 (100.0%) | 2.07 |
Household Size by Marriage Status in New Port Richey East
Out of a total of 5,344 households in New Port Richey East, 2,478 (46.4%) are family households, while 2,866 (53.6%) are nonfamily households. The most numerous type of family households are 2-person households, comprising 1,364, and the most common type of nonfamily households are 1-person households, comprising 2,305.
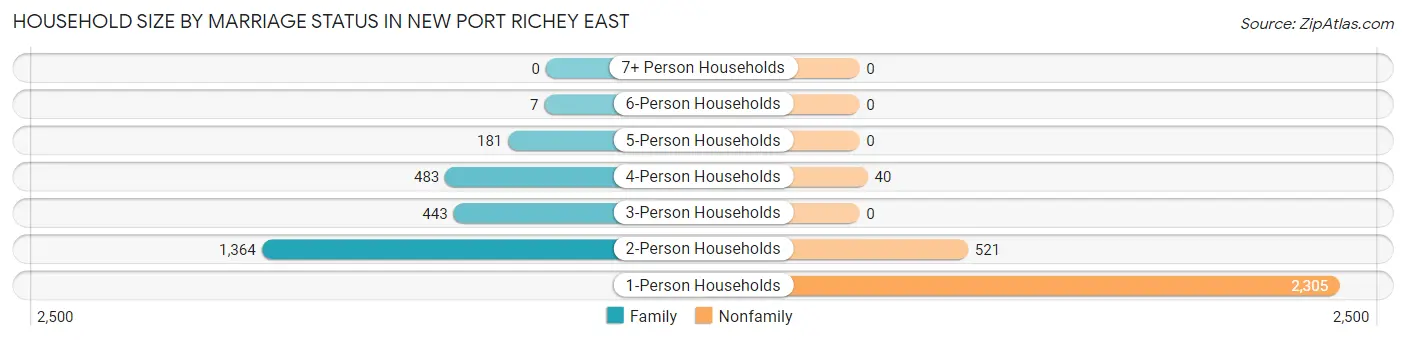
| Household Size | Family Households | Nonfamily Households |
| 1-Person Households | - | 2,305 (43.1%) |
| 2-Person Households | 1,364 (25.5%) | 521 (9.8%) |
| 3-Person Households | 443 (8.3%) | 0 (0.0%) |
| 4-Person Households | 483 (9.0%) | 40 (0.7%) |
| 5-Person Households | 181 (3.4%) | 0 (0.0%) |
| 6-Person Households | 7 (0.1%) | 0 (0.0%) |
| 7+ Person Households | 0 (0.0%) | 0 (0.0%) |
| Total | 2,478 (46.4%) | 2,866 (53.6%) |
Female Fertility in New Port Richey East
Fertility by Age in New Port Richey East
Average fertility rate in New Port Richey East is 112.0 births per 1,000 women. Women in the age bracket of 35 to 50 years have the highest fertility rate with 138.0 births per 1,000 women. Women in the age bracket of 20 to 34 years acount for 54.8% of all women with births.
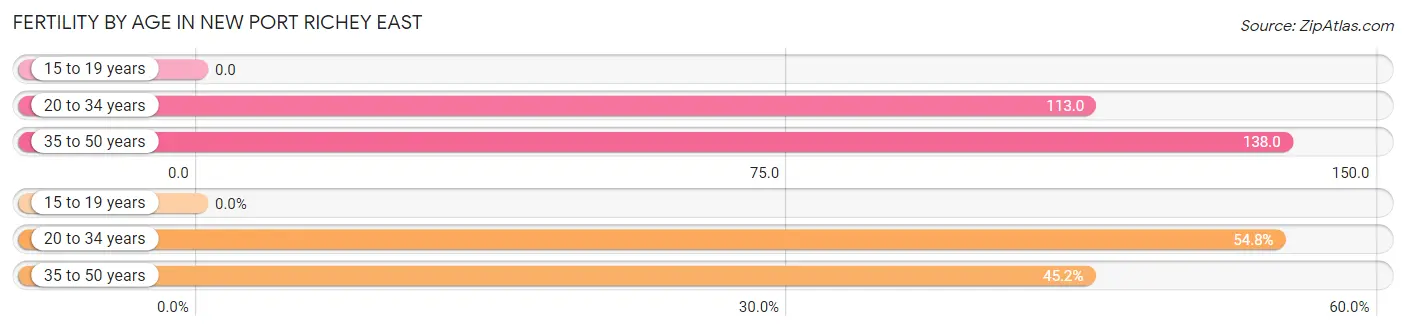
| Age Bracket | Women with Births | Births / 1,000 Women |
| 15 to 19 years | 0 (0.0%) | 0.0 |
| 20 to 34 years | 102 (54.8%) | 113.0 |
| 35 to 50 years | 84 (45.2%) | 138.0 |
| Total | 186 (100.0%) | 112.0 |
Fertility by Age by Marriage Status in New Port Richey East
71.0% of women with births (186) in New Port Richey East are married. The highest percentage of unmarried women with births falls into 35 to 50 years age bracket with 51.2% of them unmarried at the time of birth, while the lowest percentage of unmarried women with births belong to 20 to 34 years age bracket with 10.8% of them unmarried.
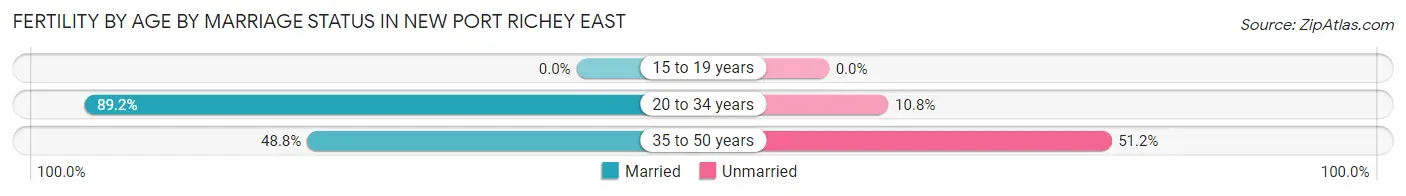
| Age Bracket | Married | Unmarried |
| 15 to 19 years | 0 (0.0%) | 0 (0.0%) |
| 20 to 34 years | 91 (89.2%) | 11 (10.8%) |
| 35 to 50 years | 41 (48.8%) | 43 (51.2%) |
| Total | 132 (71.0%) | 54 (29.0%) |
Fertility by Education in New Port Richey East
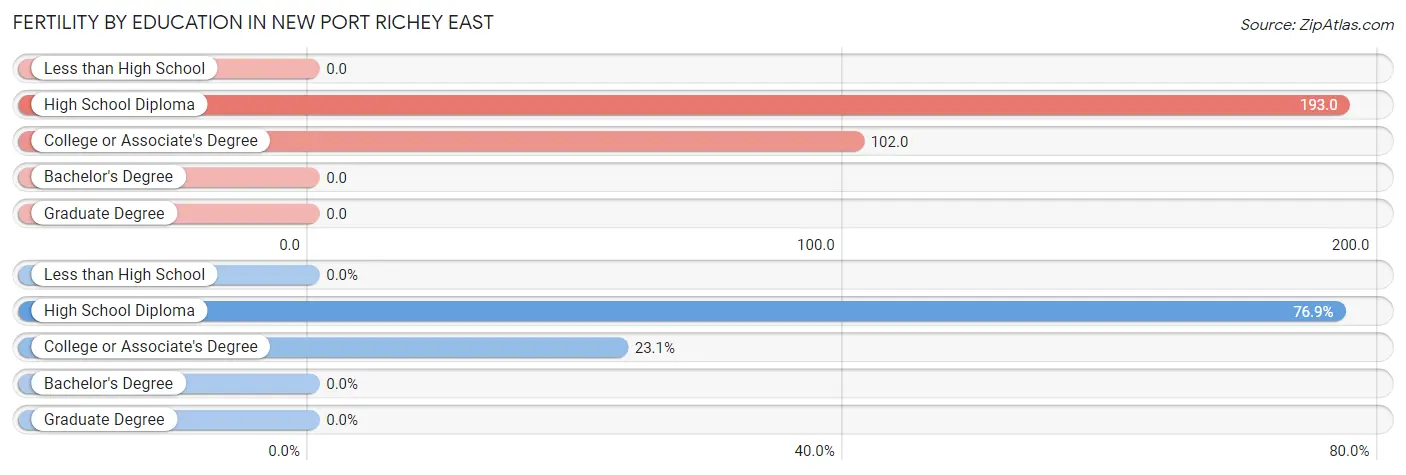
| Educational Attainment | Women with Births | Births / 1,000 Women |
| Less than High School | 0 (0.0%) | 0.0 |
| High School Diploma | 143 (76.9%) | 193.0 |
| College or Associate's Degree | 43 (23.1%) | 102.0 |
| Bachelor's Degree | 0 (0.0%) | 0.0 |
| Graduate Degree | 0 (0.0%) | 0.0 |
| Total | 186 (100.0%) | 112.0 |
Fertility by Education by Marriage Status in New Port Richey East
29.0% of women with births in New Port Richey East are unmarried. Women with the educational attainment of high school diploma are most likely to be married with 92.3% of them married at childbirth, while women with the educational attainment of college or associate's degree are least likely to be married with 100.0% of them unmarried at childbirth.
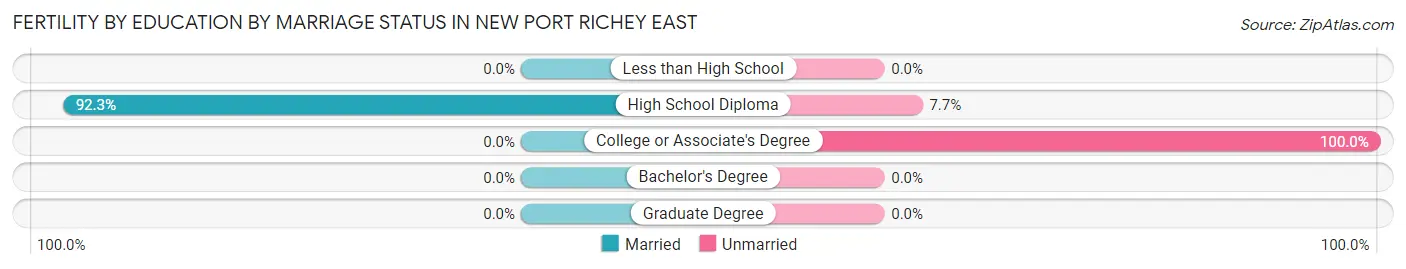
| Educational Attainment | Married | Unmarried |
| Less than High School | 0 (0.0%) | 0 (0.0%) |
| High School Diploma | 132 (92.3%) | 11 (7.7%) |
| College or Associate's Degree | 0 (0.0%) | 43 (100.0%) |
| Bachelor's Degree | 0 (0.0%) | 0 (0.0%) |
| Graduate Degree | 0 (0.0%) | 0 (0.0%) |
| Total | 132 (71.0%) | 54 (29.0%) |
Employment Characteristics in New Port Richey East
Employment by Class of Employer in New Port Richey East
Among the 4,008 employed individuals in New Port Richey East, private company employees (2,846 | 71.0%), self-employed (incorporated) (446 | 11.1%), and not-for-profit organizations (269 | 6.7%) make up the most common classes of employment.
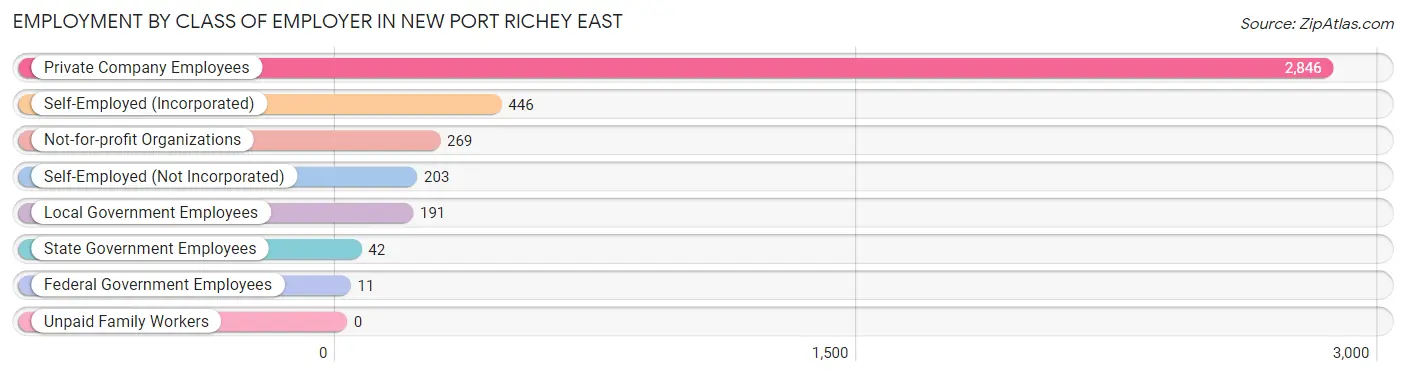
| Employer Class | # Employees | % Employees |
| Private Company Employees | 2,846 | 71.0% |
| Self-Employed (Incorporated) | 446 | 11.1% |
| Self-Employed (Not Incorporated) | 203 | 5.1% |
| Not-for-profit Organizations | 269 | 6.7% |
| Local Government Employees | 191 | 4.8% |
| State Government Employees | 42 | 1.1% |
| Federal Government Employees | 11 | 0.3% |
| Unpaid Family Workers | 0 | 0.0% |
| Total | 4,008 | 100.0% |
Employment Status by Age in New Port Richey East
According to the labor force statistics for New Port Richey East, out of the total population over 16 years of age (9,751), 49.2% or 4,797 individuals are in the labor force, with 13.0% or 624 of them unemployed. The age group with the highest labor force participation rate is 35 to 44 years, with 88.1% or 980 individuals in the labor force. Within the labor force, the 16 to 19 years age range has the highest percentage of unemployed individuals, with 63.1% or 101 of them being unemployed.
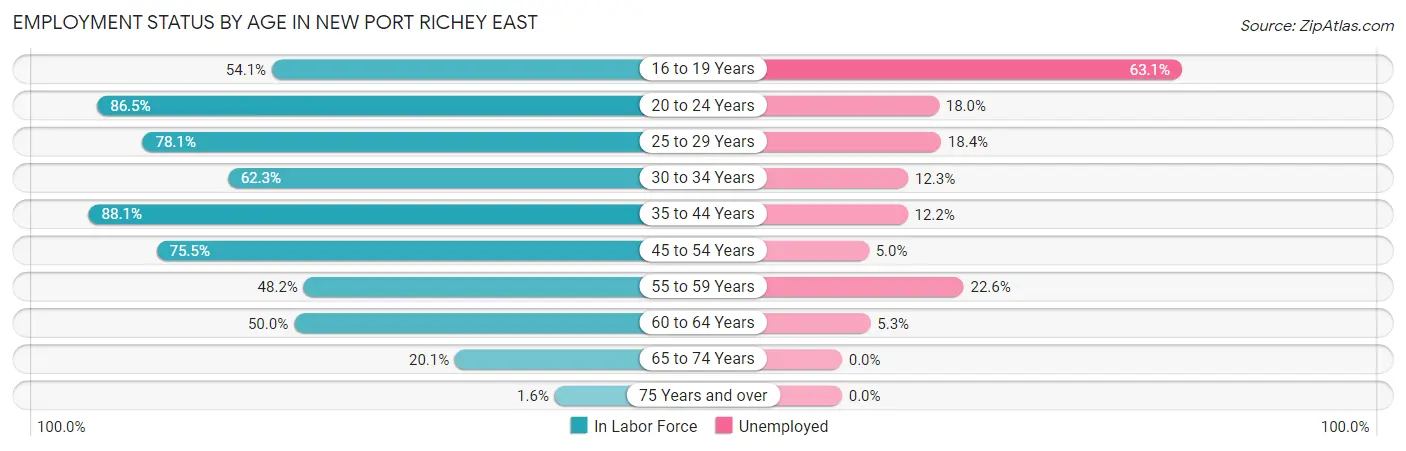
| Age Bracket | In Labor Force | Unemployed |
| 16 to 19 Years | 160 (54.1%) | 101 (63.1%) |
| 20 to 24 Years | 494 (86.5%) | 89 (18.0%) |
| 25 to 29 Years | 643 (78.1%) | 118 (18.4%) |
| 30 to 34 Years | 284 (62.3%) | 35 (12.3%) |
| 35 to 44 Years | 980 (88.1%) | 120 (12.2%) |
| 45 to 54 Years | 966 (75.5%) | 48 (5.0%) |
| 55 to 59 Years | 393 (48.2%) | 89 (22.6%) |
| 60 to 64 Years | 469 (50.0%) | 25 (5.3%) |
| 65 to 74 Years | 383 (20.1%) | 0 (0.0%) |
| 75 Years and over | 25 (1.6%) | 0 (0.0%) |
| Total | 4,797 (49.2%) | 624 (13.0%) |
Employment Status by Educational Attainment in New Port Richey East
According to labor force statistics for New Port Richey East, 68.9% of individuals (3,737) out of the total population between 25 and 64 years of age (5,424) are in the labor force, with 11.6% or 433 of them being unemployed. The group with the highest labor force participation rate are those with the educational attainment of bachelor's degree or higher, with 78.8% or 661 individuals in the labor force. Within the labor force, individuals with bachelor's degree or higher education have the highest percentage of unemployment, with 14.7% or 97 of them being unemployed.
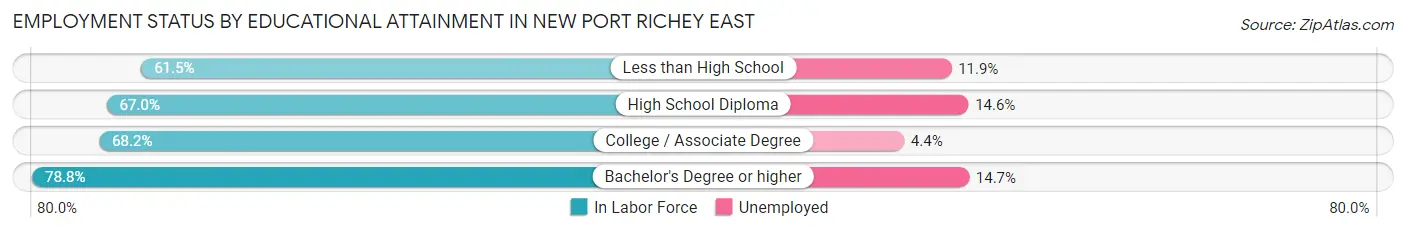
| Educational Attainment | In Labor Force | Unemployed |
| Less than High School | 176 (61.5%) | 34 (11.9%) |
| High School Diploma | 1,851 (67.0%) | 403 (14.6%) |
| College / Associate Degree | 1,048 (68.2%) | 68 (4.4%) |
| Bachelor's Degree or higher | 661 (78.8%) | 123 (14.7%) |
| Total | 3,737 (68.9%) | 629 (11.6%) |
Employment Occupations by Sex in New Port Richey East
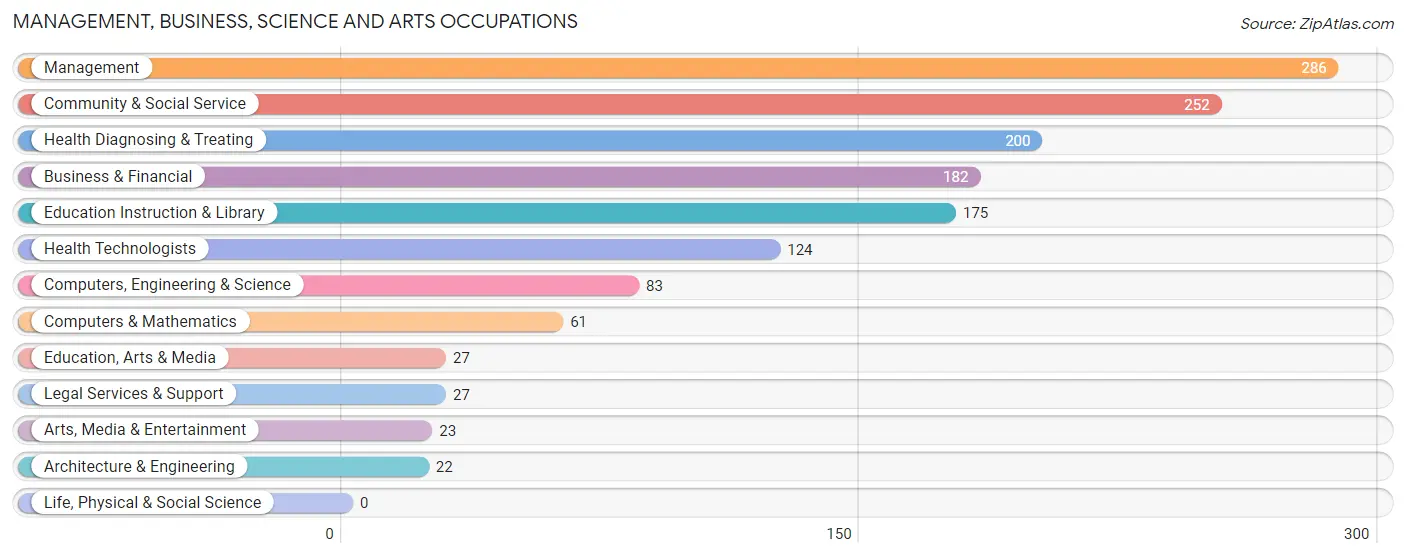
Management, Business, Science and Arts Occupations
The most common Management, Business, Science and Arts occupations in New Port Richey East are Management (286 | 6.9%), Community & Social Service (252 | 6.0%), Health Diagnosing & Treating (200 | 4.8%), Business & Financial (182 | 4.4%), and Education Instruction & Library (175 | 4.2%).
Management, Business, Science and Arts Occupations by Sex
Within the Management, Business, Science and Arts occupations in New Port Richey East, the most male-oriented occupations are Architecture & Engineering (100.0%), Computers, Engineering & Science (75.9%), and Management (72.7%), while the most female-oriented occupations are Education, Arts & Media (100.0%), Arts, Media & Entertainment (73.9%), and Education Instruction & Library (73.7%).
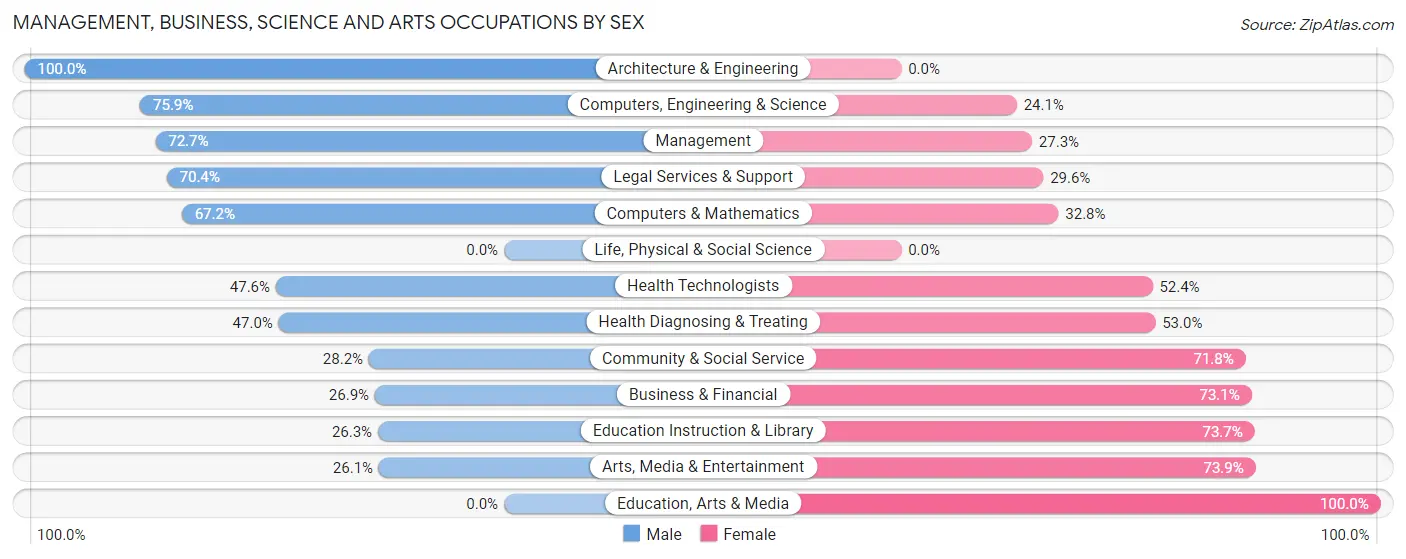
| Occupation | Male | Female |
| Management | 208 (72.7%) | 78 (27.3%) |
| Business & Financial | 49 (26.9%) | 133 (73.1%) |
| Computers, Engineering & Science | 63 (75.9%) | 20 (24.1%) |
| Computers & Mathematics | 41 (67.2%) | 20 (32.8%) |
| Architecture & Engineering | 22 (100.0%) | 0 (0.0%) |
| Life, Physical & Social Science | 0 (0.0%) | 0 (0.0%) |
| Community & Social Service | 71 (28.2%) | 181 (71.8%) |
| Education, Arts & Media | 0 (0.0%) | 27 (100.0%) |
| Legal Services & Support | 19 (70.4%) | 8 (29.6%) |
| Education Instruction & Library | 46 (26.3%) | 129 (73.7%) |
| Arts, Media & Entertainment | 6 (26.1%) | 17 (73.9%) |
| Health Diagnosing & Treating | 94 (47.0%) | 106 (53.0%) |
| Health Technologists | 59 (47.6%) | 65 (52.4%) |
| Total (Category) | 485 (48.3%) | 518 (51.6%) |
| Total (Overall) | 2,339 (56.0%) | 1,834 (44.0%) |
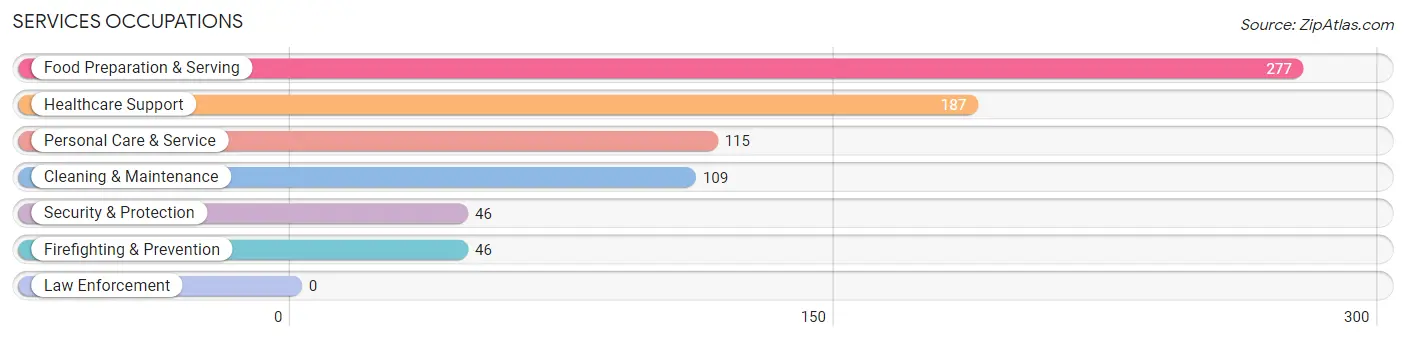
Services Occupations
The most common Services occupations in New Port Richey East are Food Preparation & Serving (277 | 6.6%), Healthcare Support (187 | 4.5%), Personal Care & Service (115 | 2.8%), Cleaning & Maintenance (109 | 2.6%), and Security & Protection (46 | 1.1%).
Services Occupations by Sex
Within the Services occupations in New Port Richey East, the most male-oriented occupations are Cleaning & Maintenance (100.0%), Security & Protection (76.1%), and Firefighting & Prevention (76.1%), while the most female-oriented occupations are Healthcare Support (96.8%), Personal Care & Service (89.6%), and Food Preparation & Serving (55.2%).
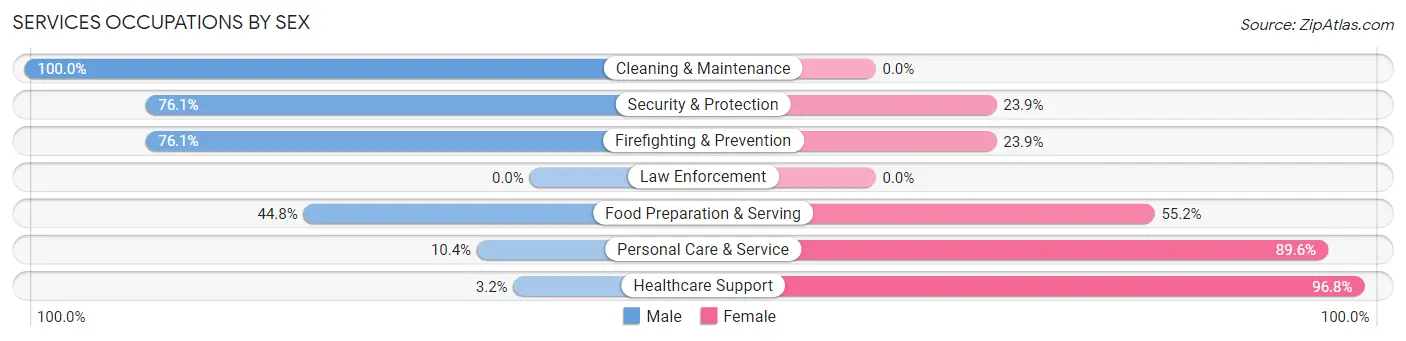
| Occupation | Male | Female |
| Healthcare Support | 6 (3.2%) | 181 (96.8%) |
| Security & Protection | 35 (76.1%) | 11 (23.9%) |
| Firefighting & Prevention | 35 (76.1%) | 11 (23.9%) |
| Law Enforcement | 0 (0.0%) | 0 (0.0%) |
| Food Preparation & Serving | 124 (44.8%) | 153 (55.2%) |
| Cleaning & Maintenance | 109 (100.0%) | 0 (0.0%) |
| Personal Care & Service | 12 (10.4%) | 103 (89.6%) |
| Total (Category) | 286 (39.0%) | 448 (61.0%) |
| Total (Overall) | 2,339 (56.0%) | 1,834 (44.0%) |
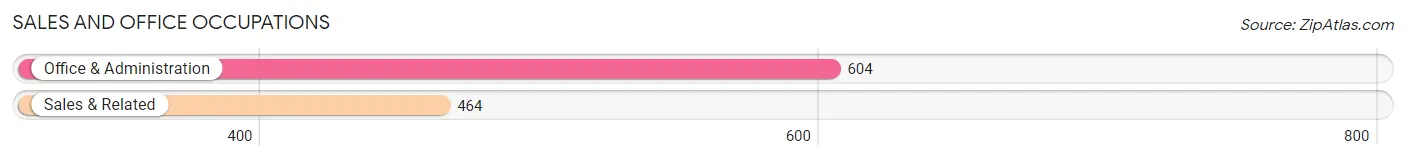
Sales and Office Occupations
The most common Sales and Office occupations in New Port Richey East are Office & Administration (604 | 14.5%), and Sales & Related (464 | 11.1%).
Sales and Office Occupations by Sex
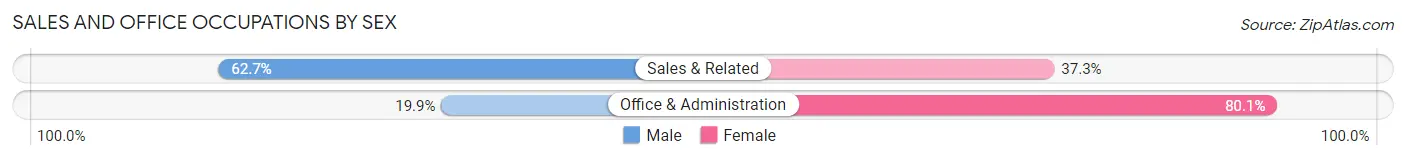
| Occupation | Male | Female |
| Sales & Related | 291 (62.7%) | 173 (37.3%) |
| Office & Administration | 120 (19.9%) | 484 (80.1%) |
| Total (Category) | 411 (38.5%) | 657 (61.5%) |
| Total (Overall) | 2,339 (56.0%) | 1,834 (44.0%) |
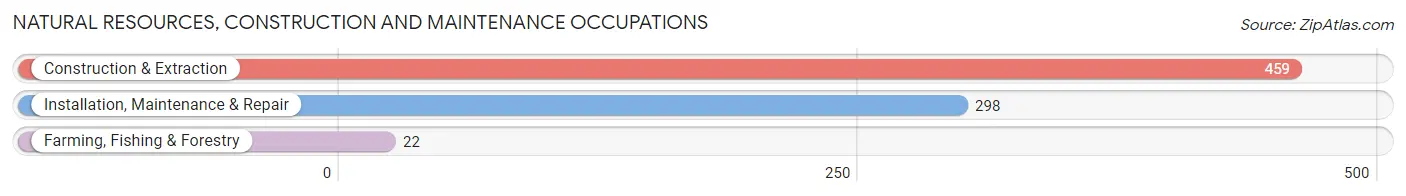
Natural Resources, Construction and Maintenance Occupations
The most common Natural Resources, Construction and Maintenance occupations in New Port Richey East are Construction & Extraction (459 | 11.0%), Installation, Maintenance & Repair (298 | 7.1%), and Farming, Fishing & Forestry (22 | 0.5%).
Natural Resources, Construction and Maintenance Occupations by Sex
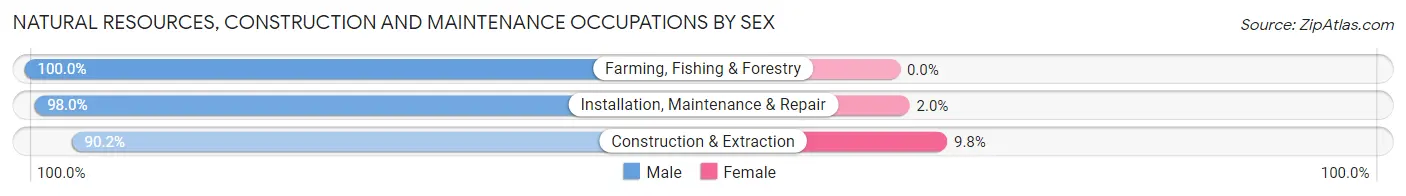
| Occupation | Male | Female |
| Farming, Fishing & Forestry | 22 (100.0%) | 0 (0.0%) |
| Construction & Extraction | 414 (90.2%) | 45 (9.8%) |
| Installation, Maintenance & Repair | 292 (98.0%) | 6 (2.0%) |
| Total (Category) | 728 (93.4%) | 51 (6.6%) |
| Total (Overall) | 2,339 (56.0%) | 1,834 (44.0%) |
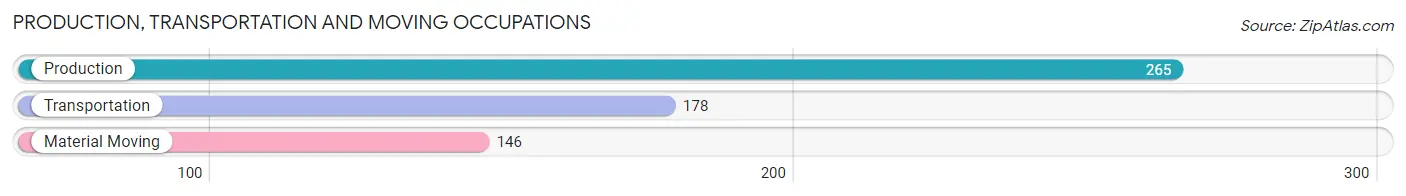
Production, Transportation and Moving Occupations
The most common Production, Transportation and Moving occupations in New Port Richey East are Production (265 | 6.4%), Transportation (178 | 4.3%), and Material Moving (146 | 3.5%).
Production, Transportation and Moving Occupations by Sex
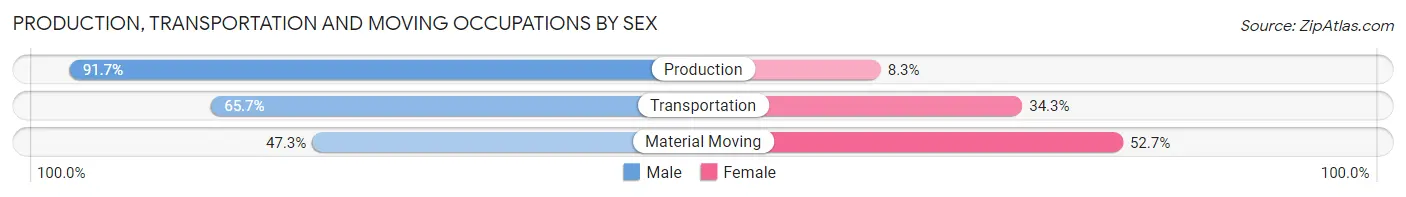
| Occupation | Male | Female |
| Production | 243 (91.7%) | 22 (8.3%) |
| Transportation | 117 (65.7%) | 61 (34.3%) |
| Material Moving | 69 (47.3%) | 77 (52.7%) |
| Total (Category) | 429 (72.8%) | 160 (27.2%) |
| Total (Overall) | 2,339 (56.0%) | 1,834 (44.0%) |
Employment Industries by Sex in New Port Richey East
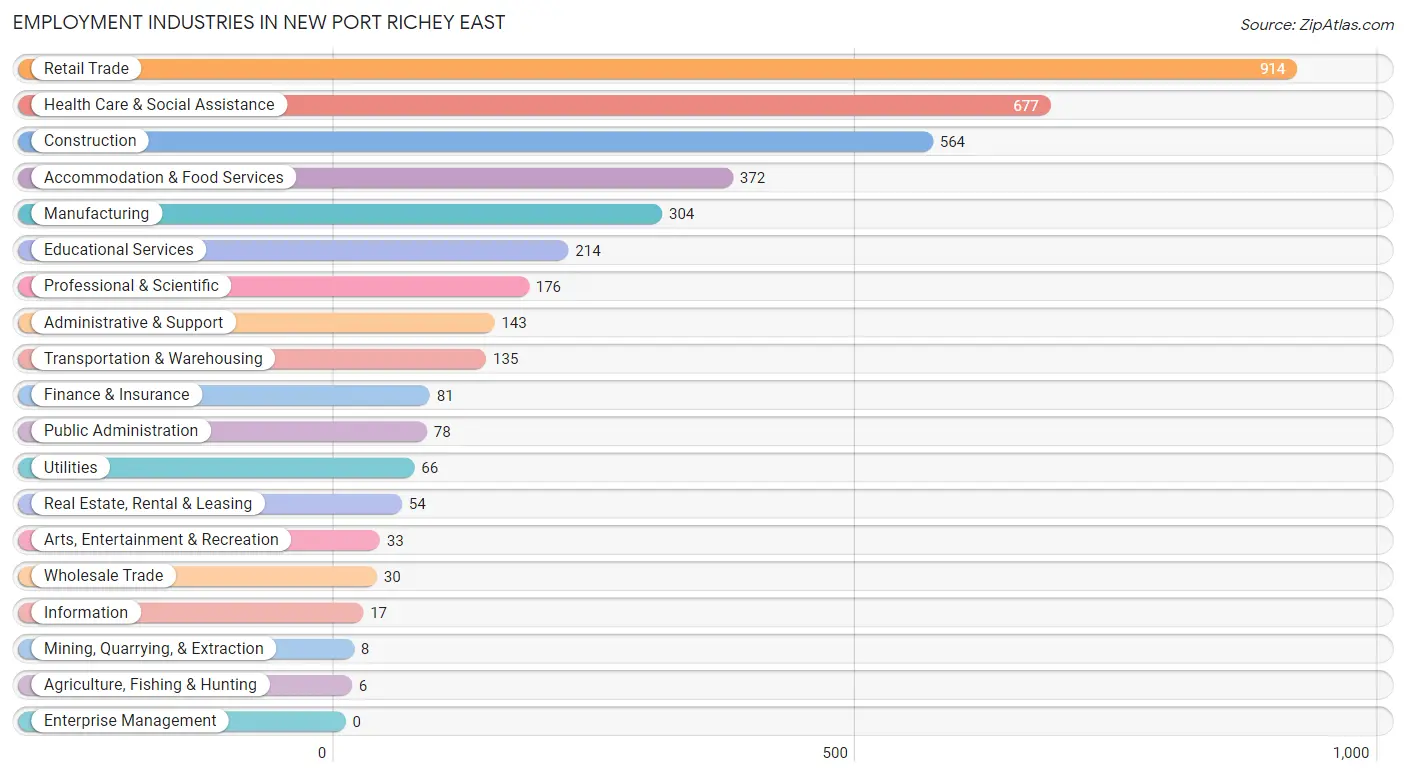
Employment Industries in New Port Richey East
The major employment industries in New Port Richey East include Retail Trade (914 | 21.9%), Health Care & Social Assistance (677 | 16.2%), Construction (564 | 13.5%), Accommodation & Food Services (372 | 8.9%), and Manufacturing (304 | 7.3%).
Employment Industries by Sex in New Port Richey East
The New Port Richey East industries that see more men than women are Agriculture, Fishing & Hunting (100.0%), Mining, Quarrying, & Extraction (100.0%), and Wholesale Trade (100.0%), whereas the industries that tend to have a higher number of women are Health Care & Social Assistance (69.1%), Public Administration (61.5%), and Arts, Entertainment & Recreation (60.6%).
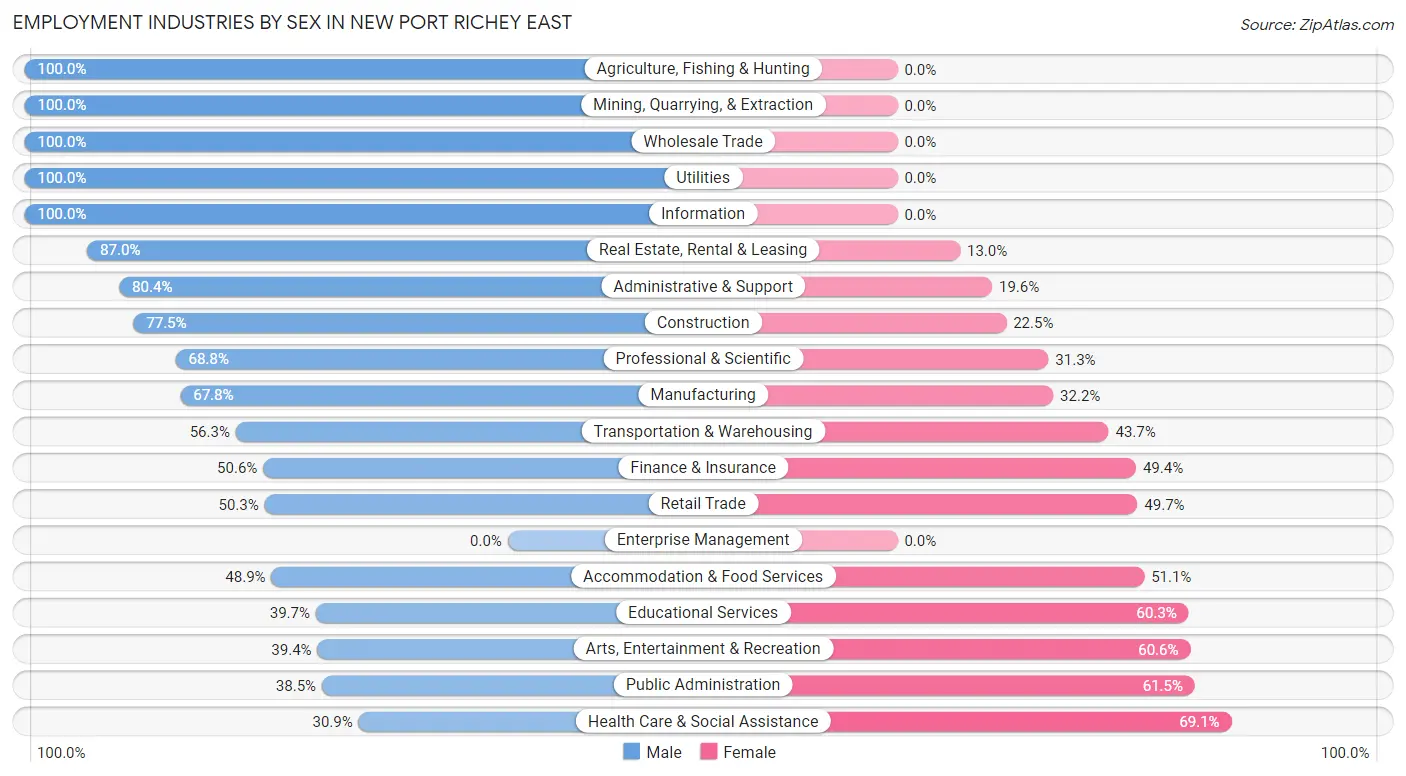
| Industry | Male | Female |
| Agriculture, Fishing & Hunting | 6 (100.0%) | 0 (0.0%) |
| Mining, Quarrying, & Extraction | 8 (100.0%) | 0 (0.0%) |
| Construction | 437 (77.5%) | 127 (22.5%) |
| Manufacturing | 206 (67.8%) | 98 (32.2%) |
| Wholesale Trade | 30 (100.0%) | 0 (0.0%) |
| Retail Trade | 460 (50.3%) | 454 (49.7%) |
| Transportation & Warehousing | 76 (56.3%) | 59 (43.7%) |
| Utilities | 66 (100.0%) | 0 (0.0%) |
| Information | 17 (100.0%) | 0 (0.0%) |
| Finance & Insurance | 41 (50.6%) | 40 (49.4%) |
| Real Estate, Rental & Leasing | 47 (87.0%) | 7 (13.0%) |
| Professional & Scientific | 121 (68.8%) | 55 (31.2%) |
| Enterprise Management | 0 (0.0%) | 0 (0.0%) |
| Administrative & Support | 115 (80.4%) | 28 (19.6%) |
| Educational Services | 85 (39.7%) | 129 (60.3%) |
| Health Care & Social Assistance | 209 (30.9%) | 468 (69.1%) |
| Arts, Entertainment & Recreation | 13 (39.4%) | 20 (60.6%) |
| Accommodation & Food Services | 182 (48.9%) | 190 (51.1%) |
| Public Administration | 30 (38.5%) | 48 (61.5%) |
| Total | 2,339 (56.0%) | 1,834 (44.0%) |
Education in New Port Richey East
School Enrollment in New Port Richey East
The most common levels of schooling among the 1,375 students in New Port Richey East are elementary school (414 | 30.1%), college / undergraduate (282 | 20.5%), and high school (229 | 16.7%).
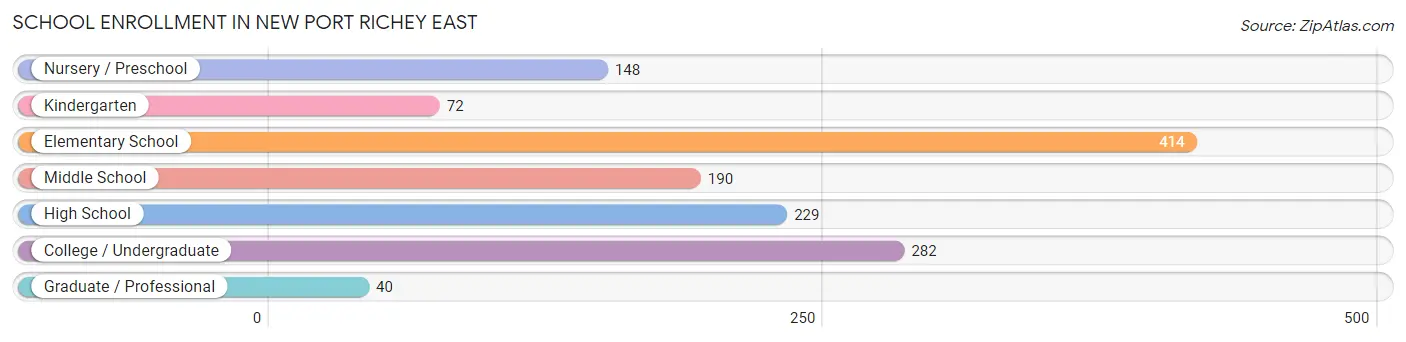
| School Level | # Students | % Students |
| Nursery / Preschool | 148 | 10.8% |
| Kindergarten | 72 | 5.2% |
| Elementary School | 414 | 30.1% |
| Middle School | 190 | 13.8% |
| High School | 229 | 16.7% |
| College / Undergraduate | 282 | 20.5% |
| Graduate / Professional | 40 | 2.9% |
| Total | 1,375 | 100.0% |
School Enrollment by Age by Funding Source in New Port Richey East
Out of a total of 1,375 students who are enrolled in schools in New Port Richey East, 170 (12.4%) attend a private institution, while the remaining 1,204 (87.6%) are enrolled in public schools. The age group of 35 years and over has the highest likelihood of being enrolled in private schools, with 32 (47.1% in the age bracket) enrolled. Conversely, the age group of 10 to 14 year olds has the lowest likelihood of being enrolled in a private school, with 211 (100.0% in the age bracket) attending a public institution.
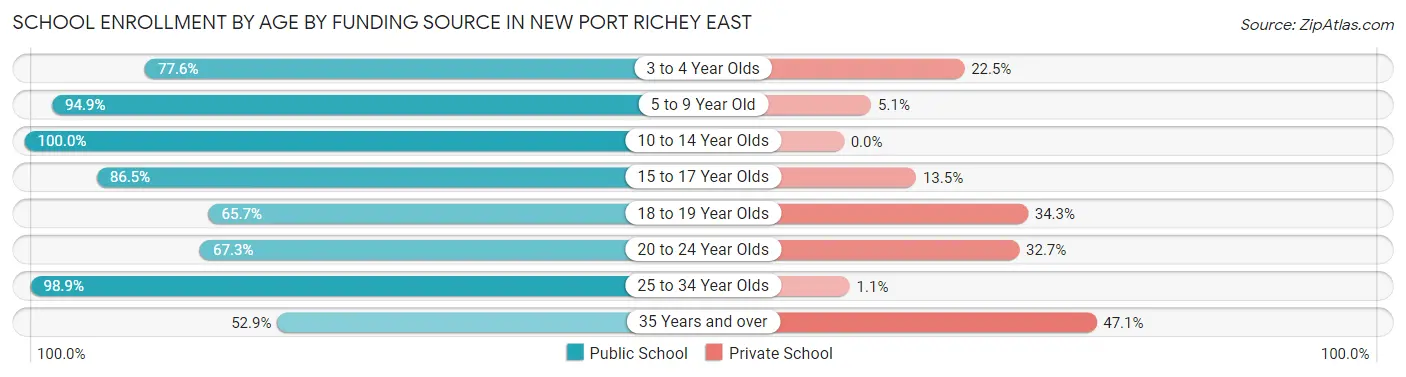
| Age Bracket | Public School | Private School |
| 3 to 4 Year Olds | 76 (77.5%) | 22 (22.5%) |
| 5 to 9 Year Old | 500 (94.9%) | 27 (5.1%) |
| 10 to 14 Year Olds | 211 (100.0%) | 0 (0.0%) |
| 15 to 17 Year Olds | 167 (86.5%) | 26 (13.5%) |
| 18 to 19 Year Olds | 23 (65.7%) | 12 (34.3%) |
| 20 to 24 Year Olds | 103 (67.3%) | 50 (32.7%) |
| 25 to 34 Year Olds | 89 (98.9%) | 1 (1.1%) |
| 35 Years and over | 36 (52.9%) | 32 (47.1%) |
| Total | 1,204 (87.6%) | 170 (12.4%) |
Educational Attainment by Field of Study in New Port Richey East
Business (266 | 22.2%), education (195 | 16.3%), science & technology (171 | 14.3%), psychology (122 | 10.2%), and literature & languages (82 | 6.8%) are the most common fields of study among 1,198 individuals in New Port Richey East who have obtained a bachelor's degree or higher.
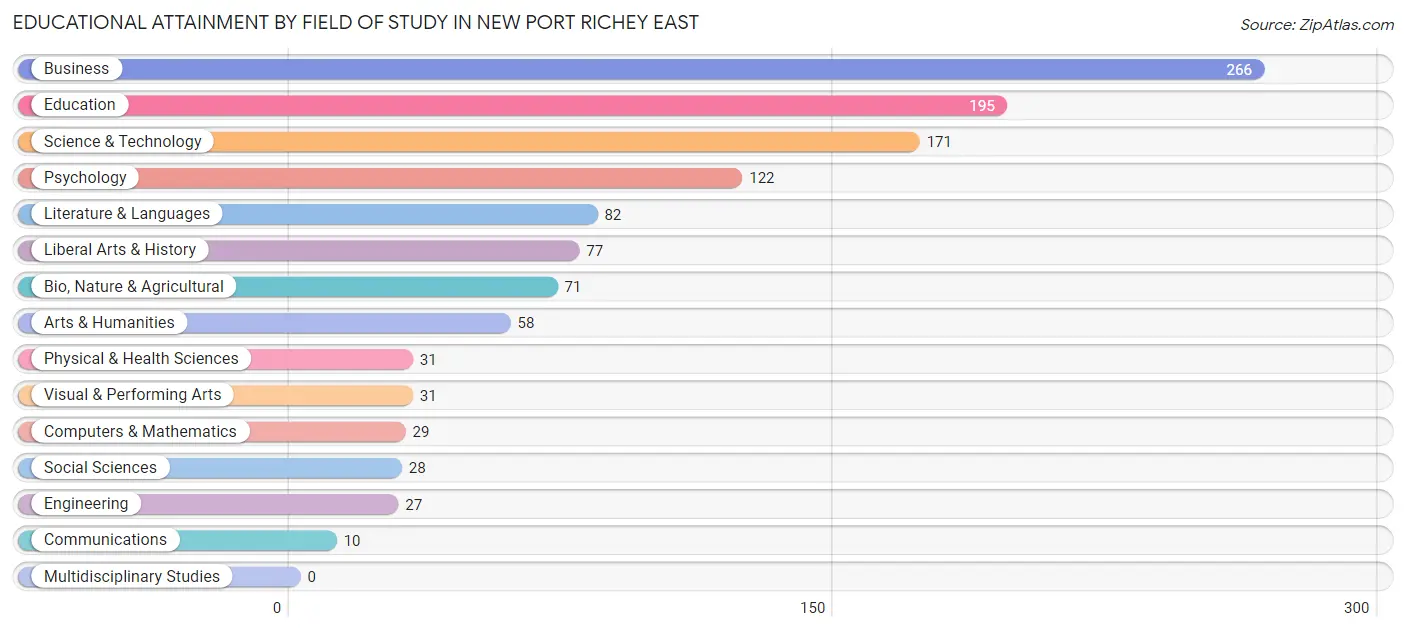
| Field of Study | # Graduates | % Graduates |
| Computers & Mathematics | 29 | 2.4% |
| Bio, Nature & Agricultural | 71 | 5.9% |
| Physical & Health Sciences | 31 | 2.6% |
| Psychology | 122 | 10.2% |
| Social Sciences | 28 | 2.3% |
| Engineering | 27 | 2.2% |
| Multidisciplinary Studies | 0 | 0.0% |
| Science & Technology | 171 | 14.3% |
| Business | 266 | 22.2% |
| Education | 195 | 16.3% |
| Literature & Languages | 82 | 6.8% |
| Liberal Arts & History | 77 | 6.4% |
| Visual & Performing Arts | 31 | 2.6% |
| Communications | 10 | 0.8% |
| Arts & Humanities | 58 | 4.8% |
| Total | 1,198 | 100.0% |
Transportation & Commute in New Port Richey East
Vehicle Availability by Sex in New Port Richey East
The most prevalent vehicle ownership categories in New Port Richey East are males with 2 vehicles (987, accounting for 44.5%) and females with 2 vehicles (888, making up 55.6%).
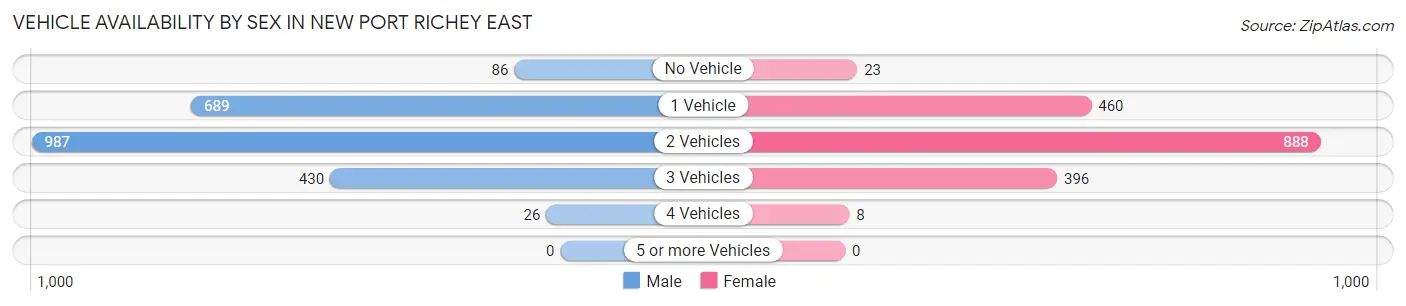
| Vehicles Available | Male | Female |
| No Vehicle | 86 (3.9%) | 23 (1.3%) |
| 1 Vehicle | 689 (31.1%) | 460 (25.9%) |
| 2 Vehicles | 987 (44.5%) | 888 (50.0%) |
| 3 Vehicles | 430 (19.4%) | 396 (22.3%) |
| 4 Vehicles | 26 (1.2%) | 8 (0.4%) |
| 5 or more Vehicles | 0 (0.0%) | 0 (0.0%) |
| Total | 2,218 (100.0%) | 1,775 (100.0%) |
Commute Time in New Port Richey East
The most frequently occuring commute durations in New Port Richey East are 5 to 9 minutes (600 commuters, 16.5%), 10 to 14 minutes (580 commuters, 16.0%), and 20 to 24 minutes (530 commuters, 14.6%).
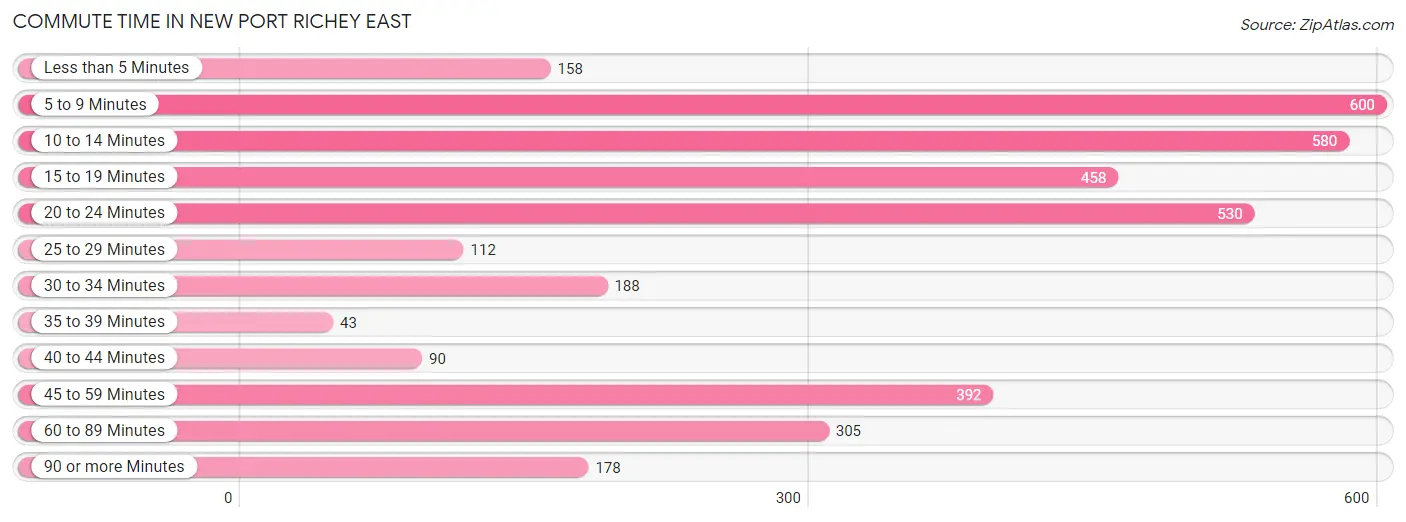
| Commute Time | # Commuters | % Commuters |
| Less than 5 Minutes | 158 | 4.3% |
| 5 to 9 Minutes | 600 | 16.5% |
| 10 to 14 Minutes | 580 | 16.0% |
| 15 to 19 Minutes | 458 | 12.6% |
| 20 to 24 Minutes | 530 | 14.6% |
| 25 to 29 Minutes | 112 | 3.1% |
| 30 to 34 Minutes | 188 | 5.2% |
| 35 to 39 Minutes | 43 | 1.2% |
| 40 to 44 Minutes | 90 | 2.5% |
| 45 to 59 Minutes | 392 | 10.8% |
| 60 to 89 Minutes | 305 | 8.4% |
| 90 or more Minutes | 178 | 4.9% |
Commute Time by Sex in New Port Richey East
The most common commute times in New Port Richey East are 20 to 24 minutes (398 commuters, 19.6%) for males and 5 to 9 minutes (339 commuters, 21.2%) for females.
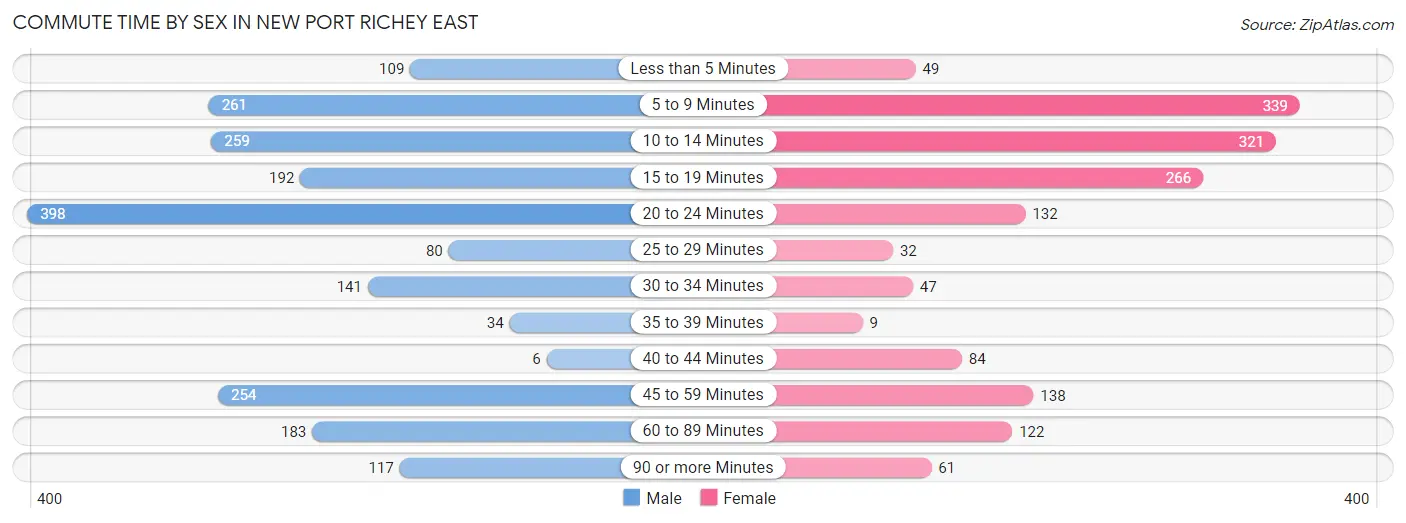
| Commute Time | Male | Female |
| Less than 5 Minutes | 109 (5.4%) | 49 (3.1%) |
| 5 to 9 Minutes | 261 (12.8%) | 339 (21.2%) |
| 10 to 14 Minutes | 259 (12.7%) | 321 (20.1%) |
| 15 to 19 Minutes | 192 (9.4%) | 266 (16.6%) |
| 20 to 24 Minutes | 398 (19.6%) | 132 (8.3%) |
| 25 to 29 Minutes | 80 (3.9%) | 32 (2.0%) |
| 30 to 34 Minutes | 141 (6.9%) | 47 (2.9%) |
| 35 to 39 Minutes | 34 (1.7%) | 9 (0.6%) |
| 40 to 44 Minutes | 6 (0.3%) | 84 (5.2%) |
| 45 to 59 Minutes | 254 (12.5%) | 138 (8.6%) |
| 60 to 89 Minutes | 183 (9.0%) | 122 (7.6%) |
| 90 or more Minutes | 117 (5.8%) | 61 (3.8%) |
Time of Departure to Work by Sex in New Port Richey East
The most frequent times of departure to work in New Port Richey East are 7:00 AM to 7:29 AM (366, 18.0%) for males and 6:30 AM to 6:59 AM (224, 14.0%) for females.
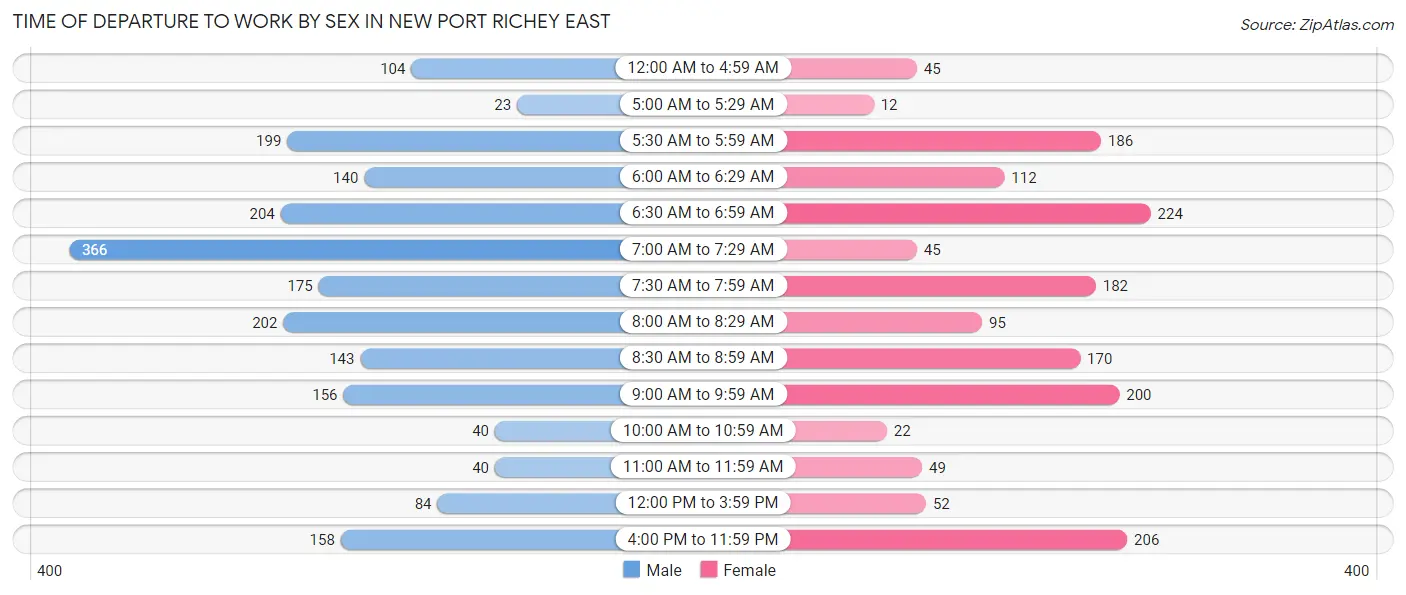
| Time of Departure | Male | Female |
| 12:00 AM to 4:59 AM | 104 (5.1%) | 45 (2.8%) |
| 5:00 AM to 5:29 AM | 23 (1.1%) | 12 (0.7%) |
| 5:30 AM to 5:59 AM | 199 (9.8%) | 186 (11.6%) |
| 6:00 AM to 6:29 AM | 140 (6.9%) | 112 (7.0%) |
| 6:30 AM to 6:59 AM | 204 (10.0%) | 224 (14.0%) |
| 7:00 AM to 7:29 AM | 366 (18.0%) | 45 (2.8%) |
| 7:30 AM to 7:59 AM | 175 (8.6%) | 182 (11.4%) |
| 8:00 AM to 8:29 AM | 202 (9.9%) | 95 (5.9%) |
| 8:30 AM to 8:59 AM | 143 (7.0%) | 170 (10.6%) |
| 9:00 AM to 9:59 AM | 156 (7.7%) | 200 (12.5%) |
| 10:00 AM to 10:59 AM | 40 (2.0%) | 22 (1.4%) |
| 11:00 AM to 11:59 AM | 40 (2.0%) | 49 (3.1%) |
| 12:00 PM to 3:59 PM | 84 (4.1%) | 52 (3.3%) |
| 4:00 PM to 11:59 PM | 158 (7.8%) | 206 (12.9%) |
| Total | 2,034 (100.0%) | 1,600 (100.0%) |
Housing Occupancy in New Port Richey East
Occupancy by Ownership in New Port Richey East
Of the total 5,344 dwellings in New Port Richey East, owner-occupied units account for 3,043 (56.9%), while renter-occupied units make up 2,301 (43.1%).
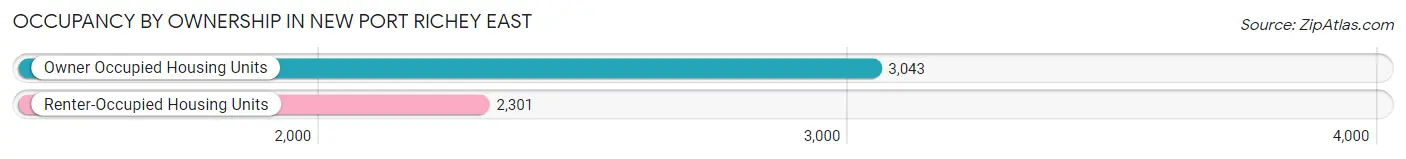
| Occupancy | # Housing Units | % Housing Units |
| Owner Occupied Housing Units | 3,043 | 56.9% |
| Renter-Occupied Housing Units | 2,301 | 43.1% |
| Total Occupied Housing Units | 5,344 | 100.0% |
Occupancy by Household Size in New Port Richey East
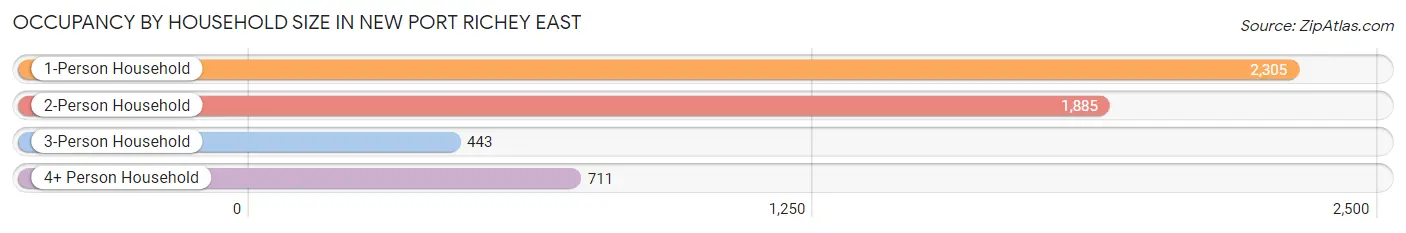
| Household Size | # Housing Units | % Housing Units |
| 1-Person Household | 2,305 | 43.1% |
| 2-Person Household | 1,885 | 35.3% |
| 3-Person Household | 443 | 8.3% |
| 4+ Person Household | 711 | 13.3% |
| Total Housing Units | 5,344 | 100.0% |
Occupancy by Ownership by Household Size in New Port Richey East
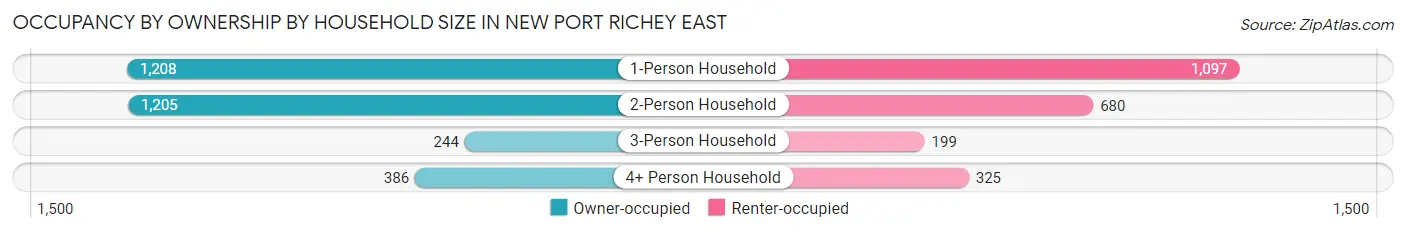
| Household Size | Owner-occupied | Renter-occupied |
| 1-Person Household | 1,208 (52.4%) | 1,097 (47.6%) |
| 2-Person Household | 1,205 (63.9%) | 680 (36.1%) |
| 3-Person Household | 244 (55.1%) | 199 (44.9%) |
| 4+ Person Household | 386 (54.3%) | 325 (45.7%) |
| Total Housing Units | 3,043 (56.9%) | 2,301 (43.1%) |
Occupancy by Educational Attainment in New Port Richey East
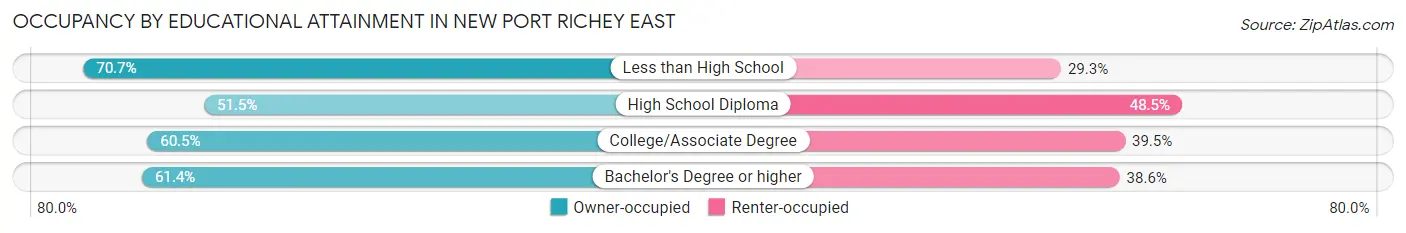
| Household Size | Owner-occupied | Renter-occupied |
| Less than High School | 287 (70.7%) | 119 (29.3%) |
| High School Diploma | 1,366 (51.5%) | 1,285 (48.5%) |
| College/Associate Degree | 980 (60.5%) | 639 (39.5%) |
| Bachelor's Degree or higher | 410 (61.4%) | 258 (38.6%) |
Occupancy by Age of Householder in New Port Richey East
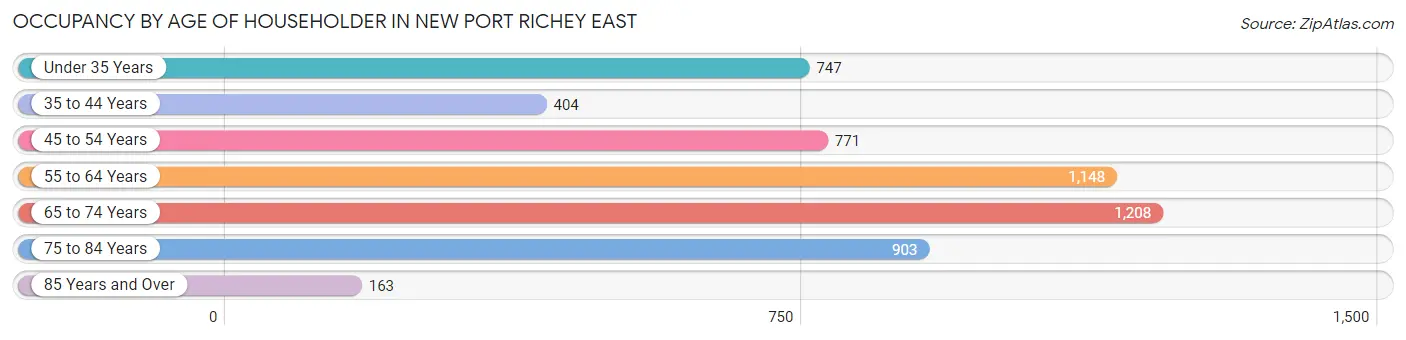
| Age Bracket | # Households | % Households |
| Under 35 Years | 747 | 14.0% |
| 35 to 44 Years | 404 | 7.6% |
| 45 to 54 Years | 771 | 14.4% |
| 55 to 64 Years | 1,148 | 21.5% |
| 65 to 74 Years | 1,208 | 22.6% |
| 75 to 84 Years | 903 | 16.9% |
| 85 Years and Over | 163 | 3.0% |
| Total | 5,344 | 100.0% |
Housing Finances in New Port Richey East
Median Income by Occupancy in New Port Richey East
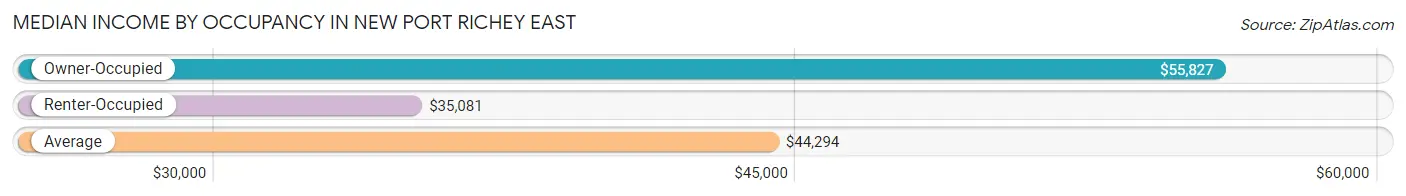
| Occupancy Type | # Households | Median Income |
| Owner-Occupied | 3,043 (56.9%) | $55,827 |
| Renter-Occupied | 2,301 (43.1%) | $35,081 |
| Average | 5,344 (100.0%) | $44,294 |
Occupancy by Householder Income Bracket in New Port Richey East
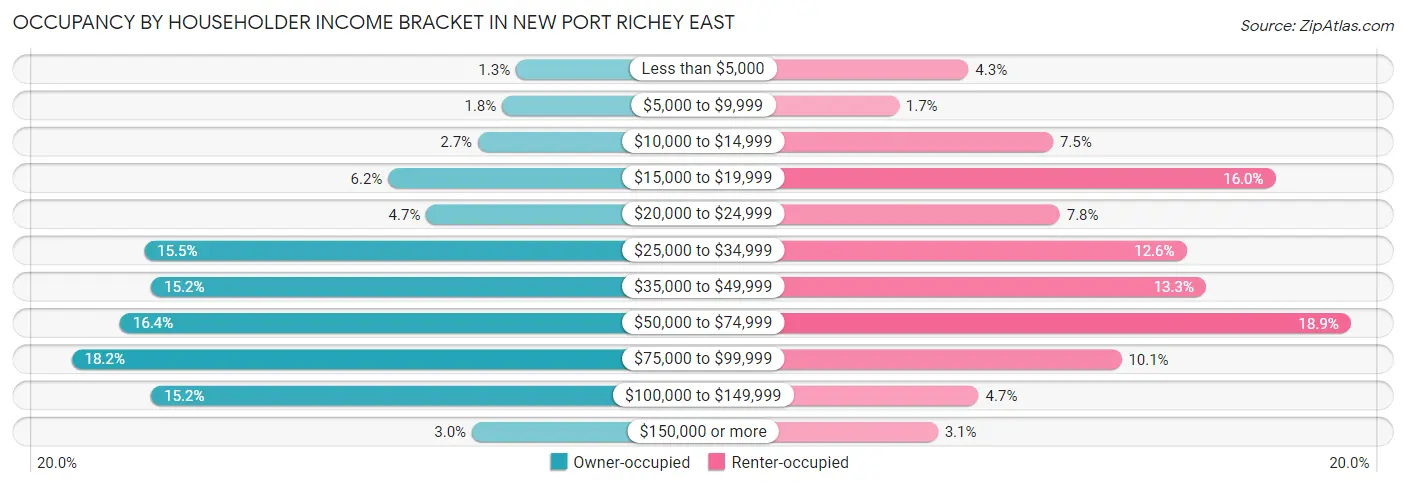
| Income Bracket | Owner-occupied | Renter-occupied |
| Less than $5,000 | 39 (1.3%) | 99 (4.3%) |
| $5,000 to $9,999 | 55 (1.8%) | 38 (1.7%) |
| $10,000 to $14,999 | 83 (2.7%) | 173 (7.5%) |
| $15,000 to $19,999 | 187 (6.1%) | 368 (16.0%) |
| $20,000 to $24,999 | 143 (4.7%) | 179 (7.8%) |
| $25,000 to $34,999 | 470 (15.4%) | 290 (12.6%) |
| $35,000 to $49,999 | 462 (15.2%) | 307 (13.3%) |
| $50,000 to $74,999 | 498 (16.4%) | 434 (18.9%) |
| $75,000 to $99,999 | 554 (18.2%) | 233 (10.1%) |
| $100,000 to $149,999 | 462 (15.2%) | 108 (4.7%) |
| $150,000 or more | 90 (3.0%) | 72 (3.1%) |
| Total | 3,043 (100.0%) | 2,301 (100.0%) |
Monthly Housing Cost Tiers in New Port Richey East
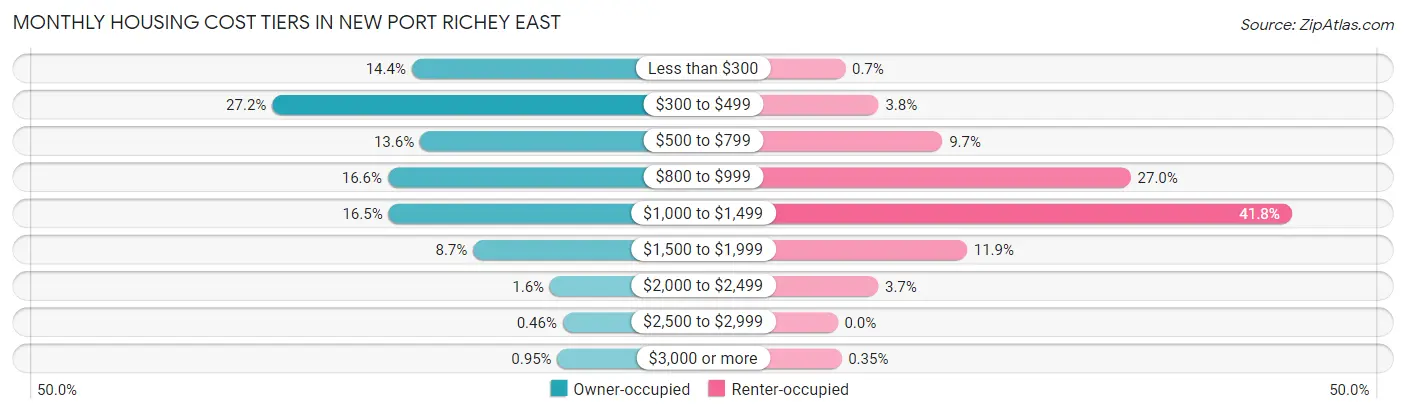
| Monthly Cost | Owner-occupied | Renter-occupied |
| Less than $300 | 437 (14.4%) | 16 (0.7%) |
| $300 to $499 | 828 (27.2%) | 87 (3.8%) |
| $500 to $799 | 414 (13.6%) | 222 (9.7%) |
| $800 to $999 | 504 (16.6%) | 621 (27.0%) |
| $1,000 to $1,499 | 502 (16.5%) | 962 (41.8%) |
| $1,500 to $1,999 | 265 (8.7%) | 274 (11.9%) |
| $2,000 to $2,499 | 50 (1.6%) | 86 (3.7%) |
| $2,500 to $2,999 | 14 (0.5%) | 0 (0.0%) |
| $3,000 or more | 29 (0.9%) | 8 (0.4%) |
| Total | 3,043 (100.0%) | 2,301 (100.0%) |
Physical Housing Characteristics in New Port Richey East
Housing Structures in New Port Richey East
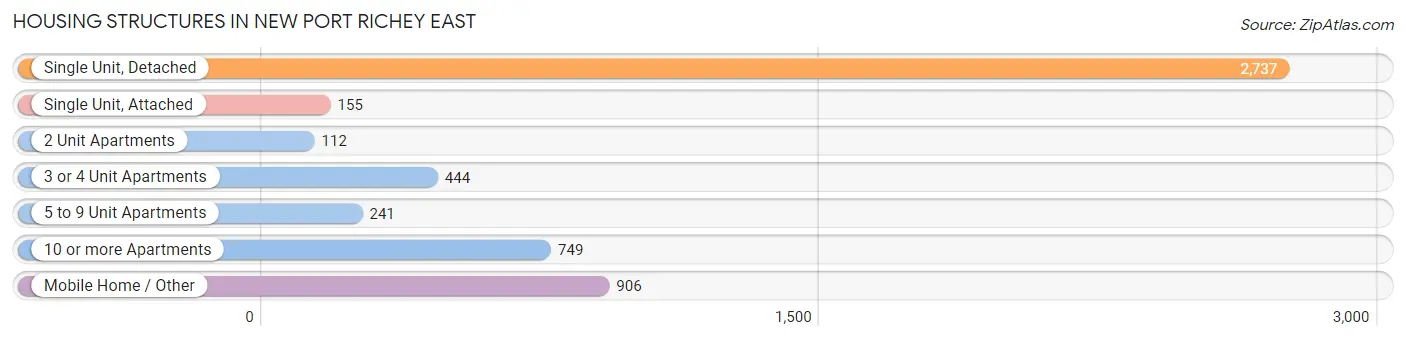
| Structure Type | # Housing Units | % Housing Units |
| Single Unit, Detached | 2,737 | 51.2% |
| Single Unit, Attached | 155 | 2.9% |
| 2 Unit Apartments | 112 | 2.1% |
| 3 or 4 Unit Apartments | 444 | 8.3% |
| 5 to 9 Unit Apartments | 241 | 4.5% |
| 10 or more Apartments | 749 | 14.0% |
| Mobile Home / Other | 906 | 17.0% |
| Total | 5,344 | 100.0% |
Housing Structures by Occupancy in New Port Richey East
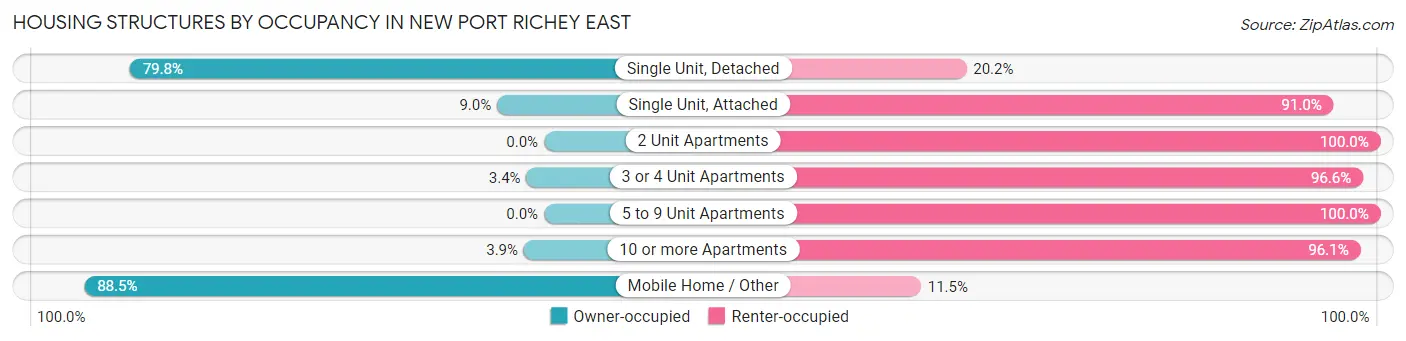
| Structure Type | Owner-occupied | Renter-occupied |
| Single Unit, Detached | 2,183 (79.8%) | 554 (20.2%) |
| Single Unit, Attached | 14 (9.0%) | 141 (91.0%) |
| 2 Unit Apartments | 0 (0.0%) | 112 (100.0%) |
| 3 or 4 Unit Apartments | 15 (3.4%) | 429 (96.6%) |
| 5 to 9 Unit Apartments | 0 (0.0%) | 241 (100.0%) |
| 10 or more Apartments | 29 (3.9%) | 720 (96.1%) |
| Mobile Home / Other | 802 (88.5%) | 104 (11.5%) |
| Total | 3,043 (56.9%) | 2,301 (43.1%) |
Housing Structures by Number of Rooms in New Port Richey East
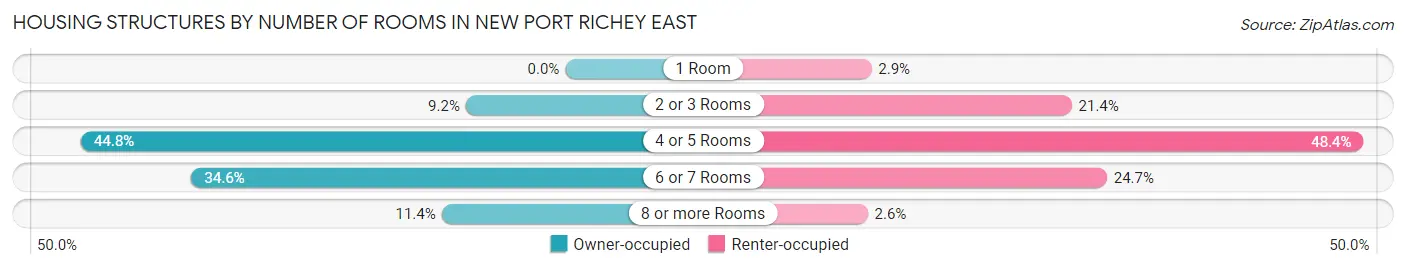
| Number of Rooms | Owner-occupied | Renter-occupied |
| 1 Room | 0 (0.0%) | 67 (2.9%) |
| 2 or 3 Rooms | 280 (9.2%) | 493 (21.4%) |
| 4 or 5 Rooms | 1,363 (44.8%) | 1,114 (48.4%) |
| 6 or 7 Rooms | 1,052 (34.6%) | 568 (24.7%) |
| 8 or more Rooms | 348 (11.4%) | 59 (2.6%) |
| Total | 3,043 (100.0%) | 2,301 (100.0%) |
Housing Structure by Heating Type in New Port Richey East
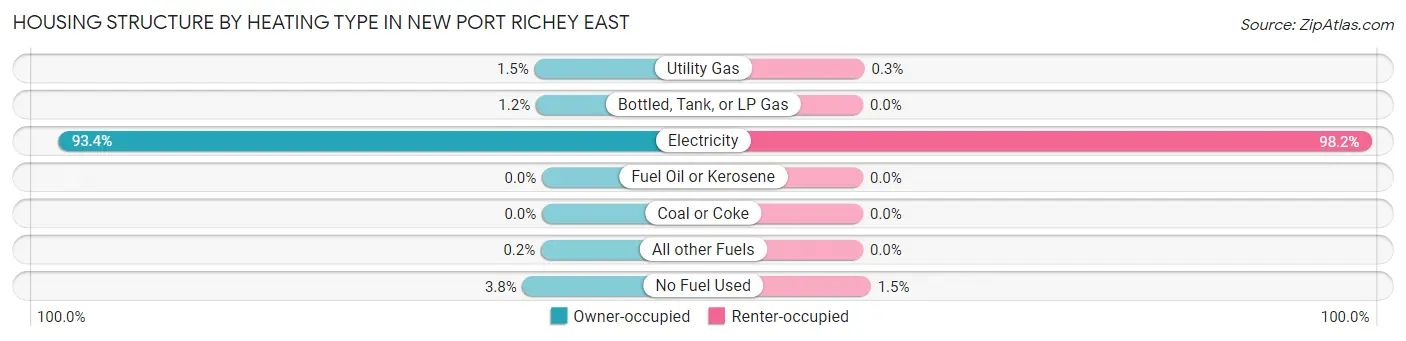
| Heating Type | Owner-occupied | Renter-occupied |
| Utility Gas | 44 (1.5%) | 7 (0.3%) |
| Bottled, Tank, or LP Gas | 36 (1.2%) | 0 (0.0%) |
| Electricity | 2,842 (93.4%) | 2,260 (98.2%) |
| Fuel Oil or Kerosene | 0 (0.0%) | 0 (0.0%) |
| Coal or Coke | 0 (0.0%) | 0 (0.0%) |
| All other Fuels | 6 (0.2%) | 0 (0.0%) |
| No Fuel Used | 115 (3.8%) | 34 (1.5%) |
| Total | 3,043 (100.0%) | 2,301 (100.0%) |
Household Vehicle Usage in New Port Richey East
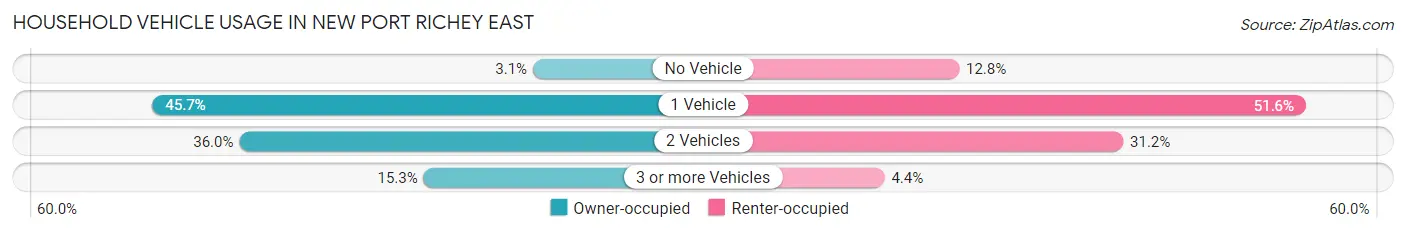
| Vehicles per Household | Owner-occupied | Renter-occupied |
| No Vehicle | 93 (3.1%) | 294 (12.8%) |
| 1 Vehicle | 1,390 (45.7%) | 1,188 (51.6%) |
| 2 Vehicles | 1,094 (35.9%) | 717 (31.2%) |
| 3 or more Vehicles | 466 (15.3%) | 102 (4.4%) |
| Total | 3,043 (100.0%) | 2,301 (100.0%) |
Real Estate & Mortgages in New Port Richey East
Real Estate and Mortgage Overview in New Port Richey East
| Characteristic | Without Mortgage | With Mortgage |
| Housing Units | 1,918 | 1,125 |
| Median Property Value | $131,800 | $195,700 |
| Median Household Income | $41,920 | $40 |
| Monthly Housing Costs | $458 | $12 |
| Real Estate Taxes | $1,097 | $118 |
Property Value by Mortgage Status in New Port Richey East
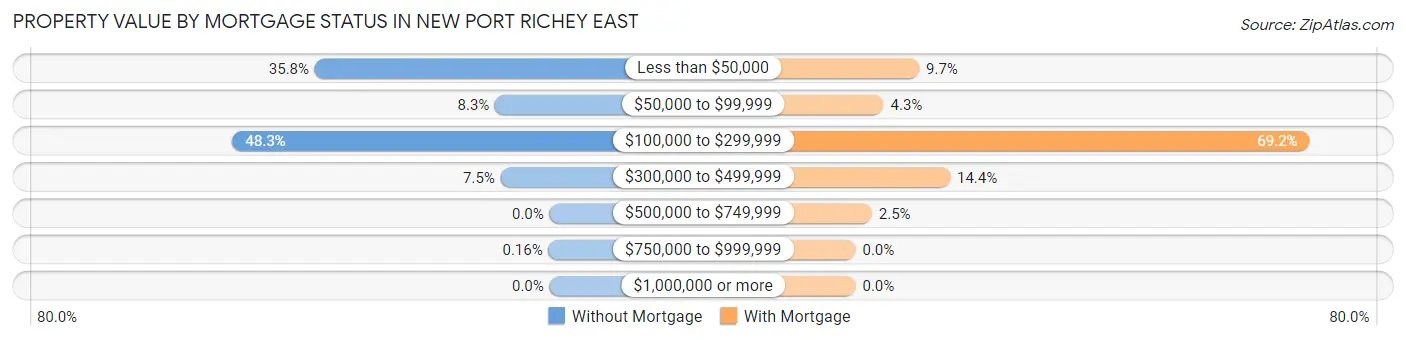
| Property Value | Without Mortgage | With Mortgage |
| Less than $50,000 | 686 (35.8%) | 109 (9.7%) |
| $50,000 to $99,999 | 159 (8.3%) | 48 (4.3%) |
| $100,000 to $299,999 | 927 (48.3%) | 778 (69.2%) |
| $300,000 to $499,999 | 143 (7.5%) | 162 (14.4%) |
| $500,000 to $749,999 | 0 (0.0%) | 28 (2.5%) |
| $750,000 to $999,999 | 3 (0.2%) | 0 (0.0%) |
| $1,000,000 or more | 0 (0.0%) | 0 (0.0%) |
| Total | 1,918 (100.0%) | 1,125 (100.0%) |
Household Income by Mortgage Status in New Port Richey East
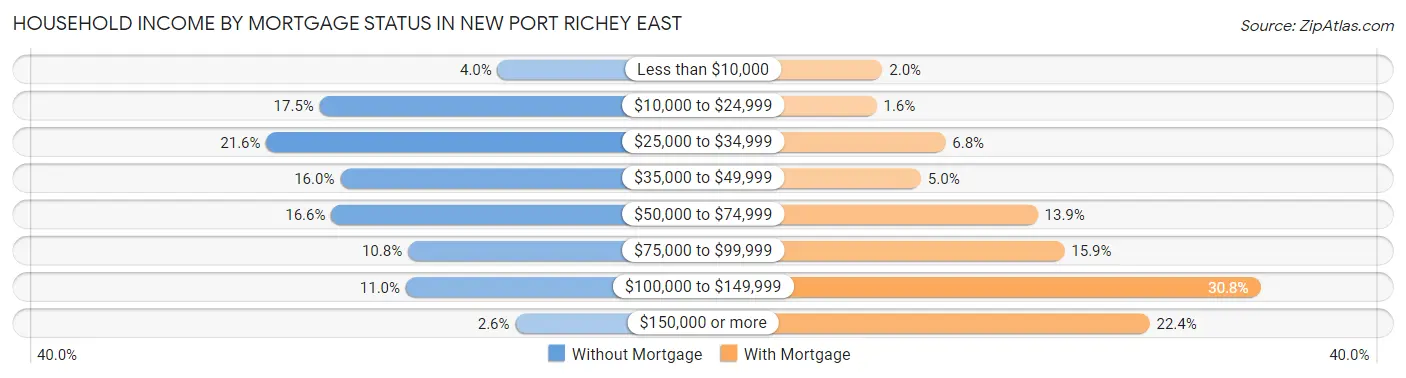
| Household Income | Without Mortgage | With Mortgage |
| Less than $10,000 | 76 (4.0%) | 23 (2.0%) |
| $10,000 to $24,999 | 336 (17.5%) | 18 (1.6%) |
| $25,000 to $34,999 | 414 (21.6%) | 77 (6.8%) |
| $35,000 to $49,999 | 306 (16.0%) | 56 (5.0%) |
| $50,000 to $74,999 | 319 (16.6%) | 156 (13.9%) |
| $75,000 to $99,999 | 207 (10.8%) | 179 (15.9%) |
| $100,000 to $149,999 | 210 (11.0%) | 347 (30.8%) |
| $150,000 or more | 50 (2.6%) | 252 (22.4%) |
| Total | 1,918 (100.0%) | 1,125 (100.0%) |
Property Value to Household Income Ratio in New Port Richey East
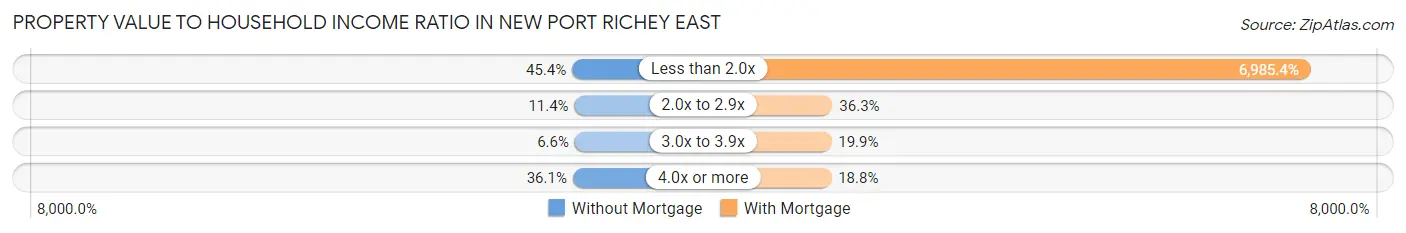
| Value-to-Income Ratio | Without Mortgage | With Mortgage |
| Less than 2.0x | 871 (45.4%) | 78,586 (6,985.4%) |
| 2.0x to 2.9x | 219 (11.4%) | 408 (36.3%) |
| 3.0x to 3.9x | 127 (6.6%) | 224 (19.9%) |
| 4.0x or more | 692 (36.1%) | 211 (18.8%) |
| Total | 1,918 (100.0%) | 1,125 (100.0%) |
Real Estate Taxes by Mortgage Status in New Port Richey East
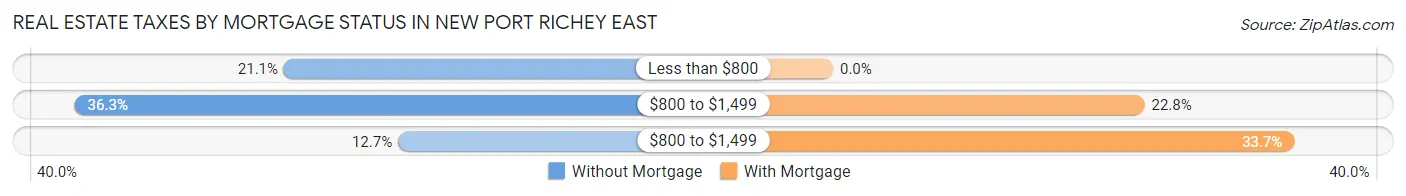
| Property Taxes | Without Mortgage | With Mortgage |
| Less than $800 | 404 (21.1%) | 0 (0.0%) |
| $800 to $1,499 | 697 (36.3%) | 256 (22.8%) |
| $800 to $1,499 | 244 (12.7%) | 379 (33.7%) |
| Total | 1,918 (100.0%) | 1,125 (100.0%) |
Health & Disability in New Port Richey East
Health Insurance Coverage by Age in New Port Richey East
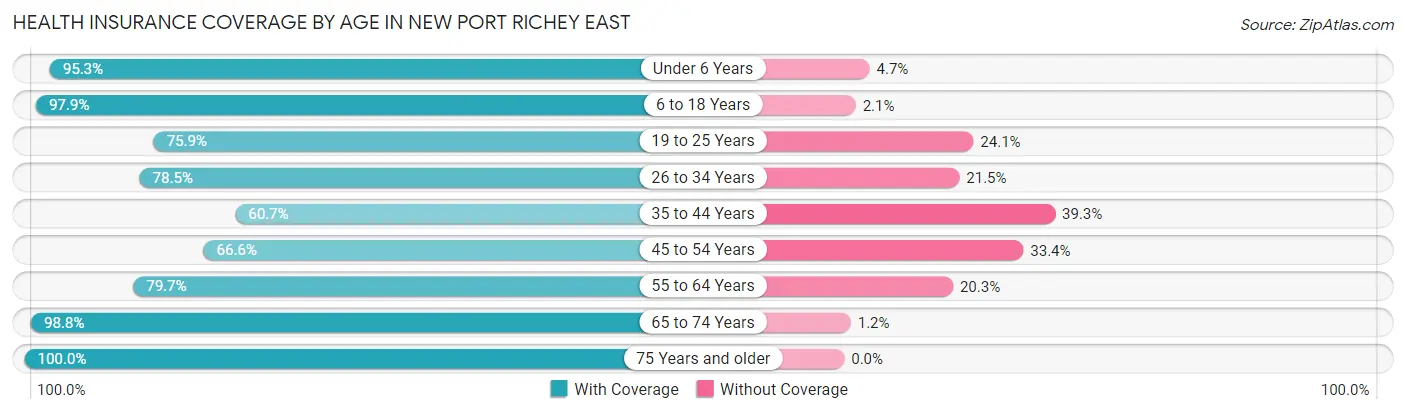
| Age Bracket | With Coverage | Without Coverage |
| Under 6 Years | 707 (95.3%) | 35 (4.7%) |
| 6 to 18 Years | 918 (97.9%) | 20 (2.1%) |
| 19 to 25 Years | 681 (75.9%) | 216 (24.1%) |
| 26 to 34 Years | 776 (78.5%) | 212 (21.5%) |
| 35 to 44 Years | 675 (60.7%) | 437 (39.3%) |
| 45 to 54 Years | 852 (66.6%) | 427 (33.4%) |
| 55 to 64 Years | 1,396 (79.7%) | 355 (20.3%) |
| 65 to 74 Years | 1,871 (98.8%) | 23 (1.2%) |
| 75 Years and older | 1,510 (100.0%) | 0 (0.0%) |
| Total | 9,386 (84.5%) | 1,725 (15.5%) |
Health Insurance Coverage by Citizenship Status in New Port Richey East
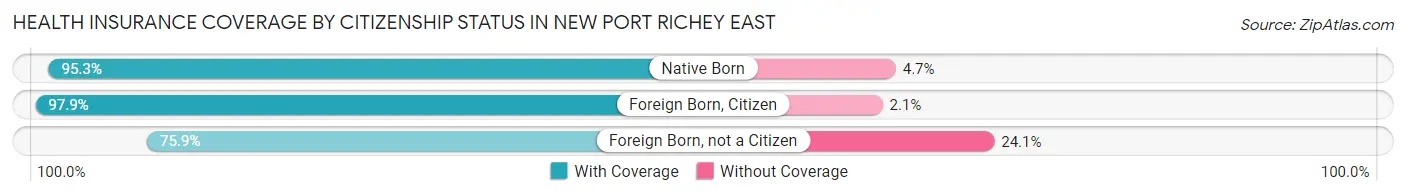
| Citizenship Status | With Coverage | Without Coverage |
| Native Born | 707 (95.3%) | 35 (4.7%) |
| Foreign Born, Citizen | 918 (97.9%) | 20 (2.1%) |
| Foreign Born, not a Citizen | 681 (75.9%) | 216 (24.1%) |
Health Insurance Coverage by Household Income in New Port Richey East
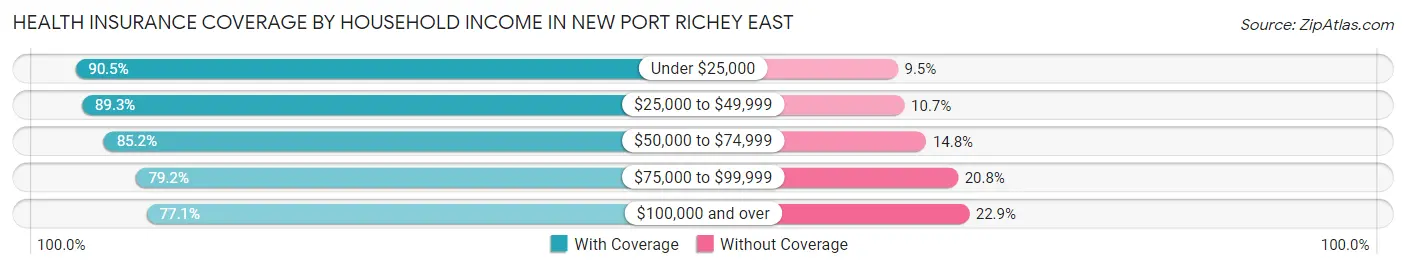
| Household Income | With Coverage | Without Coverage |
| Under $25,000 | 1,989 (90.5%) | 209 (9.5%) |
| $25,000 to $49,999 | 2,360 (89.3%) | 284 (10.7%) |
| $50,000 to $74,999 | 1,642 (85.2%) | 286 (14.8%) |
| $75,000 to $99,999 | 1,647 (79.2%) | 432 (20.8%) |
| $100,000 and over | 1,697 (77.1%) | 503 (22.9%) |
Public vs Private Health Insurance Coverage by Age in New Port Richey East
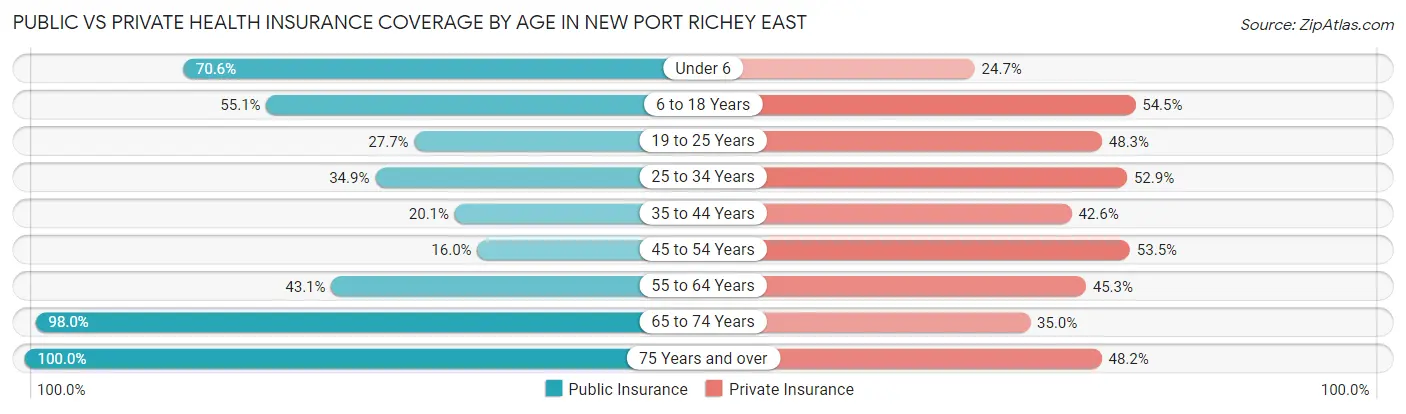
| Age Bracket | Public Insurance | Private Insurance |
| Under 6 | 524 (70.6%) | 183 (24.7%) |
| 6 to 18 Years | 517 (55.1%) | 511 (54.5%) |
| 19 to 25 Years | 248 (27.7%) | 433 (48.3%) |
| 25 to 34 Years | 345 (34.9%) | 523 (52.9%) |
| 35 to 44 Years | 224 (20.1%) | 474 (42.6%) |
| 45 to 54 Years | 204 (16.0%) | 684 (53.5%) |
| 55 to 64 Years | 754 (43.1%) | 793 (45.3%) |
| 65 to 74 Years | 1,856 (98.0%) | 662 (34.9%) |
| 75 Years and over | 1,510 (100.0%) | 728 (48.2%) |
| Total | 6,182 (55.6%) | 4,991 (44.9%) |
Disability Status by Sex by Age in New Port Richey East
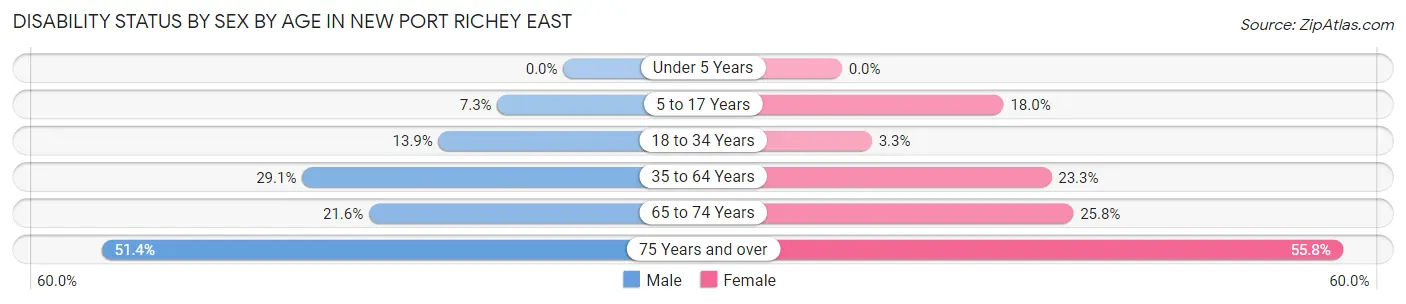
| Age Bracket | Male | Female |
| Under 5 Years | 0 (0.0%) | 0 (0.0%) |
| 5 to 17 Years | 35 (7.3%) | 85 (18.0%) |
| 18 to 34 Years | 141 (13.9%) | 33 (3.3%) |
| 35 to 64 Years | 681 (29.1%) | 420 (23.3%) |
| 65 to 74 Years | 179 (21.6%) | 275 (25.8%) |
| 75 Years and over | 345 (51.4%) | 468 (55.8%) |
Disability Class by Sex by Age in New Port Richey East
Disability Class: Hearing Difficulty
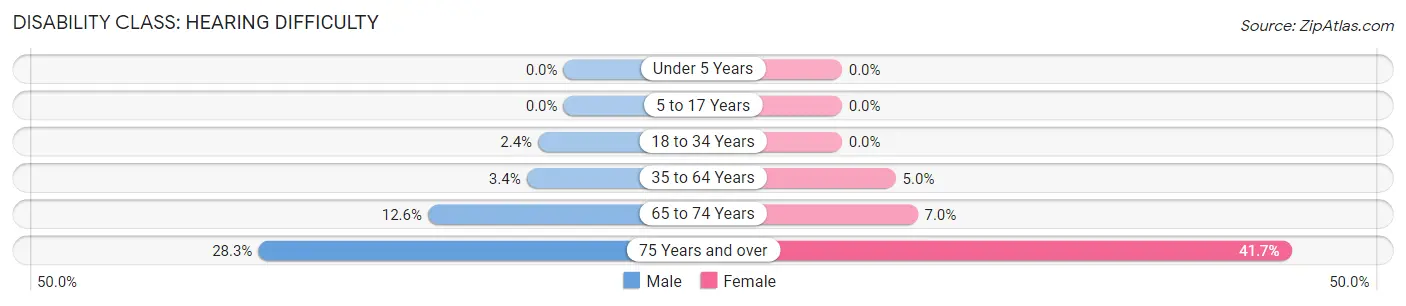
| Age Bracket | Male | Female |
| Under 5 Years | 0 (0.0%) | 0 (0.0%) |
| 5 to 17 Years | 0 (0.0%) | 0 (0.0%) |
| 18 to 34 Years | 24 (2.4%) | 0 (0.0%) |
| 35 to 64 Years | 80 (3.4%) | 90 (5.0%) |
| 65 to 74 Years | 104 (12.6%) | 75 (7.0%) |
| 75 Years and over | 190 (28.3%) | 350 (41.7%) |
Disability Class: Vision Difficulty
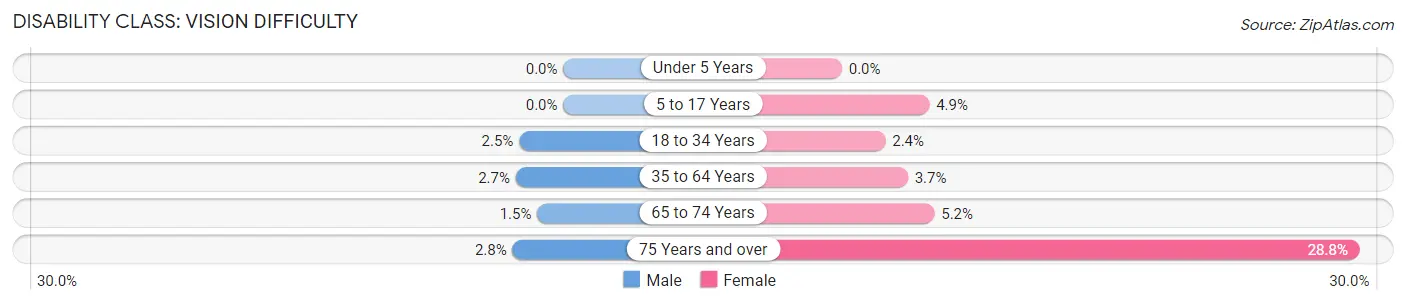
| Age Bracket | Male | Female |
| Under 5 Years | 0 (0.0%) | 0 (0.0%) |
| 5 to 17 Years | 0 (0.0%) | 23 (4.9%) |
| 18 to 34 Years | 25 (2.5%) | 24 (2.4%) |
| 35 to 64 Years | 62 (2.6%) | 66 (3.7%) |
| 65 to 74 Years | 12 (1.5%) | 55 (5.1%) |
| 75 Years and over | 19 (2.8%) | 242 (28.8%) |
Disability Class: Cognitive Difficulty
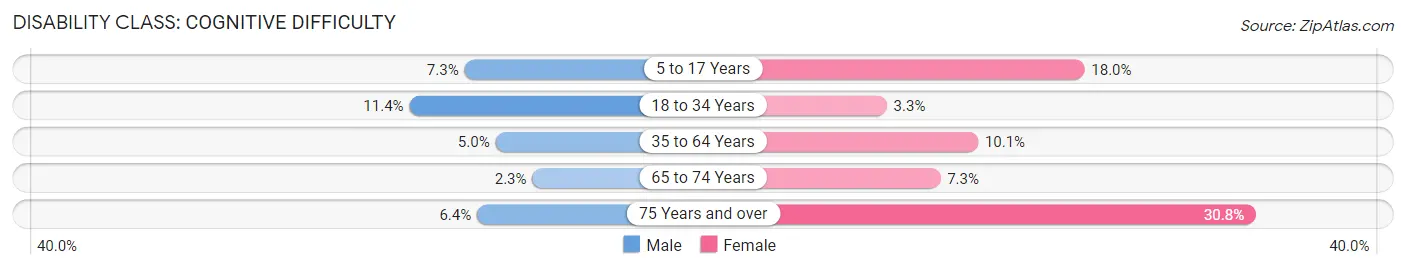
| Age Bracket | Male | Female |
| 5 to 17 Years | 35 (7.3%) | 85 (18.0%) |
| 18 to 34 Years | 116 (11.4%) | 33 (3.3%) |
| 35 to 64 Years | 118 (5.0%) | 182 (10.1%) |
| 65 to 74 Years | 19 (2.3%) | 78 (7.3%) |
| 75 Years and over | 43 (6.4%) | 258 (30.7%) |
Disability Class: Ambulatory Difficulty
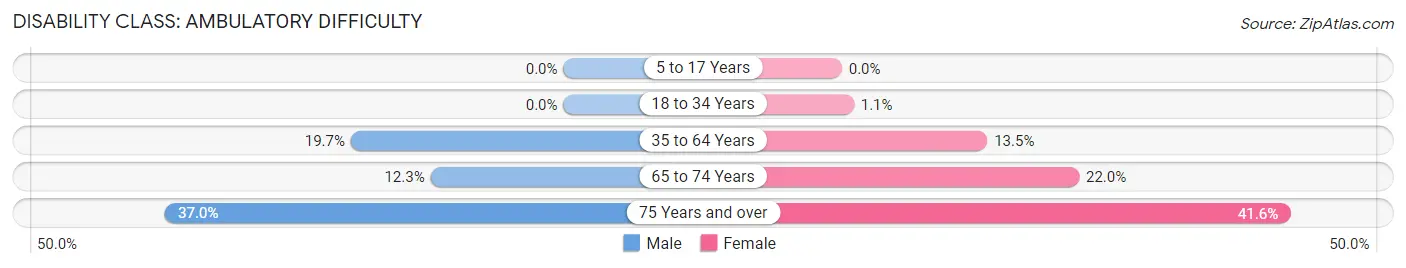
| Age Bracket | Male | Female |
| 5 to 17 Years | 0 (0.0%) | 0 (0.0%) |
| 18 to 34 Years | 0 (0.0%) | 11 (1.1%) |
| 35 to 64 Years | 462 (19.7%) | 243 (13.5%) |
| 65 to 74 Years | 102 (12.3%) | 235 (22.0%) |
| 75 Years and over | 248 (37.0%) | 349 (41.6%) |
Disability Class: Self-Care Difficulty
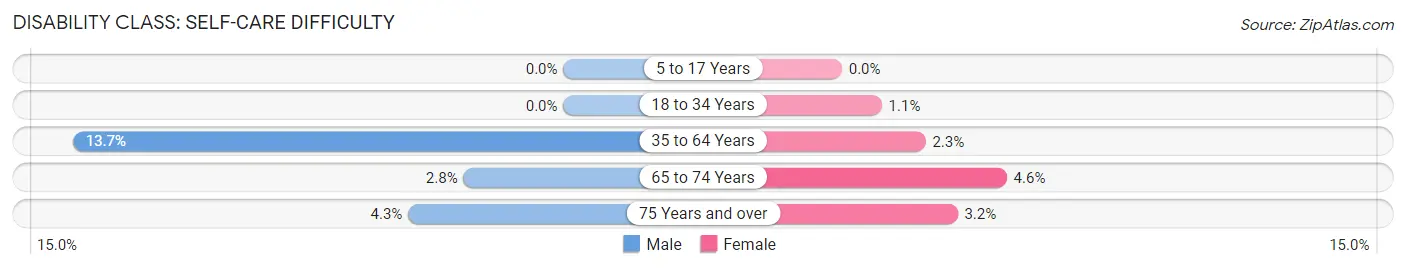
| Age Bracket | Male | Female |
| 5 to 17 Years | 0 (0.0%) | 0 (0.0%) |
| 18 to 34 Years | 0 (0.0%) | 11 (1.1%) |
| 35 to 64 Years | 320 (13.7%) | 42 (2.3%) |
| 65 to 74 Years | 23 (2.8%) | 49 (4.6%) |
| 75 Years and over | 29 (4.3%) | 27 (3.2%) |
Technology Access in New Port Richey East
Computing Device Access in New Port Richey East
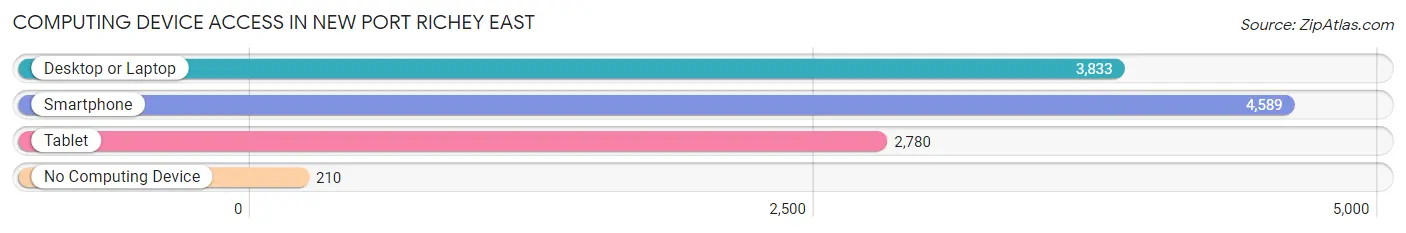
| Device Type | # Households | % Households |
| Desktop or Laptop | 3,833 | 71.7% |
| Smartphone | 4,589 | 85.9% |
| Tablet | 2,780 | 52.0% |
| No Computing Device | 210 | 3.9% |
| Total | 5,344 | 100.0% |
Internet Access in New Port Richey East
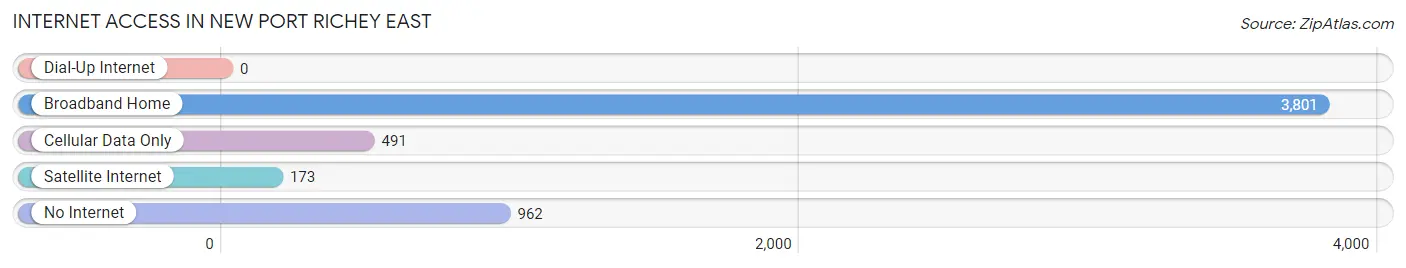
| Internet Type | # Households | % Households |
| Dial-Up Internet | 0 | 0.0% |
| Broadband Home | 3,801 | 71.1% |
| Cellular Data Only | 491 | 9.2% |
| Satellite Internet | 173 | 3.2% |
| No Internet | 962 | 18.0% |
| Total | 5,344 | 100.0% |
New Port Richey East Summary
New Port Richey East is a census-designated place (CDP) located in Pasco County, Florida, United States. The population was 8,945 at the 2010 census. It is part of the Tampa-St. Petersburg-Clearwater Metropolitan Statistical Area.
History
New Port Richey East was originally part of the larger city of New Port Richey, which was founded in the early 1900s. The city was named after the nearby Pithlachascotee River, which was originally called the New Port Richey River. The city was incorporated in 1924 and was the first incorporated city in Pasco County.
In the 1950s, the city of New Port Richey began to experience rapid growth, and the city was divided into two parts: New Port Richey East and New Port Richey West. The two parts were separated by the Pithlachascotee River.
In the late 1970s, the city of New Port Richey East was officially incorporated as a separate municipality. The city was officially incorporated on April 1, 1979.
Geography
New Port Richey East is located at 28 17 25 North 82 41 17 West 28 290278 82 688056
According to the United States Census Bureau, the CDP has a total area of 4.2 square miles (10.8 km2), of which 4.1 square miles (10.6 km2) is land and 0.1 square miles (0.2 km2) (2.37%) is water.
Economy
New Port Richey East is a residential community with a small commercial district. The city is home to several small businesses, including restaurants, retail stores, and professional services.
The city is also home to several large employers, including the Pasco County School District, the Pasco County Sheriff's Office, and the Pasco County Fire Rescue.
Demographics
As of the census of 2010, there were 8,945 people, 3,845 households, and 2,541 families residing in the CDP. The population density was 2,179.3 people per square mile (841.3/km2). There were 4,093 housing units at an average density of 998.3/sq mi (385.3/km2). The racial makeup of the CDP was 87.2% White, 5.2% African American, 0.4% Native American, 1.7% Asian, 0.1% Pacific Islander, 3.2% from other races, and 2.2% from two or more races. Hispanic or Latino of any race were 11.2% of the population.
There were 3,845 households, out of which 24.2% had children under the age of 18 living with them, 48.2% were married couples living together, 12.3% had a female householder with no husband present, and 34.7% were non-families. 28.2% of all households were made up of individuals, and 11.7% had someone living alone who was 65 years of age or older. The average household size was 2.32 and the average family size was 2.83.
In the CDP, the population was spread out, with 20.2% under the age of 18, 7.2% from 18 to 24, 25.2% from 25 to 44, 28.2% from 45 to 64, and 19.2% who were 65 years of age or older. The median age was 42 years. For every 100 females, there were 94.2 males. For every 100 females age 18 and over, there were 91.2 males.
The median income for a household in the CDP was $37,917, and the median income for a family was $45,917. Males had a median income of $35,917 versus $25,917 for females. The per capita income for the CDP was $20,917. About 8.2% of families and 10.2% of the population were below the poverty line, including 14.2% of those under age 18 and 6.2% of those age 65 or over.
Common Questions
What is Per Capita Income in New Port Richey East?
Per Capita income in New Port Richey East is $28,501.
What is the Median Family Income in New Port Richey East?
Median Family Income in New Port Richey East is $62,083.
What is the Median Household income in New Port Richey East?
Median Household Income in New Port Richey East is $44,294.
What is Income or Wage Gap in New Port Richey East?
Income or Wage Gap in New Port Richey East is 36.7%.
Women in New Port Richey East earn 63.3 cents for every dollar earned by a man.
What is Inequality or Gini Index in New Port Richey East?
Inequality or Gini Index in New Port Richey East is 0.41.
What is the Total Population of New Port Richey East?
Total Population of New Port Richey East is 11,170.
What is the Total Male Population of New Port Richey East?
Total Male Population of New Port Richey East is 5,652.
What is the Total Female Population of New Port Richey East?
Total Female Population of New Port Richey East is 5,518.
What is the Ratio of Males per 100 Females in New Port Richey East?
There are 102.43 Males per 100 Females in New Port Richey East.
What is the Ratio of Females per 100 Males in New Port Richey East?
There are 97.63 Females per 100 Males in New Port Richey East.
What is the Median Population Age in New Port Richey East?
Median Population Age in New Port Richey East is 52.5 Years.
What is the Average Family Size in New Port Richey East
Average Family Size in New Port Richey East is 2.9 People.
What is the Average Household Size in New Port Richey East
Average Household Size in New Port Richey East is 2.1 People.
How Large is the Labor Force in New Port Richey East?
There are 4,797 People in the Labor Forcein in New Port Richey East.
What is the Percentage of People in the Labor Force in New Port Richey East?
49.2% of People are in the Labor Force in New Port Richey East.
What is the Unemployment Rate in New Port Richey East?
Unemployment Rate in New Port Richey East is 13.0%.