Moon Lake, FL Map & Demographics
Moon Lake Map
Moon Lake Overview
$21,070
PER CAPITA INCOME
$53,578
AVG FAMILY INCOME
$34,205
AVG HOUSEHOLD INCOME
28.1%
WAGE / INCOME GAP [ % ]
71.9¢/ $1
WAGE / INCOME GAP [ $ ]
$10,238
FAMILY INCOME DEFICIT
0.50
INEQUALITY / GINI INDEX
4,214
TOTAL POPULATION
1,935
MALE POPULATION
2,279
FEMALE POPULATION
84.91
MALES / 100 FEMALES
117.78
FEMALES / 100 MALES
43.6
MEDIAN AGE
3.7
AVG FAMILY SIZE
2.6
AVG HOUSEHOLD SIZE
2,007
LABOR FORCE [ PEOPLE ]
56.5%
PERCENT IN LABOR FORCE
22.6%
UNEMPLOYMENT RATE
Income in Moon Lake
Income Overview in Moon Lake
Per Capita Income in Moon Lake is $21,070, while median incomes of families and households are $53,578 and $34,205 respectively.
| Characteristic | Number | Measure |
| Per Capita Income | 4,214 | $21,070 |
| Median Family Income | 872 | $53,578 |
| Mean Family Income | 872 | $68,230 |
| Median Household Income | 1,603 | $34,205 |
| Mean Household Income | 1,603 | $51,094 |
| Income Deficit | 872 | $10,238 |
| Wage / Income Gap (%) | 4,214 | 28.12% |
| Wage / Income Gap ($) | 4,214 | 71.88¢ per $1 |
| Gini / Inequality Index | 4,214 | 0.50 |
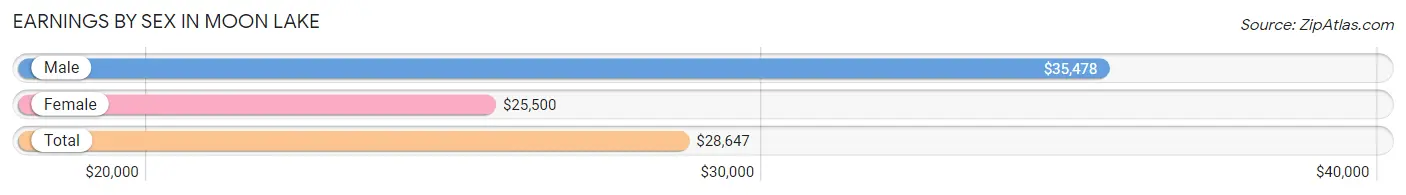
Earnings by Sex in Moon Lake
Average Earnings in Moon Lake are $28,647, $35,478 for men and $25,500 for women, a difference of 28.1%.
| Sex | Number | Average Earnings |
| Male | 864 (47.8%) | $35,478 |
| Female | 942 (52.2%) | $25,500 |
| Total | 1,806 (100.0%) | $28,647 |
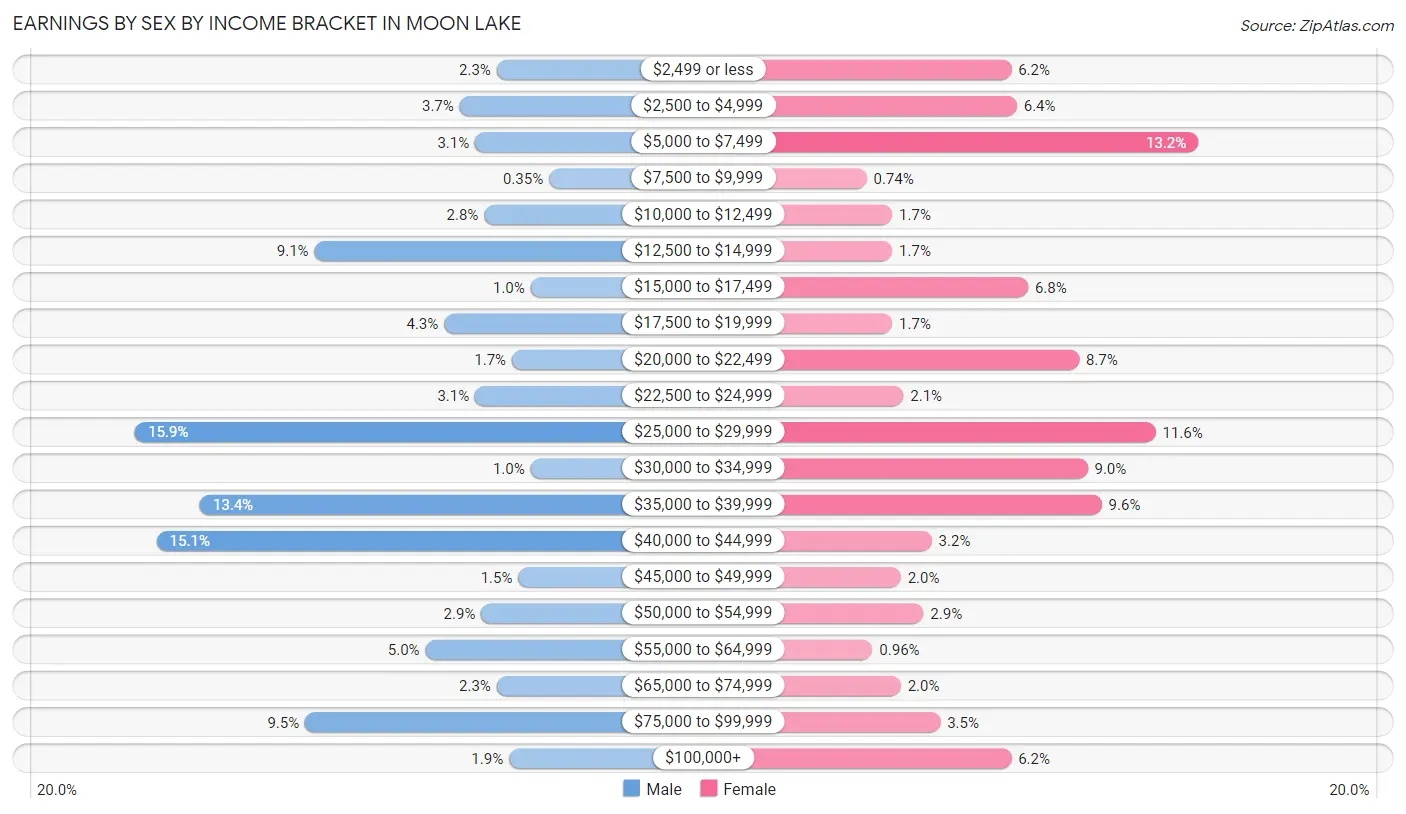
Earnings by Sex by Income Bracket in Moon Lake
The most common earnings brackets in Moon Lake are $25,000 to $29,999 for men (137 | 15.9%) and $5,000 to $7,499 for women (124 | 13.2%).
| Income | Male | Female |
| $2,499 or less | 20 (2.3%) | 58 (6.2%) |
| $2,500 to $4,999 | 32 (3.7%) | 60 (6.4%) |
| $5,000 to $7,499 | 27 (3.1%) | 124 (13.2%) |
| $7,500 to $9,999 | 3 (0.4%) | 7 (0.7%) |
| $10,000 to $12,499 | 24 (2.8%) | 16 (1.7%) |
| $12,500 to $14,999 | 79 (9.1%) | 16 (1.7%) |
| $15,000 to $17,499 | 9 (1.0%) | 64 (6.8%) |
| $17,500 to $19,999 | 37 (4.3%) | 16 (1.7%) |
| $20,000 to $22,499 | 15 (1.7%) | 82 (8.7%) |
| $22,500 to $24,999 | 27 (3.1%) | 20 (2.1%) |
| $25,000 to $29,999 | 137 (15.9%) | 109 (11.6%) |
| $30,000 to $34,999 | 9 (1.0%) | 85 (9.0%) |
| $35,000 to $39,999 | 116 (13.4%) | 90 (9.6%) |
| $40,000 to $44,999 | 130 (15.0%) | 30 (3.2%) |
| $45,000 to $49,999 | 13 (1.5%) | 19 (2.0%) |
| $50,000 to $54,999 | 25 (2.9%) | 27 (2.9%) |
| $55,000 to $64,999 | 43 (5.0%) | 9 (1.0%) |
| $65,000 to $74,999 | 20 (2.3%) | 19 (2.0%) |
| $75,000 to $99,999 | 82 (9.5%) | 33 (3.5%) |
| $100,000+ | 16 (1.8%) | 58 (6.2%) |
| Total | 864 (100.0%) | 942 (100.0%) |
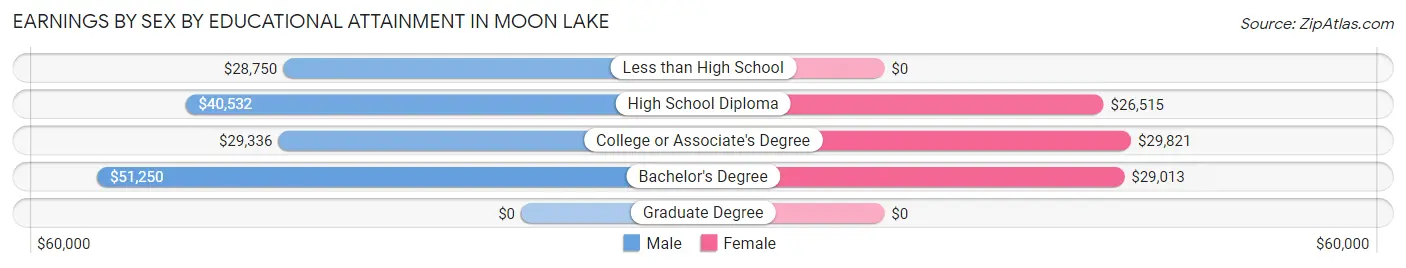
Earnings by Sex by Educational Attainment in Moon Lake
Average earnings in Moon Lake are $35,938 for men and $29,239 for women, a difference of 18.6%. Men with an educational attainment of bachelor's degree enjoy the highest average annual earnings of $51,250, while those with less than high school education earn the least with $28,750. Women with an educational attainment of college or associate's degree earn the most with the average annual earnings of $29,821, while those with high school diploma education have the smallest earnings of $26,515.
| Educational Attainment | Male Income | Female Income |
| Less than High School | $28,750 | $0 |
| High School Diploma | $40,532 | $26,515 |
| College or Associate's Degree | $29,336 | $29,821 |
| Bachelor's Degree | $51,250 | $29,013 |
| Graduate Degree | - | - |
| Total | $35,938 | $29,239 |
Family Income in Moon Lake
Family Income Brackets in Moon Lake
According to the Moon Lake family income data, there are 240 families falling into the $50,000 to $74,999 income range, which is the most common income bracket and makes up 27.5% of all families. Conversely, the $150,000 to $199,999 income bracket is the least frequent group with only 27 families (3.1%) belonging to this category.
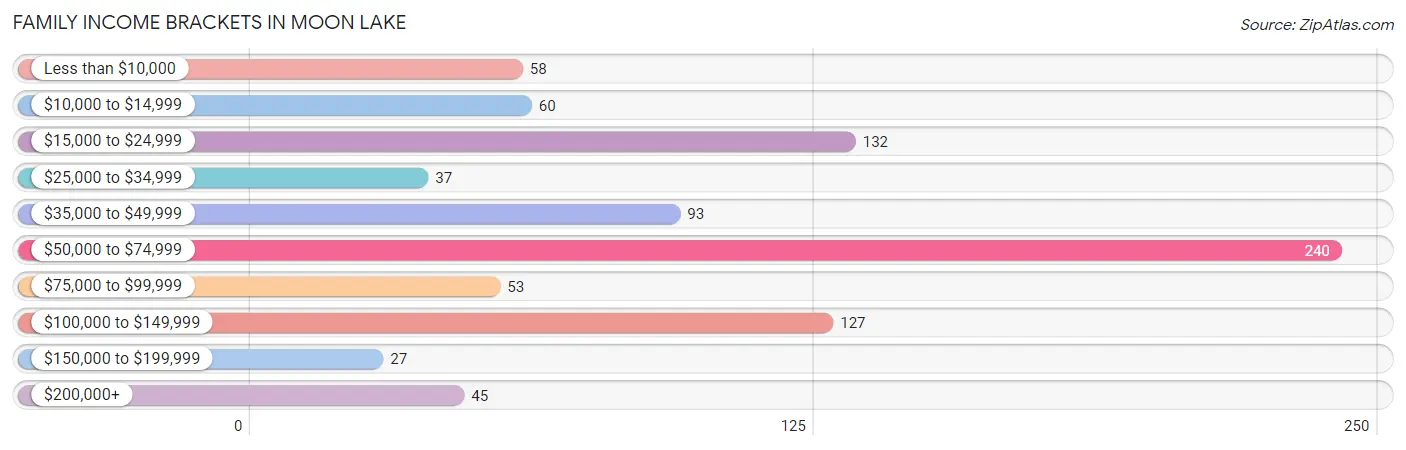
| Income Bracket | # Families | % Families |
| Less than $10,000 | 58 | 6.7% |
| $10,000 to $14,999 | 60 | 6.9% |
| $15,000 to $24,999 | 132 | 15.1% |
| $25,000 to $34,999 | 37 | 4.2% |
| $35,000 to $49,999 | 93 | 10.7% |
| $50,000 to $74,999 | 240 | 27.5% |
| $75,000 to $99,999 | 53 | 6.1% |
| $100,000 to $149,999 | 127 | 14.6% |
| $150,000 to $199,999 | 27 | 3.1% |
| $200,000+ | 45 | 5.2% |
Family Income by Famaliy Size in Moon Lake
2-person families (312 | 35.8%) account for the highest median family income in Moon Lake with $52,560 per family, while 2-person families (312 | 35.8%) have the highest median income of $26,280 per family member.
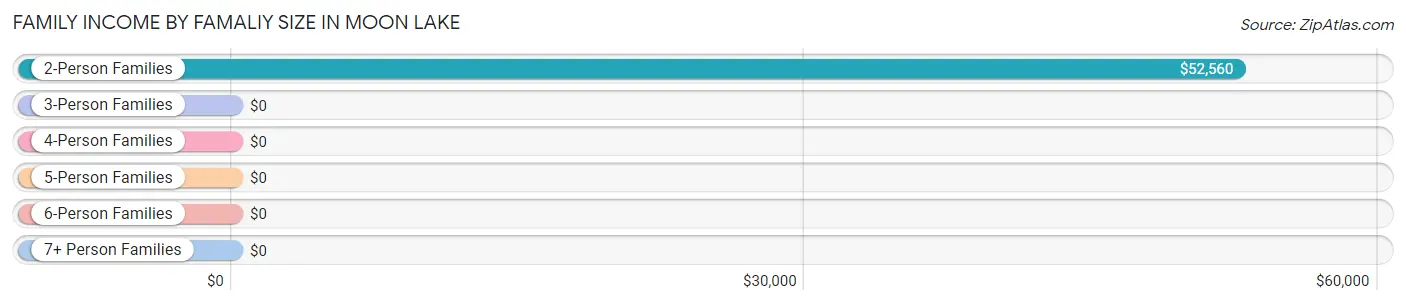
| Income Bracket | # Families | Median Income |
| 2-Person Families | 312 (35.8%) | $52,560 |
| 3-Person Families | 260 (29.8%) | $0 |
| 4-Person Families | 141 (16.2%) | $0 |
| 5-Person Families | 111 (12.7%) | $0 |
| 6-Person Families | 48 (5.5%) | $0 |
| 7+ Person Families | 0 (0.0%) | $0 |
| Total | 872 (100.0%) | $53,578 |
Family Income by Number of Earners in Moon Lake
The median family income in Moon Lake is $53,578, with families comprising 3+ earners (166) having the highest median family income of $112,135, while families with no earners (262) have the lowest median family income of $20,886, accounting for 19.0% and 30.0% of families, respectively.
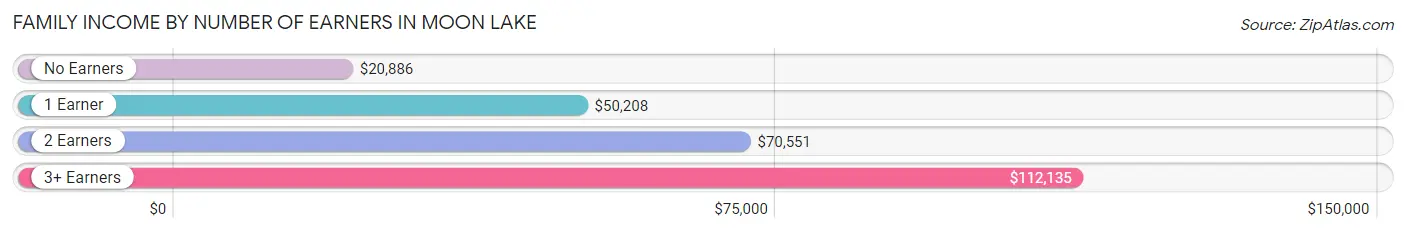
| Number of Earners | # Families | Median Income |
| No Earners | 262 (30.0%) | $20,886 |
| 1 Earner | 131 (15.0%) | $50,208 |
| 2 Earners | 313 (35.9%) | $70,551 |
| 3+ Earners | 166 (19.0%) | $112,135 |
| Total | 872 (100.0%) | $53,578 |
Household Income in Moon Lake
Household Income Brackets in Moon Lake
With 319 households falling in the category, the $15,000 to $24,999 income range is the most frequent in Moon Lake, accounting for 19.9% of all households. In contrast, only 38 households (2.4%) fall into the $150,000 to $199,999 income bracket, making it the least populous group.
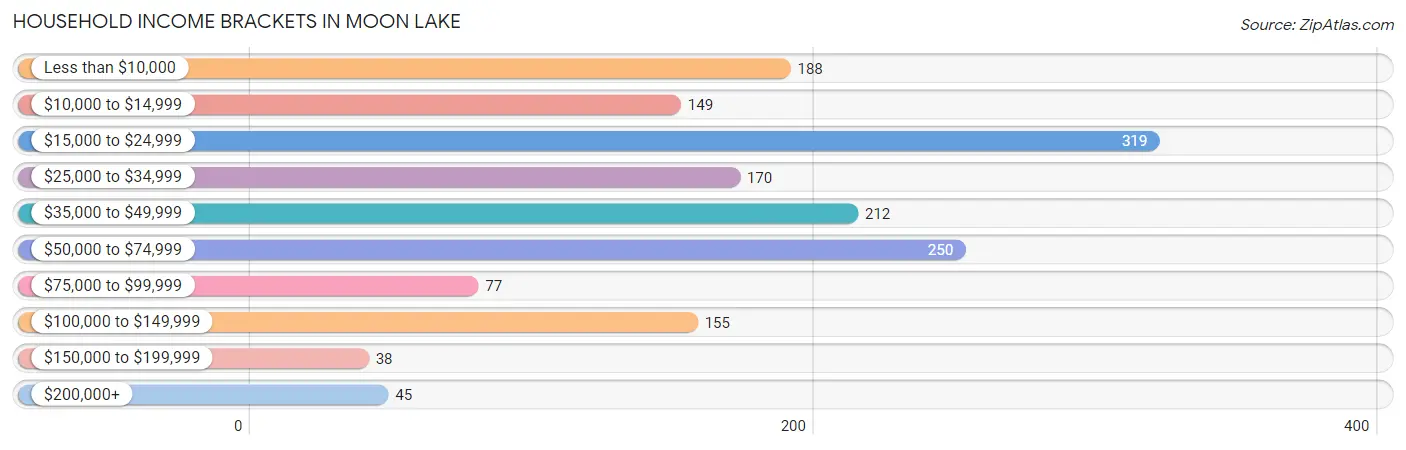
| Income Bracket | # Households | % Households |
| Less than $10,000 | 188 | 11.7% |
| $10,000 to $14,999 | 149 | 9.3% |
| $15,000 to $24,999 | 319 | 19.9% |
| $25,000 to $34,999 | 170 | 10.6% |
| $35,000 to $49,999 | 212 | 13.2% |
| $50,000 to $74,999 | 250 | 15.6% |
| $75,000 to $99,999 | 77 | 4.8% |
| $100,000 to $149,999 | 155 | 9.7% |
| $150,000 to $199,999 | 38 | 2.4% |
| $200,000+ | 45 | 2.8% |
Household Income by Householder Age in Moon Lake
The median household income in Moon Lake is $34,205, with the highest median household income of $109,474 found in the 25 to 44 years age bracket for the primary householder. A total of 230 households (14.3%) fall into this category. Meanwhile, the 15 to 24 years age bracket for the primary householder has the lowest median household income of $22,292, with 44 households (2.7%) in this group.

| Income Bracket | # Households | Median Income |
| 15 to 24 Years | 44 (2.7%) | $22,292 |
| 25 to 44 Years | 230 (14.3%) | $109,474 |
| 45 to 64 Years | 970 (60.5%) | $23,971 |
| 65+ Years | 359 (22.4%) | $33,941 |
| Total | 1,603 (100.0%) | $34,205 |
Poverty in Moon Lake
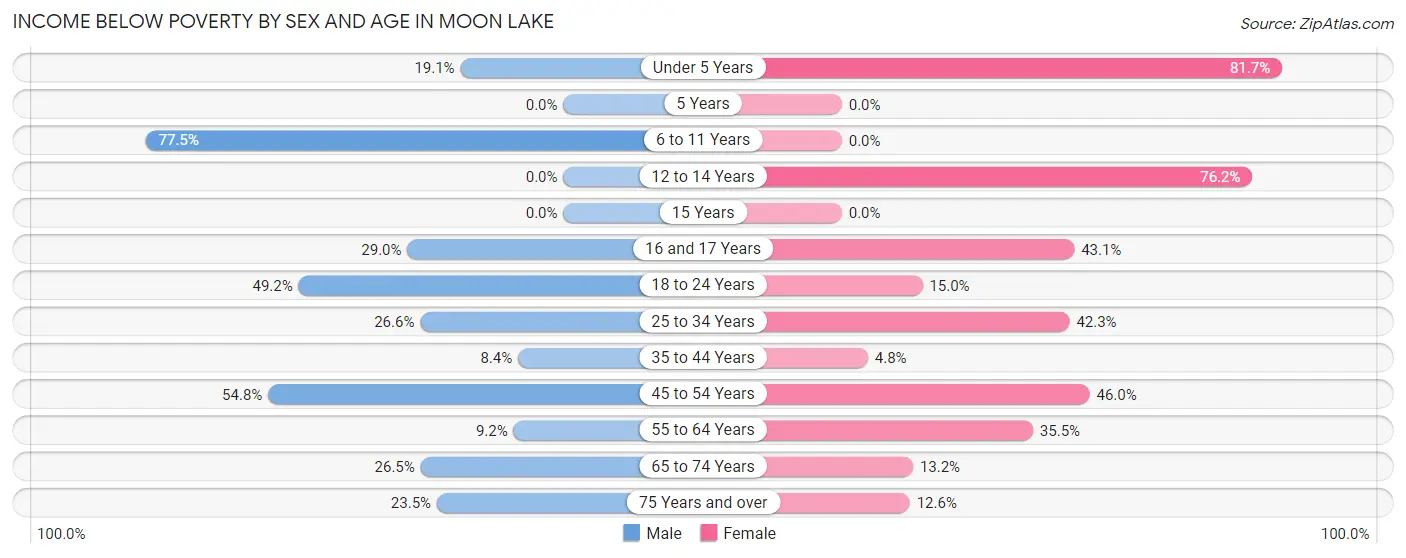
Income Below Poverty by Sex and Age in Moon Lake
With 28.2% poverty level for males and 34.1% for females among the residents of Moon Lake, 6 to 11 year old males and under 5 year old females are the most vulnerable to poverty, with 69 males (77.5%) and 67 females (81.7%) in their respective age groups living below the poverty level.
| Age Bracket | Male | Female |
| Under 5 Years | 17 (19.1%) | 67 (81.7%) |
| 5 Years | 0 (0.0%) | 0 (0.0%) |
| 6 to 11 Years | 69 (77.5%) | 0 (0.0%) |
| 12 to 14 Years | 0 (0.0%) | 112 (76.2%) |
| 15 Years | 0 (0.0%) | 0 (0.0%) |
| 16 and 17 Years | 22 (28.9%) | 22 (43.1%) |
| 18 to 24 Years | 29 (49.1%) | 28 (15.0%) |
| 25 to 34 Years | 85 (26.6%) | 183 (42.3%) |
| 35 to 44 Years | 19 (8.4%) | 7 (4.8%) |
| 45 to 54 Years | 206 (54.8%) | 160 (46.0%) |
| 55 to 64 Years | 29 (9.2%) | 155 (35.5%) |
| 65 to 74 Years | 40 (26.5%) | 28 (13.2%) |
| 75 Years and over | 23 (23.5%) | 15 (12.6%) |
| Total | 539 (28.2%) | 777 (34.1%) |
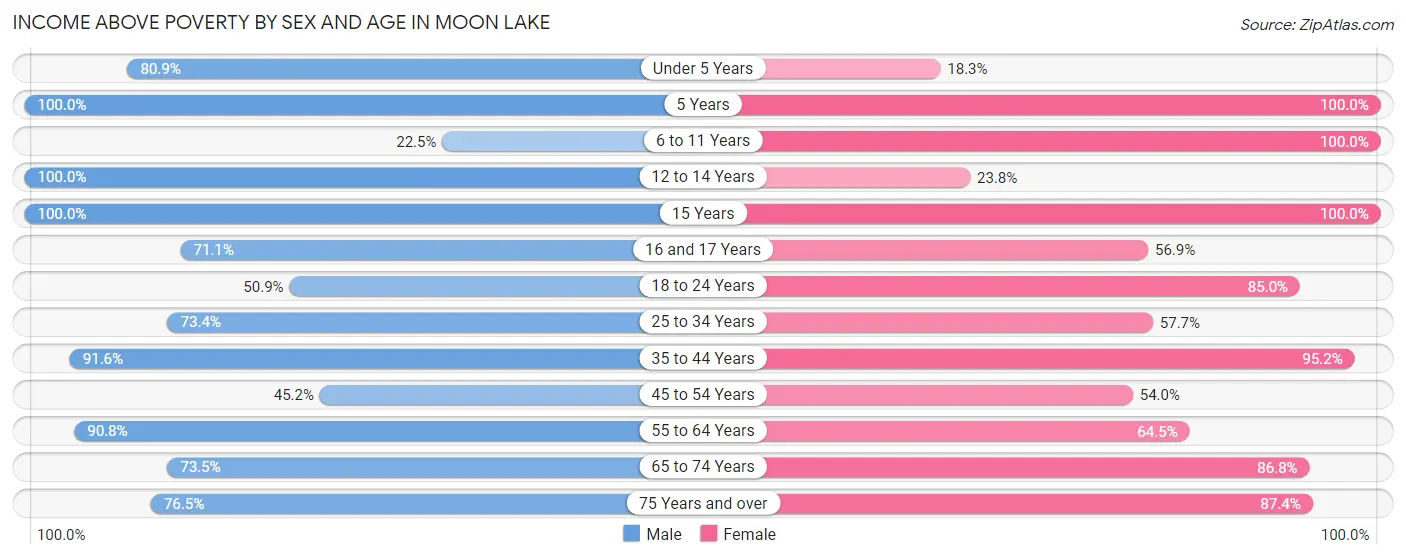
Income Above Poverty by Sex and Age in Moon Lake
According to the poverty statistics in Moon Lake, males aged 5 years and females aged 5 years are the age groups that are most secure financially, with 100.0% of males and 100.0% of females in these age groups living above the poverty line.
| Age Bracket | Male | Female |
| Under 5 Years | 72 (80.9%) | 15 (18.3%) |
| 5 Years | 45 (100.0%) | 5 (100.0%) |
| 6 to 11 Years | 20 (22.5%) | 104 (100.0%) |
| 12 to 14 Years | 52 (100.0%) | 35 (23.8%) |
| 15 Years | 17 (100.0%) | 9 (100.0%) |
| 16 and 17 Years | 54 (71.1%) | 29 (56.9%) |
| 18 to 24 Years | 30 (50.8%) | 159 (85.0%) |
| 25 to 34 Years | 235 (73.4%) | 250 (57.7%) |
| 35 to 44 Years | 207 (91.6%) | 138 (95.2%) |
| 45 to 54 Years | 170 (45.2%) | 188 (54.0%) |
| 55 to 64 Years | 285 (90.8%) | 282 (64.5%) |
| 65 to 74 Years | 111 (73.5%) | 184 (86.8%) |
| 75 Years and over | 75 (76.5%) | 104 (87.4%) |
| Total | 1,373 (71.8%) | 1,502 (65.9%) |
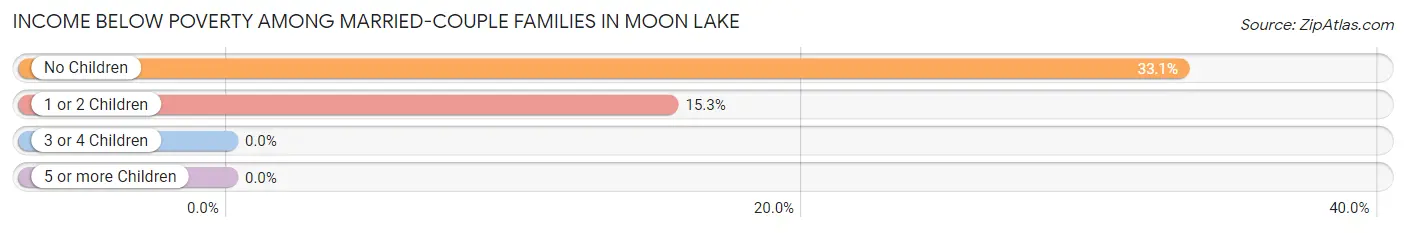
Income Below Poverty Among Married-Couple Families in Moon Lake
The poverty statistics for married-couple families in Moon Lake show that 24.3% or 137 of the total 564 families live below the poverty line. Families with no children have the highest poverty rate of 33.1%, comprising of 112 families. On the other hand, families with 3 or 4 children have the lowest poverty rate of 0.0%, which includes 0 families.
| Children | Above Poverty | Below Poverty |
| No Children | 226 (66.9%) | 112 (33.1%) |
| 1 or 2 Children | 138 (84.7%) | 25 (15.3%) |
| 3 or 4 Children | 63 (100.0%) | 0 (0.0%) |
| 5 or more Children | 0 (0.0%) | 0 (0.0%) |
| Total | 427 (75.7%) | 137 (24.3%) |
Income Below Poverty Among Single-Parent Households in Moon Lake
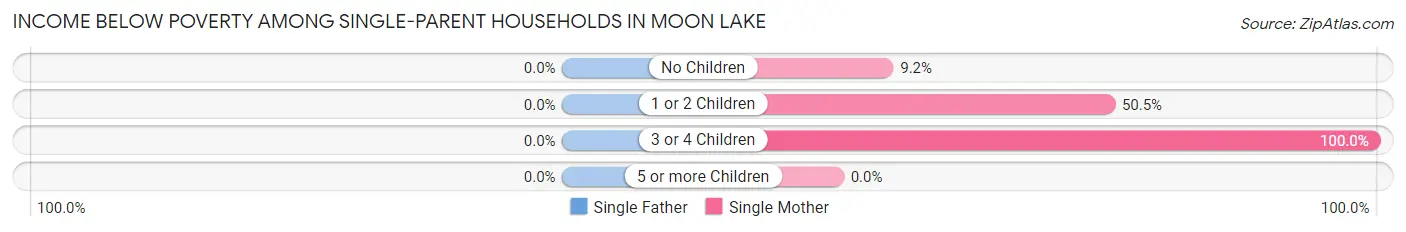
| Children | Single Father | Single Mother |
| No Children | 0 (0.0%) | 11 (9.2%) |
| 1 or 2 Children | 0 (0.0%) | 48 (50.5%) |
| 3 or 4 Children | 0 (0.0%) | 30 (100.0%) |
| 5 or more Children | 0 (0.0%) | 0 (0.0%) |
| Total | 0 (0.0%) | 89 (36.5%) |
Income Below Poverty Among Married-Couple vs Single-Parent Households in Moon Lake
The poverty data for Moon Lake shows that 137 of the married-couple family households (24.3%) and 89 of the single-parent households (28.9%) are living below the poverty level. Within the married-couple family households, those with no children have the highest poverty rate, with 112 households (33.1%) falling below the poverty line. Among the single-parent households, those with 3 or 4 children have the highest poverty rate, with 30 household (100.0%) living below poverty.
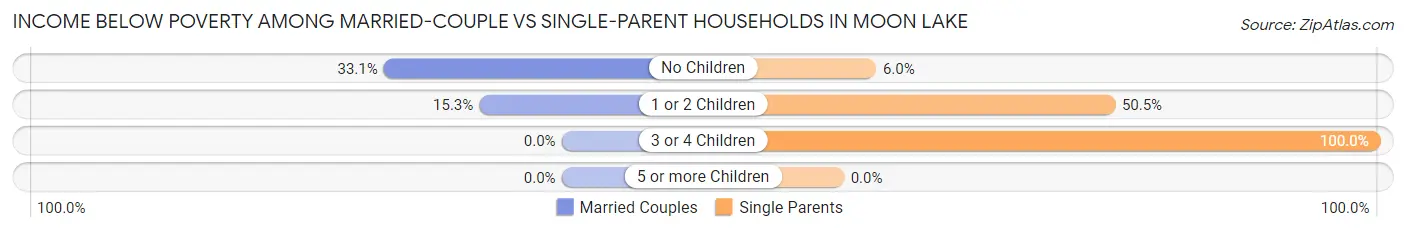
| Children | Married-Couple Families | Single-Parent Households |
| No Children | 112 (33.1%) | 11 (6.0%) |
| 1 or 2 Children | 25 (15.3%) | 48 (50.5%) |
| 3 or 4 Children | 0 (0.0%) | 30 (100.0%) |
| 5 or more Children | 0 (0.0%) | 0 (0.0%) |
| Total | 137 (24.3%) | 89 (28.9%) |
Race in Moon Lake
The most populous races in Moon Lake are White / Caucasian (3,874 | 91.9%), Hispanic or Latino (678 | 16.1%), and Two or more Races (212 | 5.0%).
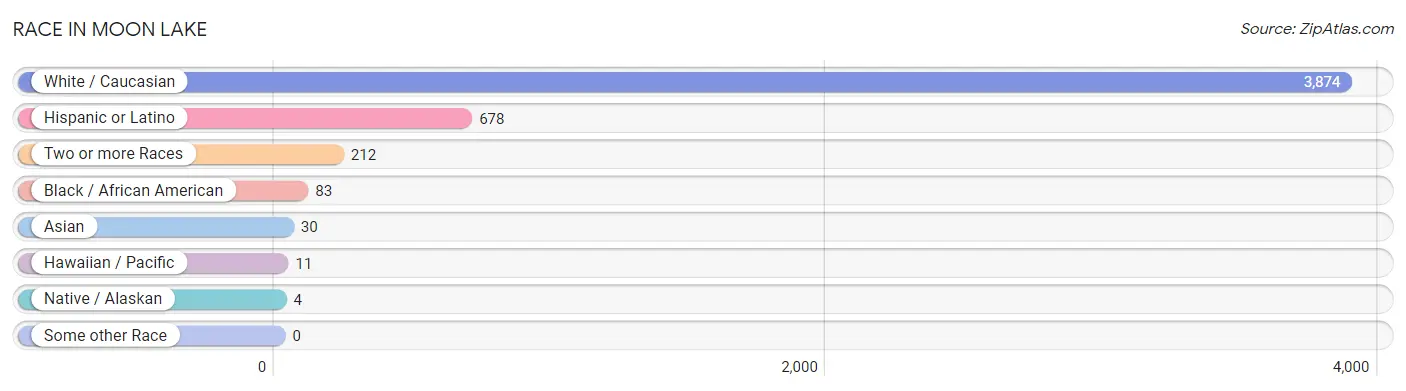
| Race | # Population | % Population |
| Asian | 30 | 0.7% |
| Black / African American | 83 | 2.0% |
| Hawaiian / Pacific | 11 | 0.3% |
| Hispanic or Latino | 678 | 16.1% |
| Native / Alaskan | 4 | 0.1% |
| White / Caucasian | 3,874 | 91.9% |
| Two or more Races | 212 | 5.0% |
| Some other Race | 0 | 0.0% |
| Total | 4,214 | 100.0% |
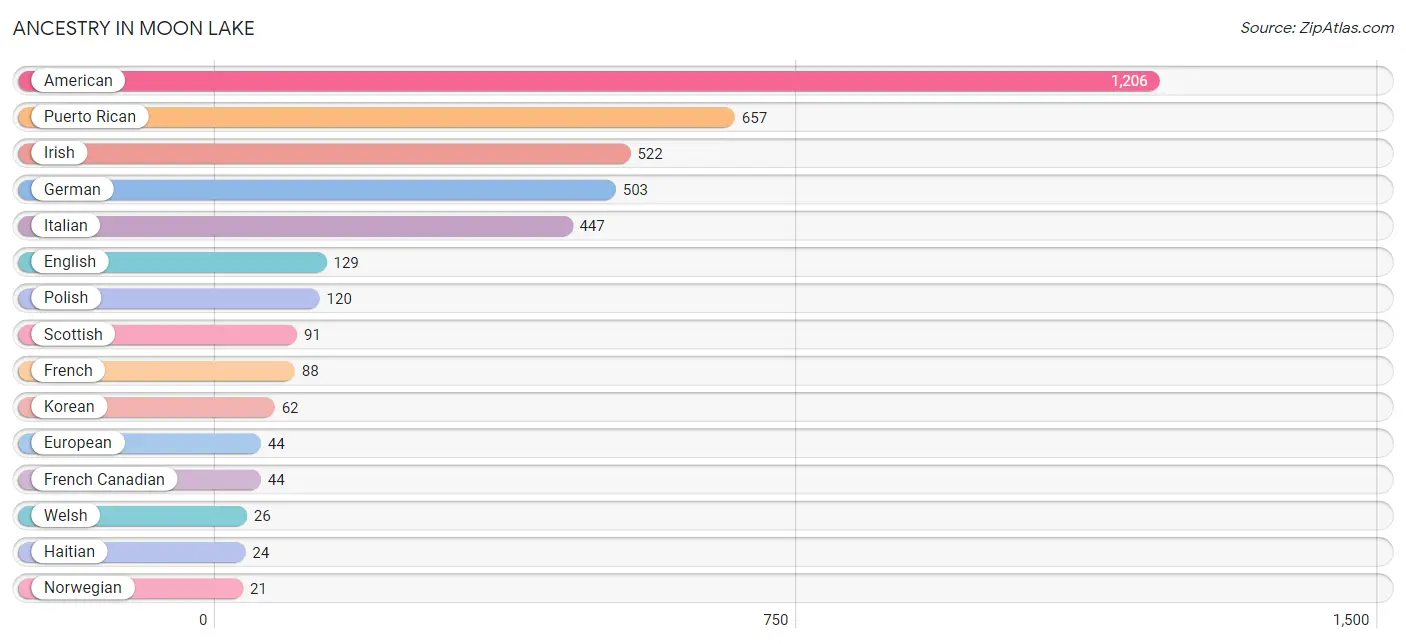
Ancestry in Moon Lake
The most populous ancestries reported in Moon Lake are American (1,206 | 28.6%), Puerto Rican (657 | 15.6%), Irish (522 | 12.4%), German (503 | 11.9%), and Italian (447 | 10.6%), together accounting for 79.1% of all Moon Lake residents.
| Ancestry | # Population | % Population |
| American | 1,206 | 28.6% |
| Argentinean | 11 | 0.3% |
| Bhutanese | 1 | 0.0% |
| Blackfeet | 5 | 0.1% |
| British | 12 | 0.3% |
| Cherokee | 11 | 0.3% |
| Czech | 9 | 0.2% |
| Dutch | 12 | 0.3% |
| English | 129 | 3.1% |
| European | 44 | 1.0% |
| Finnish | 11 | 0.3% |
| French | 88 | 2.1% |
| French Canadian | 44 | 1.0% |
| German | 503 | 11.9% |
| Greek | 15 | 0.4% |
| Guamanian / Chamorro | 11 | 0.3% |
| Haitian | 24 | 0.6% |
| Hungarian | 13 | 0.3% |
| Irish | 522 | 12.4% |
| Iroquois | 4 | 0.1% |
| Italian | 447 | 10.6% |
| Korean | 62 | 1.5% |
| Lithuanian | 11 | 0.3% |
| Northern European | 16 | 0.4% |
| Norwegian | 21 | 0.5% |
| Pennsylvania German | 12 | 0.3% |
| Polish | 120 | 2.9% |
| Portuguese | 11 | 0.3% |
| Puerto Rican | 657 | 15.6% |
| Scotch-Irish | 7 | 0.2% |
| Scottish | 91 | 2.2% |
| South American | 11 | 0.3% |
| Spaniard | 10 | 0.2% |
| Sri Lankan | 17 | 0.4% |
| Swedish | 6 | 0.1% |
| Ukrainian | 14 | 0.3% |
| Welsh | 26 | 0.6% | View All 37 Rows |
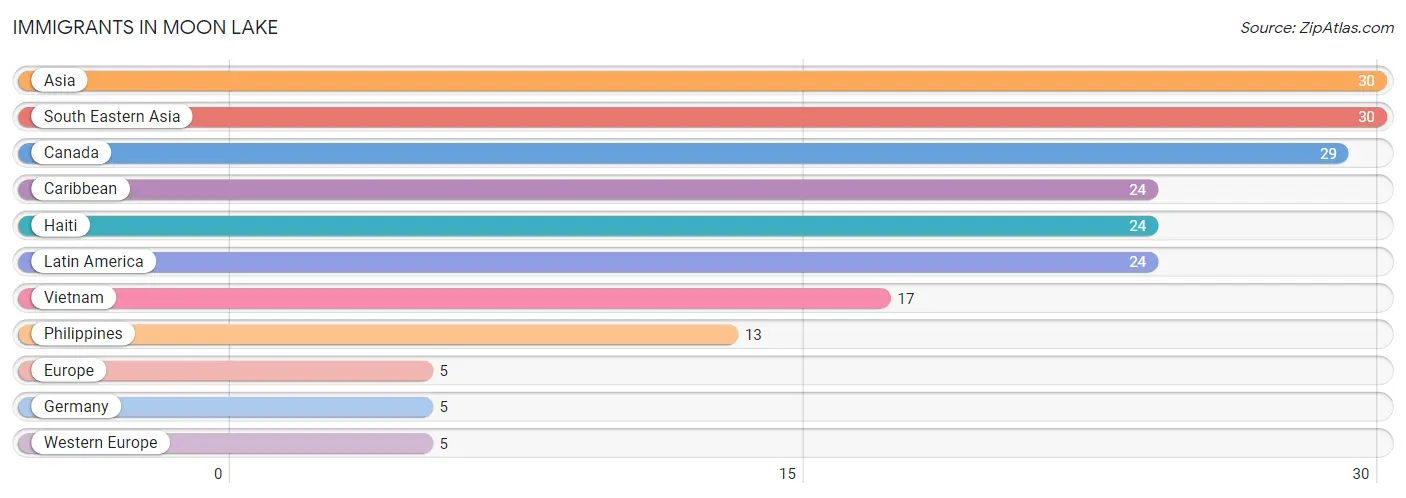
Immigrants in Moon Lake
The most numerous immigrant groups reported in Moon Lake came from Asia (30 | 0.7%), South Eastern Asia (30 | 0.7%), Canada (29 | 0.7%), Caribbean (24 | 0.6%), and Haiti (24 | 0.6%), together accounting for 3.3% of all Moon Lake residents.
| Immigration Origin | # Population | % Population |
| Asia | 30 | 0.7% |
| Canada | 29 | 0.7% |
| Caribbean | 24 | 0.6% |
| Europe | 5 | 0.1% |
| Germany | 5 | 0.1% |
| Haiti | 24 | 0.6% |
| Latin America | 24 | 0.6% |
| Philippines | 13 | 0.3% |
| South Eastern Asia | 30 | 0.7% |
| Vietnam | 17 | 0.4% |
| Western Europe | 5 | 0.1% | View All 11 Rows |
Sex and Age in Moon Lake
Sex and Age in Moon Lake
The most populous age groups in Moon Lake are 50 to 54 Years (240 | 12.4%) for men and 25 to 29 Years (386 | 16.9%) for women.
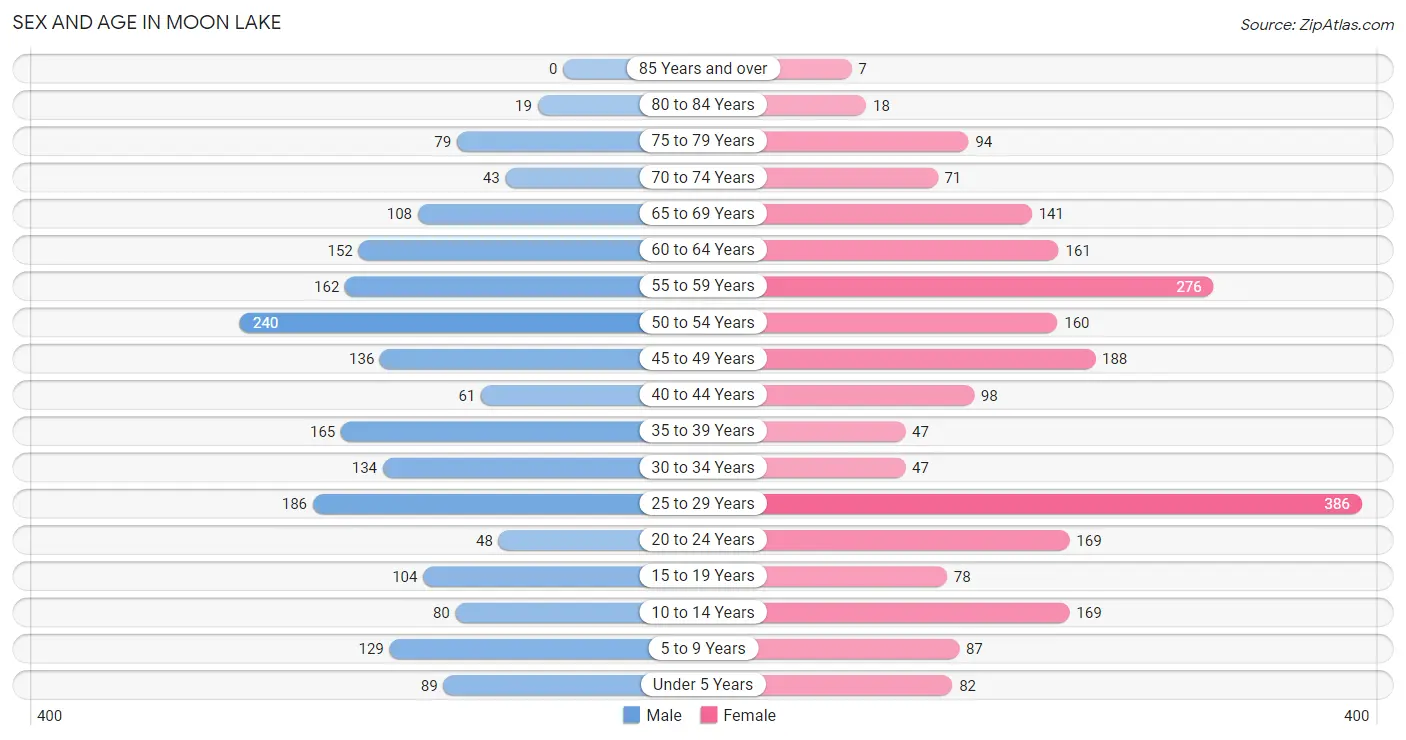
| Age Bracket | Male | Female |
| Under 5 Years | 89 (4.6%) | 82 (3.6%) |
| 5 to 9 Years | 129 (6.7%) | 87 (3.8%) |
| 10 to 14 Years | 80 (4.1%) | 169 (7.4%) |
| 15 to 19 Years | 104 (5.4%) | 78 (3.4%) |
| 20 to 24 Years | 48 (2.5%) | 169 (7.4%) |
| 25 to 29 Years | 186 (9.6%) | 386 (16.9%) |
| 30 to 34 Years | 134 (6.9%) | 47 (2.1%) |
| 35 to 39 Years | 165 (8.5%) | 47 (2.1%) |
| 40 to 44 Years | 61 (3.2%) | 98 (4.3%) |
| 45 to 49 Years | 136 (7.0%) | 188 (8.3%) |
| 50 to 54 Years | 240 (12.4%) | 160 (7.0%) |
| 55 to 59 Years | 162 (8.4%) | 276 (12.1%) |
| 60 to 64 Years | 152 (7.9%) | 161 (7.1%) |
| 65 to 69 Years | 108 (5.6%) | 141 (6.2%) |
| 70 to 74 Years | 43 (2.2%) | 71 (3.1%) |
| 75 to 79 Years | 79 (4.1%) | 94 (4.1%) |
| 80 to 84 Years | 19 (1.0%) | 18 (0.8%) |
| 85 Years and over | 0 (0.0%) | 7 (0.3%) |
| Total | 1,935 (100.0%) | 2,279 (100.0%) |
Families and Households in Moon Lake
Median Family Size in Moon Lake
The median family size in Moon Lake is 3.66 persons per family, with single male/father families (64 | 7.3%) accounting for the largest median family size of 4.06 persons per family. On the other hand, single female/mother families (244 | 28.0%) represent the smallest median family size with 3.45 persons per family.
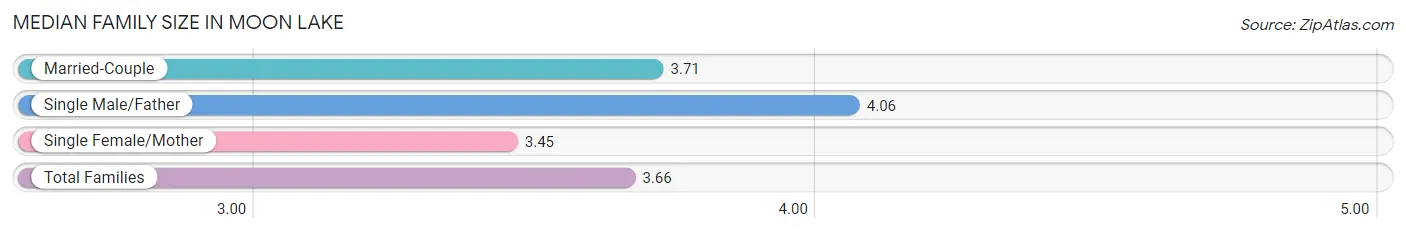
| Family Type | # Families | Family Size |
| Married-Couple | 564 (64.7%) | 3.71 |
| Single Male/Father | 64 (7.3%) | 4.06 |
| Single Female/Mother | 244 (28.0%) | 3.45 |
| Total Families | 872 (100.0%) | 3.66 |
Median Household Size in Moon Lake
The median household size in Moon Lake is 2.63 persons per household, with single male/father households (64 | 4.0%) accounting for the largest median household size of 4.23 persons per household. non-family households (731 | 45.6%) represent the smallest median household size with 1.27 persons per household.
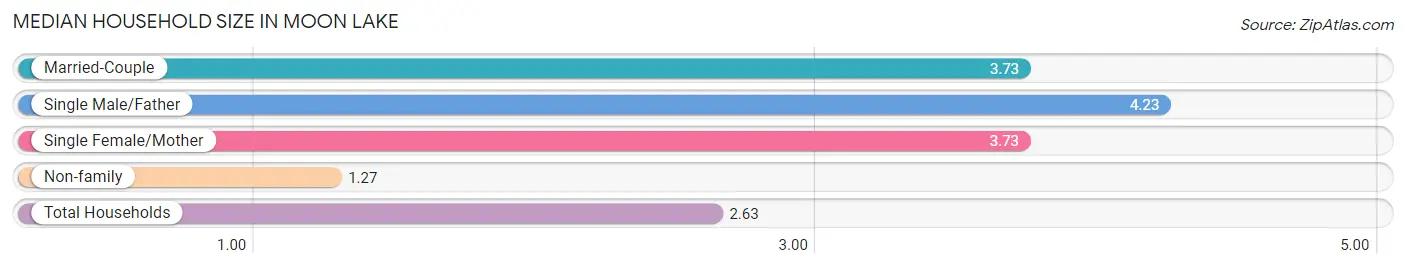
| Household Type | # Households | Household Size |
| Married-Couple | 564 (35.2%) | 3.73 |
| Single Male/Father | 64 (4.0%) | 4.23 |
| Single Female/Mother | 244 (15.2%) | 3.73 |
| Non-family | 731 (45.6%) | 1.27 |
| Total Households | 1,603 (100.0%) | 2.63 |
Household Size by Marriage Status in Moon Lake
Out of a total of 1,603 households in Moon Lake, 872 (54.4%) are family households, while 731 (45.6%) are nonfamily households. The most numerous type of family households are 3-person households, comprising 290, and the most common type of nonfamily households are 1-person households, comprising 628.
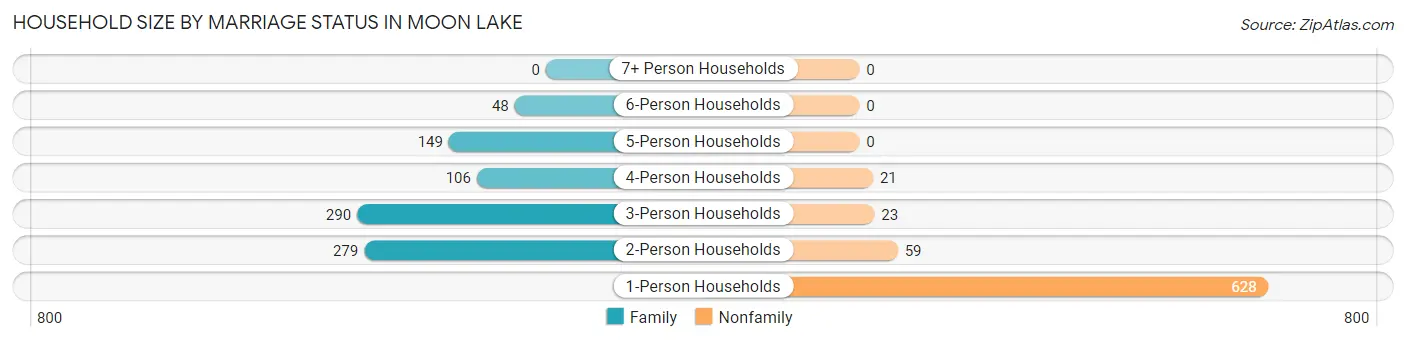
| Household Size | Family Households | Nonfamily Households |
| 1-Person Households | - | 628 (39.2%) |
| 2-Person Households | 279 (17.4%) | 59 (3.7%) |
| 3-Person Households | 290 (18.1%) | 23 (1.4%) |
| 4-Person Households | 106 (6.6%) | 21 (1.3%) |
| 5-Person Households | 149 (9.3%) | 0 (0.0%) |
| 6-Person Households | 48 (3.0%) | 0 (0.0%) |
| 7+ Person Households | 0 (0.0%) | 0 (0.0%) |
| Total | 872 (54.4%) | 731 (45.6%) |
Female Fertility in Moon Lake
Fertility by Age in Moon Lake
Average fertility rate in Moon Lake is 9.0 births per 1,000 women. Women in the age bracket of 20 to 34 years have the highest fertility rate with 17.0 births per 1,000 women. Women in the age bracket of 20 to 34 years acount for 100.0% of all women with births.
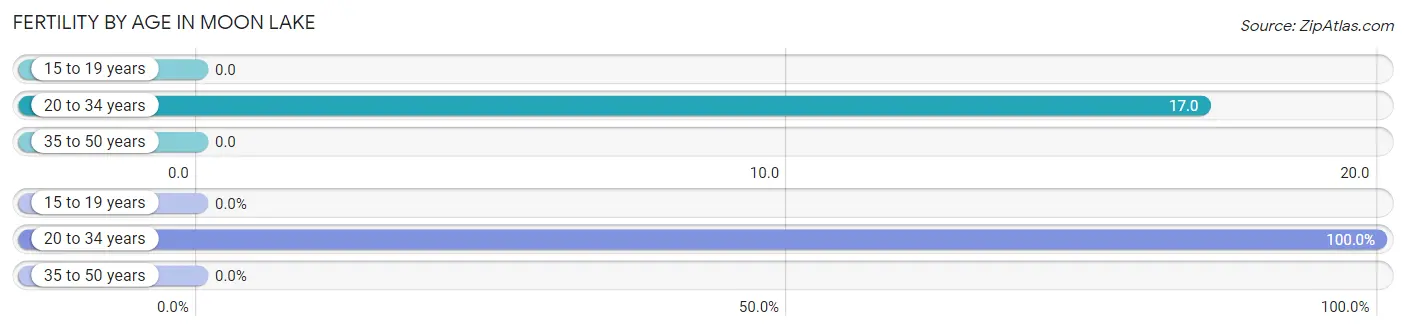
| Age Bracket | Women with Births | Births / 1,000 Women |
| 15 to 19 years | 0 (0.0%) | 0.0 |
| 20 to 34 years | 10 (100.0%) | 17.0 |
| 35 to 50 years | 0 (0.0%) | 0.0 |
| Total | 10 (100.0%) | 9.0 |
Fertility by Age by Marriage Status in Moon Lake
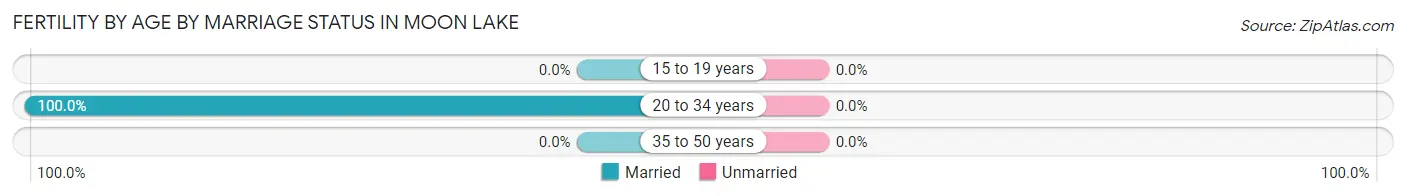
| Age Bracket | Married | Unmarried |
| 15 to 19 years | 0 (0.0%) | 0 (0.0%) |
| 20 to 34 years | 10 (100.0%) | 0 (0.0%) |
| 35 to 50 years | 0 (0.0%) | 0 (0.0%) |
| Total | 10 (100.0%) | 0 (0.0%) |
Fertility by Education in Moon Lake
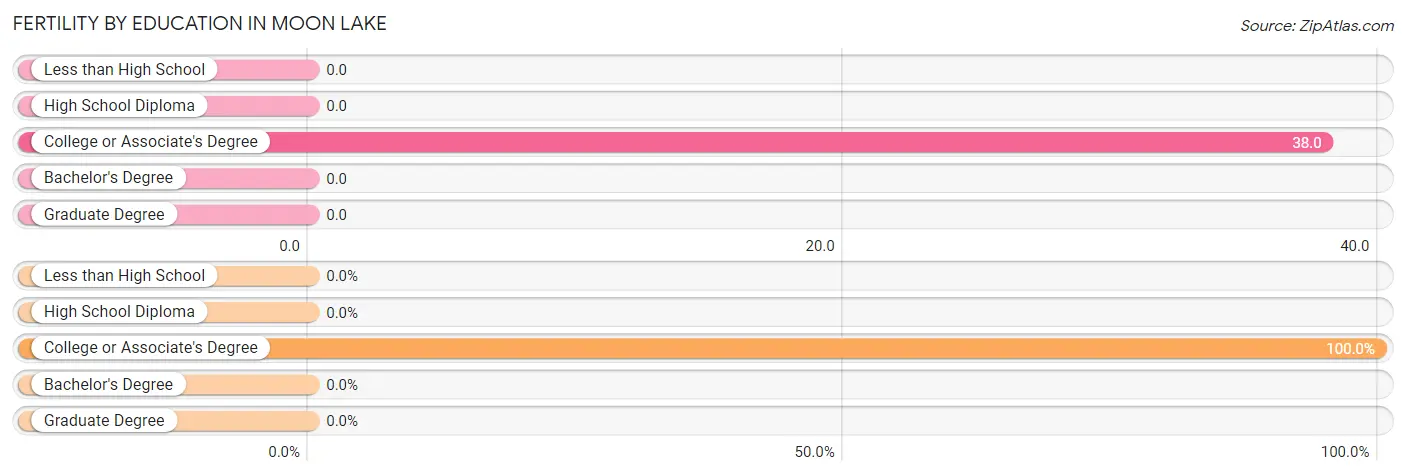
| Educational Attainment | Women with Births | Births / 1,000 Women |
| Less than High School | 0 (0.0%) | 0.0 |
| High School Diploma | 0 (0.0%) | 0.0 |
| College or Associate's Degree | 10 (100.0%) | 38.0 |
| Bachelor's Degree | 0 (0.0%) | 0.0 |
| Graduate Degree | 0 (0.0%) | 0.0 |
| Total | 10 (100.0%) | 9.0 |
Fertility by Education by Marriage Status in Moon Lake
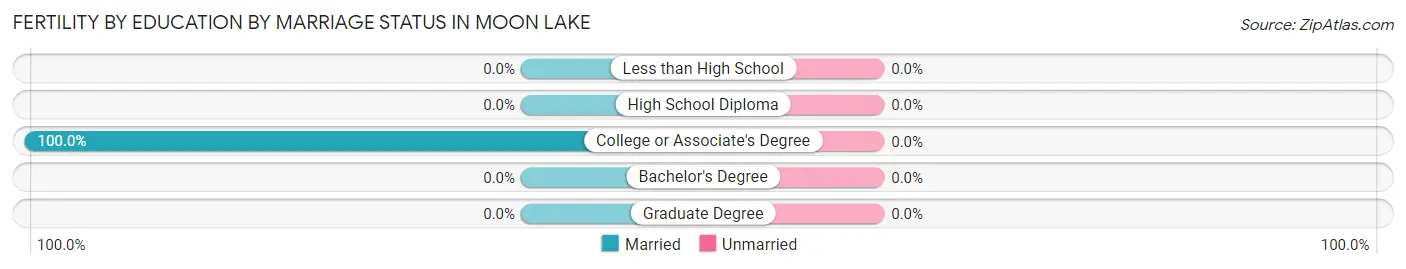
| Educational Attainment | Married | Unmarried |
| Less than High School | 0 (0.0%) | 0 (0.0%) |
| High School Diploma | 0 (0.0%) | 0 (0.0%) |
| College or Associate's Degree | 10 (100.0%) | 0 (0.0%) |
| Bachelor's Degree | 0 (0.0%) | 0 (0.0%) |
| Graduate Degree | 0 (0.0%) | 0 (0.0%) |
| Total | 10 (100.0%) | 0 (0.0%) |
Employment Characteristics in Moon Lake
Employment by Class of Employer in Moon Lake
Among the 1,516 employed individuals in Moon Lake, private company employees (1,079 | 71.2%), not-for-profit organizations (146 | 9.6%), and local government employees (110 | 7.3%) make up the most common classes of employment.
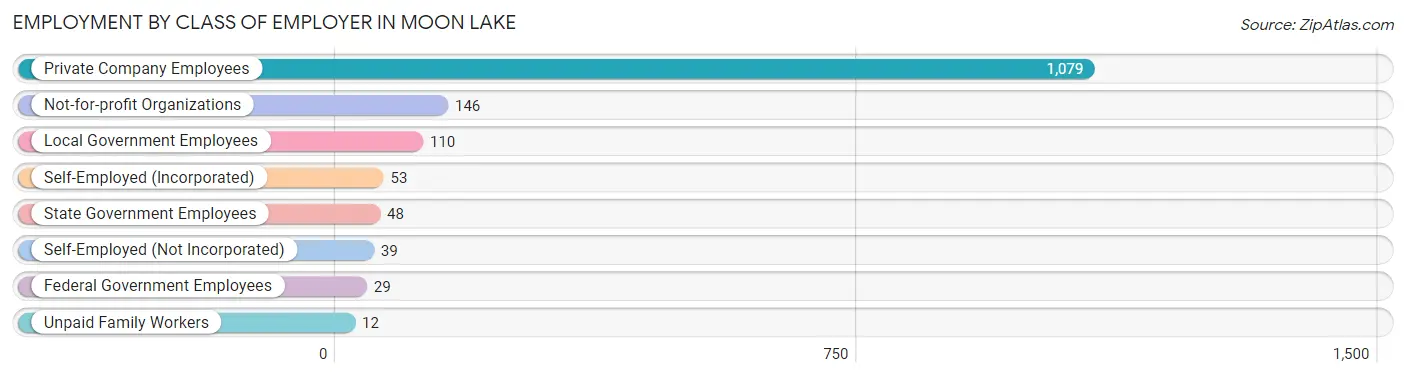
| Employer Class | # Employees | % Employees |
| Private Company Employees | 1,079 | 71.2% |
| Self-Employed (Incorporated) | 53 | 3.5% |
| Self-Employed (Not Incorporated) | 39 | 2.6% |
| Not-for-profit Organizations | 146 | 9.6% |
| Local Government Employees | 110 | 7.3% |
| State Government Employees | 48 | 3.2% |
| Federal Government Employees | 29 | 1.9% |
| Unpaid Family Workers | 12 | 0.8% |
| Total | 1,516 | 100.0% |
Employment Status by Age in Moon Lake
According to the labor force statistics for Moon Lake, out of the total population over 16 years of age (3,552), 56.5% or 2,007 individuals are in the labor force, with 22.6% or 454 of them unemployed. The age group with the highest labor force participation rate is 35 to 44 years, with 88.4% or 328 individuals in the labor force. Within the labor force, the 16 to 19 years age range has the highest percentage of unemployed individuals, with 75.4% or 52 of them being unemployed.
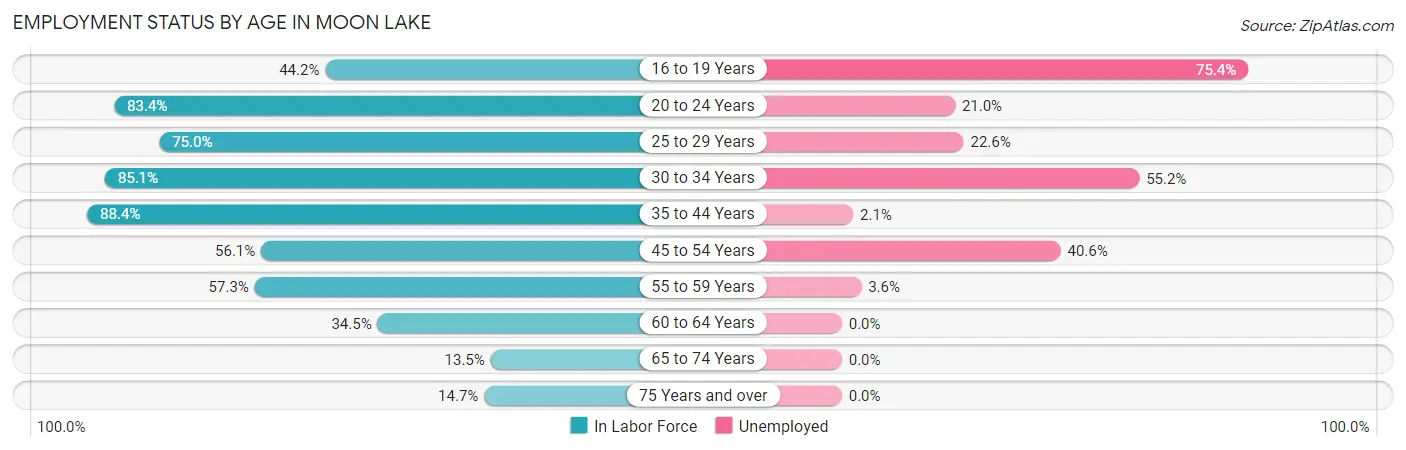
| Age Bracket | In Labor Force | Unemployed |
| 16 to 19 Years | 69 (44.2%) | 52 (75.4%) |
| 20 to 24 Years | 181 (83.4%) | 38 (21.0%) |
| 25 to 29 Years | 429 (75.0%) | 97 (22.6%) |
| 30 to 34 Years | 154 (85.1%) | 85 (55.2%) |
| 35 to 44 Years | 328 (88.4%) | 7 (2.1%) |
| 45 to 54 Years | 406 (56.1%) | 165 (40.6%) |
| 55 to 59 Years | 251 (57.3%) | 9 (3.6%) |
| 60 to 64 Years | 108 (34.5%) | 0 (0.0%) |
| 65 to 74 Years | 49 (13.5%) | 0 (0.0%) |
| 75 Years and over | 32 (14.7%) | 0 (0.0%) |
| Total | 2,007 (56.5%) | 454 (22.6%) |
Employment Status by Educational Attainment in Moon Lake
According to labor force statistics for Moon Lake, 64.5% of individuals (1,676) out of the total population between 25 and 64 years of age (2,599) are in the labor force, with 21.7% or 364 of them being unemployed. The group with the highest labor force participation rate are those with the educational attainment of bachelor's degree or higher, with 89.3% or 108 individuals in the labor force. Within the labor force, individuals with less than high school education have the highest percentage of unemployment, with 52.5% or 181 of them being unemployed.
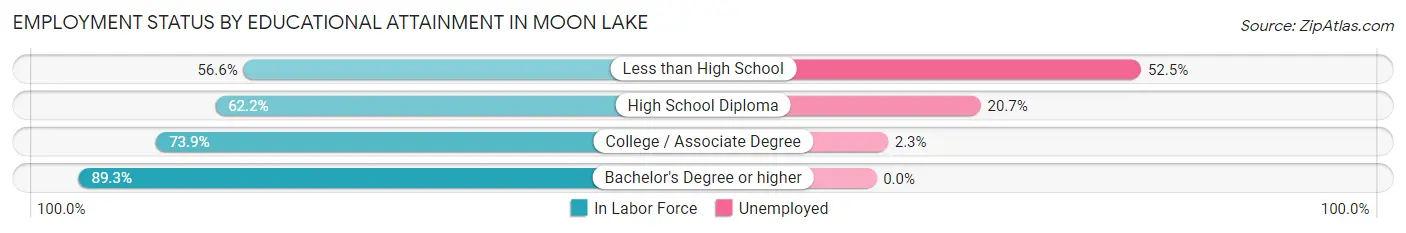
| Educational Attainment | In Labor Force | Unemployed |
| Less than High School | 345 (56.6%) | 320 (52.5%) |
| High School Diploma | 837 (62.2%) | 279 (20.7%) |
| College / Associate Degree | 386 (73.9%) | 12 (2.3%) |
| Bachelor's Degree or higher | 108 (89.3%) | 0 (0.0%) |
| Total | 1,676 (64.5%) | 564 (21.7%) |
Employment Occupations by Sex in Moon Lake
Management, Business, Science and Arts Occupations
The most common Management, Business, Science and Arts occupations in Moon Lake are Management (131 | 8.4%), Health Diagnosing & Treating (44 | 2.8%), Community & Social Service (41 | 2.6%), Health Technologists (23 | 1.5%), and Business & Financial (22 | 1.4%).
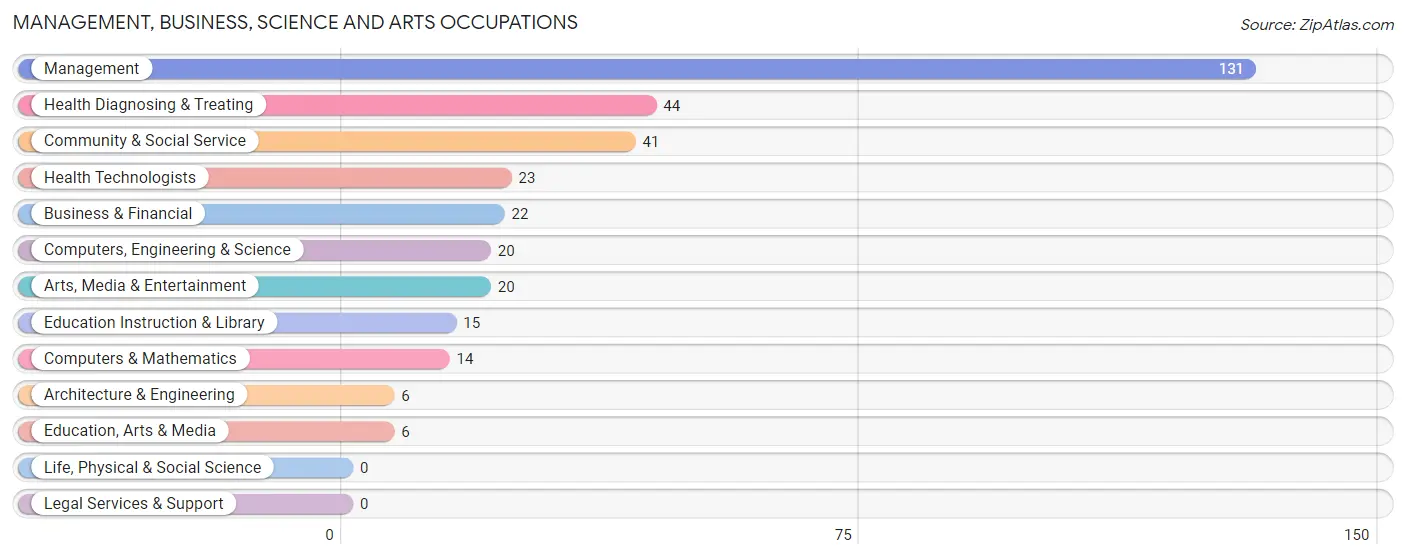
Management, Business, Science and Arts Occupations by Sex
Within the Management, Business, Science and Arts occupations in Moon Lake, the most male-oriented occupations are Architecture & Engineering (100.0%), Management (40.5%), and Health Diagnosing & Treating (36.4%), while the most female-oriented occupations are Computers & Mathematics (100.0%), Community & Social Service (100.0%), and Education, Arts & Media (100.0%).
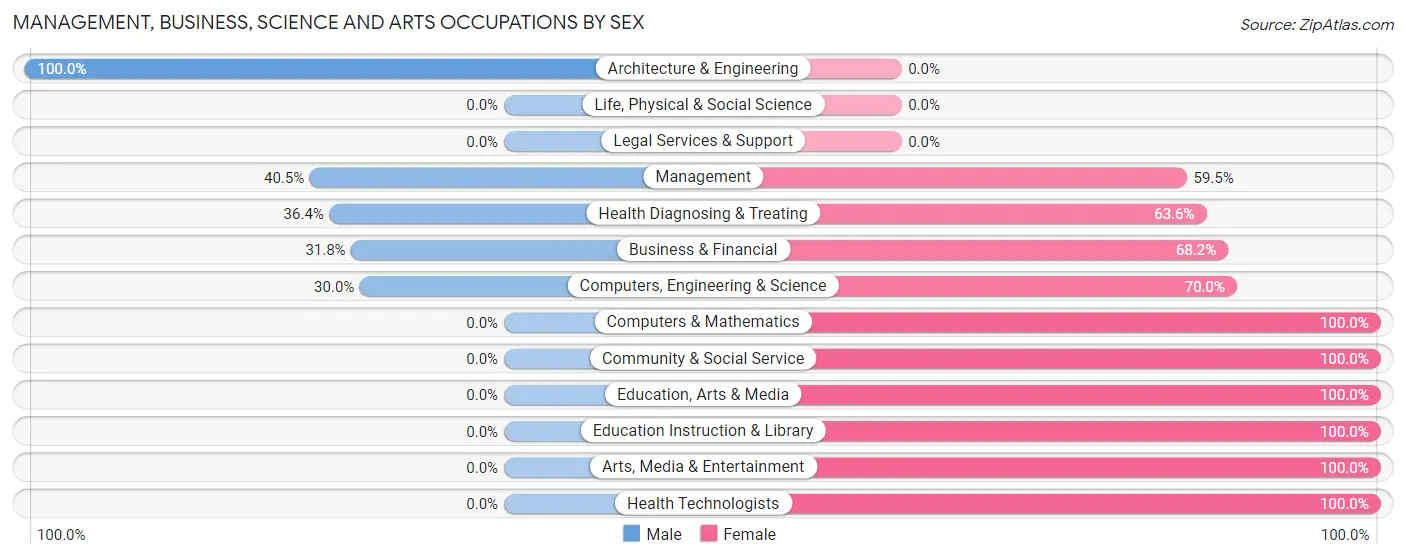
| Occupation | Male | Female |
| Management | 53 (40.5%) | 78 (59.5%) |
| Business & Financial | 7 (31.8%) | 15 (68.2%) |
| Computers, Engineering & Science | 6 (30.0%) | 14 (70.0%) |
| Computers & Mathematics | 0 (0.0%) | 14 (100.0%) |
| Architecture & Engineering | 6 (100.0%) | 0 (0.0%) |
| Life, Physical & Social Science | 0 (0.0%) | 0 (0.0%) |
| Community & Social Service | 0 (0.0%) | 41 (100.0%) |
| Education, Arts & Media | 0 (0.0%) | 6 (100.0%) |
| Legal Services & Support | 0 (0.0%) | 0 (0.0%) |
| Education Instruction & Library | 0 (0.0%) | 15 (100.0%) |
| Arts, Media & Entertainment | 0 (0.0%) | 20 (100.0%) |
| Health Diagnosing & Treating | 16 (36.4%) | 28 (63.6%) |
| Health Technologists | 0 (0.0%) | 23 (100.0%) |
| Total (Category) | 82 (31.8%) | 176 (68.2%) |
| Total (Overall) | 722 (46.5%) | 832 (53.5%) |
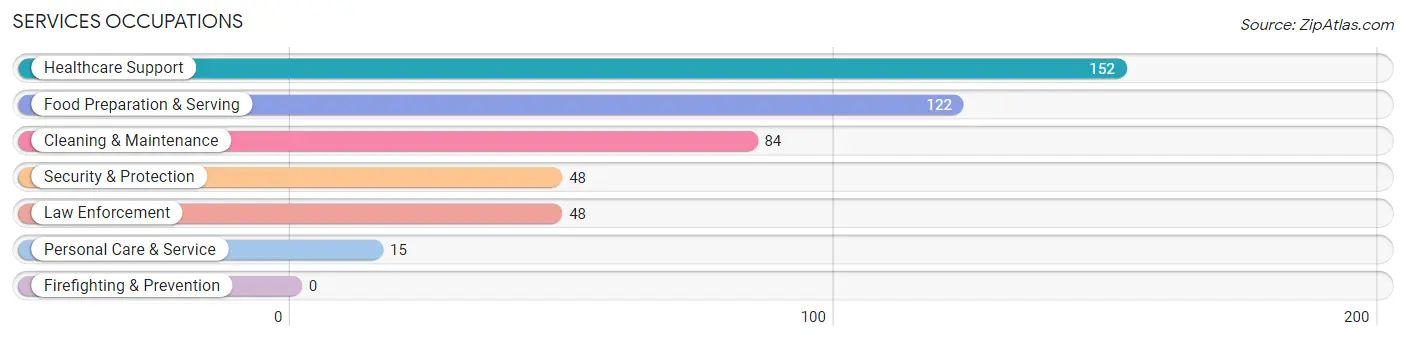
Services Occupations
The most common Services occupations in Moon Lake are Healthcare Support (152 | 9.8%), Food Preparation & Serving (122 | 7.9%), Cleaning & Maintenance (84 | 5.4%), Security & Protection (48 | 3.1%), and Law Enforcement (48 | 3.1%).
Services Occupations by Sex
Within the Services occupations in Moon Lake, the most male-oriented occupations are Security & Protection (100.0%), Law Enforcement (100.0%), and Cleaning & Maintenance (57.1%), while the most female-oriented occupations are Healthcare Support (100.0%), Personal Care & Service (60.0%), and Food Preparation & Serving (54.1%).
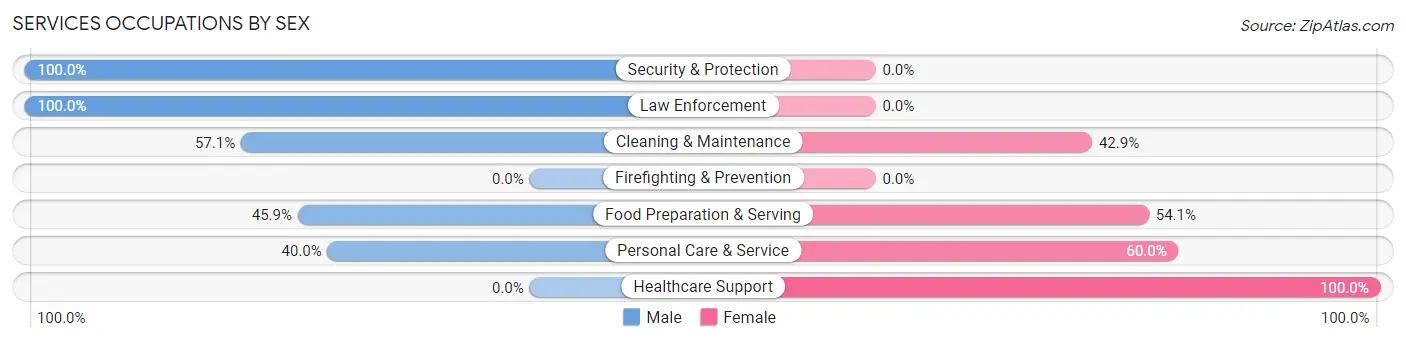
| Occupation | Male | Female |
| Healthcare Support | 0 (0.0%) | 152 (100.0%) |
| Security & Protection | 48 (100.0%) | 0 (0.0%) |
| Firefighting & Prevention | 0 (0.0%) | 0 (0.0%) |
| Law Enforcement | 48 (100.0%) | 0 (0.0%) |
| Food Preparation & Serving | 56 (45.9%) | 66 (54.1%) |
| Cleaning & Maintenance | 48 (57.1%) | 36 (42.9%) |
| Personal Care & Service | 6 (40.0%) | 9 (60.0%) |
| Total (Category) | 158 (37.5%) | 263 (62.5%) |
| Total (Overall) | 722 (46.5%) | 832 (53.5%) |
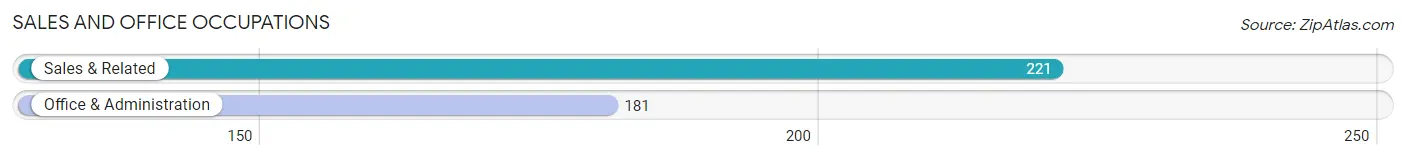
Sales and Office Occupations
The most common Sales and Office occupations in Moon Lake are Sales & Related (221 | 14.2%), and Office & Administration (181 | 11.7%).
Sales and Office Occupations by Sex
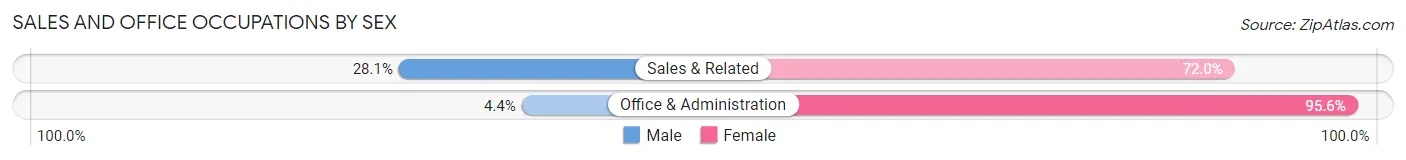
| Occupation | Male | Female |
| Sales & Related | 62 (28.1%) | 159 (72.0%) |
| Office & Administration | 8 (4.4%) | 173 (95.6%) |
| Total (Category) | 70 (17.4%) | 332 (82.6%) |
| Total (Overall) | 722 (46.5%) | 832 (53.5%) |
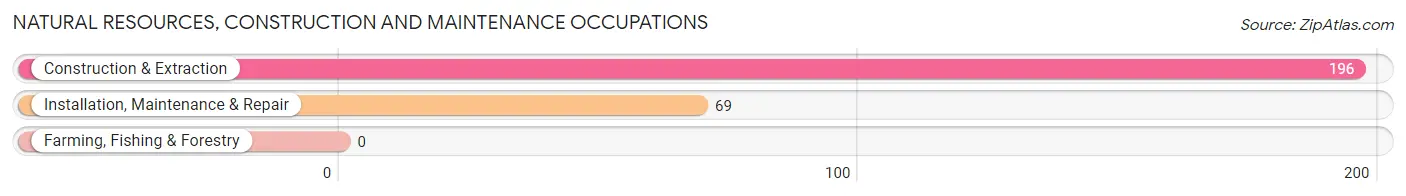
Natural Resources, Construction and Maintenance Occupations
The most common Natural Resources, Construction and Maintenance occupations in Moon Lake are Construction & Extraction (196 | 12.6%), and Installation, Maintenance & Repair (69 | 4.4%).
Natural Resources, Construction and Maintenance Occupations by Sex
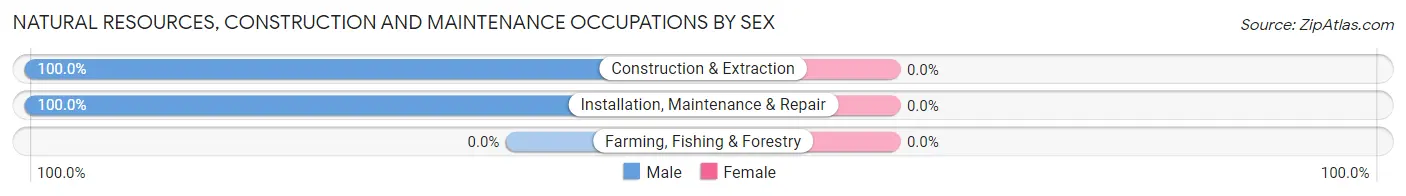
| Occupation | Male | Female |
| Farming, Fishing & Forestry | 0 (0.0%) | 0 (0.0%) |
| Construction & Extraction | 196 (100.0%) | 0 (0.0%) |
| Installation, Maintenance & Repair | 69 (100.0%) | 0 (0.0%) |
| Total (Category) | 265 (100.0%) | 0 (0.0%) |
| Total (Overall) | 722 (46.5%) | 832 (53.5%) |
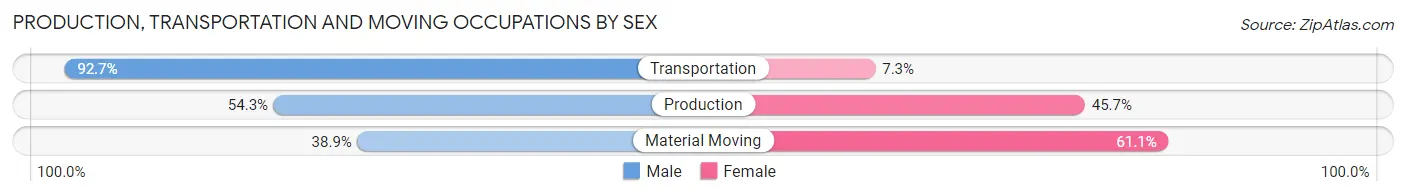
Production, Transportation and Moving Occupations
The most common Production, Transportation and Moving occupations in Moon Lake are Transportation (96 | 6.2%), Production (94 | 6.0%), and Material Moving (18 | 1.2%).
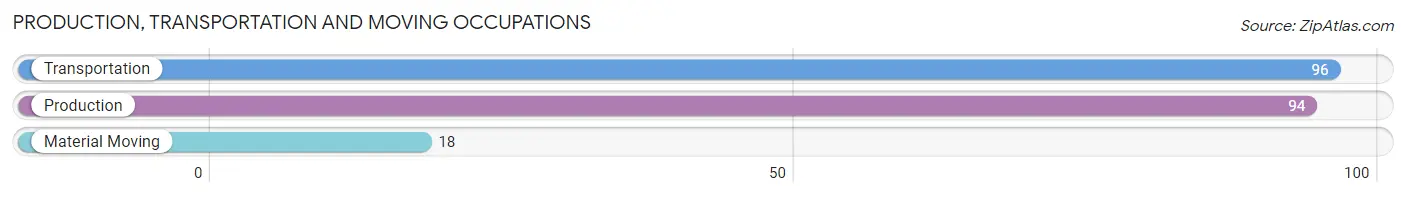
Production, Transportation and Moving Occupations by Sex
| Occupation | Male | Female |
| Production | 51 (54.3%) | 43 (45.7%) |
| Transportation | 89 (92.7%) | 7 (7.3%) |
| Material Moving | 7 (38.9%) | 11 (61.1%) |
| Total (Category) | 147 (70.7%) | 61 (29.3%) |
| Total (Overall) | 722 (46.5%) | 832 (53.5%) |
Employment Industries by Sex in Moon Lake
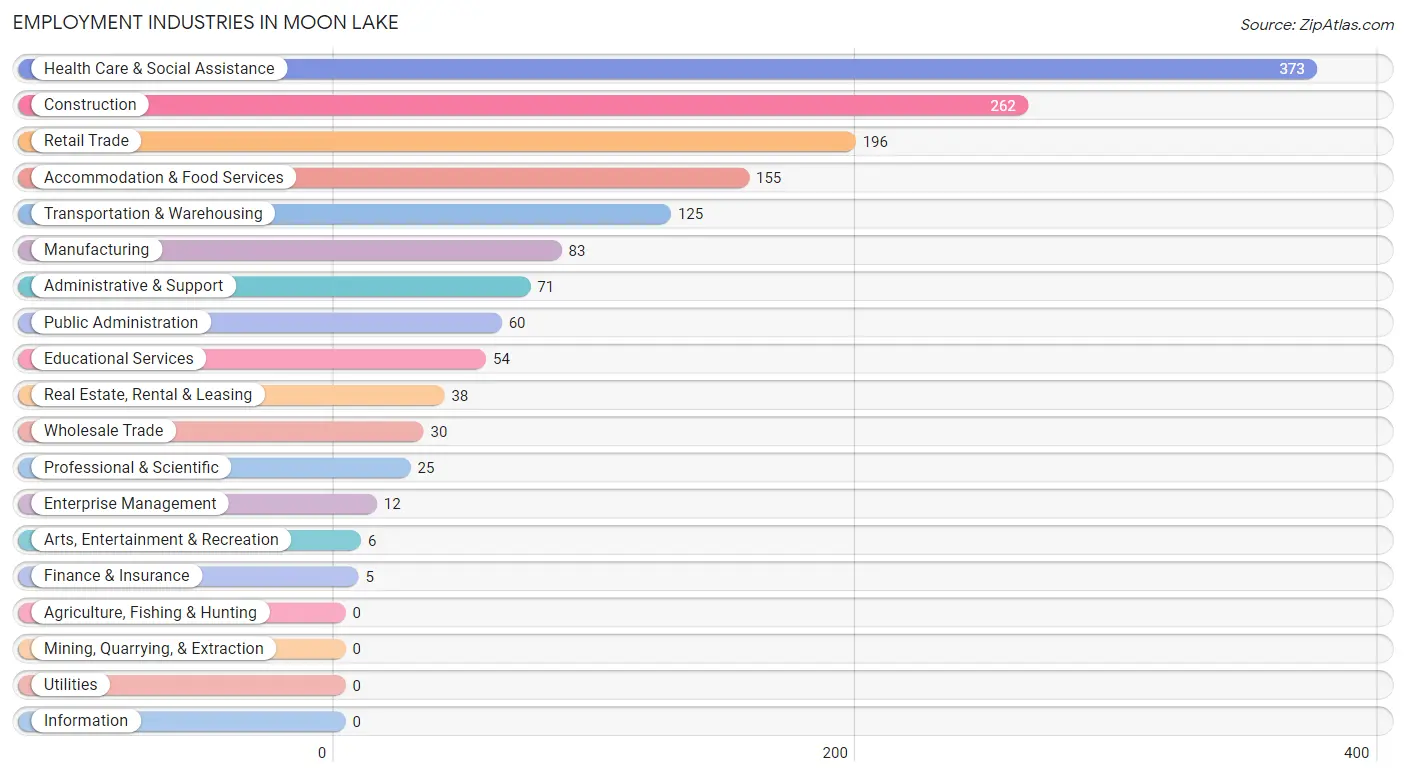
Employment Industries in Moon Lake
The major employment industries in Moon Lake include Health Care & Social Assistance (373 | 24.0%), Construction (262 | 16.9%), Retail Trade (196 | 12.6%), Accommodation & Food Services (155 | 10.0%), and Transportation & Warehousing (125 | 8.0%).
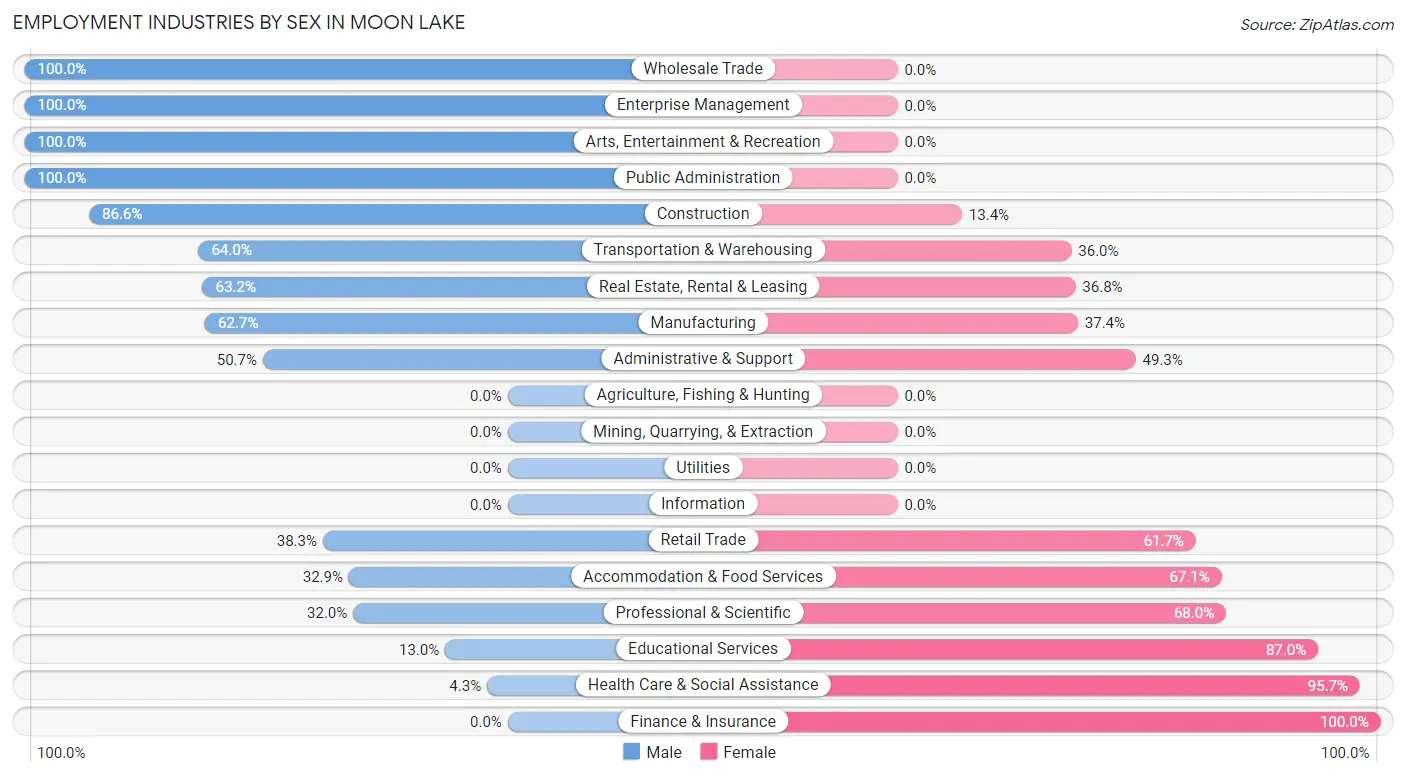
Employment Industries by Sex in Moon Lake
The Moon Lake industries that see more men than women are Wholesale Trade (100.0%), Enterprise Management (100.0%), and Arts, Entertainment & Recreation (100.0%), whereas the industries that tend to have a higher number of women are Finance & Insurance (100.0%), Health Care & Social Assistance (95.7%), and Educational Services (87.0%).
| Industry | Male | Female |
| Agriculture, Fishing & Hunting | 0 (0.0%) | 0 (0.0%) |
| Mining, Quarrying, & Extraction | 0 (0.0%) | 0 (0.0%) |
| Construction | 227 (86.6%) | 35 (13.4%) |
| Manufacturing | 52 (62.6%) | 31 (37.3%) |
| Wholesale Trade | 30 (100.0%) | 0 (0.0%) |
| Retail Trade | 75 (38.3%) | 121 (61.7%) |
| Transportation & Warehousing | 80 (64.0%) | 45 (36.0%) |
| Utilities | 0 (0.0%) | 0 (0.0%) |
| Information | 0 (0.0%) | 0 (0.0%) |
| Finance & Insurance | 0 (0.0%) | 5 (100.0%) |
| Real Estate, Rental & Leasing | 24 (63.2%) | 14 (36.8%) |
| Professional & Scientific | 8 (32.0%) | 17 (68.0%) |
| Enterprise Management | 12 (100.0%) | 0 (0.0%) |
| Administrative & Support | 36 (50.7%) | 35 (49.3%) |
| Educational Services | 7 (13.0%) | 47 (87.0%) |
| Health Care & Social Assistance | 16 (4.3%) | 357 (95.7%) |
| Arts, Entertainment & Recreation | 6 (100.0%) | 0 (0.0%) |
| Accommodation & Food Services | 51 (32.9%) | 104 (67.1%) |
| Public Administration | 60 (100.0%) | 0 (0.0%) |
| Total | 722 (46.5%) | 832 (53.5%) |
Education in Moon Lake
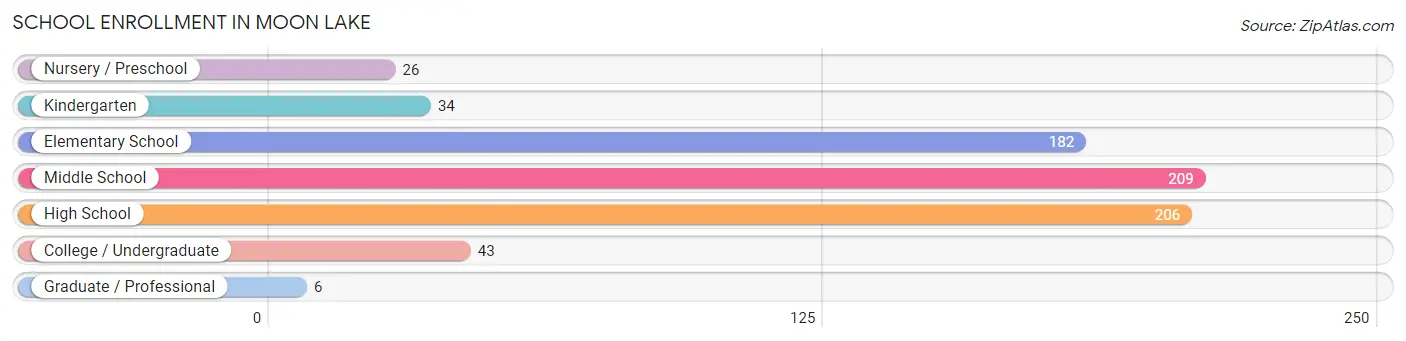
School Enrollment in Moon Lake
The most common levels of schooling among the 706 students in Moon Lake are middle school (209 | 29.6%), high school (206 | 29.2%), and elementary school (182 | 25.8%).
| School Level | # Students | % Students |
| Nursery / Preschool | 26 | 3.7% |
| Kindergarten | 34 | 4.8% |
| Elementary School | 182 | 25.8% |
| Middle School | 209 | 29.6% |
| High School | 206 | 29.2% |
| College / Undergraduate | 43 | 6.1% |
| Graduate / Professional | 6 | 0.9% |
| Total | 706 | 100.0% |
School Enrollment by Age by Funding Source in Moon Lake
Out of a total of 706 students who are enrolled in schools in Moon Lake, 190 (26.9%) attend a private institution, while the remaining 516 (73.1%) are enrolled in public schools. The age group of 18 to 19 year olds has the highest likelihood of being enrolled in private schools, with 18 (100.0% in the age bracket) enrolled. Conversely, the age group of 3 to 4 year olds has the lowest likelihood of being enrolled in a private school, with 26 (100.0% in the age bracket) attending a public institution.
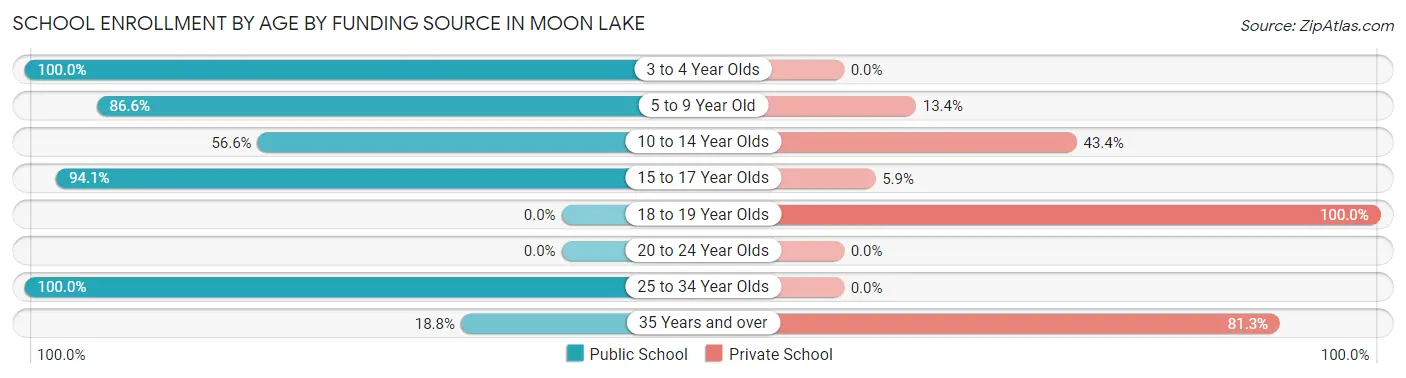
| Age Bracket | Public School | Private School |
| 3 to 4 Year Olds | 26 (100.0%) | 0 (0.0%) |
| 5 to 9 Year Old | 187 (86.6%) | 29 (13.4%) |
| 10 to 14 Year Olds | 141 (56.6%) | 108 (43.4%) |
| 15 to 17 Year Olds | 144 (94.1%) | 9 (5.9%) |
| 18 to 19 Year Olds | 0 (0.0%) | 18 (100.0%) |
| 20 to 24 Year Olds | 0 (0.0%) | 0 (0.0%) |
| 25 to 34 Year Olds | 12 (100.0%) | 0 (0.0%) |
| 35 Years and over | 6 (18.8%) | 26 (81.2%) |
| Total | 516 (73.1%) | 190 (26.9%) |
Educational Attainment by Field of Study in Moon Lake
Business (56 | 31.1%), social sciences (34 | 18.9%), education (31 | 17.2%), bio, nature & agricultural (19 | 10.6%), and science & technology (12 | 6.7%) are the most common fields of study among 180 individuals in Moon Lake who have obtained a bachelor's degree or higher.
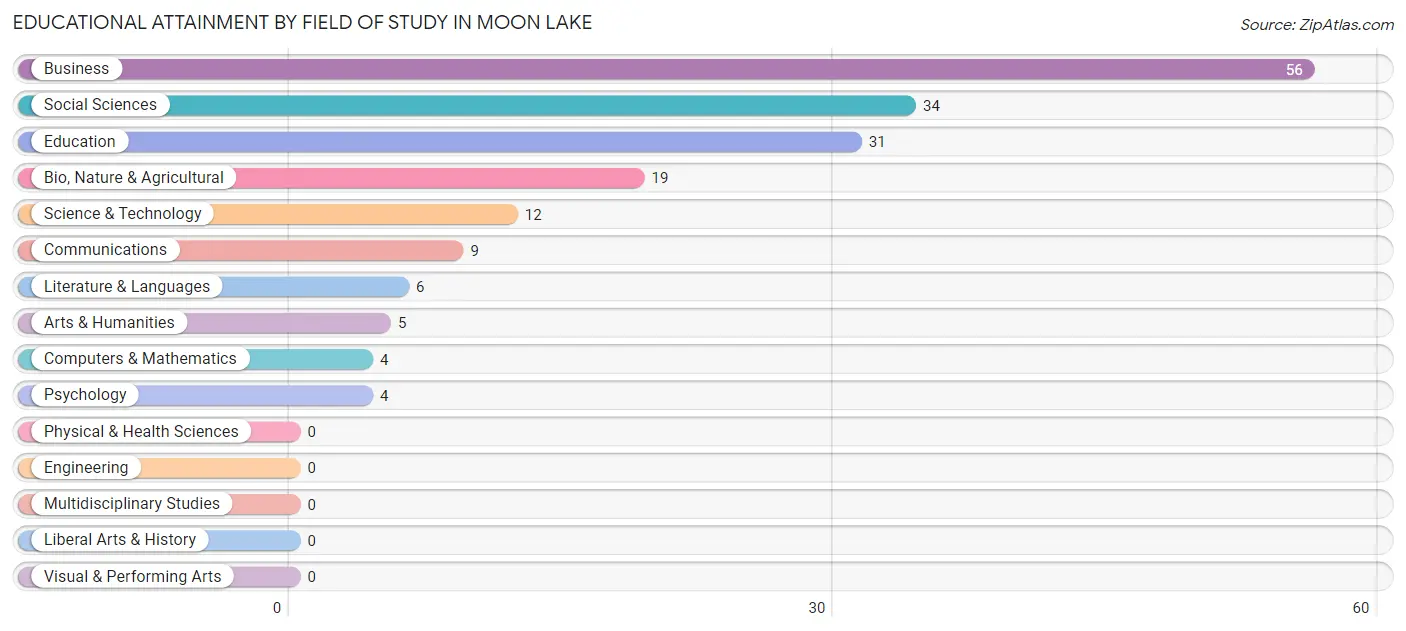
| Field of Study | # Graduates | % Graduates |
| Computers & Mathematics | 4 | 2.2% |
| Bio, Nature & Agricultural | 19 | 10.6% |
| Physical & Health Sciences | 0 | 0.0% |
| Psychology | 4 | 2.2% |
| Social Sciences | 34 | 18.9% |
| Engineering | 0 | 0.0% |
| Multidisciplinary Studies | 0 | 0.0% |
| Science & Technology | 12 | 6.7% |
| Business | 56 | 31.1% |
| Education | 31 | 17.2% |
| Literature & Languages | 6 | 3.3% |
| Liberal Arts & History | 0 | 0.0% |
| Visual & Performing Arts | 0 | 0.0% |
| Communications | 9 | 5.0% |
| Arts & Humanities | 5 | 2.8% |
| Total | 180 | 100.0% |
Transportation & Commute in Moon Lake
Vehicle Availability by Sex in Moon Lake
The most prevalent vehicle ownership categories in Moon Lake are males with 2 vehicles (298, accounting for 42.3%) and females with 2 vehicles (182, making up 36.7%).
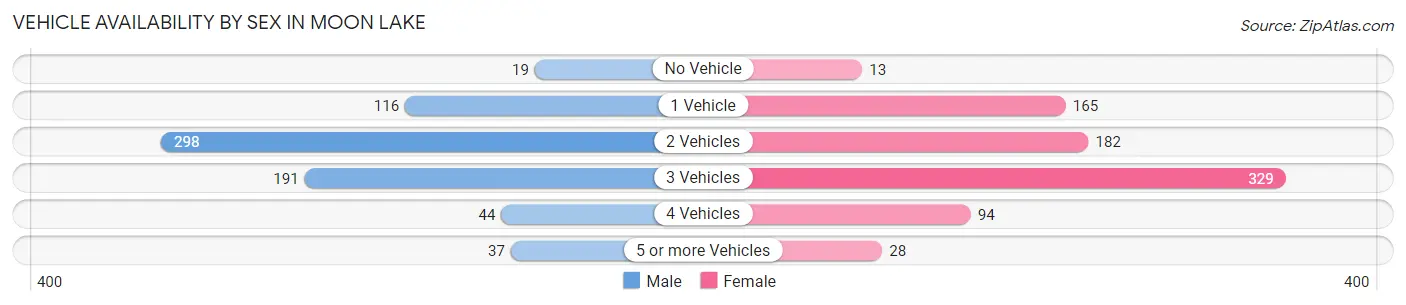
| Vehicles Available | Male | Female |
| No Vehicle | 19 (2.7%) | 13 (1.6%) |
| 1 Vehicle | 116 (16.5%) | 165 (20.3%) |
| 2 Vehicles | 298 (42.3%) | 182 (22.4%) |
| 3 Vehicles | 191 (27.1%) | 329 (40.6%) |
| 4 Vehicles | 44 (6.2%) | 94 (11.6%) |
| 5 or more Vehicles | 37 (5.2%) | 28 (3.5%) |
| Total | 705 (100.0%) | 811 (100.0%) |
Commute Time in Moon Lake
The most frequently occuring commute durations in Moon Lake are 20 to 24 minutes (309 commuters, 21.4%), 45 to 59 minutes (263 commuters, 18.2%), and 60 to 89 minutes (218 commuters, 15.1%).
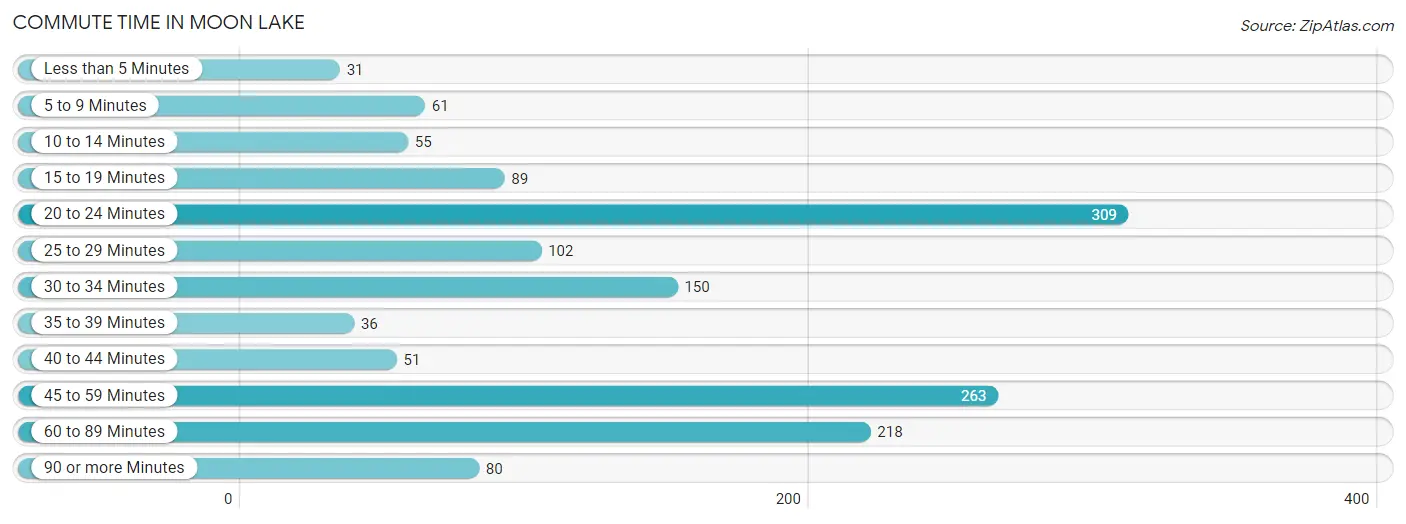
| Commute Time | # Commuters | % Commuters |
| Less than 5 Minutes | 31 | 2.1% |
| 5 to 9 Minutes | 61 | 4.2% |
| 10 to 14 Minutes | 55 | 3.8% |
| 15 to 19 Minutes | 89 | 6.2% |
| 20 to 24 Minutes | 309 | 21.4% |
| 25 to 29 Minutes | 102 | 7.1% |
| 30 to 34 Minutes | 150 | 10.4% |
| 35 to 39 Minutes | 36 | 2.5% |
| 40 to 44 Minutes | 51 | 3.5% |
| 45 to 59 Minutes | 263 | 18.2% |
| 60 to 89 Minutes | 218 | 15.1% |
| 90 or more Minutes | 80 | 5.5% |
Commute Time by Sex in Moon Lake
The most common commute times in Moon Lake are 60 to 89 minutes (173 commuters, 24.6%) for males and 20 to 24 minutes (220 commuters, 29.6%) for females.
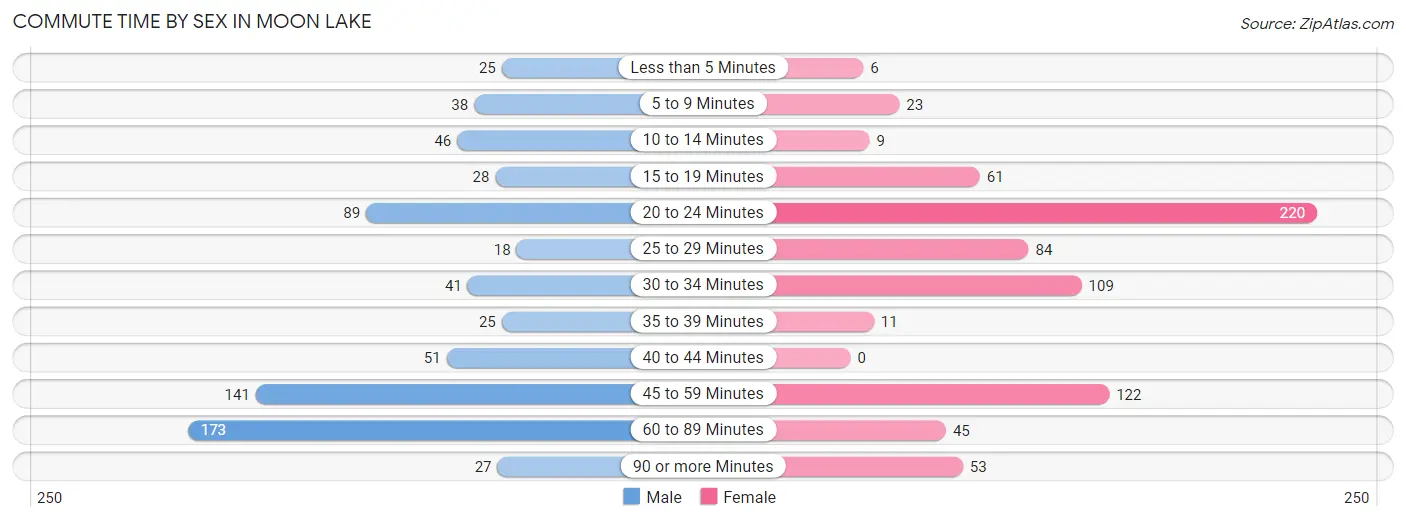
| Commute Time | Male | Female |
| Less than 5 Minutes | 25 (3.6%) | 6 (0.8%) |
| 5 to 9 Minutes | 38 (5.4%) | 23 (3.1%) |
| 10 to 14 Minutes | 46 (6.6%) | 9 (1.2%) |
| 15 to 19 Minutes | 28 (4.0%) | 61 (8.2%) |
| 20 to 24 Minutes | 89 (12.7%) | 220 (29.6%) |
| 25 to 29 Minutes | 18 (2.6%) | 84 (11.3%) |
| 30 to 34 Minutes | 41 (5.8%) | 109 (14.7%) |
| 35 to 39 Minutes | 25 (3.6%) | 11 (1.5%) |
| 40 to 44 Minutes | 51 (7.3%) | 0 (0.0%) |
| 45 to 59 Minutes | 141 (20.1%) | 122 (16.4%) |
| 60 to 89 Minutes | 173 (24.6%) | 45 (6.1%) |
| 90 or more Minutes | 27 (3.8%) | 53 (7.1%) |
Time of Departure to Work by Sex in Moon Lake
The most frequent times of departure to work in Moon Lake are 12:00 PM to 3:59 PM (151, 21.5%) for males and 6:00 AM to 6:29 AM (110, 14.8%) for females.
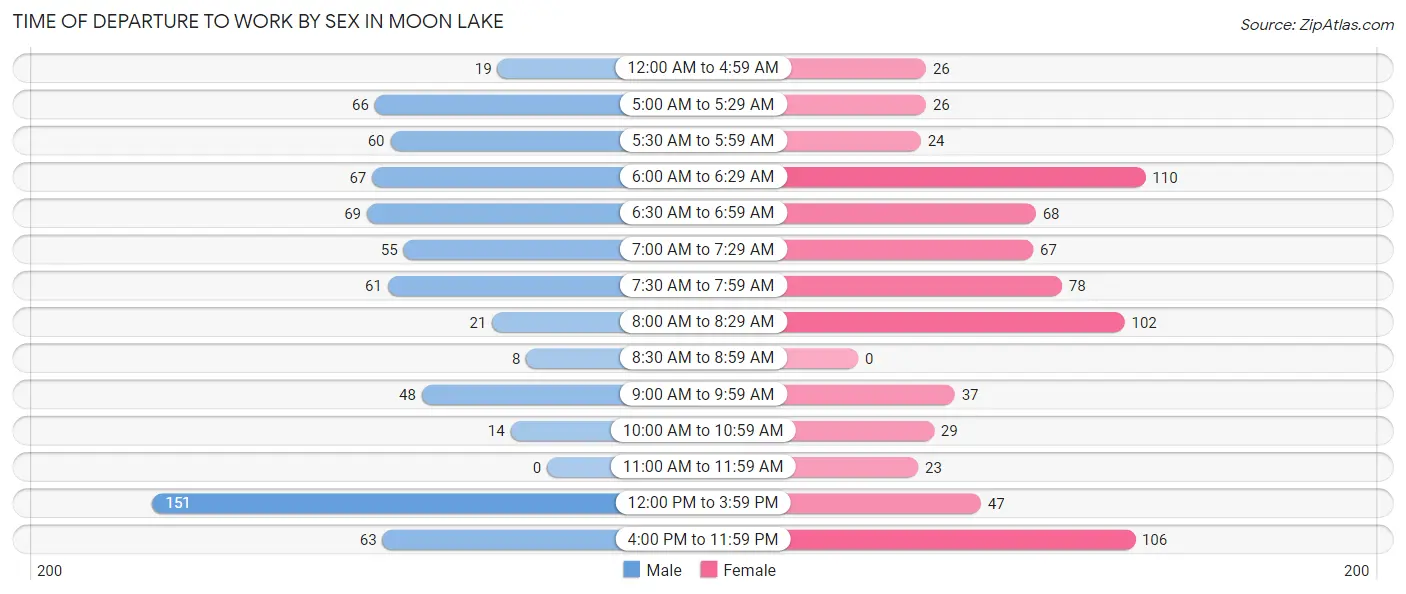
| Time of Departure | Male | Female |
| 12:00 AM to 4:59 AM | 19 (2.7%) | 26 (3.5%) |
| 5:00 AM to 5:29 AM | 66 (9.4%) | 26 (3.5%) |
| 5:30 AM to 5:59 AM | 60 (8.6%) | 24 (3.2%) |
| 6:00 AM to 6:29 AM | 67 (9.5%) | 110 (14.8%) |
| 6:30 AM to 6:59 AM | 69 (9.8%) | 68 (9.1%) |
| 7:00 AM to 7:29 AM | 55 (7.8%) | 67 (9.0%) |
| 7:30 AM to 7:59 AM | 61 (8.7%) | 78 (10.5%) |
| 8:00 AM to 8:29 AM | 21 (3.0%) | 102 (13.7%) |
| 8:30 AM to 8:59 AM | 8 (1.1%) | 0 (0.0%) |
| 9:00 AM to 9:59 AM | 48 (6.8%) | 37 (5.0%) |
| 10:00 AM to 10:59 AM | 14 (2.0%) | 29 (3.9%) |
| 11:00 AM to 11:59 AM | 0 (0.0%) | 23 (3.1%) |
| 12:00 PM to 3:59 PM | 151 (21.5%) | 47 (6.3%) |
| 4:00 PM to 11:59 PM | 63 (9.0%) | 106 (14.3%) |
| Total | 702 (100.0%) | 743 (100.0%) |
Housing Occupancy in Moon Lake
Occupancy by Ownership in Moon Lake
Of the total 1,603 dwellings in Moon Lake, owner-occupied units account for 1,318 (82.2%), while renter-occupied units make up 285 (17.8%).
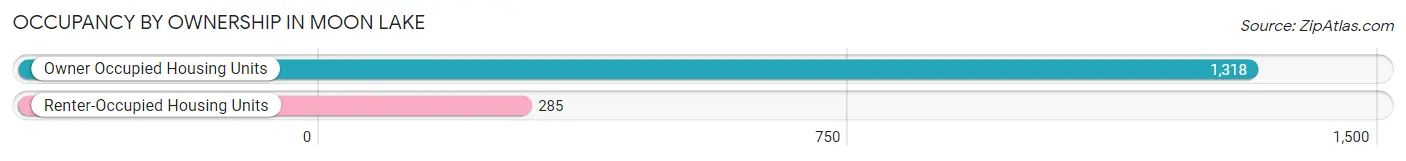
| Occupancy | # Housing Units | % Housing Units |
| Owner Occupied Housing Units | 1,318 | 82.2% |
| Renter-Occupied Housing Units | 285 | 17.8% |
| Total Occupied Housing Units | 1,603 | 100.0% |
Occupancy by Household Size in Moon Lake
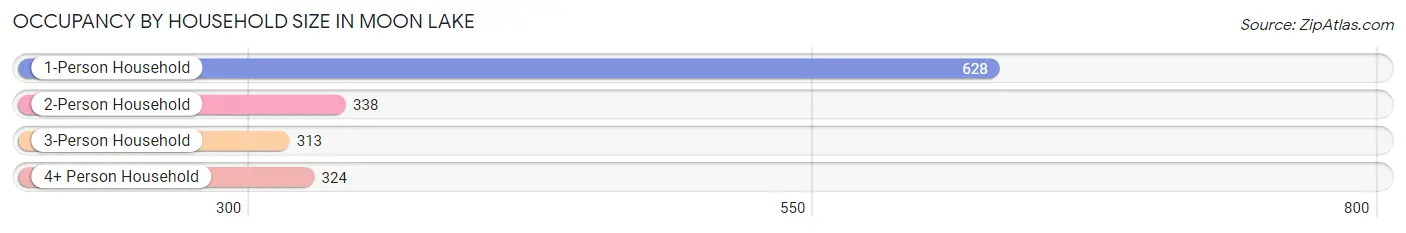
| Household Size | # Housing Units | % Housing Units |
| 1-Person Household | 628 | 39.2% |
| 2-Person Household | 338 | 21.1% |
| 3-Person Household | 313 | 19.5% |
| 4+ Person Household | 324 | 20.2% |
| Total Housing Units | 1,603 | 100.0% |
Occupancy by Ownership by Household Size in Moon Lake
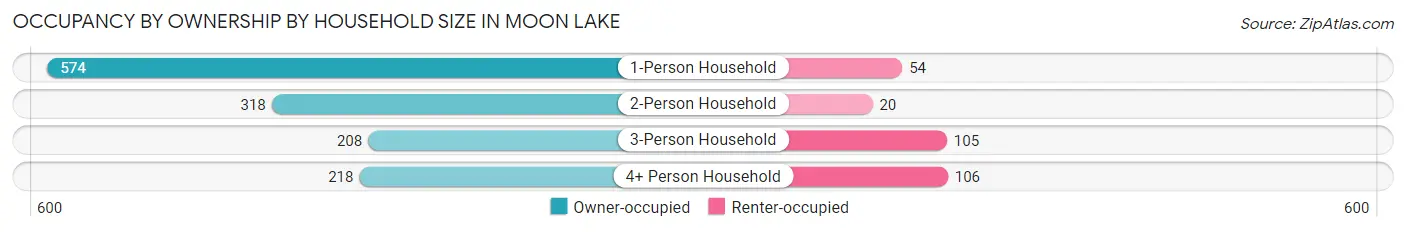
| Household Size | Owner-occupied | Renter-occupied |
| 1-Person Household | 574 (91.4%) | 54 (8.6%) |
| 2-Person Household | 318 (94.1%) | 20 (5.9%) |
| 3-Person Household | 208 (66.4%) | 105 (33.6%) |
| 4+ Person Household | 218 (67.3%) | 106 (32.7%) |
| Total Housing Units | 1,318 (82.2%) | 285 (17.8%) |
Occupancy by Educational Attainment in Moon Lake
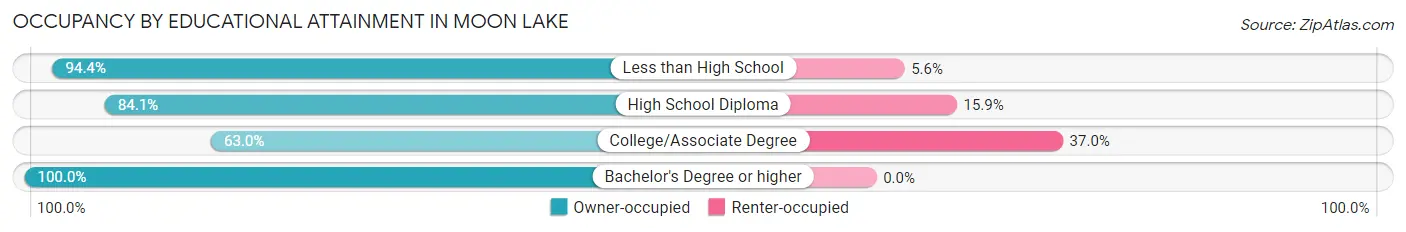
| Household Size | Owner-occupied | Renter-occupied |
| Less than High School | 323 (94.4%) | 19 (5.6%) |
| High School Diploma | 707 (84.1%) | 134 (15.9%) |
| College/Associate Degree | 225 (63.0%) | 132 (37.0%) |
| Bachelor's Degree or higher | 63 (100.0%) | 0 (0.0%) |
Occupancy by Age of Householder in Moon Lake
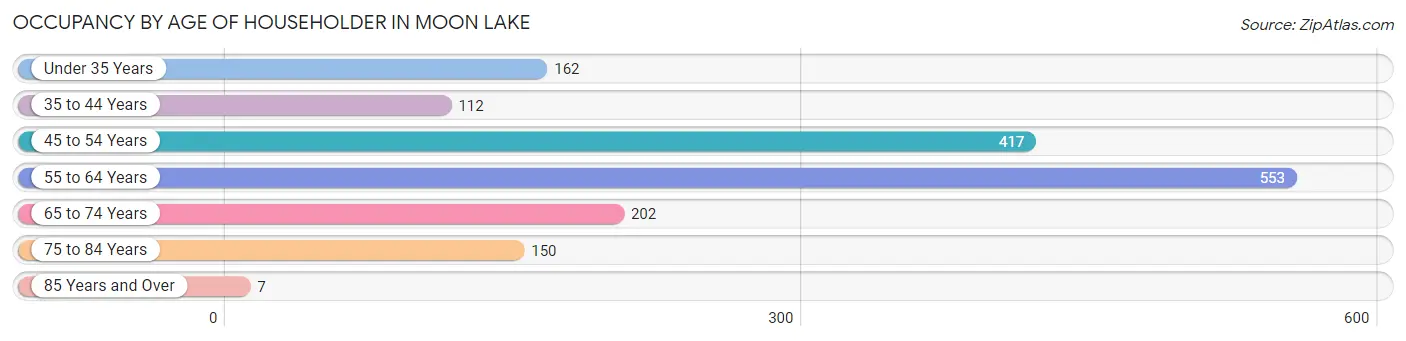
| Age Bracket | # Households | % Households |
| Under 35 Years | 162 | 10.1% |
| 35 to 44 Years | 112 | 7.0% |
| 45 to 54 Years | 417 | 26.0% |
| 55 to 64 Years | 553 | 34.5% |
| 65 to 74 Years | 202 | 12.6% |
| 75 to 84 Years | 150 | 9.4% |
| 85 Years and Over | 7 | 0.4% |
| Total | 1,603 | 100.0% |
Housing Finances in Moon Lake
Median Income by Occupancy in Moon Lake
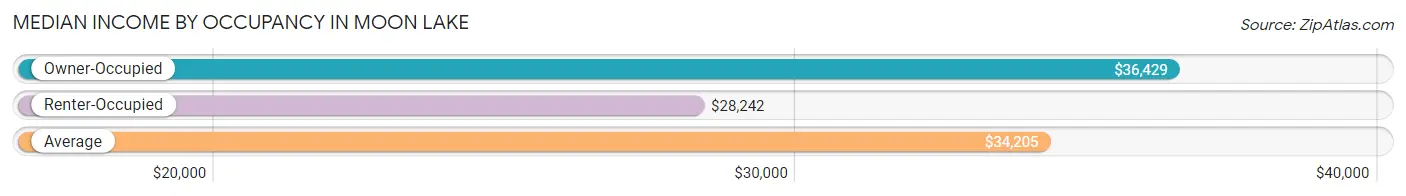
| Occupancy Type | # Households | Median Income |
| Owner-Occupied | 1,318 (82.2%) | $36,429 |
| Renter-Occupied | 285 (17.8%) | $28,242 |
| Average | 1,603 (100.0%) | $34,205 |
Occupancy by Householder Income Bracket in Moon Lake
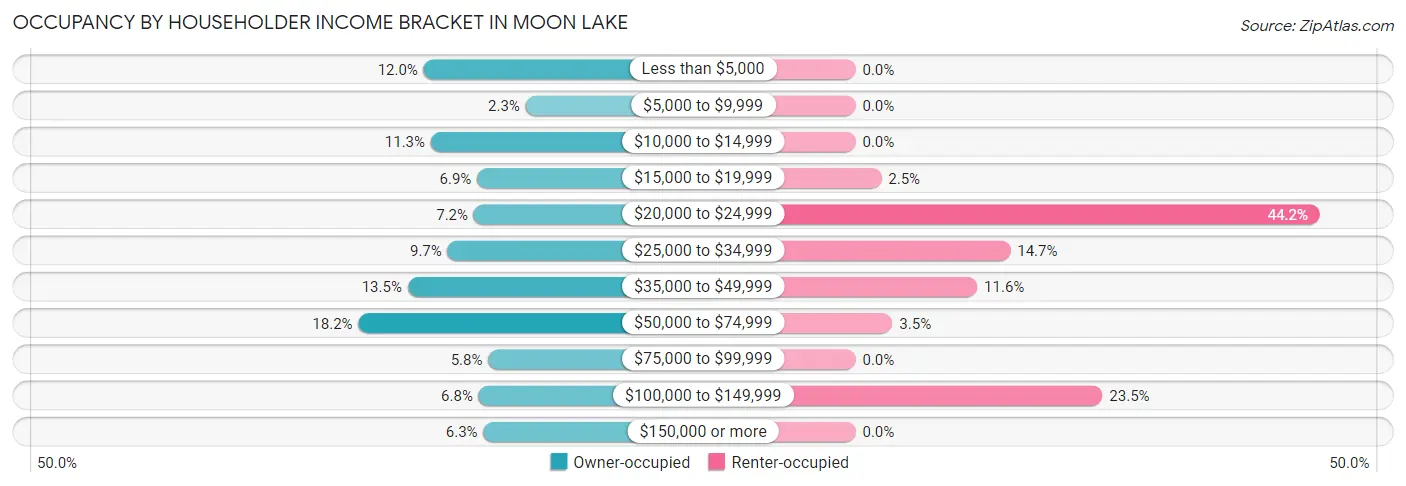
| Income Bracket | Owner-occupied | Renter-occupied |
| Less than $5,000 | 158 (12.0%) | 0 (0.0%) |
| $5,000 to $9,999 | 30 (2.3%) | 0 (0.0%) |
| $10,000 to $14,999 | 149 (11.3%) | 0 (0.0%) |
| $15,000 to $19,999 | 91 (6.9%) | 7 (2.5%) |
| $20,000 to $24,999 | 95 (7.2%) | 126 (44.2%) |
| $25,000 to $34,999 | 128 (9.7%) | 42 (14.7%) |
| $35,000 to $49,999 | 178 (13.5%) | 33 (11.6%) |
| $50,000 to $74,999 | 240 (18.2%) | 10 (3.5%) |
| $75,000 to $99,999 | 77 (5.8%) | 0 (0.0%) |
| $100,000 to $149,999 | 89 (6.8%) | 67 (23.5%) |
| $150,000 or more | 83 (6.3%) | 0 (0.0%) |
| Total | 1,318 (100.0%) | 285 (100.0%) |
Monthly Housing Cost Tiers in Moon Lake
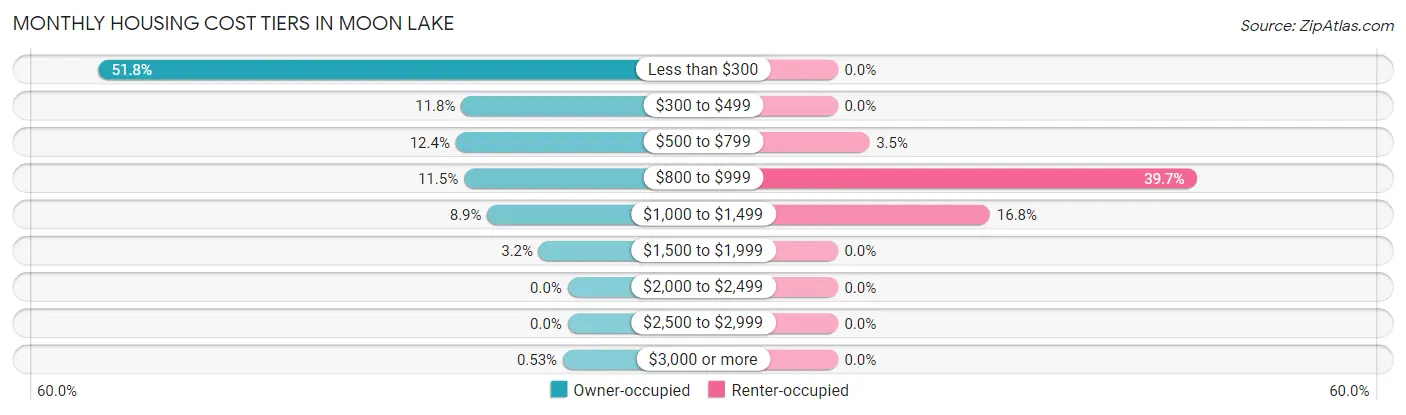
| Monthly Cost | Owner-occupied | Renter-occupied |
| Less than $300 | 683 (51.8%) | 0 (0.0%) |
| $300 to $499 | 155 (11.8%) | 0 (0.0%) |
| $500 to $799 | 163 (12.4%) | 10 (3.5%) |
| $800 to $999 | 151 (11.5%) | 113 (39.7%) |
| $1,000 to $1,499 | 117 (8.9%) | 48 (16.8%) |
| $1,500 to $1,999 | 42 (3.2%) | 0 (0.0%) |
| $2,000 to $2,499 | 0 (0.0%) | 0 (0.0%) |
| $2,500 to $2,999 | 0 (0.0%) | 0 (0.0%) |
| $3,000 or more | 7 (0.5%) | 0 (0.0%) |
| Total | 1,318 (100.0%) | 285 (100.0%) |
Physical Housing Characteristics in Moon Lake
Housing Structures in Moon Lake
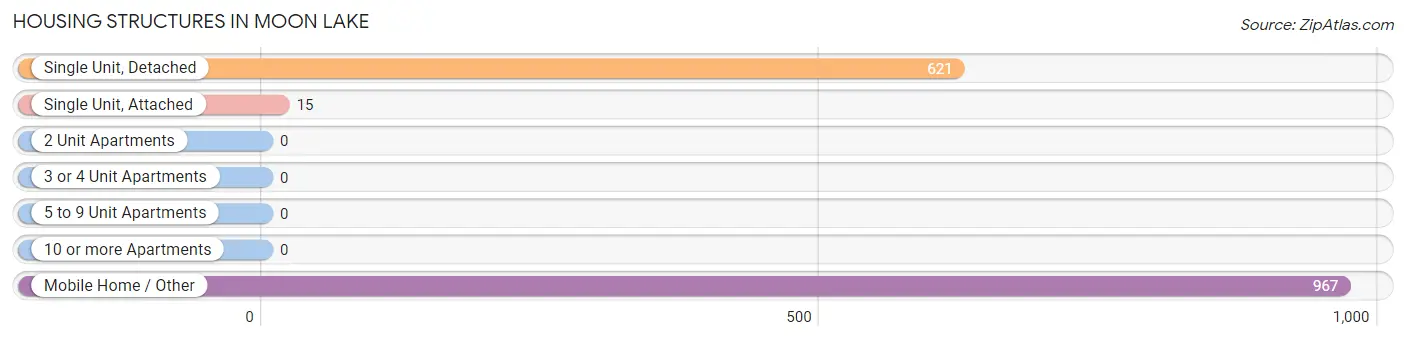
| Structure Type | # Housing Units | % Housing Units |
| Single Unit, Detached | 621 | 38.7% |
| Single Unit, Attached | 15 | 0.9% |
| 2 Unit Apartments | 0 | 0.0% |
| 3 or 4 Unit Apartments | 0 | 0.0% |
| 5 to 9 Unit Apartments | 0 | 0.0% |
| 10 or more Apartments | 0 | 0.0% |
| Mobile Home / Other | 967 | 60.3% |
| Total | 1,603 | 100.0% |
Housing Structures by Occupancy in Moon Lake
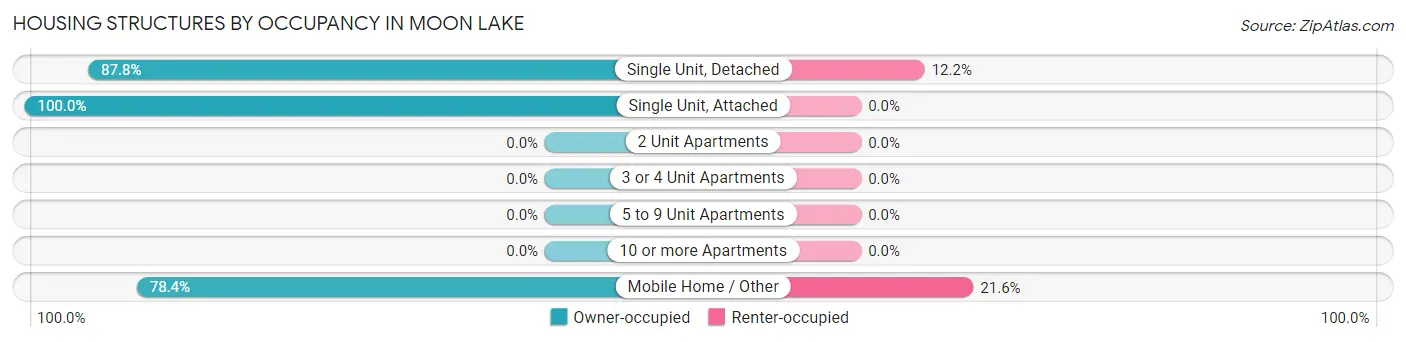
| Structure Type | Owner-occupied | Renter-occupied |
| Single Unit, Detached | 545 (87.8%) | 76 (12.2%) |
| Single Unit, Attached | 15 (100.0%) | 0 (0.0%) |
| 2 Unit Apartments | 0 (0.0%) | 0 (0.0%) |
| 3 or 4 Unit Apartments | 0 (0.0%) | 0 (0.0%) |
| 5 to 9 Unit Apartments | 0 (0.0%) | 0 (0.0%) |
| 10 or more Apartments | 0 (0.0%) | 0 (0.0%) |
| Mobile Home / Other | 758 (78.4%) | 209 (21.6%) |
| Total | 1,318 (82.2%) | 285 (17.8%) |
Housing Structures by Number of Rooms in Moon Lake
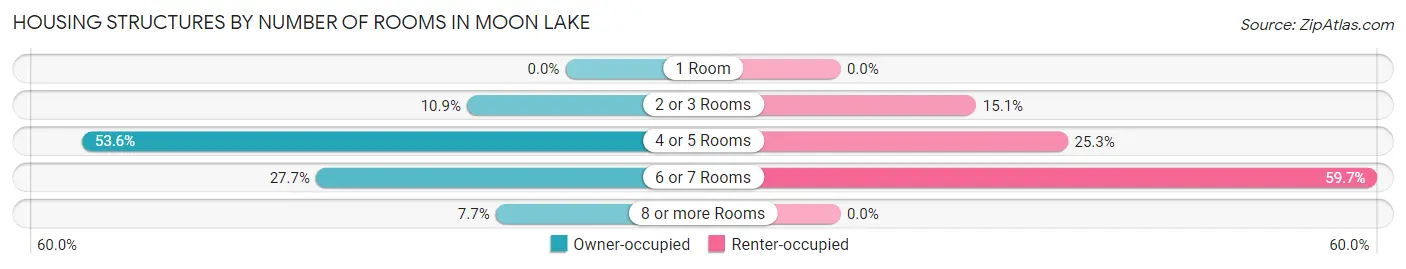
| Number of Rooms | Owner-occupied | Renter-occupied |
| 1 Room | 0 (0.0%) | 0 (0.0%) |
| 2 or 3 Rooms | 144 (10.9%) | 43 (15.1%) |
| 4 or 5 Rooms | 707 (53.6%) | 72 (25.3%) |
| 6 or 7 Rooms | 365 (27.7%) | 170 (59.7%) |
| 8 or more Rooms | 102 (7.7%) | 0 (0.0%) |
| Total | 1,318 (100.0%) | 285 (100.0%) |
Housing Structure by Heating Type in Moon Lake
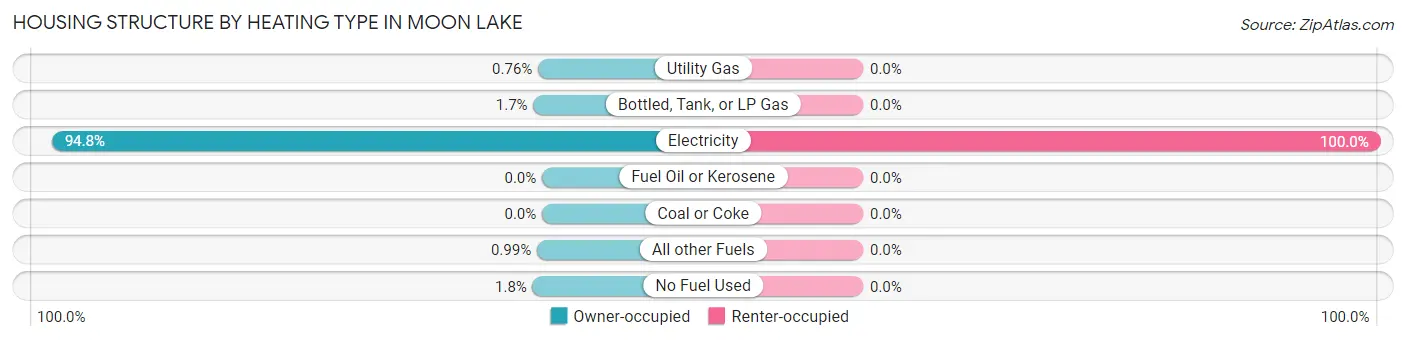
| Heating Type | Owner-occupied | Renter-occupied |
| Utility Gas | 10 (0.8%) | 0 (0.0%) |
| Bottled, Tank, or LP Gas | 22 (1.7%) | 0 (0.0%) |
| Electricity | 1,249 (94.8%) | 285 (100.0%) |
| Fuel Oil or Kerosene | 0 (0.0%) | 0 (0.0%) |
| Coal or Coke | 0 (0.0%) | 0 (0.0%) |
| All other Fuels | 13 (1.0%) | 0 (0.0%) |
| No Fuel Used | 24 (1.8%) | 0 (0.0%) |
| Total | 1,318 (100.0%) | 285 (100.0%) |
Household Vehicle Usage in Moon Lake
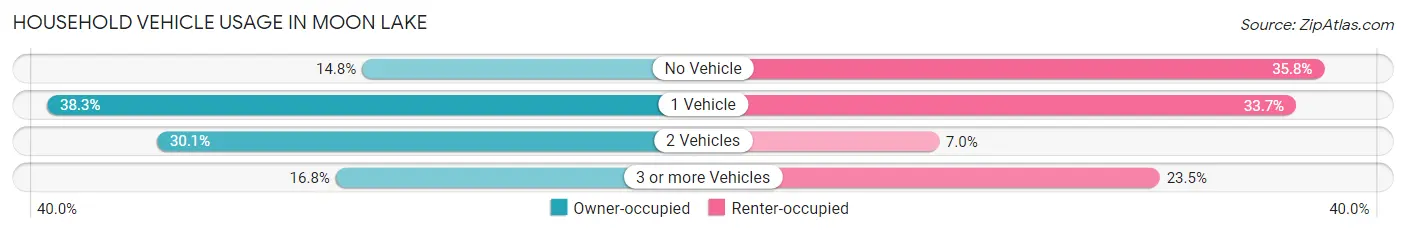
| Vehicles per Household | Owner-occupied | Renter-occupied |
| No Vehicle | 195 (14.8%) | 102 (35.8%) |
| 1 Vehicle | 505 (38.3%) | 96 (33.7%) |
| 2 Vehicles | 397 (30.1%) | 20 (7.0%) |
| 3 or more Vehicles | 221 (16.8%) | 67 (23.5%) |
| Total | 1,318 (100.0%) | 285 (100.0%) |
Real Estate & Mortgages in Moon Lake
Real Estate and Mortgage Overview in Moon Lake
| Characteristic | Without Mortgage | With Mortgage |
| Housing Units | 849 | 469 |
| Median Property Value | $39,600 | $88,200 |
| Median Household Income | $33,504 | $20 |
| Monthly Housing Costs | $193 | $7 |
| Real Estate Taxes | $395 | $69 |
Property Value by Mortgage Status in Moon Lake
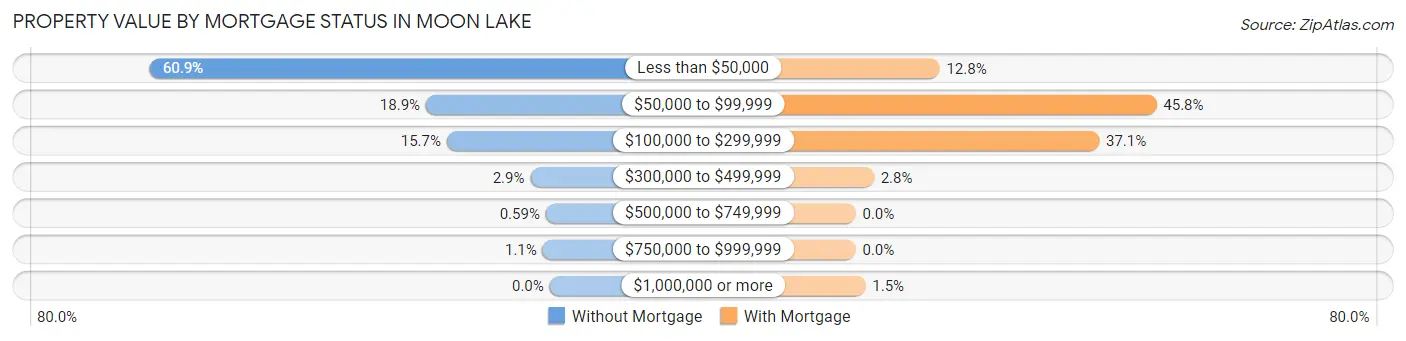
| Property Value | Without Mortgage | With Mortgage |
| Less than $50,000 | 517 (60.9%) | 60 (12.8%) |
| $50,000 to $99,999 | 160 (18.9%) | 215 (45.8%) |
| $100,000 to $299,999 | 133 (15.7%) | 174 (37.1%) |
| $300,000 to $499,999 | 25 (2.9%) | 13 (2.8%) |
| $500,000 to $749,999 | 5 (0.6%) | 0 (0.0%) |
| $750,000 to $999,999 | 9 (1.1%) | 0 (0.0%) |
| $1,000,000 or more | 0 (0.0%) | 7 (1.5%) |
| Total | 849 (100.0%) | 469 (100.0%) |
Household Income by Mortgage Status in Moon Lake
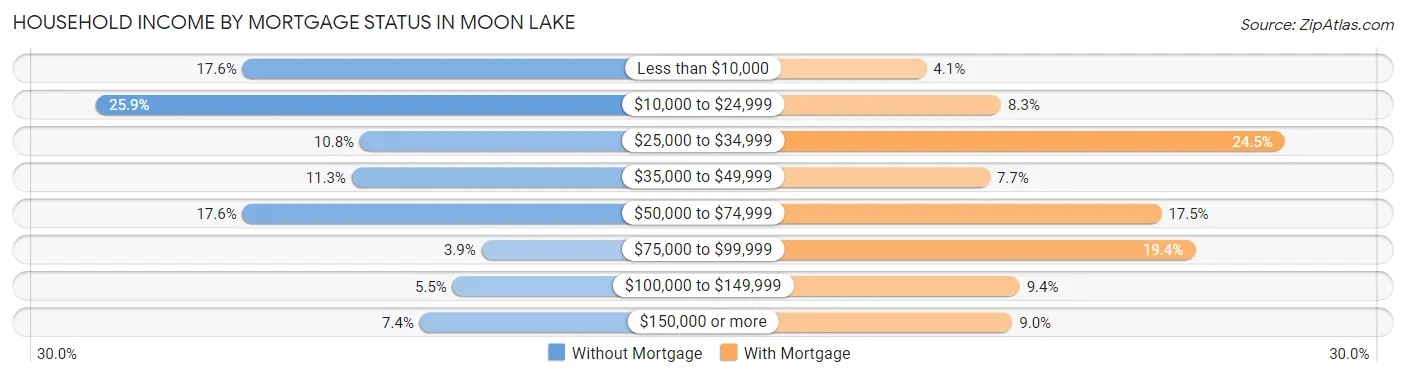
| Household Income | Without Mortgage | With Mortgage |
| Less than $10,000 | 149 (17.5%) | 19 (4.1%) |
| $10,000 to $24,999 | 220 (25.9%) | 39 (8.3%) |
| $25,000 to $34,999 | 92 (10.8%) | 115 (24.5%) |
| $35,000 to $49,999 | 96 (11.3%) | 36 (7.7%) |
| $50,000 to $74,999 | 149 (17.5%) | 82 (17.5%) |
| $75,000 to $99,999 | 33 (3.9%) | 91 (19.4%) |
| $100,000 to $149,999 | 47 (5.5%) | 44 (9.4%) |
| $150,000 or more | 63 (7.4%) | 42 (9.0%) |
| Total | 849 (100.0%) | 469 (100.0%) |
Property Value to Household Income Ratio in Moon Lake
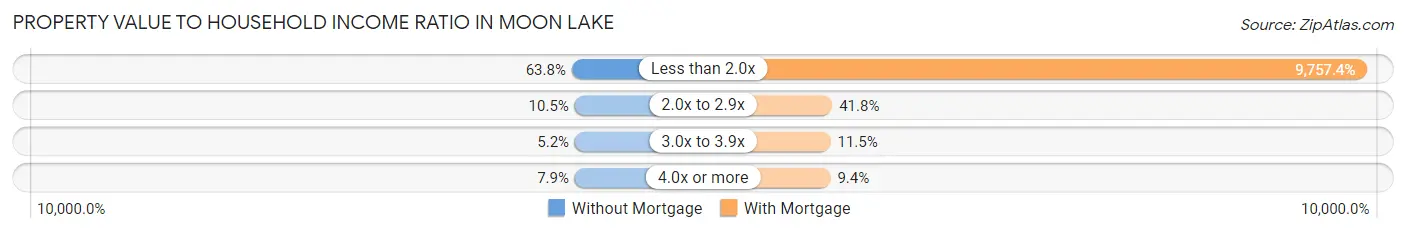
| Value-to-Income Ratio | Without Mortgage | With Mortgage |
| Less than 2.0x | 542 (63.8%) | 45,762 (9,757.4%) |
| 2.0x to 2.9x | 89 (10.5%) | 196 (41.8%) |
| 3.0x to 3.9x | 44 (5.2%) | 54 (11.5%) |
| 4.0x or more | 67 (7.9%) | 44 (9.4%) |
| Total | 849 (100.0%) | 469 (100.0%) |
Real Estate Taxes by Mortgage Status in Moon Lake
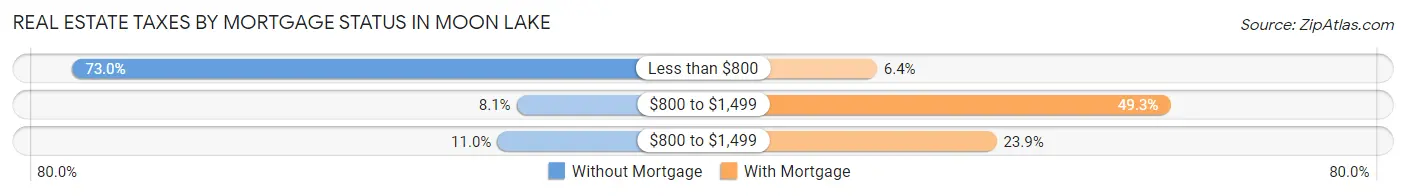
| Property Taxes | Without Mortgage | With Mortgage |
| Less than $800 | 620 (73.0%) | 30 (6.4%) |
| $800 to $1,499 | 69 (8.1%) | 231 (49.2%) |
| $800 to $1,499 | 93 (11.0%) | 112 (23.9%) |
| Total | 849 (100.0%) | 469 (100.0%) |
Health & Disability in Moon Lake
Health Insurance Coverage by Age in Moon Lake
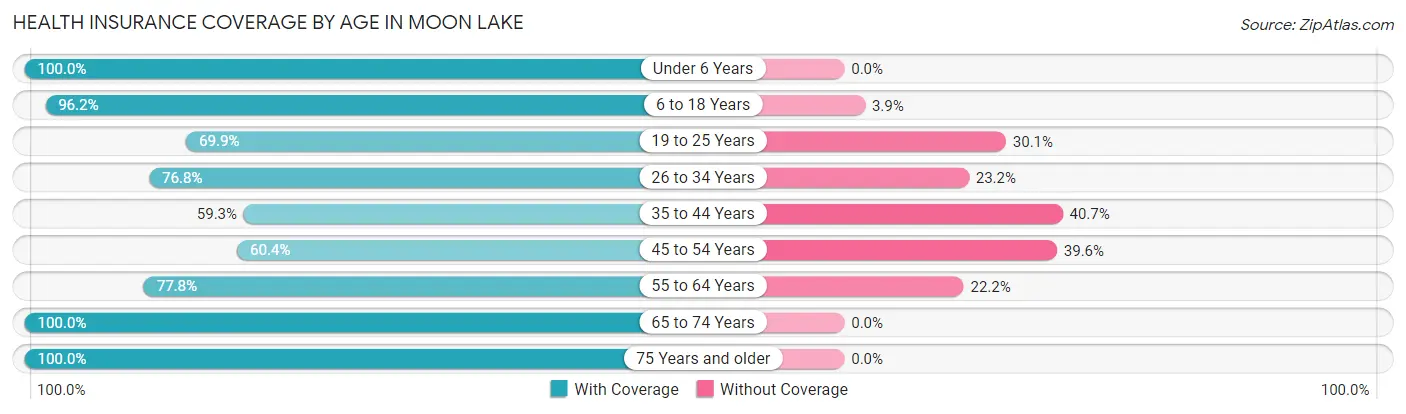
| Age Bracket | With Coverage | Without Coverage |
| Under 6 Years | 221 (100.0%) | 0 (0.0%) |
| 6 to 18 Years | 574 (96.2%) | 23 (3.8%) |
| 19 to 25 Years | 160 (69.9%) | 69 (30.1%) |
| 26 to 34 Years | 569 (76.8%) | 172 (23.2%) |
| 35 to 44 Years | 220 (59.3%) | 151 (40.7%) |
| 45 to 54 Years | 437 (60.4%) | 287 (39.6%) |
| 55 to 64 Years | 584 (77.8%) | 167 (22.2%) |
| 65 to 74 Years | 363 (100.0%) | 0 (0.0%) |
| 75 Years and older | 217 (100.0%) | 0 (0.0%) |
| Total | 3,345 (79.4%) | 869 (20.6%) |
Health Insurance Coverage by Citizenship Status in Moon Lake
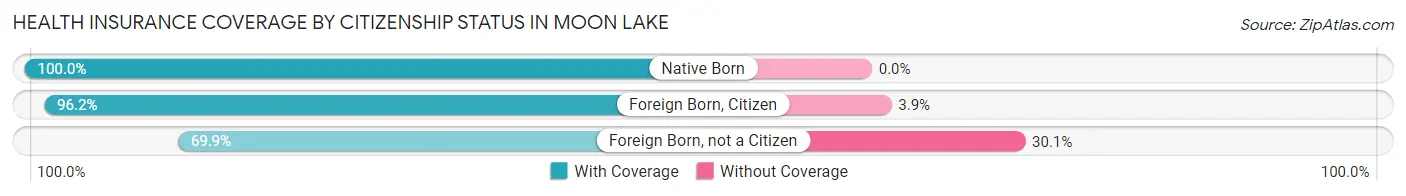
| Citizenship Status | With Coverage | Without Coverage |
| Native Born | 221 (100.0%) | 0 (0.0%) |
| Foreign Born, Citizen | 574 (96.2%) | 23 (3.8%) |
| Foreign Born, not a Citizen | 160 (69.9%) | 69 (30.1%) |
Health Insurance Coverage by Household Income in Moon Lake
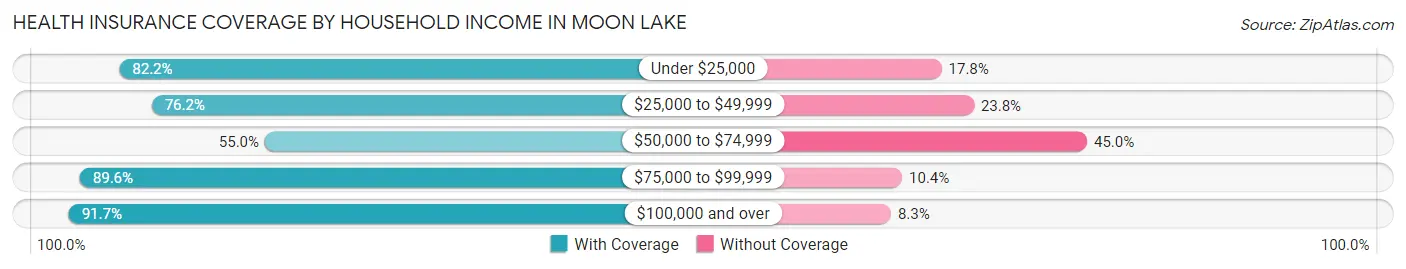
| Household Income | With Coverage | Without Coverage |
| Under $25,000 | 1,199 (82.2%) | 259 (17.8%) |
| $25,000 to $49,999 | 579 (76.2%) | 181 (23.8%) |
| $50,000 to $74,999 | 386 (55.0%) | 316 (45.0%) |
| $75,000 to $99,999 | 251 (89.6%) | 29 (10.4%) |
| $100,000 and over | 930 (91.7%) | 84 (8.3%) |
Public vs Private Health Insurance Coverage by Age in Moon Lake
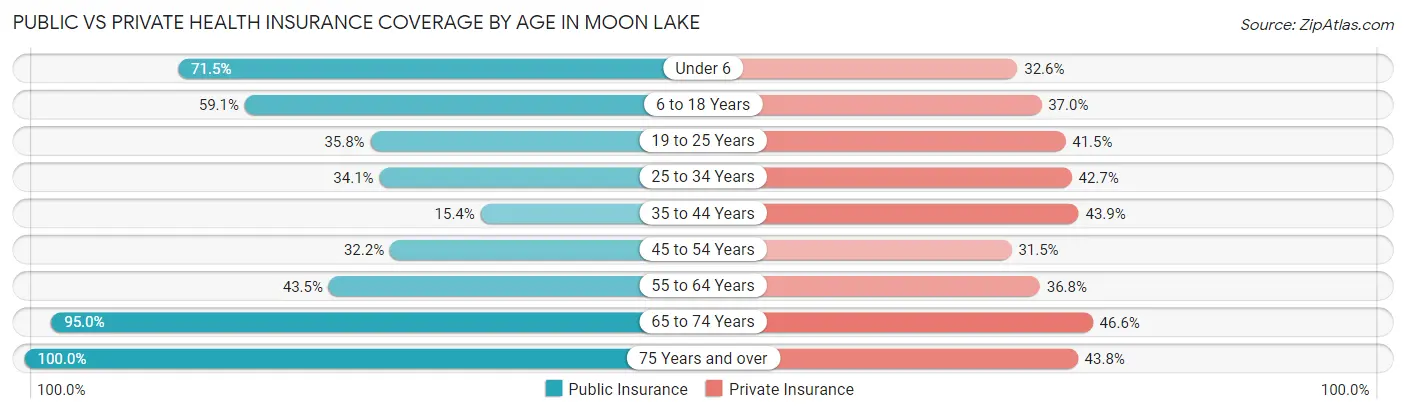
| Age Bracket | Public Insurance | Private Insurance |
| Under 6 | 158 (71.5%) | 72 (32.6%) |
| 6 to 18 Years | 353 (59.1%) | 221 (37.0%) |
| 19 to 25 Years | 82 (35.8%) | 95 (41.5%) |
| 25 to 34 Years | 253 (34.1%) | 316 (42.6%) |
| 35 to 44 Years | 57 (15.4%) | 163 (43.9%) |
| 45 to 54 Years | 233 (32.2%) | 228 (31.5%) |
| 55 to 64 Years | 327 (43.5%) | 276 (36.7%) |
| 65 to 74 Years | 345 (95.0%) | 169 (46.6%) |
| 75 Years and over | 217 (100.0%) | 95 (43.8%) |
| Total | 2,025 (48.0%) | 1,635 (38.8%) |
Disability Status by Sex by Age in Moon Lake
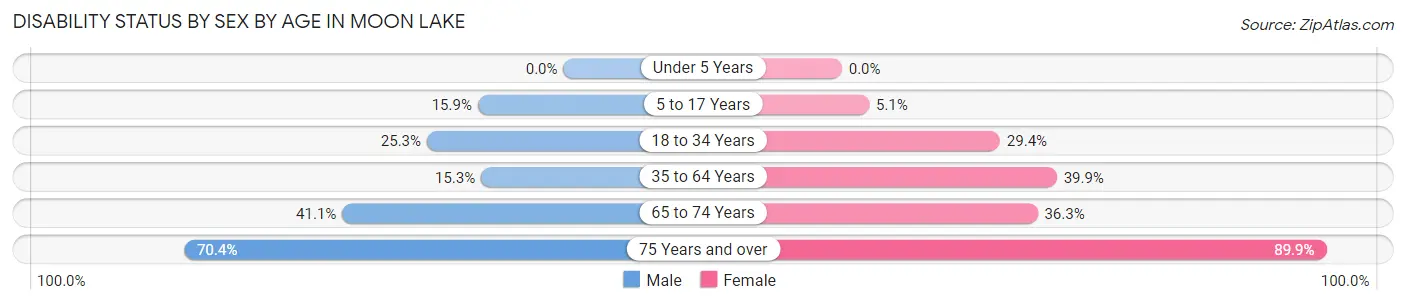
| Age Bracket | Male | Female |
| Under 5 Years | 0 (0.0%) | 0 (0.0%) |
| 5 to 17 Years | 48 (15.9%) | 16 (5.1%) |
| 18 to 34 Years | 96 (25.3%) | 182 (29.3%) |
| 35 to 64 Years | 140 (15.3%) | 371 (39.9%) |
| 65 to 74 Years | 62 (41.1%) | 77 (36.3%) |
| 75 Years and over | 69 (70.4%) | 107 (89.9%) |
Disability Class by Sex by Age in Moon Lake
Disability Class: Hearing Difficulty
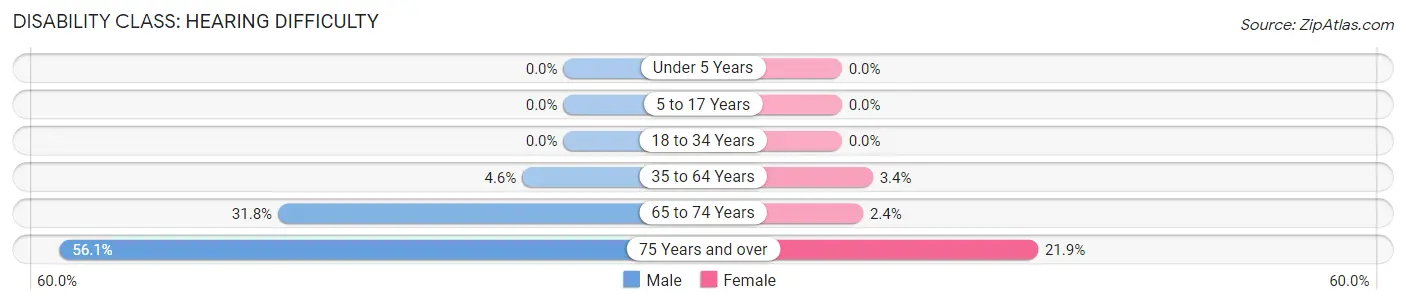
| Age Bracket | Male | Female |
| Under 5 Years | 0 (0.0%) | 0 (0.0%) |
| 5 to 17 Years | 0 (0.0%) | 0 (0.0%) |
| 18 to 34 Years | 0 (0.0%) | 0 (0.0%) |
| 35 to 64 Years | 42 (4.6%) | 32 (3.4%) |
| 65 to 74 Years | 48 (31.8%) | 5 (2.4%) |
| 75 Years and over | 55 (56.1%) | 26 (21.8%) |
Disability Class: Vision Difficulty
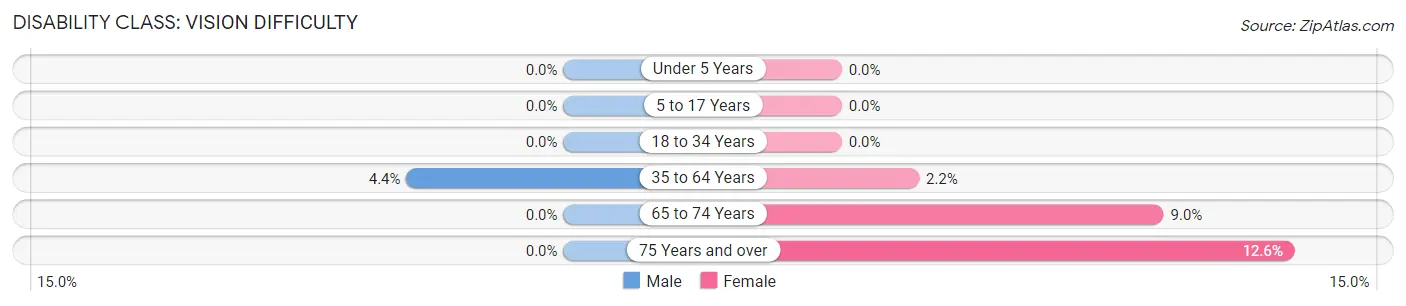
| Age Bracket | Male | Female |
| Under 5 Years | 0 (0.0%) | 0 (0.0%) |
| 5 to 17 Years | 0 (0.0%) | 0 (0.0%) |
| 18 to 34 Years | 0 (0.0%) | 0 (0.0%) |
| 35 to 64 Years | 40 (4.4%) | 20 (2.1%) |
| 65 to 74 Years | 0 (0.0%) | 19 (9.0%) |
| 75 Years and over | 0 (0.0%) | 15 (12.6%) |
Disability Class: Cognitive Difficulty
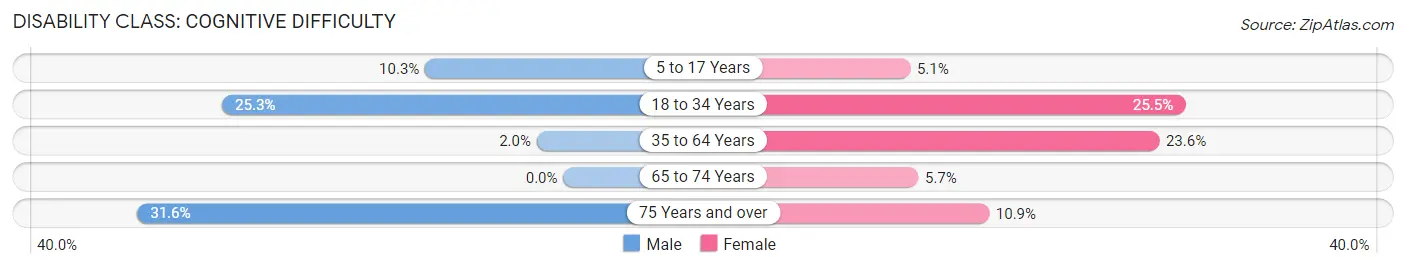
| Age Bracket | Male | Female |
| 5 to 17 Years | 31 (10.3%) | 16 (5.1%) |
| 18 to 34 Years | 96 (25.3%) | 158 (25.5%) |
| 35 to 64 Years | 18 (2.0%) | 219 (23.5%) |
| 65 to 74 Years | 0 (0.0%) | 12 (5.7%) |
| 75 Years and over | 31 (31.6%) | 13 (10.9%) |
Disability Class: Ambulatory Difficulty
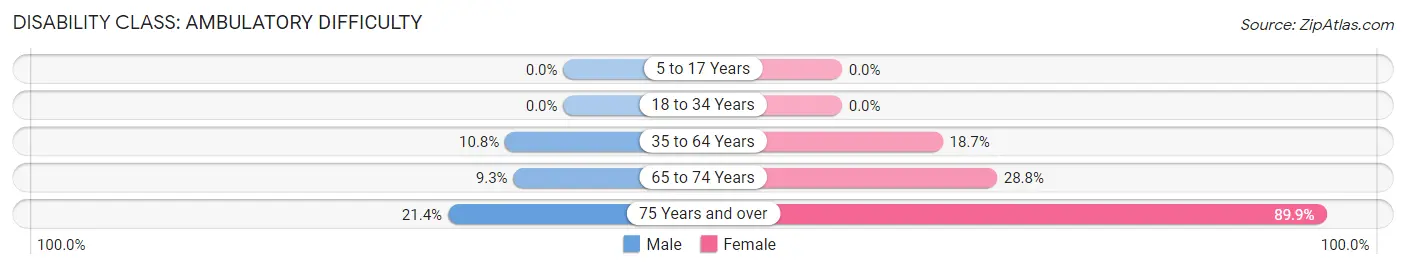
| Age Bracket | Male | Female |
| 5 to 17 Years | 0 (0.0%) | 0 (0.0%) |
| 18 to 34 Years | 0 (0.0%) | 0 (0.0%) |
| 35 to 64 Years | 99 (10.8%) | 174 (18.7%) |
| 65 to 74 Years | 14 (9.3%) | 61 (28.8%) |
| 75 Years and over | 21 (21.4%) | 107 (89.9%) |
Disability Class: Self-Care Difficulty
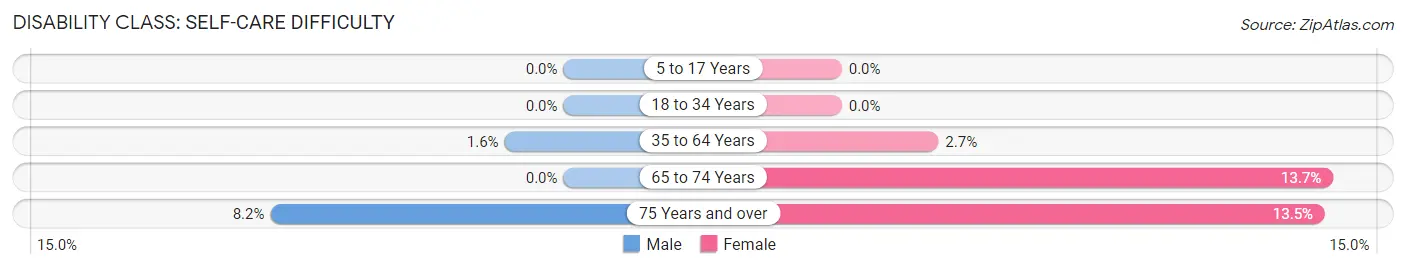
| Age Bracket | Male | Female |
| 5 to 17 Years | 0 (0.0%) | 0 (0.0%) |
| 18 to 34 Years | 0 (0.0%) | 0 (0.0%) |
| 35 to 64 Years | 15 (1.6%) | 25 (2.7%) |
| 65 to 74 Years | 0 (0.0%) | 29 (13.7%) |
| 75 Years and over | 8 (8.2%) | 16 (13.5%) |
Technology Access in Moon Lake
Computing Device Access in Moon Lake
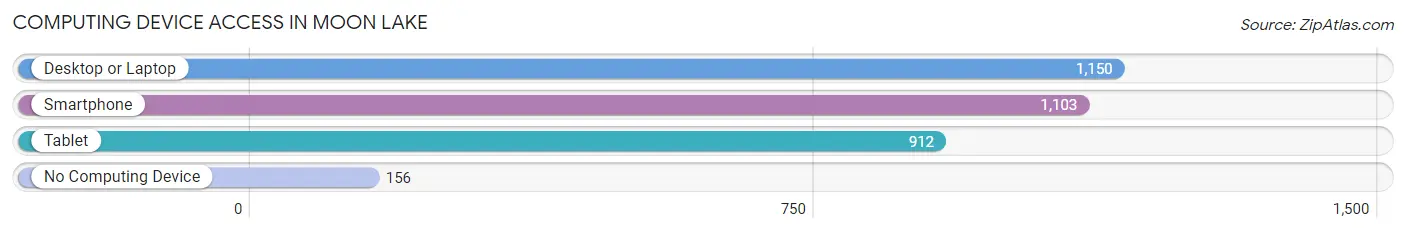
| Device Type | # Households | % Households |
| Desktop or Laptop | 1,150 | 71.7% |
| Smartphone | 1,103 | 68.8% |
| Tablet | 912 | 56.9% |
| No Computing Device | 156 | 9.7% |
| Total | 1,603 | 100.0% |
Internet Access in Moon Lake
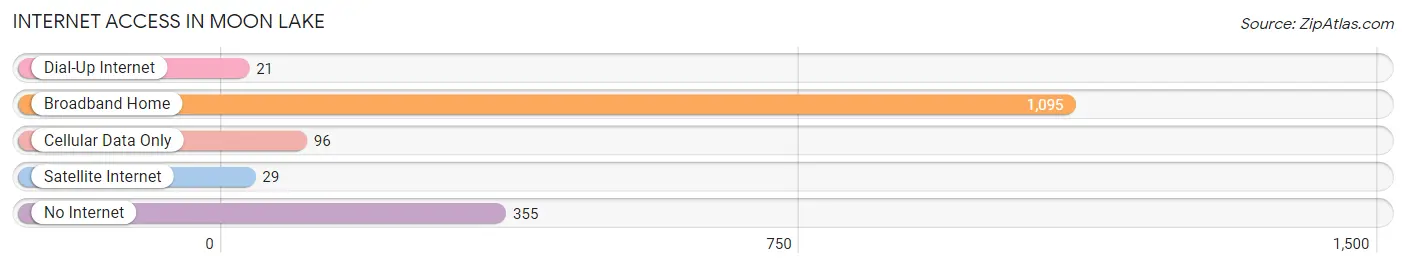
| Internet Type | # Households | % Households |
| Dial-Up Internet | 21 | 1.3% |
| Broadband Home | 1,095 | 68.3% |
| Cellular Data Only | 96 | 6.0% |
| Satellite Internet | 29 | 1.8% |
| No Internet | 355 | 22.2% |
| Total | 1,603 | 100.0% |
Moon Lake Summary
Moon Lake is a small unincorporated community located in Pasco County, Florida. It is situated on the eastern shore of Moon Lake, a natural freshwater lake that is part of the Withlacoochee River system. The community is located approximately 25 miles north of Tampa and is part of the Tampa-St. Petersburg-Clearwater Metropolitan Statistical Area.
History
The Moon Lake area was first settled in the late 1800s by settlers from the nearby town of Trilby. The settlers were attracted to the area by the abundance of fish and game in the lake and the surrounding area. The first post office in the area was established in 1891 and the community was officially named Moon Lake in 1895.
In the early 1900s, the area began to attract more settlers and the community began to grow. The Moon Lake School was established in 1910 and the Moon Lake Baptist Church was founded in 1912. The Moon Lake Hotel was built in 1915 and the Moon Lake Country Club was established in 1916.
In the 1920s, the area began to attract more tourists and the community began to grow. The Moon Lake Inn was built in 1925 and the Moon Lake Golf Course was established in 1926. The Moon Lake Airport was built in 1928 and the Moon Lake Yacht Club was established in 1929.
In the 1930s, the area continued to attract more tourists and the community continued to grow. The Moon Lake Country Club was expanded in 1932 and the Moon Lake Marina was established in 1933. The Moon Lake Bridge was built in 1934 and the Moon Lake Amusement Park was established in 1935.
In the 1940s, the area continued to attract more tourists and the community continued to grow. The Moon Lake Airport was expanded in 1941 and the Moon Lake Shopping Center was established in 1942. The Moon Lake Post Office was built in 1945 and the Moon Lake Library was established in 1946.
In the 1950s, the area continued to attract more tourists and the community continued to grow. The Moon Lake Civic Center was built in 1951 and the Moon Lake Fire Department was established in 1952. The Moon Lake Community Center was built in 1953 and the Moon Lake Park was established in 1954.
In the 1960s, the area continued to attract more tourists and the community continued to grow. The Moon Lake Elementary School was built in 1961 and the Moon Lake High School was established in 1962. The Moon Lake Shopping Center was expanded in 1963 and the Moon Lake Medical Center was established in 1964.
In the 1970s, the area continued to attract more tourists and the community continued to grow. The Moon Lake Community Center was expanded in 1971 and the Moon Lake Senior Center was established in 1972. The Moon Lake Library was expanded in 1973 and the Moon Lake Recreation Center was established in 1974.
In the 1980s, the area continued to attract more tourists and the community continued to grow. The Moon Lake Elementary School was expanded in 1981 and the Moon Lake High School was expanded in 1982. The Moon Lake Shopping Center was expanded in 1983 and the Moon Lake Medical Center was expanded in 1984.
In the 1990s, the area continued to attract more tourists and the community continued to grow. The Moon Lake Community Center was expanded in 1991 and the Moon Lake Senior Center was expanded in 1992. The Moon Lake Library was expanded in 1993 and the Moon Lake Recreation Center was expanded in 1994.
Geography
Moon Lake is located in Pasco County, Florida. It is situated on the eastern shore of Moon Lake, a natural freshwater lake that is part of the Withlacoochee River system. The lake is approximately 2,000 acres in size and is surrounded by cypress swamps and hardwood hammocks.
The community is located approximately 25 miles north of Tampa and is part of the Tampa-St. Petersburg-Clearwater Metropolitan Statistical Area. The area is characterized by flat terrain and sandy soils. The climate is subtropical with hot, humid summers and mild, dry winters.
Economy
The economy of Moon Lake is largely based on tourism and recreation. The area is home to several resorts, hotels, and restaurants that cater to visitors from around the world. The Moon Lake Country Club, Moon Lake Golf Course, and Moon Lake Marina are popular attractions for visitors.
The area is also home to several small businesses, including a grocery store, hardware store, and several antique shops. The Moon Lake Shopping Center is a popular destination for locals and visitors alike.
Demographics
As of the 2010 census, the population of Moon Lake was 1,845. The racial makeup of the community was 94.3% White, 2.2% African American, 0.7% Native American, 0.4% Asian, 0.1% Pacific Islander, 0.9% from other races, and 1.4% from two or more races. Hispanic or Latino of any race were 3.2% of the population.
The median household income in Moon Lake was $41,944 and the median family income was $50,938. The per capita income was $20,945. About 11.3% of families and 14.2% of the population were below the poverty line, including 19.2% of those under age 18 and 8.2% of those age 65 or over.
Common Questions
What is Per Capita Income in Moon Lake?
Per Capita income in Moon Lake is $21,070.
What is the Median Family Income in Moon Lake?
Median Family Income in Moon Lake is $53,578.
What is the Median Household income in Moon Lake?
Median Household Income in Moon Lake is $34,205.
What is Income or Wage Gap in Moon Lake?
Income or Wage Gap in Moon Lake is 28.1%.
Women in Moon Lake earn 71.9 cents for every dollar earned by a man.
What is Family Income Deficit in Moon Lake?
Family Income Deficit in Moon Lake is $10,238.
Families that are below poverty line in Moon Lake earn $10,238 less on average than the poverty threshold level.
What is Inequality or Gini Index in Moon Lake?
Inequality or Gini Index in Moon Lake is 0.50.
What is the Total Population of Moon Lake?
Total Population of Moon Lake is 4,214.
What is the Total Male Population of Moon Lake?
Total Male Population of Moon Lake is 1,935.
What is the Total Female Population of Moon Lake?
Total Female Population of Moon Lake is 2,279.
What is the Ratio of Males per 100 Females in Moon Lake?
There are 84.91 Males per 100 Females in Moon Lake.
What is the Ratio of Females per 100 Males in Moon Lake?
There are 117.78 Females per 100 Males in Moon Lake.
What is the Median Population Age in Moon Lake?
Median Population Age in Moon Lake is 43.6 Years.
What is the Average Family Size in Moon Lake
Average Family Size in Moon Lake is 3.7 People.
What is the Average Household Size in Moon Lake
Average Household Size in Moon Lake is 2.6 People.
How Large is the Labor Force in Moon Lake?
There are 2,007 People in the Labor Forcein in Moon Lake.
What is the Percentage of People in the Labor Force in Moon Lake?
56.5% of People are in the Labor Force in Moon Lake.
What is the Unemployment Rate in Moon Lake?
Unemployment Rate in Moon Lake is 22.6%.