Wiscon, FL Map & Demographics
Wiscon Map
Wiscon Overview
$22,092
PER CAPITA INCOME
$33,427
AVG FAMILY INCOME
$40,833
AVG HOUSEHOLD INCOME
67.4%
WAGE / INCOME GAP [ % ]
32.6¢/ $1
WAGE / INCOME GAP [ $ ]
0.35
INEQUALITY / GINI INDEX
628
TOTAL POPULATION
329
MALE POPULATION
299
FEMALE POPULATION
110.03
MALES / 100 FEMALES
90.88
FEMALES / 100 MALES
42.8
MEDIAN AGE
3.3
AVG FAMILY SIZE
2.6
AVG HOUSEHOLD SIZE
260
LABOR FORCE [ PEOPLE ]
52.6%
PERCENT IN LABOR FORCE
13.1%
UNEMPLOYMENT RATE
Income in Wiscon
Income Overview in Wiscon
Per Capita Income in Wiscon is $22,092, while median incomes of families and households are $33,427 and $40,833 respectively.
| Characteristic | Number | Measure |
| Per Capita Income | 628 | $22,092 |
| Median Family Income | 151 | $33,427 |
| Mean Family Income | 151 | $47,351 |
| Median Household Income | 244 | $40,833 |
| Mean Household Income | 244 | $56,949 |
| Income Deficit | 151 | $0 |
| Wage / Income Gap (%) | 628 | 67.45% |
| Wage / Income Gap ($) | 628 | 32.55¢ per $1 |
| Gini / Inequality Index | 628 | 0.35 |
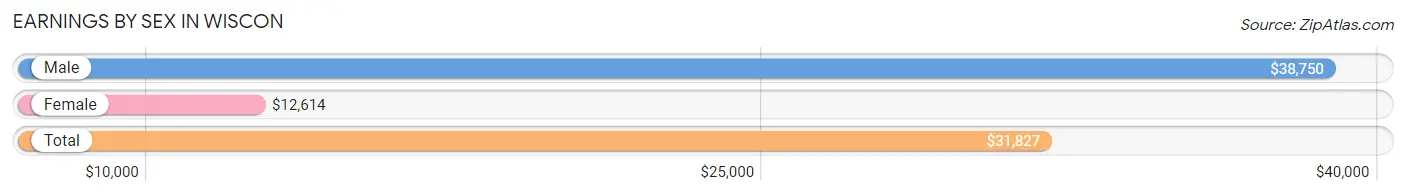
Earnings by Sex in Wiscon
Average Earnings in Wiscon are $31,827, $38,750 for men and $12,614 for women, a difference of 67.4%.
| Sex | Number | Average Earnings |
| Male | 147 (52.5%) | $38,750 |
| Female | 133 (47.5%) | $12,614 |
| Total | 280 (100.0%) | $31,827 |
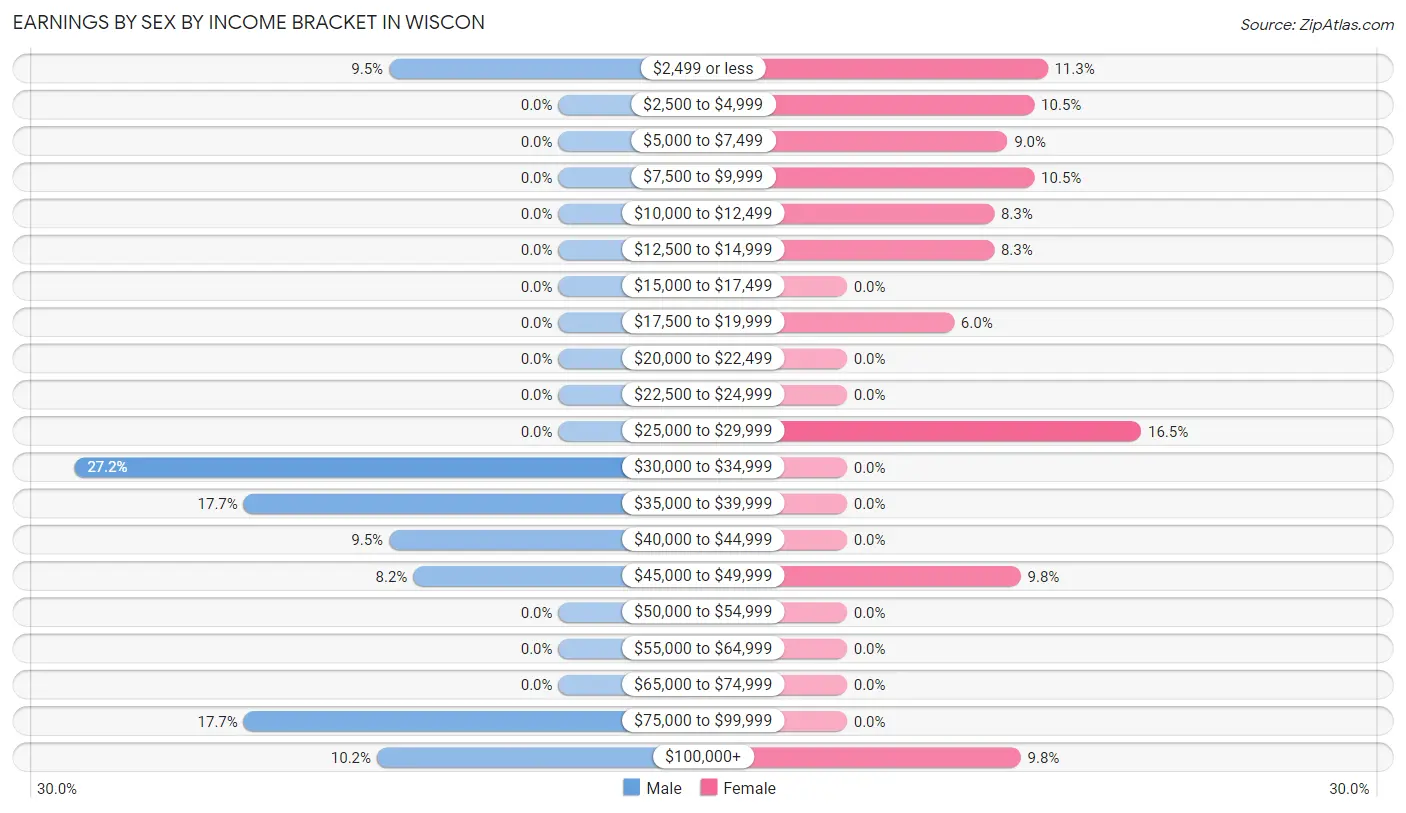
Earnings by Sex by Income Bracket in Wiscon
The most common earnings brackets in Wiscon are $30,000 to $34,999 for men (40 | 27.2%) and $25,000 to $29,999 for women (22 | 16.5%).
| Income | Male | Female |
| $2,499 or less | 14 (9.5%) | 15 (11.3%) |
| $2,500 to $4,999 | 0 (0.0%) | 14 (10.5%) |
| $5,000 to $7,499 | 0 (0.0%) | 12 (9.0%) |
| $7,500 to $9,999 | 0 (0.0%) | 14 (10.5%) |
| $10,000 to $12,499 | 0 (0.0%) | 11 (8.3%) |
| $12,500 to $14,999 | 0 (0.0%) | 11 (8.3%) |
| $15,000 to $17,499 | 0 (0.0%) | 0 (0.0%) |
| $17,500 to $19,999 | 0 (0.0%) | 8 (6.0%) |
| $20,000 to $22,499 | 0 (0.0%) | 0 (0.0%) |
| $22,500 to $24,999 | 0 (0.0%) | 0 (0.0%) |
| $25,000 to $29,999 | 0 (0.0%) | 22 (16.5%) |
| $30,000 to $34,999 | 40 (27.2%) | 0 (0.0%) |
| $35,000 to $39,999 | 26 (17.7%) | 0 (0.0%) |
| $40,000 to $44,999 | 14 (9.5%) | 0 (0.0%) |
| $45,000 to $49,999 | 12 (8.2%) | 13 (9.8%) |
| $50,000 to $54,999 | 0 (0.0%) | 0 (0.0%) |
| $55,000 to $64,999 | 0 (0.0%) | 0 (0.0%) |
| $65,000 to $74,999 | 0 (0.0%) | 0 (0.0%) |
| $75,000 to $99,999 | 26 (17.7%) | 0 (0.0%) |
| $100,000+ | 15 (10.2%) | 13 (9.8%) |
| Total | 147 (100.0%) | 133 (100.0%) |
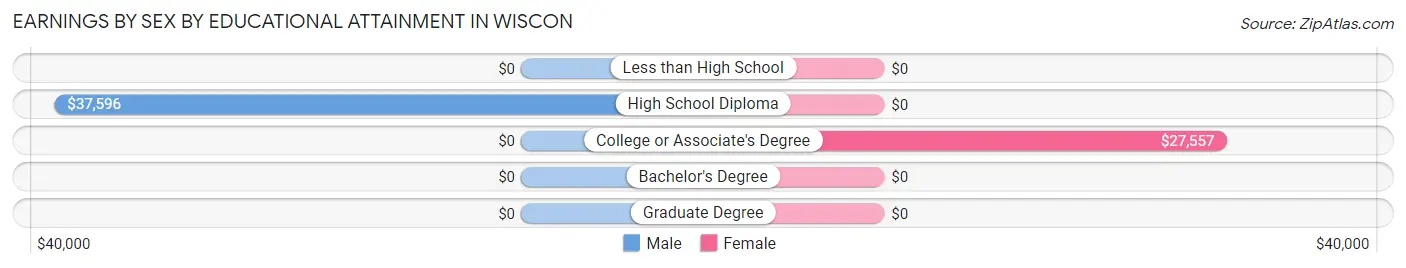
Earnings by Sex by Educational Attainment in Wiscon
Average earnings in Wiscon are $38,750 for men and $12,614 for women, a difference of 67.4%. Men with an educational attainment of high school diploma enjoy the highest average annual earnings of $37,596, while those with high school diploma education earn the least with $37,596. Women with an educational attainment of college or associate's degree earn the most with the average annual earnings of $27,557, while those with college or associate's degree education have the smallest earnings of $27,557.
| Educational Attainment | Male Income | Female Income |
| Less than High School | - | - |
| High School Diploma | $37,596 | $0 |
| College or Associate's Degree | - | - |
| Bachelor's Degree | - | - |
| Graduate Degree | - | - |
| Total | $38,750 | $12,614 |
Family Income in Wiscon
Family Income Brackets in Wiscon
According to the Wiscon family income data, there are 57 families falling into the $25,000 to $34,999 income range, which is the most common income bracket and makes up 37.8% of all families.
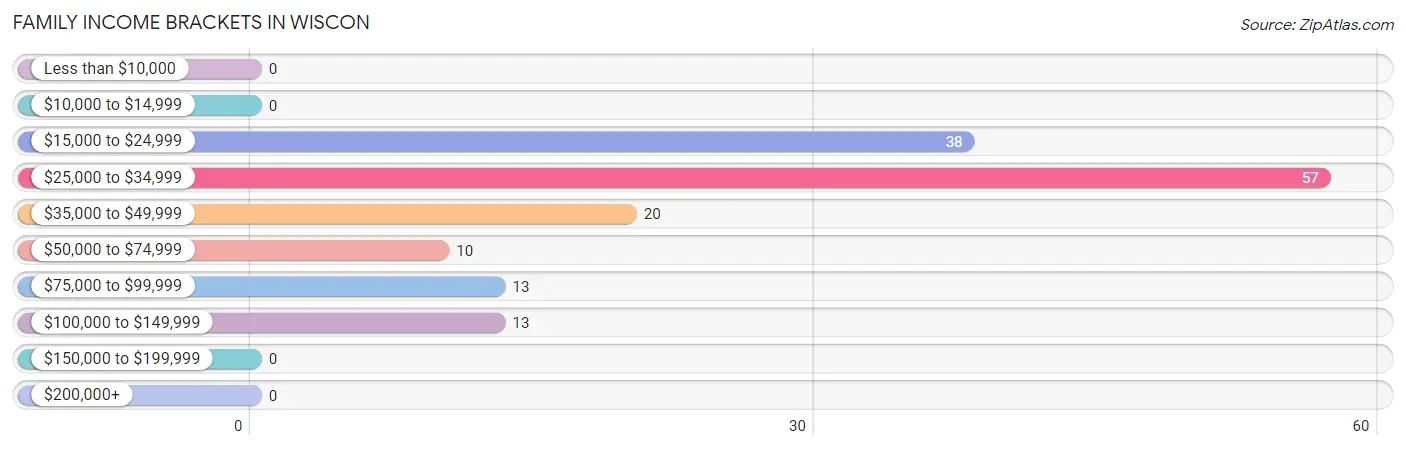
| Income Bracket | # Families | % Families |
| Less than $10,000 | 0 | 0.0% |
| $10,000 to $14,999 | 0 | 0.0% |
| $15,000 to $24,999 | 38 | 25.2% |
| $25,000 to $34,999 | 57 | 37.7% |
| $35,000 to $49,999 | 20 | 13.2% |
| $50,000 to $74,999 | 10 | 6.6% |
| $75,000 to $99,999 | 13 | 8.6% |
| $100,000 to $149,999 | 13 | 8.6% |
| $150,000 to $199,999 | 0 | 0.0% |
| $200,000+ | 0 | 0.0% |
Family Income by Famaliy Size in Wiscon
3-person families (49 | 32.5%) account for the highest median family income in Wiscon with $82,788 per family, while 3-person families (49 | 32.5%) have the highest median income of $27,596 per family member.
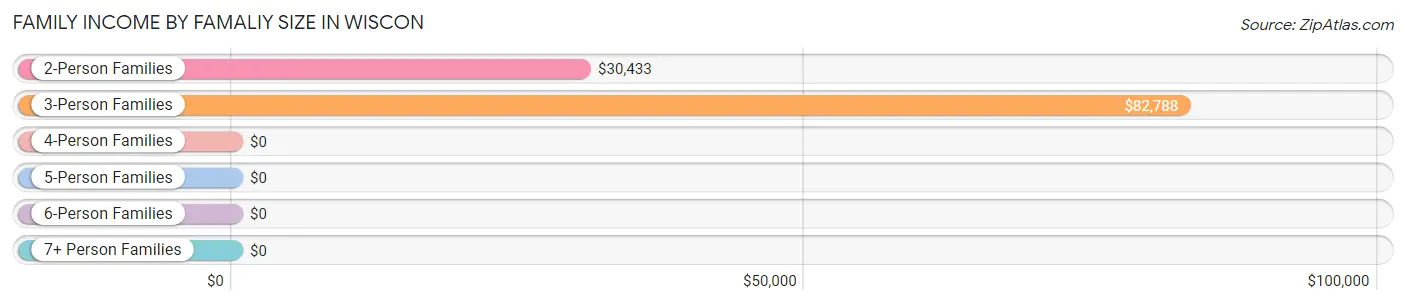
| Income Bracket | # Families | Median Income |
| 2-Person Families | 59 (39.1%) | $30,433 |
| 3-Person Families | 49 (32.5%) | $82,788 |
| 4-Person Families | 12 (8.0%) | $0 |
| 5-Person Families | 22 (14.6%) | $0 |
| 6-Person Families | 0 (0.0%) | $0 |
| 7+ Person Families | 9 (6.0%) | $0 |
| Total | 151 (100.0%) | $33,427 |
Family Income by Number of Earners in Wiscon
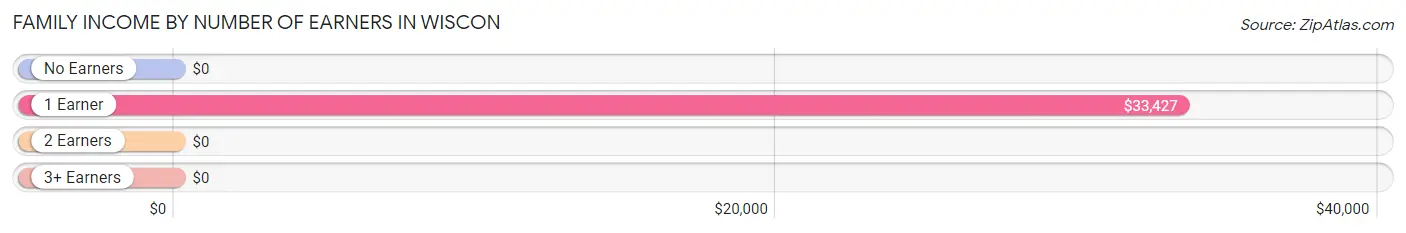
| Number of Earners | # Families | Median Income |
| No Earners | 24 (15.9%) | $0 |
| 1 Earner | 75 (49.7%) | $33,427 |
| 2 Earners | 52 (34.4%) | $0 |
| 3+ Earners | 0 (0.0%) | $0 |
| Total | 151 (100.0%) | $33,427 |
Household Income in Wiscon
Household Income Brackets in Wiscon
With 57 households falling in the category, the $25,000 to $34,999 income range is the most frequent in Wiscon, accounting for 23.4% of all households.
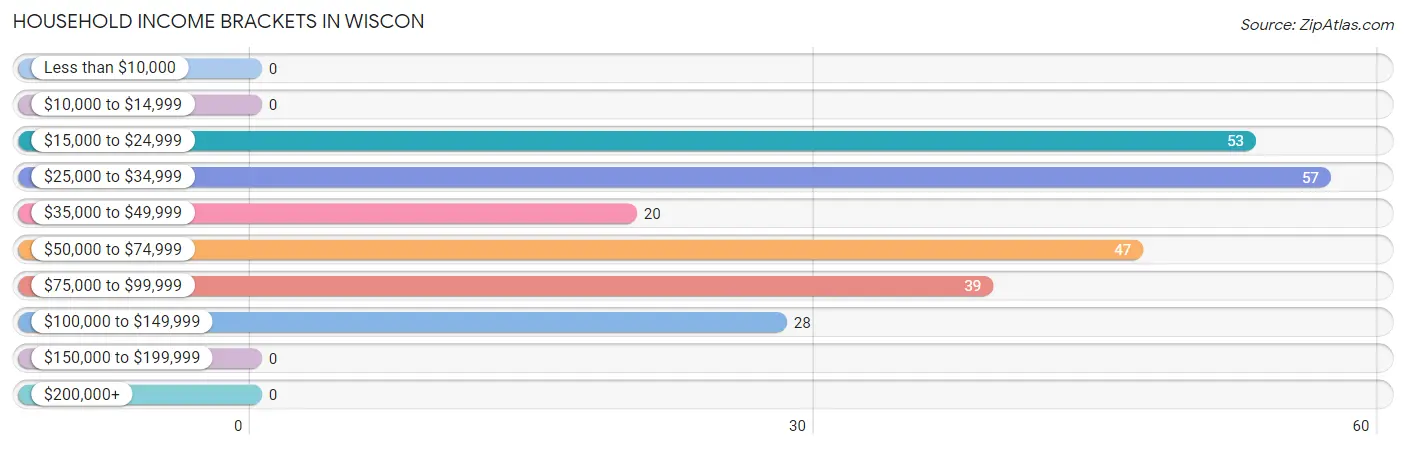
| Income Bracket | # Households | % Households |
| Less than $10,000 | 0 | 0.0% |
| $10,000 to $14,999 | 0 | 0.0% |
| $15,000 to $24,999 | 53 | 21.7% |
| $25,000 to $34,999 | 57 | 23.4% |
| $35,000 to $49,999 | 20 | 8.2% |
| $50,000 to $74,999 | 47 | 19.3% |
| $75,000 to $99,999 | 39 | 16.0% |
| $100,000 to $149,999 | 28 | 11.5% |
| $150,000 to $199,999 | 0 | 0.0% |
| $200,000+ | 0 | 0.0% |
Household Income by Householder Age in Wiscon
| Income Bracket | # Households | Median Income |
| 15 to 24 Years | 0 (0.0%) | $0 |
| 25 to 44 Years | 25 (10.2%) | $0 |
| 45 to 64 Years | 173 (70.9%) | $0 |
| 65+ Years | 46 (18.9%) | $0 |
| Total | 244 (100.0%) | $40,833 |
Poverty in Wiscon
Income Below Poverty by Sex and Age in Wiscon
With 24.6% poverty level for males and 56.9% for females among the residents of Wiscon, 12 to 14 year old males and 45 to 54 year old females are the most vulnerable to poverty, with 32 males (74.4%) and 44 females (100.0%) in their respective age groups living below the poverty level.
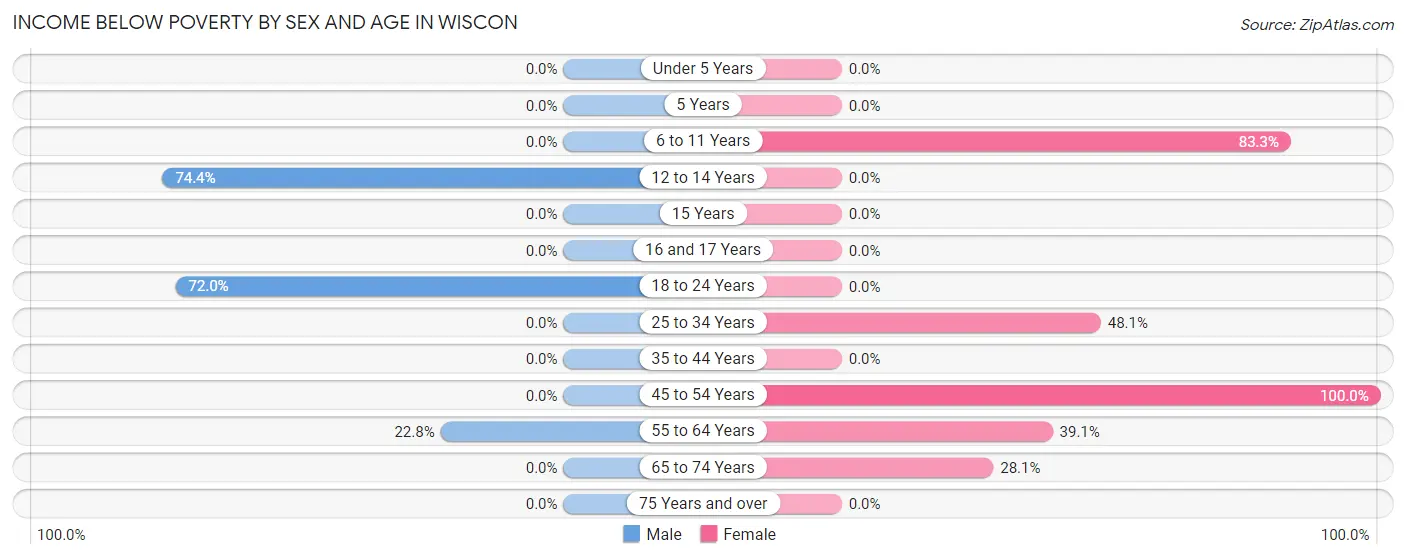
| Age Bracket | Male | Female |
| Under 5 Years | 0 (0.0%) | 0 (0.0%) |
| 5 Years | 0 (0.0%) | 0 (0.0%) |
| 6 to 11 Years | 0 (0.0%) | 65 (83.3%) |
| 12 to 14 Years | 32 (74.4%) | 0 (0.0%) |
| 15 Years | 0 (0.0%) | 0 (0.0%) |
| 16 and 17 Years | 0 (0.0%) | 0 (0.0%) |
| 18 to 24 Years | 36 (72.0%) | 0 (0.0%) |
| 25 to 34 Years | 0 (0.0%) | 25 (48.1%) |
| 35 to 44 Years | 0 (0.0%) | 0 (0.0%) |
| 45 to 54 Years | 0 (0.0%) | 44 (100.0%) |
| 55 to 64 Years | 13 (22.8%) | 27 (39.1%) |
| 65 to 74 Years | 0 (0.0%) | 9 (28.1%) |
| 75 Years and over | 0 (0.0%) | 0 (0.0%) |
| Total | 81 (24.6%) | 170 (56.9%) |
Income Above Poverty by Sex and Age in Wiscon
According to the poverty statistics in Wiscon, males aged under 5 years and females aged 35 to 44 years are the age groups that are most secure financially, with 100.0% of males and 100.0% of females in these age groups living above the poverty line.
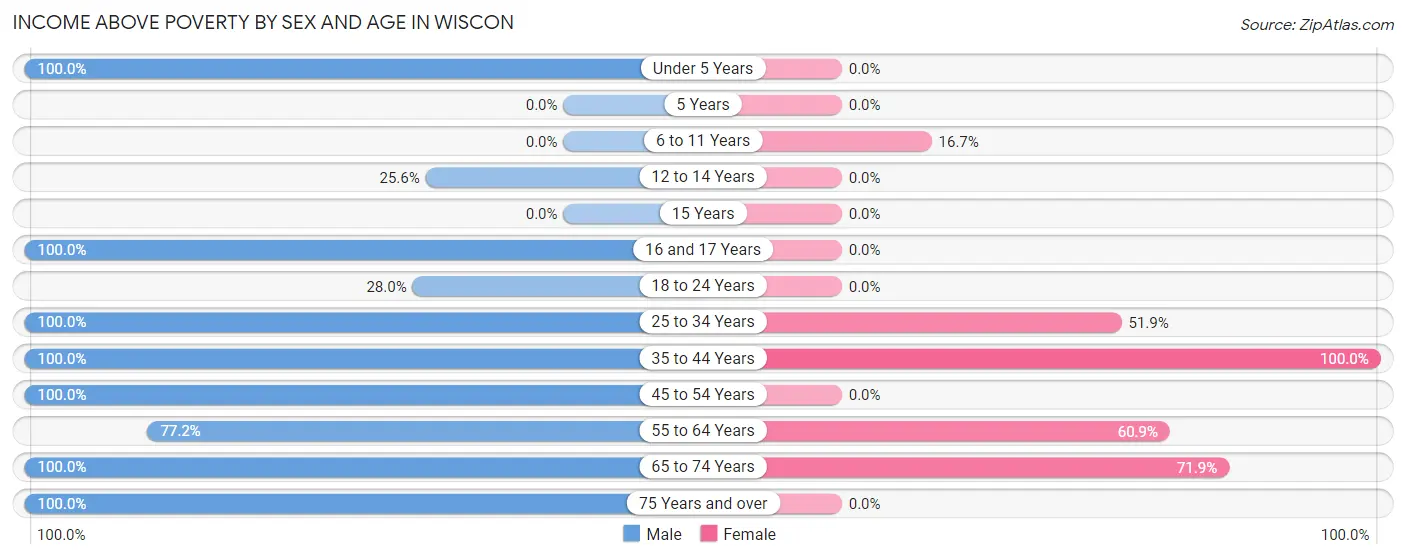
| Age Bracket | Male | Female |
| Under 5 Years | 13 (100.0%) | 0 (0.0%) |
| 5 Years | 0 (0.0%) | 0 (0.0%) |
| 6 to 11 Years | 0 (0.0%) | 13 (16.7%) |
| 12 to 14 Years | 11 (25.6%) | 0 (0.0%) |
| 15 Years | 0 (0.0%) | 0 (0.0%) |
| 16 and 17 Years | 16 (100.0%) | 0 (0.0%) |
| 18 to 24 Years | 14 (28.0%) | 0 (0.0%) |
| 25 to 34 Years | 28 (100.0%) | 27 (51.9%) |
| 35 to 44 Years | 12 (100.0%) | 24 (100.0%) |
| 45 to 54 Years | 65 (100.0%) | 0 (0.0%) |
| 55 to 64 Years | 44 (77.2%) | 42 (60.9%) |
| 65 to 74 Years | 17 (100.0%) | 23 (71.9%) |
| 75 Years and over | 28 (100.0%) | 0 (0.0%) |
| Total | 248 (75.4%) | 129 (43.1%) |
Income Below Poverty Among Married-Couple Families in Wiscon
The poverty statistics for married-couple families in Wiscon show that 21.7% or 13 of the total 60 families live below the poverty line. Families with no children have the highest poverty rate of 37.1%, comprising of 13 families. On the other hand, families with 1 or 2 children have the lowest poverty rate of 0.0%, which includes 0 families.
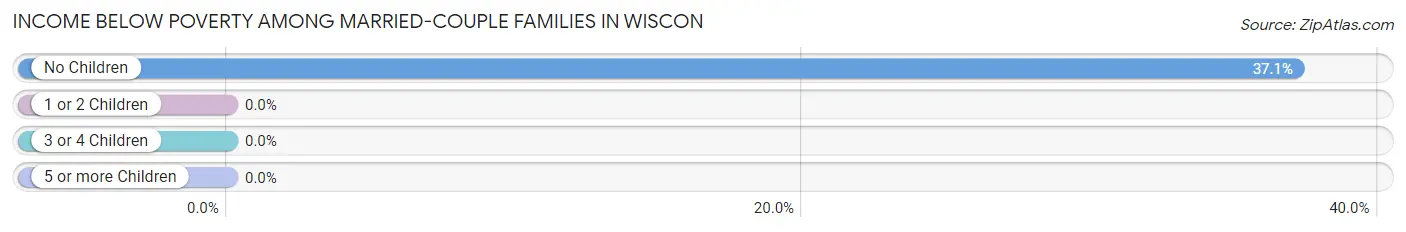
| Children | Above Poverty | Below Poverty |
| No Children | 22 (62.9%) | 13 (37.1%) |
| 1 or 2 Children | 25 (100.0%) | 0 (0.0%) |
| 3 or 4 Children | 0 (0.0%) | 0 (0.0%) |
| 5 or more Children | 0 (0.0%) | 0 (0.0%) |
| Total | 47 (78.3%) | 13 (21.7%) |
Income Below Poverty Among Single-Parent Households in Wiscon
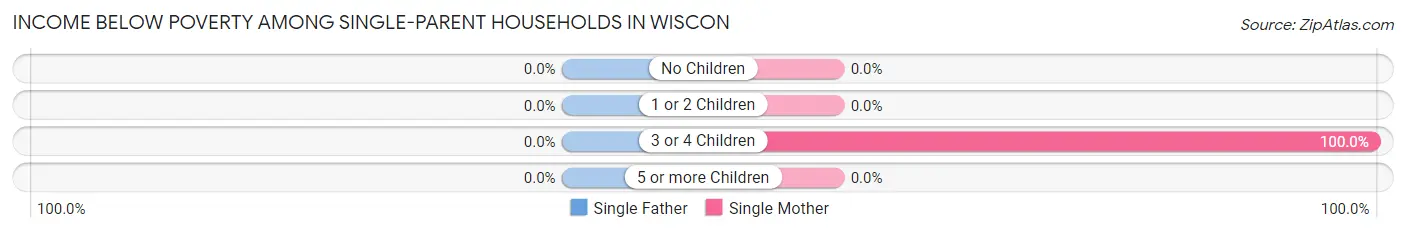
| Children | Single Father | Single Mother |
| No Children | 0 (0.0%) | 0 (0.0%) |
| 1 or 2 Children | 0 (0.0%) | 0 (0.0%) |
| 3 or 4 Children | 0 (0.0%) | 31 (100.0%) |
| 5 or more Children | 0 (0.0%) | 0 (0.0%) |
| Total | 0 (0.0%) | 31 (47.7%) |
Income Below Poverty Among Married-Couple vs Single-Parent Households in Wiscon
The poverty data for Wiscon shows that 13 of the married-couple family households (21.7%) and 31 of the single-parent households (34.1%) are living below the poverty level. Within the married-couple family households, those with no children have the highest poverty rate, with 13 households (37.1%) falling below the poverty line. Among the single-parent households, those with 3 or 4 children have the highest poverty rate, with 31 household (100.0%) living below poverty.
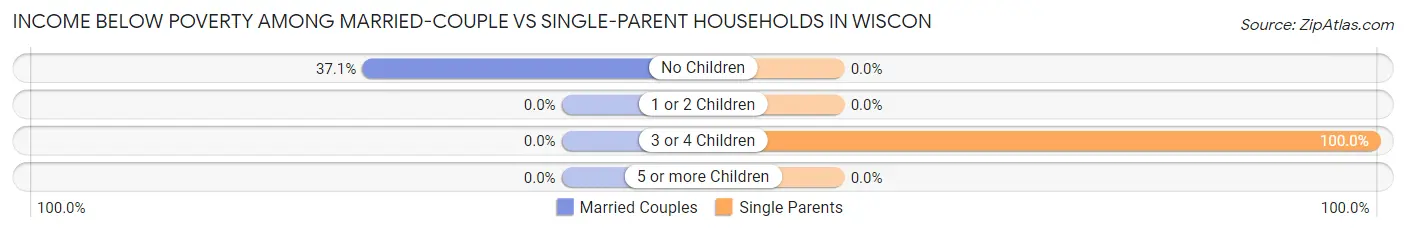
| Children | Married-Couple Families | Single-Parent Households |
| No Children | 13 (37.1%) | 0 (0.0%) |
| 1 or 2 Children | 0 (0.0%) | 0 (0.0%) |
| 3 or 4 Children | 0 (0.0%) | 31 (100.0%) |
| 5 or more Children | 0 (0.0%) | 0 (0.0%) |
| Total | 13 (21.7%) | 31 (34.1%) |
Race in Wiscon
The most populous races in Wiscon are White / Caucasian (585 | 93.1%), Hispanic or Latino (58 | 9.2%), and Two or more Races (43 | 6.9%).
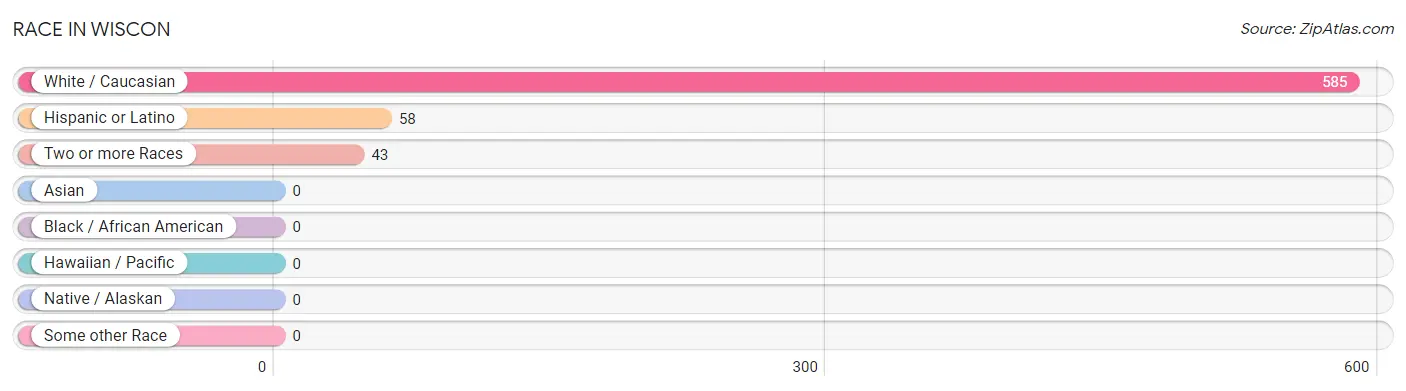
| Race | # Population | % Population |
| Asian | 0 | 0.0% |
| Black / African American | 0 | 0.0% |
| Hawaiian / Pacific | 0 | 0.0% |
| Hispanic or Latino | 58 | 9.2% |
| Native / Alaskan | 0 | 0.0% |
| White / Caucasian | 585 | 93.1% |
| Two or more Races | 43 | 6.9% |
| Some other Race | 0 | 0.0% |
| Total | 628 | 100.0% |
Ancestry in Wiscon
The most populous ancestries reported in Wiscon are English (159 | 25.3%), American (118 | 18.8%), German (60 | 9.6%), Irish (56 | 8.9%), and Mexican (43 | 6.9%), together accounting for 69.4% of all Wiscon residents.
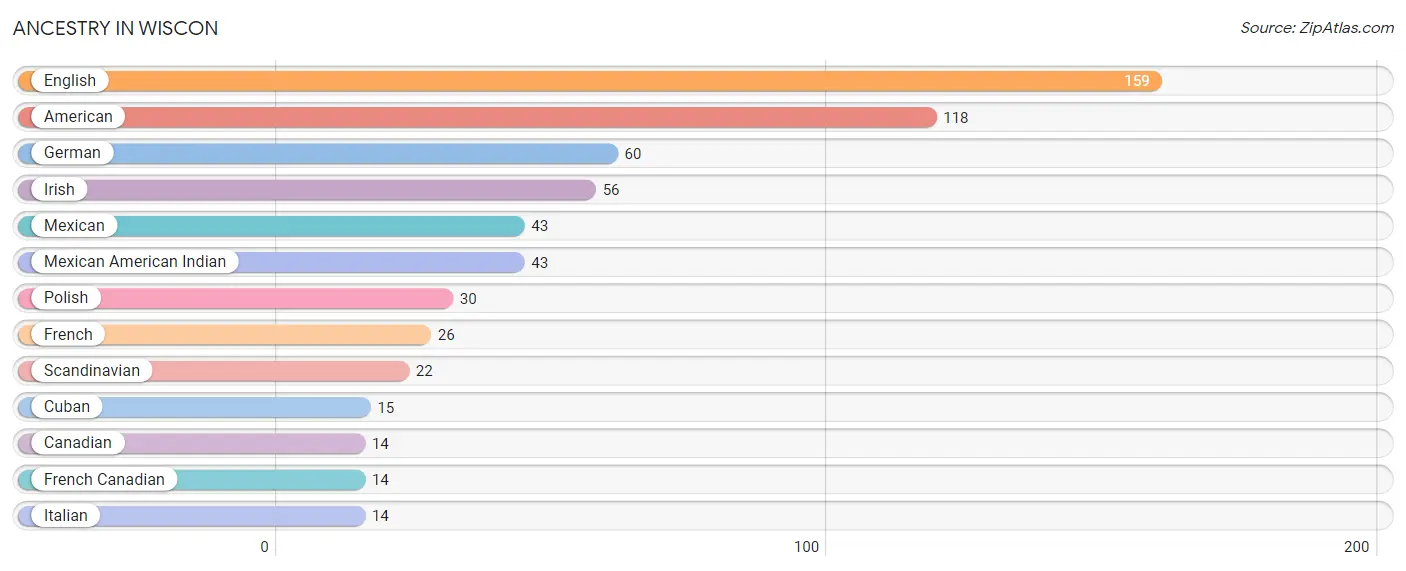
| Ancestry | # Population | % Population |
| American | 118 | 18.8% |
| Canadian | 14 | 2.2% |
| Cuban | 15 | 2.4% |
| English | 159 | 25.3% |
| French | 26 | 4.1% |
| French Canadian | 14 | 2.2% |
| German | 60 | 9.6% |
| Irish | 56 | 8.9% |
| Italian | 14 | 2.2% |
| Mexican | 43 | 6.9% |
| Mexican American Indian | 43 | 6.9% |
| Polish | 30 | 4.8% |
| Scandinavian | 22 | 3.5% | View All 13 Rows |
Immigrants in Wiscon

| Immigration Origin | # Population | % Population | View All 0 Rows |
Sex and Age in Wiscon
Sex and Age in Wiscon
The most populous age groups in Wiscon are 50 to 54 Years (52 | 15.8%) for men and 5 to 9 Years (56 | 18.7%) for women.
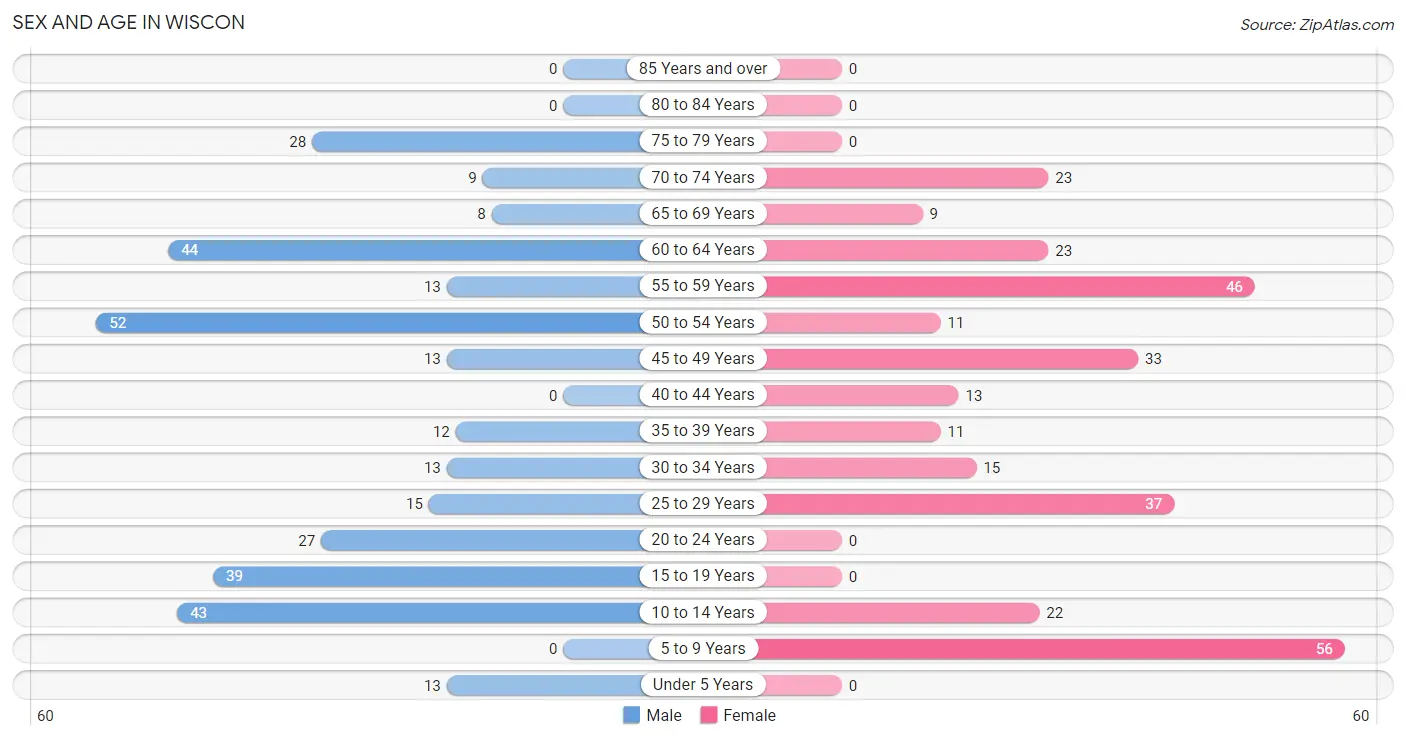
| Age Bracket | Male | Female |
| Under 5 Years | 13 (4.0%) | 0 (0.0%) |
| 5 to 9 Years | 0 (0.0%) | 56 (18.7%) |
| 10 to 14 Years | 43 (13.1%) | 22 (7.4%) |
| 15 to 19 Years | 39 (11.8%) | 0 (0.0%) |
| 20 to 24 Years | 27 (8.2%) | 0 (0.0%) |
| 25 to 29 Years | 15 (4.6%) | 37 (12.4%) |
| 30 to 34 Years | 13 (4.0%) | 15 (5.0%) |
| 35 to 39 Years | 12 (3.6%) | 11 (3.7%) |
| 40 to 44 Years | 0 (0.0%) | 13 (4.3%) |
| 45 to 49 Years | 13 (4.0%) | 33 (11.0%) |
| 50 to 54 Years | 52 (15.8%) | 11 (3.7%) |
| 55 to 59 Years | 13 (4.0%) | 46 (15.4%) |
| 60 to 64 Years | 44 (13.4%) | 23 (7.7%) |
| 65 to 69 Years | 8 (2.4%) | 9 (3.0%) |
| 70 to 74 Years | 9 (2.7%) | 23 (7.7%) |
| 75 to 79 Years | 28 (8.5%) | 0 (0.0%) |
| 80 to 84 Years | 0 (0.0%) | 0 (0.0%) |
| 85 Years and over | 0 (0.0%) | 0 (0.0%) |
| Total | 329 (100.0%) | 299 (100.0%) |
Families and Households in Wiscon
Median Family Size in Wiscon
The median family size in Wiscon is 3.32 persons per family, with single female/mother families (65 | 43.0%) accounting for the largest median family size of 4.35 persons per family. On the other hand, single male/father families (26 | 17.2%) represent the smallest median family size with 1.54 persons per family.
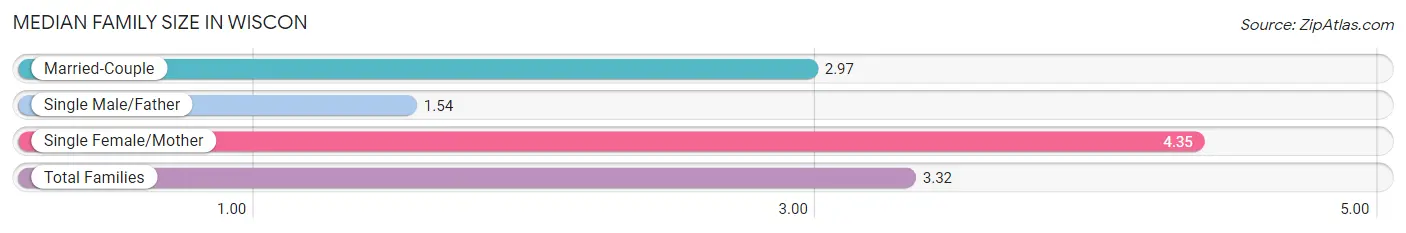
| Family Type | # Families | Family Size |
| Married-Couple | 60 (39.7%) | 2.97 |
| Single Male/Father | 26 (17.2%) | 1.54 |
| Single Female/Mother | 65 (43.0%) | 4.35 |
| Total Families | 151 (100.0%) | 3.32 |
Median Household Size in Wiscon
The median household size in Wiscon is 2.57 persons per household, with single female/mother households (65 | 26.6%) accounting for the largest median household size of 4.49 persons per household. non-family households (93 | 38.1%) represent the smallest median household size with 1.27 persons per household.
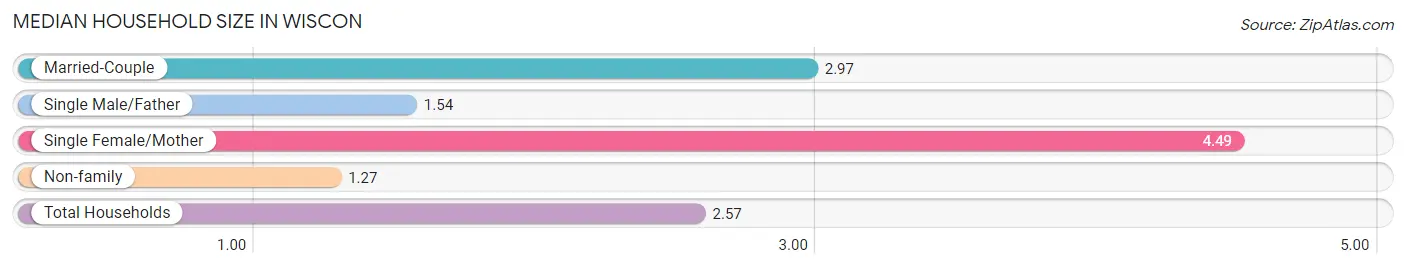
| Household Type | # Households | Household Size |
| Married-Couple | 60 (24.6%) | 2.97 |
| Single Male/Father | 26 (10.7%) | 1.54 |
| Single Female/Mother | 65 (26.6%) | 4.49 |
| Non-family | 93 (38.1%) | 1.27 |
| Total Households | 244 (100.0%) | 2.57 |
Household Size by Marriage Status in Wiscon
Out of a total of 244 households in Wiscon, 151 (61.9%) are family households, while 93 (38.1%) are nonfamily households. The most numerous type of family households are 2-person households, comprising 59, and the most common type of nonfamily households are 1-person households, comprising 53.
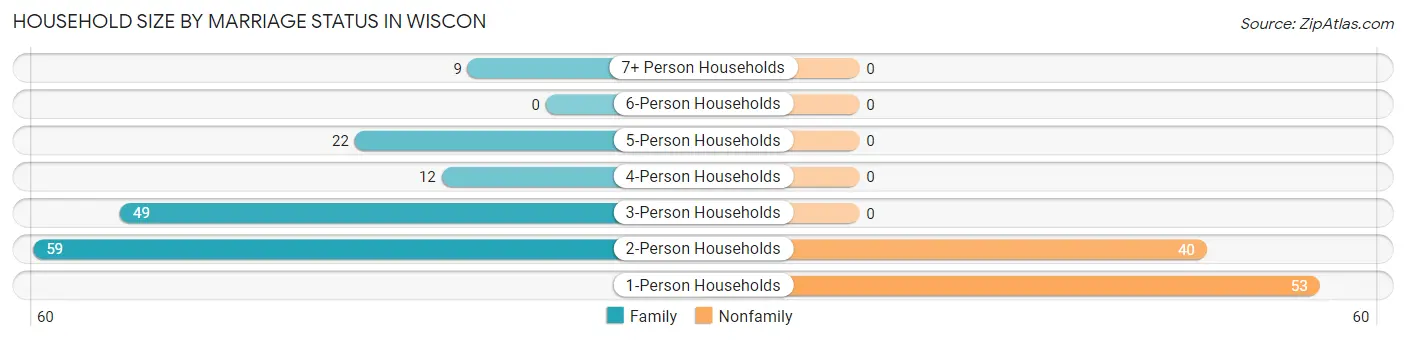
| Household Size | Family Households | Nonfamily Households |
| 1-Person Households | - | 53 (21.7%) |
| 2-Person Households | 59 (24.2%) | 40 (16.4%) |
| 3-Person Households | 49 (20.1%) | 0 (0.0%) |
| 4-Person Households | 12 (4.9%) | 0 (0.0%) |
| 5-Person Households | 22 (9.0%) | 0 (0.0%) |
| 6-Person Households | 0 (0.0%) | 0 (0.0%) |
| 7+ Person Households | 9 (3.7%) | 0 (0.0%) |
| Total | 151 (61.9%) | 93 (38.1%) |
Female Fertility in Wiscon
Fertility by Age in Wiscon
| Age Bracket | Women with Births | Births / 1,000 Women |
| 15 to 19 years | 0 (0.0%) | 0.0 |
| 20 to 34 years | 0 (0.0%) | 0.0 |
| 35 to 50 years | 0 (0.0%) | 0.0 |
| Total | 0 (0.0%) | 0.0 |
Fertility by Age by Marriage Status in Wiscon
| Age Bracket | Married | Unmarried |
| 15 to 19 years | 0 (0.0%) | 0 (0.0%) |
| 20 to 34 years | 0 (0.0%) | 0 (0.0%) |
| 35 to 50 years | 0 (0.0%) | 0 (0.0%) |
| Total | 0 (0.0%) | 0 (0.0%) |
Fertility by Education in Wiscon
| Educational Attainment | Women with Births | Births / 1,000 Women |
| Less than High School | 0 (0.0%) | 0.0 |
| High School Diploma | 0 (0.0%) | 0.0 |
| College or Associate's Degree | 0 (0.0%) | 0.0 |
| Bachelor's Degree | 0 (0.0%) | 0.0 |
| Graduate Degree | 0 (0.0%) | 0.0 |
| Total | 0 (0.0%) | 0.0 |
Fertility by Education by Marriage Status in Wiscon
| Educational Attainment | Married | Unmarried |
| Less than High School | 0 (0.0%) | 0 (0.0%) |
| High School Diploma | 0 (0.0%) | 0 (0.0%) |
| College or Associate's Degree | 0 (0.0%) | 0 (0.0%) |
| Bachelor's Degree | 0 (0.0%) | 0 (0.0%) |
| Graduate Degree | 0 (0.0%) | 0 (0.0%) |
| Total | 0 (0.0%) | 0 (0.0%) |
Employment Characteristics in Wiscon
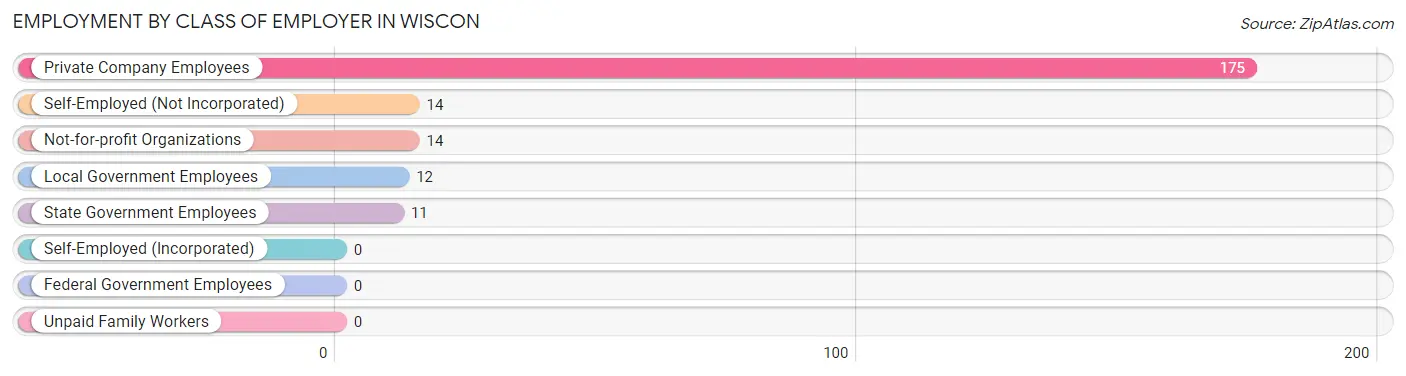
Employment by Class of Employer in Wiscon
Among the 226 employed individuals in Wiscon, private company employees (175 | 77.4%), self-employed (not incorporated) (14 | 6.2%), and not-for-profit organizations (14 | 6.2%) make up the most common classes of employment.
| Employer Class | # Employees | % Employees |
| Private Company Employees | 175 | 77.4% |
| Self-Employed (Incorporated) | 0 | 0.0% |
| Self-Employed (Not Incorporated) | 14 | 6.2% |
| Not-for-profit Organizations | 14 | 6.2% |
| Local Government Employees | 12 | 5.3% |
| State Government Employees | 11 | 4.9% |
| Federal Government Employees | 0 | 0.0% |
| Unpaid Family Workers | 0 | 0.0% |
| Total | 226 | 100.0% |
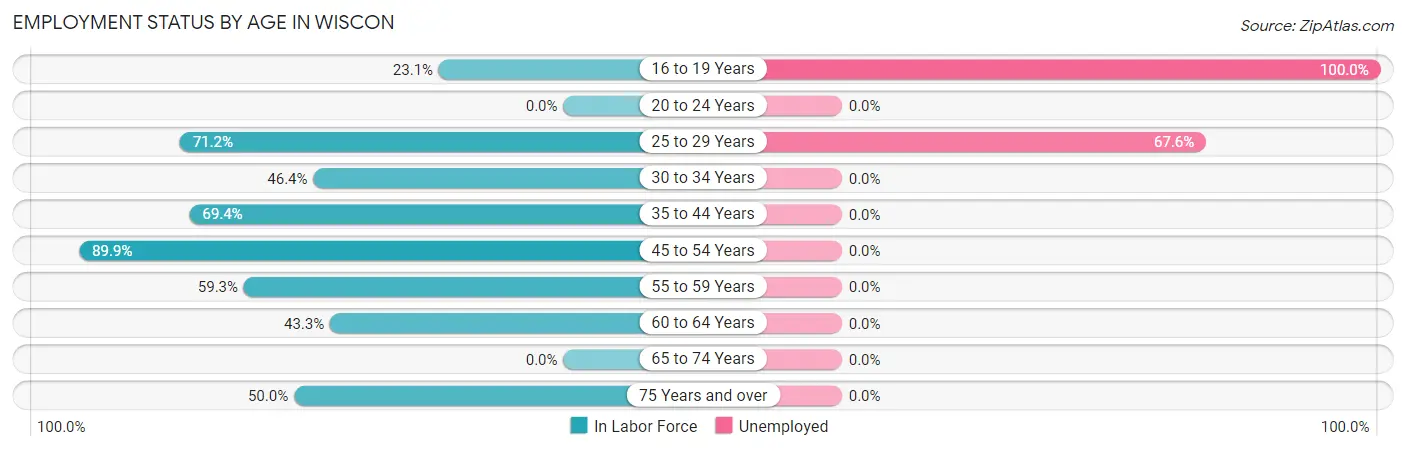
Employment Status by Age in Wiscon
According to the labor force statistics for Wiscon, out of the total population over 16 years of age (494), 52.6% or 260 individuals are in the labor force, with 13.1% or 34 of them unemployed. The age group with the highest labor force participation rate is 45 to 54 years, with 89.9% or 98 individuals in the labor force. Within the labor force, the 16 to 19 years age range has the highest percentage of unemployed individuals, with 100.0% or 9 of them being unemployed.
| Age Bracket | In Labor Force | Unemployed |
| 16 to 19 Years | 9 (23.1%) | 9 (100.0%) |
| 20 to 24 Years | 0 (0.0%) | 0 (0.0%) |
| 25 to 29 Years | 37 (71.2%) | 25 (67.6%) |
| 30 to 34 Years | 13 (46.4%) | 0 (0.0%) |
| 35 to 44 Years | 25 (69.4%) | 0 (0.0%) |
| 45 to 54 Years | 98 (89.9%) | 0 (0.0%) |
| 55 to 59 Years | 35 (59.3%) | 0 (0.0%) |
| 60 to 64 Years | 29 (43.3%) | 0 (0.0%) |
| 65 to 74 Years | 0 (0.0%) | 0 (0.0%) |
| 75 Years and over | 14 (50.0%) | 0 (0.0%) |
| Total | 260 (52.6%) | 34 (13.1%) |
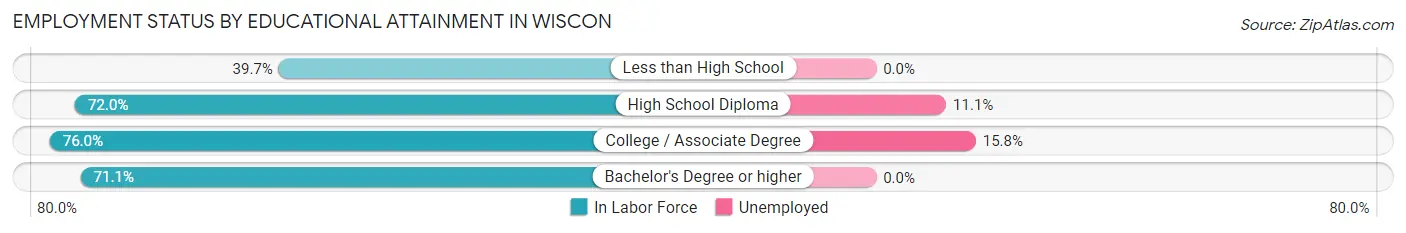
Employment Status by Educational Attainment in Wiscon
According to labor force statistics for Wiscon, 67.5% of individuals (237) out of the total population between 25 and 64 years of age (351) are in the labor force, with 10.5% or 25 of them being unemployed. The group with the highest labor force participation rate are those with the educational attainment of college / associate degree, with 76.0% or 95 individuals in the labor force. Within the labor force, individuals with college / associate degree education have the highest percentage of unemployment, with 15.8% or 15 of them being unemployed.
| Educational Attainment | In Labor Force | Unemployed |
| Less than High School | 25 (39.7%) | 0 (0.0%) |
| High School Diploma | 90 (72.0%) | 14 (11.1%) |
| College / Associate Degree | 95 (76.0%) | 20 (15.8%) |
| Bachelor's Degree or higher | 27 (71.1%) | 0 (0.0%) |
| Total | 237 (67.5%) | 37 (10.5%) |
Employment Occupations by Sex in Wiscon
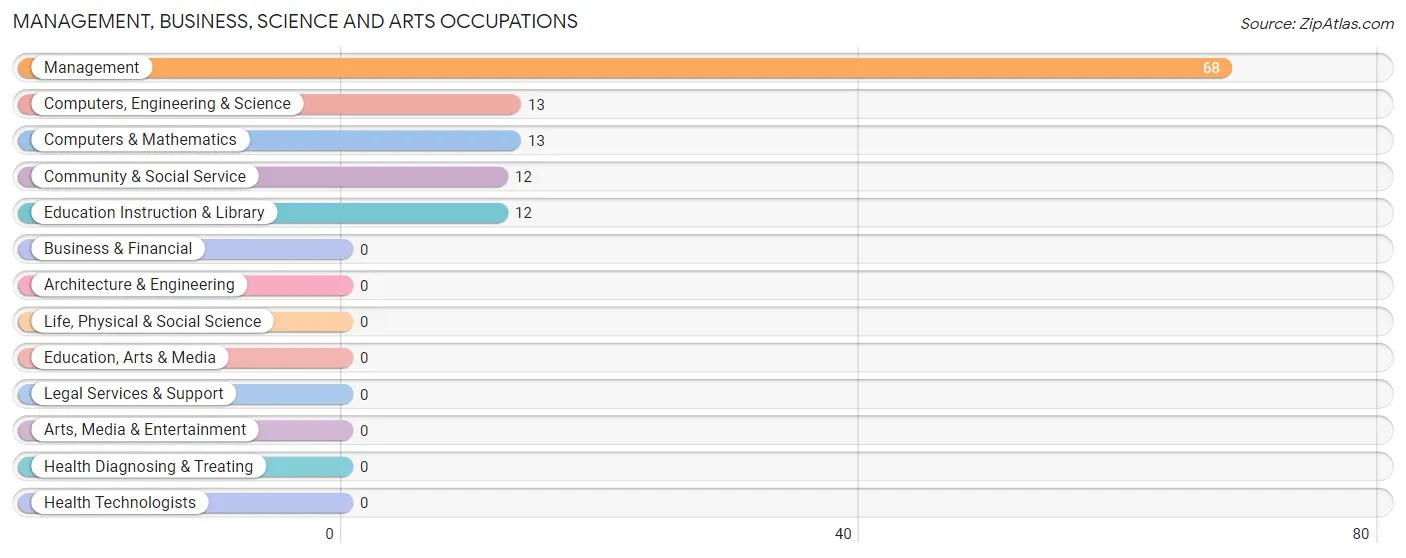
Management, Business, Science and Arts Occupations
The most common Management, Business, Science and Arts occupations in Wiscon are Management (68 | 30.1%), Computers, Engineering & Science (13 | 5.8%), Computers & Mathematics (13 | 5.8%), Community & Social Service (12 | 5.3%), and Education Instruction & Library (12 | 5.3%).
Management, Business, Science and Arts Occupations by Sex
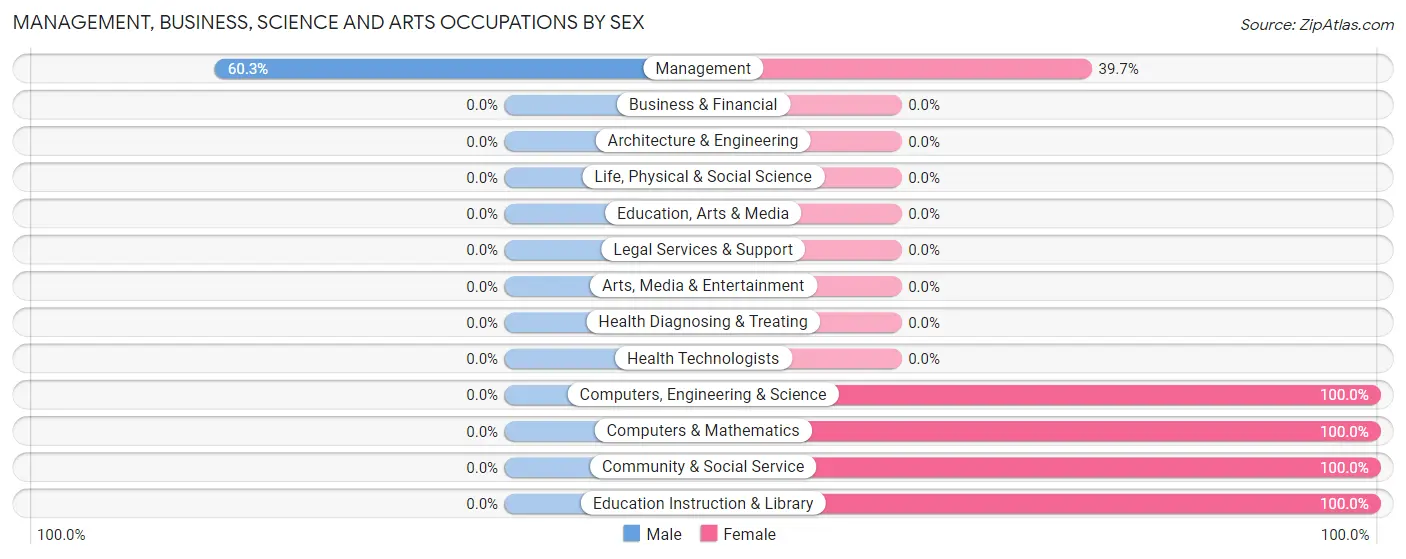
| Occupation | Male | Female |
| Management | 41 (60.3%) | 27 (39.7%) |
| Business & Financial | 0 (0.0%) | 0 (0.0%) |
| Computers, Engineering & Science | 0 (0.0%) | 13 (100.0%) |
| Computers & Mathematics | 0 (0.0%) | 13 (100.0%) |
| Architecture & Engineering | 0 (0.0%) | 0 (0.0%) |
| Life, Physical & Social Science | 0 (0.0%) | 0 (0.0%) |
| Community & Social Service | 0 (0.0%) | 12 (100.0%) |
| Education, Arts & Media | 0 (0.0%) | 0 (0.0%) |
| Legal Services & Support | 0 (0.0%) | 0 (0.0%) |
| Education Instruction & Library | 0 (0.0%) | 12 (100.0%) |
| Arts, Media & Entertainment | 0 (0.0%) | 0 (0.0%) |
| Health Diagnosing & Treating | 0 (0.0%) | 0 (0.0%) |
| Health Technologists | 0 (0.0%) | 0 (0.0%) |
| Total (Category) | 41 (44.1%) | 52 (55.9%) |
| Total (Overall) | 133 (58.9%) | 93 (41.1%) |
Services Occupations
The most common Services occupations in Wiscon are , and Cleaning & Maintenance (8 | 3.5%).
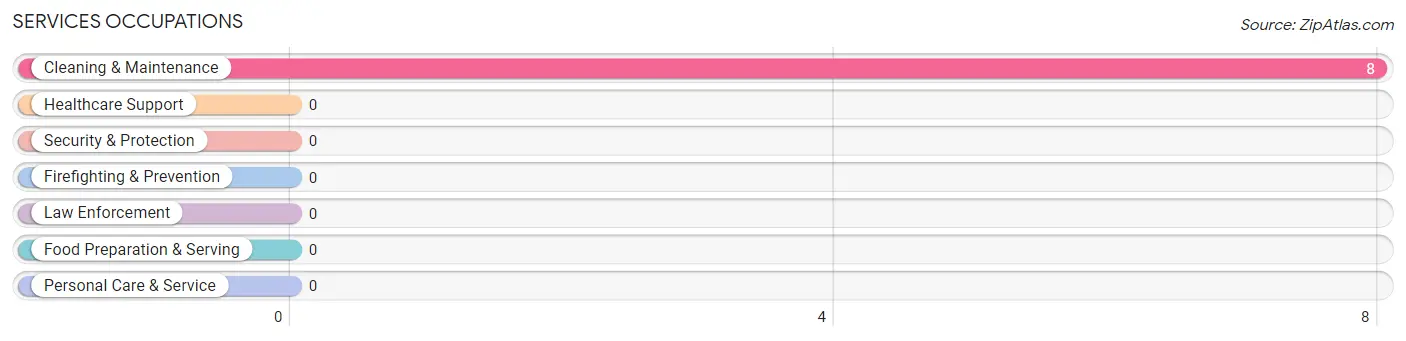
Services Occupations by Sex
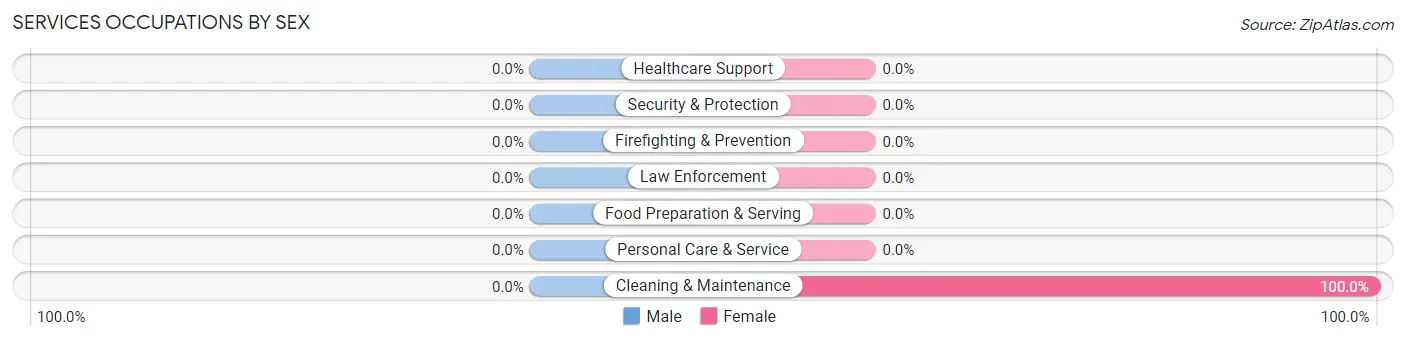
| Occupation | Male | Female |
| Healthcare Support | 0 (0.0%) | 0 (0.0%) |
| Security & Protection | 0 (0.0%) | 0 (0.0%) |
| Firefighting & Prevention | 0 (0.0%) | 0 (0.0%) |
| Law Enforcement | 0 (0.0%) | 0 (0.0%) |
| Food Preparation & Serving | 0 (0.0%) | 0 (0.0%) |
| Cleaning & Maintenance | 0 (0.0%) | 8 (100.0%) |
| Personal Care & Service | 0 (0.0%) | 0 (0.0%) |
| Total (Category) | 0 (0.0%) | 8 (100.0%) |
| Total (Overall) | 133 (58.9%) | 93 (41.1%) |
Sales and Office Occupations
The most common Sales and Office occupations in Wiscon are , and Office & Administration (11 | 4.9%).

Sales and Office Occupations by Sex

| Occupation | Male | Female |
| Sales & Related | 0 (0.0%) | 0 (0.0%) |
| Office & Administration | 0 (0.0%) | 11 (100.0%) |
| Total (Category) | 0 (0.0%) | 11 (100.0%) |
| Total (Overall) | 133 (58.9%) | 93 (41.1%) |
Natural Resources, Construction and Maintenance Occupations
The most common Natural Resources, Construction and Maintenance occupations in Wiscon are Installation, Maintenance & Repair (13 | 5.8%), and Construction & Extraction (12 | 5.3%).
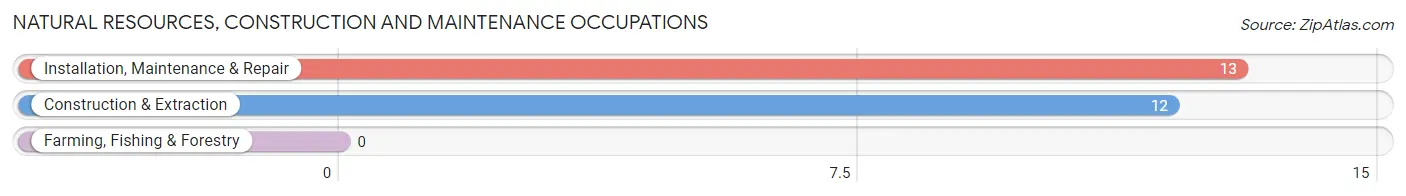
Natural Resources, Construction and Maintenance Occupations by Sex
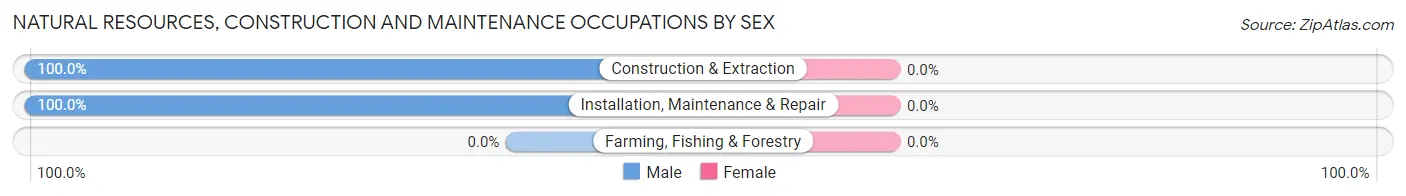
| Occupation | Male | Female |
| Farming, Fishing & Forestry | 0 (0.0%) | 0 (0.0%) |
| Construction & Extraction | 12 (100.0%) | 0 (0.0%) |
| Installation, Maintenance & Repair | 13 (100.0%) | 0 (0.0%) |
| Total (Category) | 25 (100.0%) | 0 (0.0%) |
| Total (Overall) | 133 (58.9%) | 93 (41.1%) |
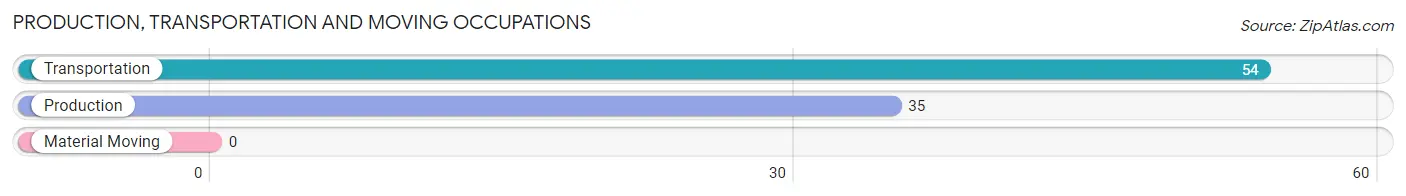
Production, Transportation and Moving Occupations
The most common Production, Transportation and Moving occupations in Wiscon are Transportation (54 | 23.9%), and Production (35 | 15.5%).
Production, Transportation and Moving Occupations by Sex
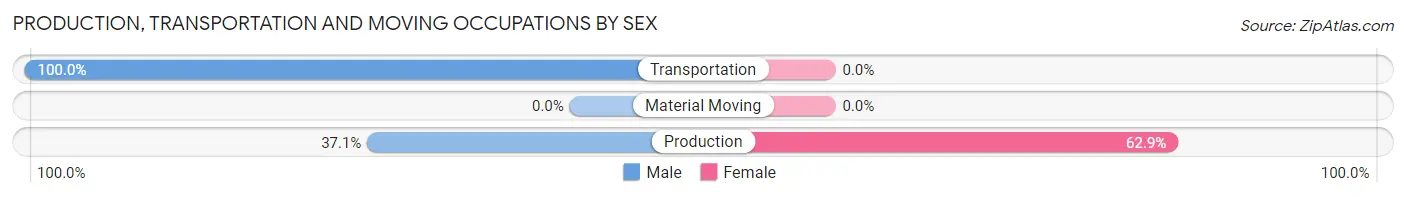
| Occupation | Male | Female |
| Production | 13 (37.1%) | 22 (62.9%) |
| Transportation | 54 (100.0%) | 0 (0.0%) |
| Material Moving | 0 (0.0%) | 0 (0.0%) |
| Total (Category) | 67 (75.3%) | 22 (24.7%) |
| Total (Overall) | 133 (58.9%) | 93 (41.1%) |
Employment Industries by Sex in Wiscon
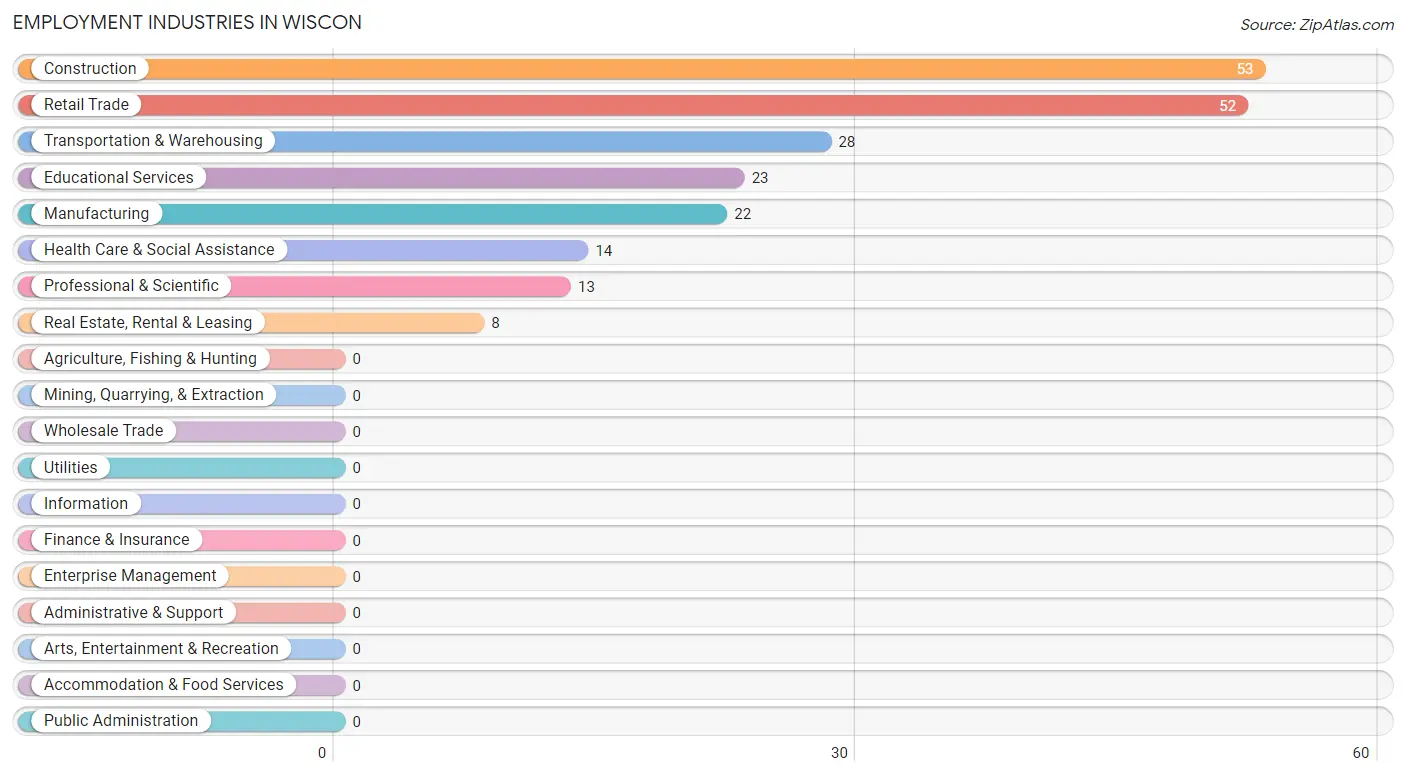
Employment Industries in Wiscon
The major employment industries in Wiscon include Construction (53 | 23.4%), Retail Trade (52 | 23.0%), Transportation & Warehousing (28 | 12.4%), Educational Services (23 | 10.2%), and Manufacturing (22 | 9.7%).
Employment Industries by Sex in Wiscon
The Wiscon industries that see more men than women are Construction (100.0%), Transportation & Warehousing (100.0%), and Retail Trade (75.0%), whereas the industries that tend to have a higher number of women are Manufacturing (100.0%), Real Estate, Rental & Leasing (100.0%), and Professional & Scientific (100.0%).
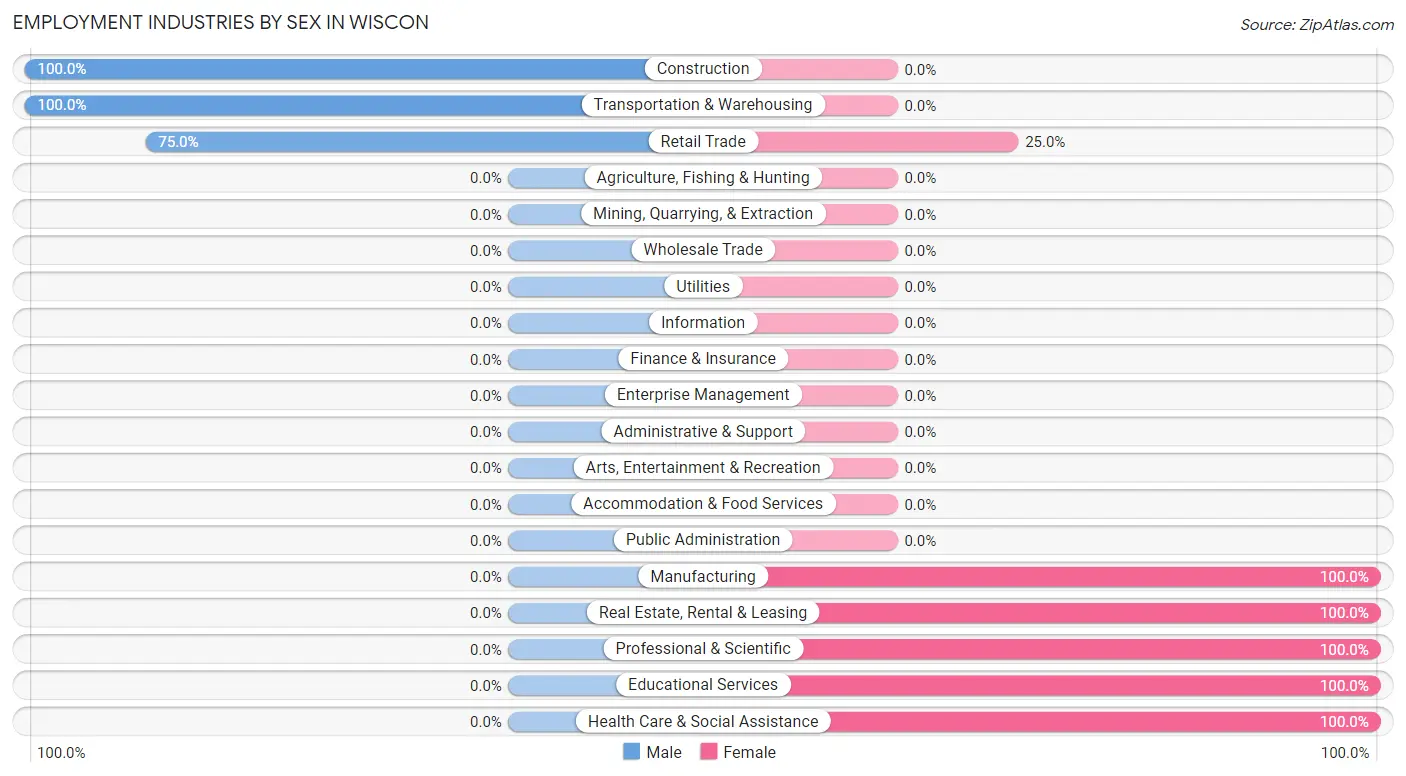
| Industry | Male | Female |
| Agriculture, Fishing & Hunting | 0 (0.0%) | 0 (0.0%) |
| Mining, Quarrying, & Extraction | 0 (0.0%) | 0 (0.0%) |
| Construction | 53 (100.0%) | 0 (0.0%) |
| Manufacturing | 0 (0.0%) | 22 (100.0%) |
| Wholesale Trade | 0 (0.0%) | 0 (0.0%) |
| Retail Trade | 39 (75.0%) | 13 (25.0%) |
| Transportation & Warehousing | 28 (100.0%) | 0 (0.0%) |
| Utilities | 0 (0.0%) | 0 (0.0%) |
| Information | 0 (0.0%) | 0 (0.0%) |
| Finance & Insurance | 0 (0.0%) | 0 (0.0%) |
| Real Estate, Rental & Leasing | 0 (0.0%) | 8 (100.0%) |
| Professional & Scientific | 0 (0.0%) | 13 (100.0%) |
| Enterprise Management | 0 (0.0%) | 0 (0.0%) |
| Administrative & Support | 0 (0.0%) | 0 (0.0%) |
| Educational Services | 0 (0.0%) | 23 (100.0%) |
| Health Care & Social Assistance | 0 (0.0%) | 14 (100.0%) |
| Arts, Entertainment & Recreation | 0 (0.0%) | 0 (0.0%) |
| Accommodation & Food Services | 0 (0.0%) | 0 (0.0%) |
| Public Administration | 0 (0.0%) | 0 (0.0%) |
| Total | 133 (58.9%) | 93 (41.1%) |
Education in Wiscon
School Enrollment in Wiscon
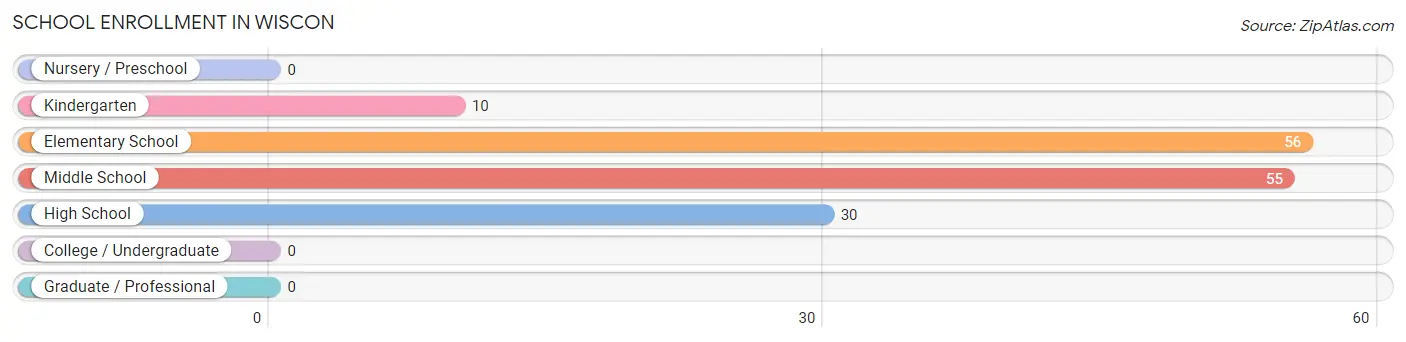
The most common levels of schooling among the 151 students in Wiscon are elementary school (56 | 37.1%), middle school (55 | 36.4%), and high school (30 | 19.9%).
| School Level | # Students | % Students |
| Nursery / Preschool | 0 | 0.0% |
| Kindergarten | 10 | 6.6% |
| Elementary School | 56 | 37.1% |
| Middle School | 55 | 36.4% |
| High School | 30 | 19.9% |
| College / Undergraduate | 0 | 0.0% |
| Graduate / Professional | 0 | 0.0% |
| Total | 151 | 100.0% |
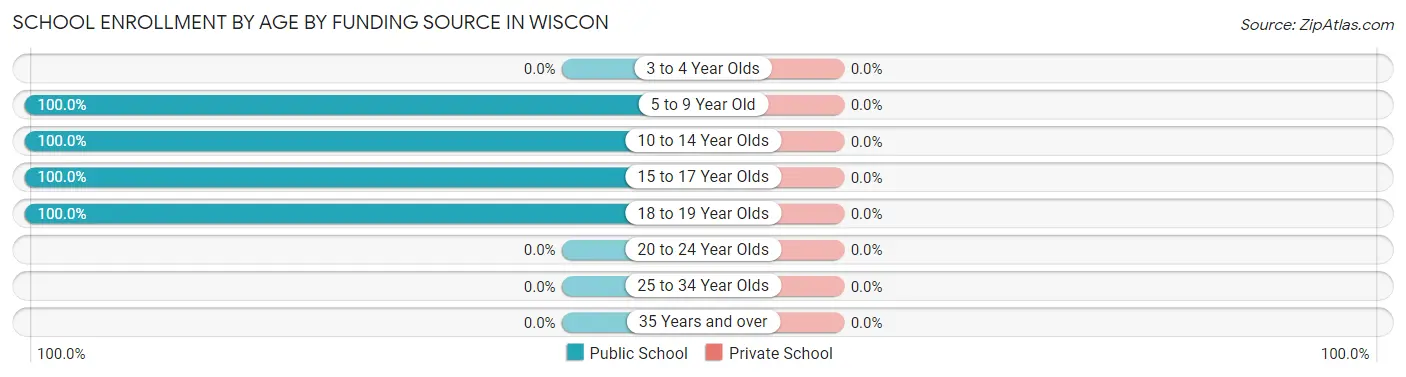
School Enrollment by Age by Funding Source in Wiscon
| Age Bracket | Public School | Private School |
| 3 to 4 Year Olds | 0 (0.0%) | 0 (0.0%) |
| 5 to 9 Year Old | 56 (100.0%) | 0 (0.0%) |
| 10 to 14 Year Olds | 65 (100.0%) | 0 (0.0%) |
| 15 to 17 Year Olds | 16 (100.0%) | 0 (0.0%) |
| 18 to 19 Year Olds | 14 (100.0%) | 0 (0.0%) |
| 20 to 24 Year Olds | 0 (0.0%) | 0 (0.0%) |
| 25 to 34 Year Olds | 0 (0.0%) | 0 (0.0%) |
| 35 Years and over | 0 (0.0%) | 0 (0.0%) |
| Total | 151 (100.0%) | 0 (0.0%) |
Educational Attainment by Field of Study in Wiscon
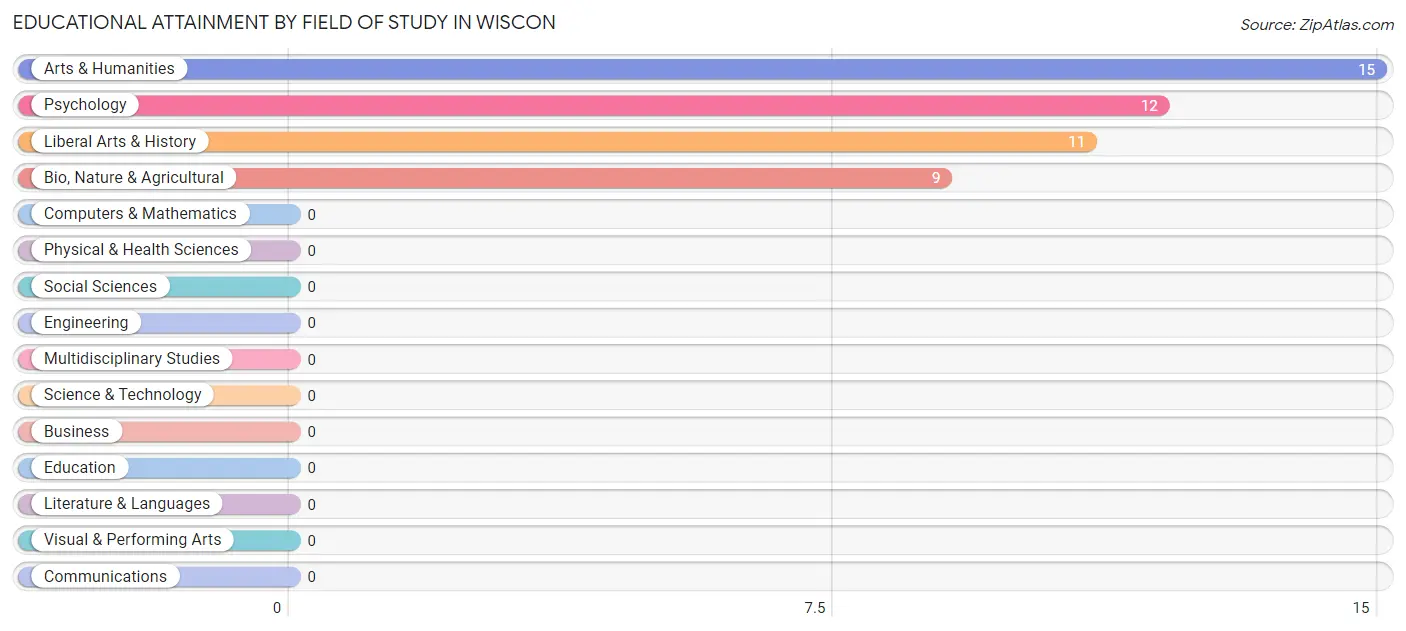
Arts & humanities (15 | 31.9%), psychology (12 | 25.5%), liberal arts & history (11 | 23.4%), and bio, nature & agricultural (9 | 19.2%) are the most common fields of study among 47 individuals in Wiscon who have obtained a bachelor's degree or higher.
| Field of Study | # Graduates | % Graduates |
| Computers & Mathematics | 0 | 0.0% |
| Bio, Nature & Agricultural | 9 | 19.2% |
| Physical & Health Sciences | 0 | 0.0% |
| Psychology | 12 | 25.5% |
| Social Sciences | 0 | 0.0% |
| Engineering | 0 | 0.0% |
| Multidisciplinary Studies | 0 | 0.0% |
| Science & Technology | 0 | 0.0% |
| Business | 0 | 0.0% |
| Education | 0 | 0.0% |
| Literature & Languages | 0 | 0.0% |
| Liberal Arts & History | 11 | 23.4% |
| Visual & Performing Arts | 0 | 0.0% |
| Communications | 0 | 0.0% |
| Arts & Humanities | 15 | 31.9% |
| Total | 47 | 100.0% |
Transportation & Commute in Wiscon
Vehicle Availability by Sex in Wiscon
The most prevalent vehicle ownership categories in Wiscon are males with 2 vehicles (67, accounting for 50.4%) and females with 2 vehicles (50, making up 72.0%).
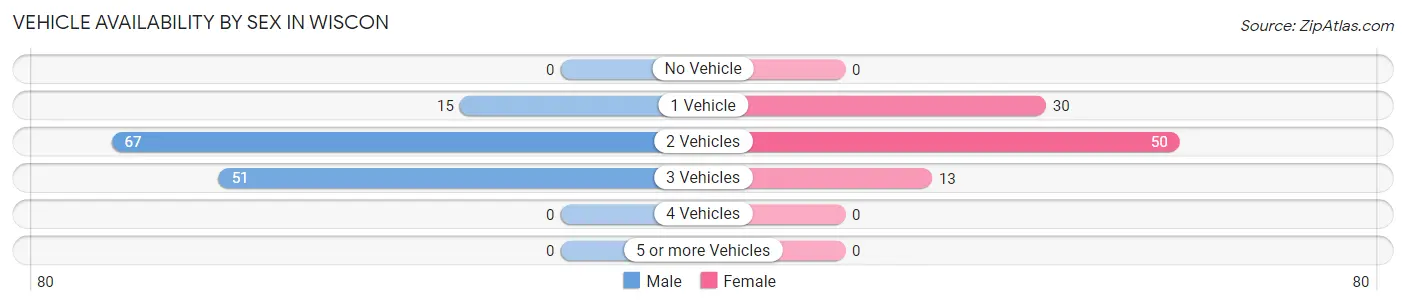
| Vehicles Available | Male | Female |
| No Vehicle | 0 (0.0%) | 0 (0.0%) |
| 1 Vehicle | 15 (11.3%) | 30 (32.3%) |
| 2 Vehicles | 67 (50.4%) | 50 (53.8%) |
| 3 Vehicles | 51 (38.4%) | 13 (14.0%) |
| 4 Vehicles | 0 (0.0%) | 0 (0.0%) |
| 5 or more Vehicles | 0 (0.0%) | 0 (0.0%) |
| Total | 133 (100.0%) | 93 (100.0%) |
Commute Time in Wiscon
The most frequently occuring commute durations in Wiscon are 10 to 14 minutes (68 commuters, 34.2%), 60 to 89 minutes (66 commuters, 33.2%), and 20 to 24 minutes (27 commuters, 13.6%).
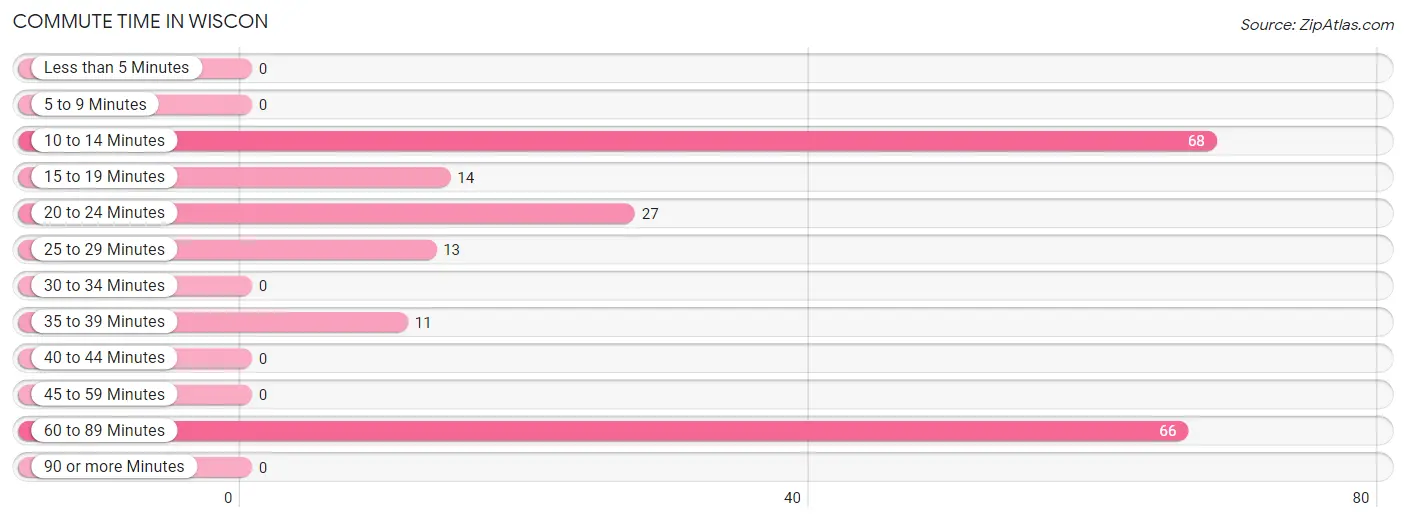
| Commute Time | # Commuters | % Commuters |
| Less than 5 Minutes | 0 | 0.0% |
| 5 to 9 Minutes | 0 | 0.0% |
| 10 to 14 Minutes | 68 | 34.2% |
| 15 to 19 Minutes | 14 | 7.0% |
| 20 to 24 Minutes | 27 | 13.6% |
| 25 to 29 Minutes | 13 | 6.5% |
| 30 to 34 Minutes | 0 | 0.0% |
| 35 to 39 Minutes | 11 | 5.5% |
| 40 to 44 Minutes | 0 | 0.0% |
| 45 to 59 Minutes | 0 | 0.0% |
| 60 to 89 Minutes | 66 | 33.2% |
| 90 or more Minutes | 0 | 0.0% |
Commute Time by Sex in Wiscon
The most common commute times in Wiscon are 60 to 89 minutes (54 commuters, 40.6%) for males and 10 to 14 minutes (30 commuters, 45.5%) for females.
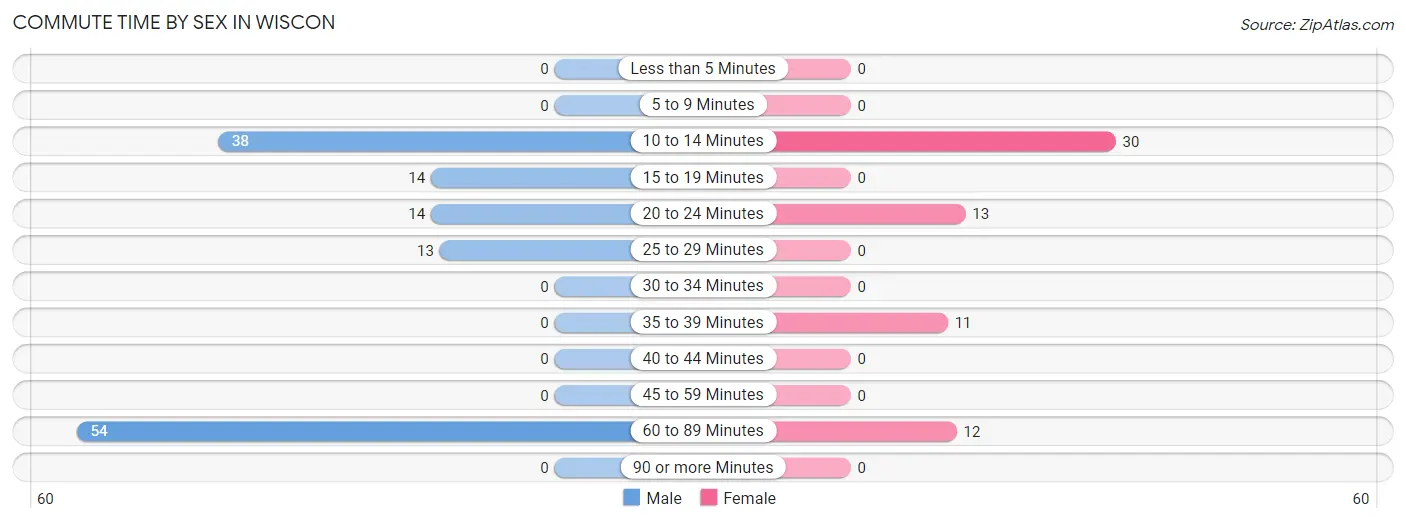
| Commute Time | Male | Female |
| Less than 5 Minutes | 0 (0.0%) | 0 (0.0%) |
| 5 to 9 Minutes | 0 (0.0%) | 0 (0.0%) |
| 10 to 14 Minutes | 38 (28.6%) | 30 (45.5%) |
| 15 to 19 Minutes | 14 (10.5%) | 0 (0.0%) |
| 20 to 24 Minutes | 14 (10.5%) | 13 (19.7%) |
| 25 to 29 Minutes | 13 (9.8%) | 0 (0.0%) |
| 30 to 34 Minutes | 0 (0.0%) | 0 (0.0%) |
| 35 to 39 Minutes | 0 (0.0%) | 11 (16.7%) |
| 40 to 44 Minutes | 0 (0.0%) | 0 (0.0%) |
| 45 to 59 Minutes | 0 (0.0%) | 0 (0.0%) |
| 60 to 89 Minutes | 54 (40.6%) | 12 (18.2%) |
| 90 or more Minutes | 0 (0.0%) | 0 (0.0%) |
Time of Departure to Work by Sex in Wiscon
The most frequent times of departure to work in Wiscon are 5:00 AM to 5:29 AM (55, 41.3%) for males and 6:30 AM to 6:59 AM (30, 45.5%) for females.
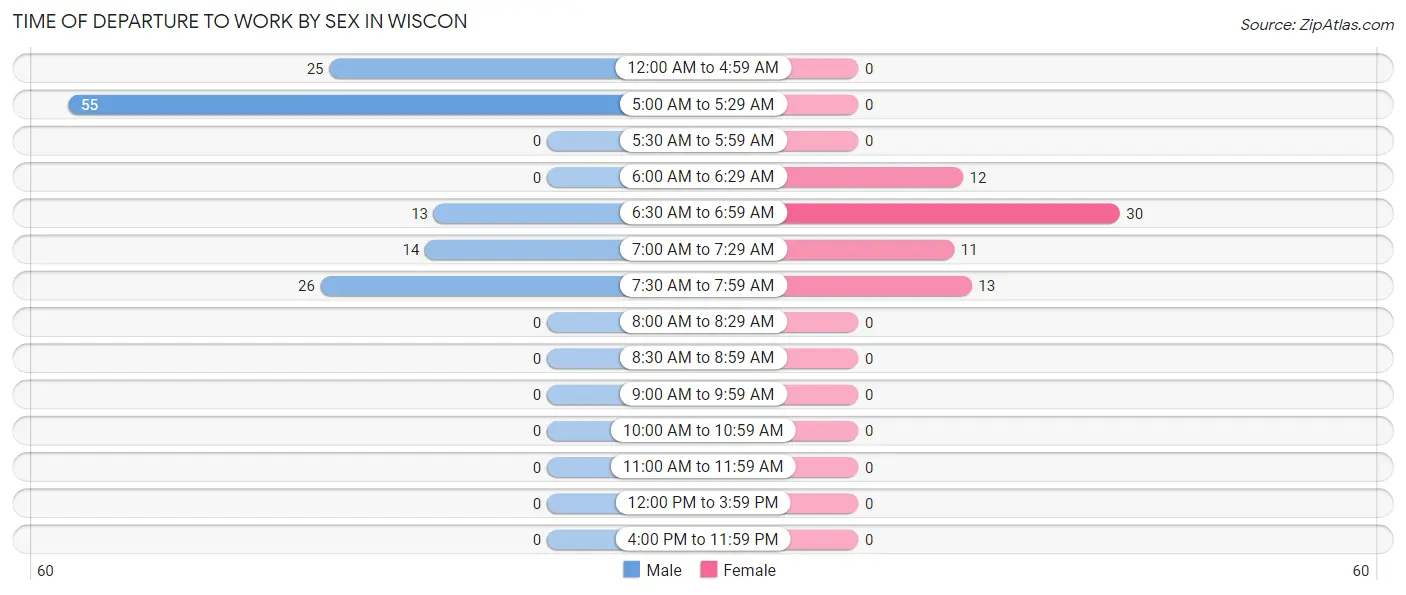
| Time of Departure | Male | Female |
| 12:00 AM to 4:59 AM | 25 (18.8%) | 0 (0.0%) |
| 5:00 AM to 5:29 AM | 55 (41.3%) | 0 (0.0%) |
| 5:30 AM to 5:59 AM | 0 (0.0%) | 0 (0.0%) |
| 6:00 AM to 6:29 AM | 0 (0.0%) | 12 (18.2%) |
| 6:30 AM to 6:59 AM | 13 (9.8%) | 30 (45.5%) |
| 7:00 AM to 7:29 AM | 14 (10.5%) | 11 (16.7%) |
| 7:30 AM to 7:59 AM | 26 (19.6%) | 13 (19.7%) |
| 8:00 AM to 8:29 AM | 0 (0.0%) | 0 (0.0%) |
| 8:30 AM to 8:59 AM | 0 (0.0%) | 0 (0.0%) |
| 9:00 AM to 9:59 AM | 0 (0.0%) | 0 (0.0%) |
| 10:00 AM to 10:59 AM | 0 (0.0%) | 0 (0.0%) |
| 11:00 AM to 11:59 AM | 0 (0.0%) | 0 (0.0%) |
| 12:00 PM to 3:59 PM | 0 (0.0%) | 0 (0.0%) |
| 4:00 PM to 11:59 PM | 0 (0.0%) | 0 (0.0%) |
| Total | 133 (100.0%) | 66 (100.0%) |
Housing Occupancy in Wiscon
Occupancy by Ownership in Wiscon
Of the total 244 dwellings in Wiscon, owner-occupied units account for 170 (69.7%), while renter-occupied units make up 74 (30.3%).
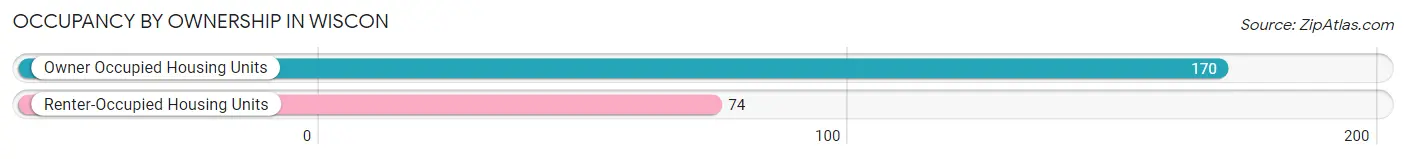
| Occupancy | # Housing Units | % Housing Units |
| Owner Occupied Housing Units | 170 | 69.7% |
| Renter-Occupied Housing Units | 74 | 30.3% |
| Total Occupied Housing Units | 244 | 100.0% |
Occupancy by Household Size in Wiscon
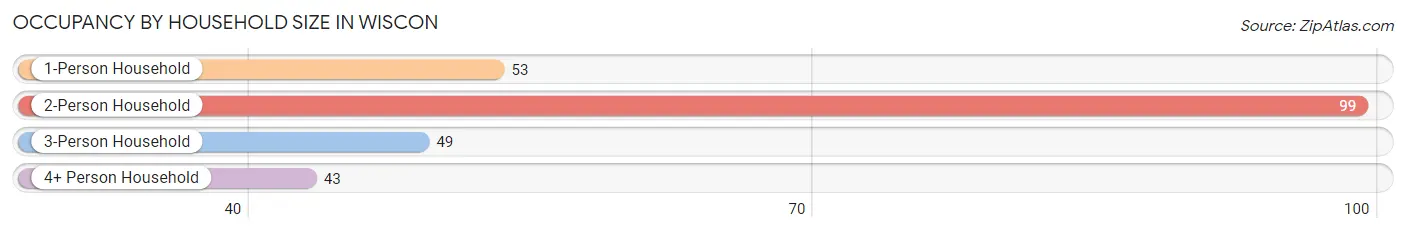
| Household Size | # Housing Units | % Housing Units |
| 1-Person Household | 53 | 21.7% |
| 2-Person Household | 99 | 40.6% |
| 3-Person Household | 49 | 20.1% |
| 4+ Person Household | 43 | 17.6% |
| Total Housing Units | 244 | 100.0% |
Occupancy by Ownership by Household Size in Wiscon
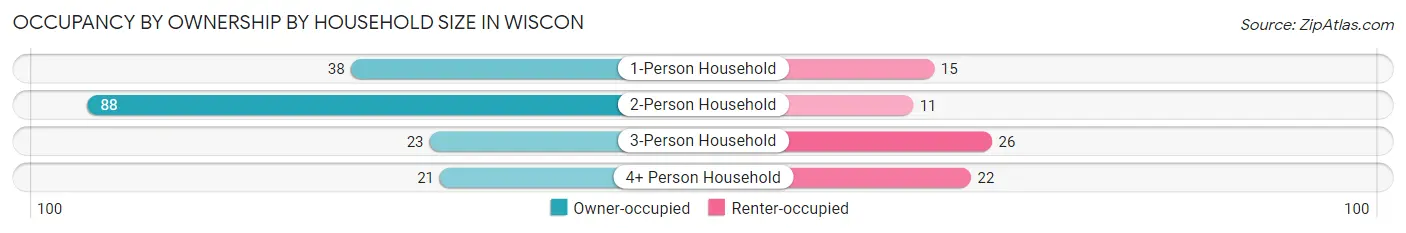
| Household Size | Owner-occupied | Renter-occupied |
| 1-Person Household | 38 (71.7%) | 15 (28.3%) |
| 2-Person Household | 88 (88.9%) | 11 (11.1%) |
| 3-Person Household | 23 (46.9%) | 26 (53.1%) |
| 4+ Person Household | 21 (48.8%) | 22 (51.2%) |
| Total Housing Units | 170 (69.7%) | 74 (30.3%) |
Occupancy by Educational Attainment in Wiscon
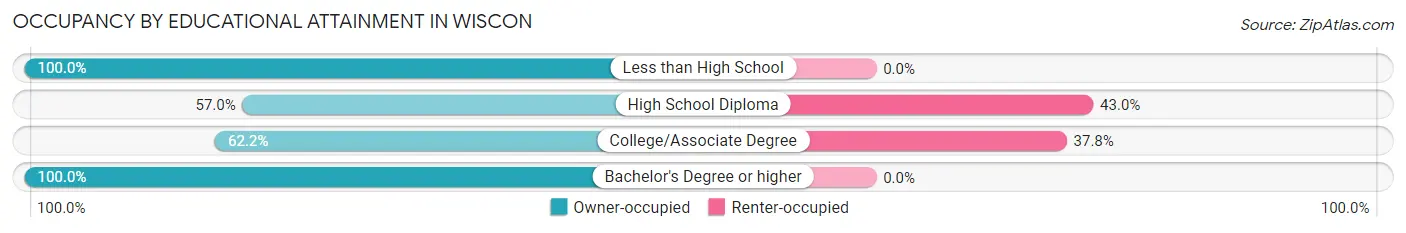
| Household Size | Owner-occupied | Renter-occupied |
| Less than High School | 24 (100.0%) | 0 (0.0%) |
| High School Diploma | 49 (57.0%) | 37 (43.0%) |
| College/Associate Degree | 61 (62.2%) | 37 (37.8%) |
| Bachelor's Degree or higher | 36 (100.0%) | 0 (0.0%) |
Occupancy by Age of Householder in Wiscon
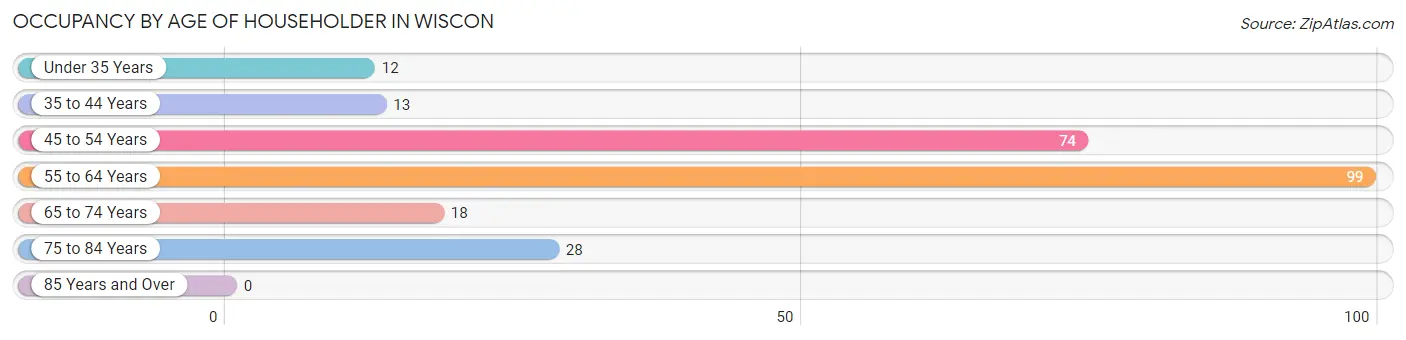
| Age Bracket | # Households | % Households |
| Under 35 Years | 12 | 4.9% |
| 35 to 44 Years | 13 | 5.3% |
| 45 to 54 Years | 74 | 30.3% |
| 55 to 64 Years | 99 | 40.6% |
| 65 to 74 Years | 18 | 7.4% |
| 75 to 84 Years | 28 | 11.5% |
| 85 Years and Over | 0 | 0.0% |
| Total | 244 | 100.0% |
Housing Finances in Wiscon
Median Income by Occupancy in Wiscon
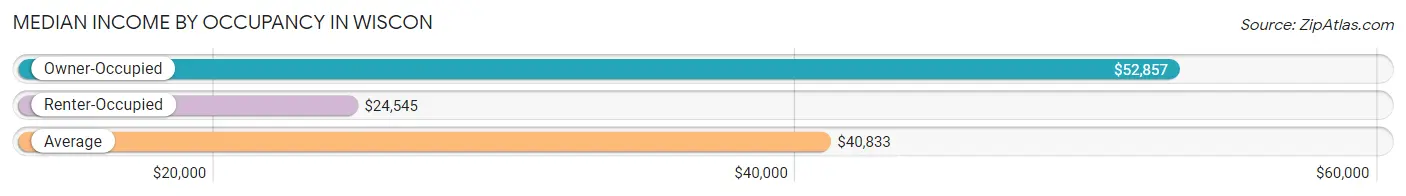
| Occupancy Type | # Households | Median Income |
| Owner-Occupied | 170 (69.7%) | $52,857 |
| Renter-Occupied | 74 (30.3%) | $24,545 |
| Average | 244 (100.0%) | $40,833 |
Occupancy by Householder Income Bracket in Wiscon
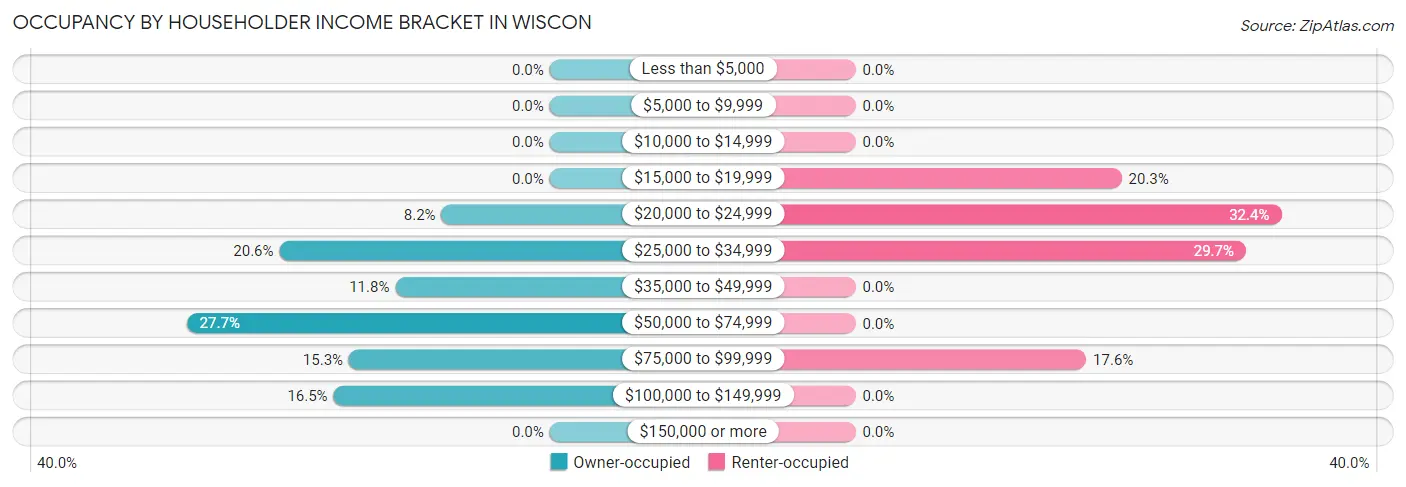
| Income Bracket | Owner-occupied | Renter-occupied |
| Less than $5,000 | 0 (0.0%) | 0 (0.0%) |
| $5,000 to $9,999 | 0 (0.0%) | 0 (0.0%) |
| $10,000 to $14,999 | 0 (0.0%) | 0 (0.0%) |
| $15,000 to $19,999 | 0 (0.0%) | 15 (20.3%) |
| $20,000 to $24,999 | 14 (8.2%) | 24 (32.4%) |
| $25,000 to $34,999 | 35 (20.6%) | 22 (29.7%) |
| $35,000 to $49,999 | 20 (11.8%) | 0 (0.0%) |
| $50,000 to $74,999 | 47 (27.7%) | 0 (0.0%) |
| $75,000 to $99,999 | 26 (15.3%) | 13 (17.6%) |
| $100,000 to $149,999 | 28 (16.5%) | 0 (0.0%) |
| $150,000 or more | 0 (0.0%) | 0 (0.0%) |
| Total | 170 (100.0%) | 74 (100.0%) |
Monthly Housing Cost Tiers in Wiscon
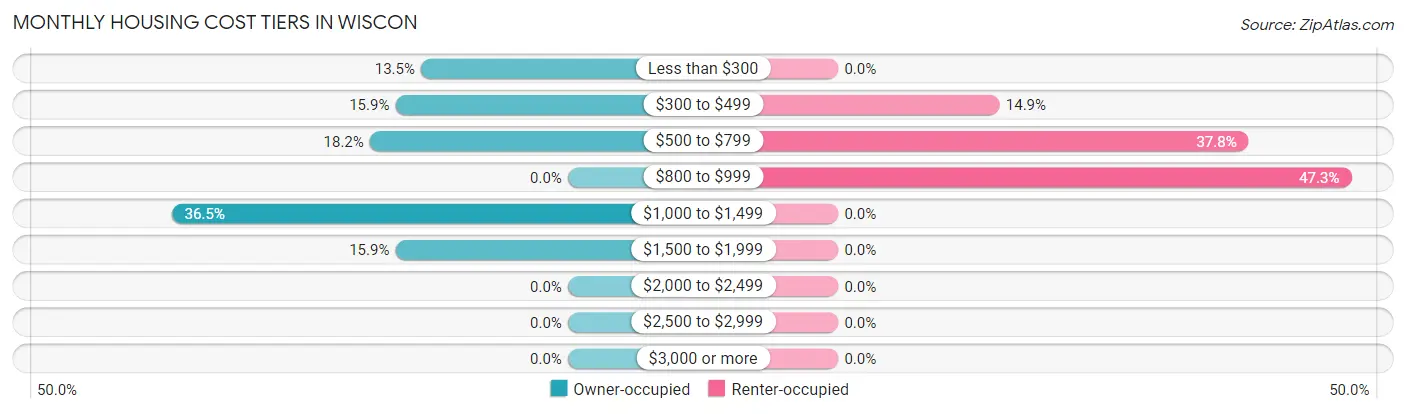
| Monthly Cost | Owner-occupied | Renter-occupied |
| Less than $300 | 23 (13.5%) | 0 (0.0%) |
| $300 to $499 | 27 (15.9%) | 11 (14.9%) |
| $500 to $799 | 31 (18.2%) | 28 (37.8%) |
| $800 to $999 | 0 (0.0%) | 35 (47.3%) |
| $1,000 to $1,499 | 62 (36.5%) | 0 (0.0%) |
| $1,500 to $1,999 | 27 (15.9%) | 0 (0.0%) |
| $2,000 to $2,499 | 0 (0.0%) | 0 (0.0%) |
| $2,500 to $2,999 | 0 (0.0%) | 0 (0.0%) |
| $3,000 or more | 0 (0.0%) | 0 (0.0%) |
| Total | 170 (100.0%) | 74 (100.0%) |
Physical Housing Characteristics in Wiscon
Housing Structures in Wiscon
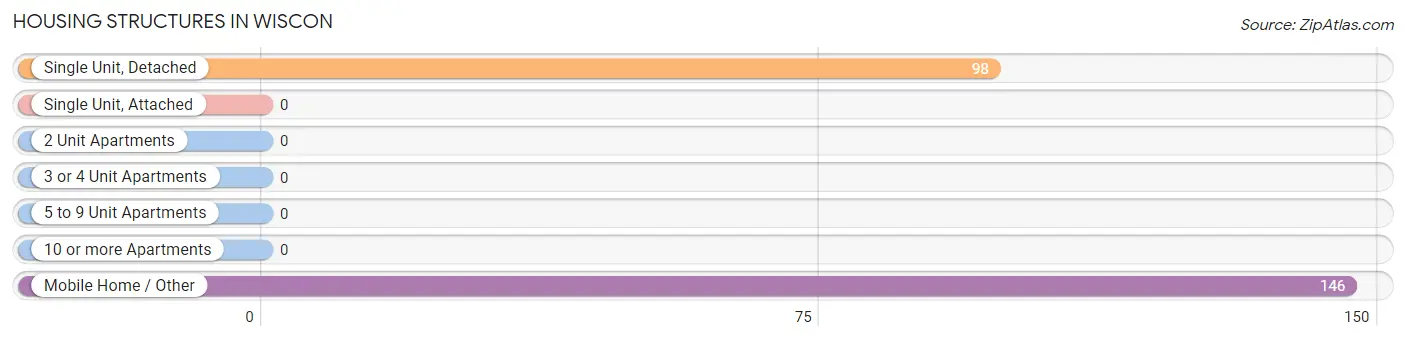
| Structure Type | # Housing Units | % Housing Units |
| Single Unit, Detached | 98 | 40.2% |
| Single Unit, Attached | 0 | 0.0% |
| 2 Unit Apartments | 0 | 0.0% |
| 3 or 4 Unit Apartments | 0 | 0.0% |
| 5 to 9 Unit Apartments | 0 | 0.0% |
| 10 or more Apartments | 0 | 0.0% |
| Mobile Home / Other | 146 | 59.8% |
| Total | 244 | 100.0% |
Housing Structures by Occupancy in Wiscon
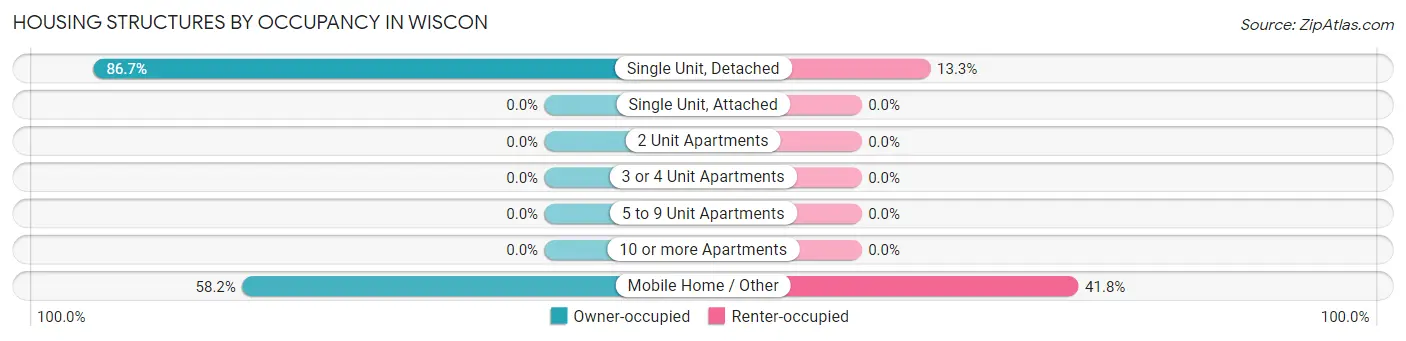
| Structure Type | Owner-occupied | Renter-occupied |
| Single Unit, Detached | 85 (86.7%) | 13 (13.3%) |
| Single Unit, Attached | 0 (0.0%) | 0 (0.0%) |
| 2 Unit Apartments | 0 (0.0%) | 0 (0.0%) |
| 3 or 4 Unit Apartments | 0 (0.0%) | 0 (0.0%) |
| 5 to 9 Unit Apartments | 0 (0.0%) | 0 (0.0%) |
| 10 or more Apartments | 0 (0.0%) | 0 (0.0%) |
| Mobile Home / Other | 85 (58.2%) | 61 (41.8%) |
| Total | 170 (69.7%) | 74 (30.3%) |
Housing Structures by Number of Rooms in Wiscon
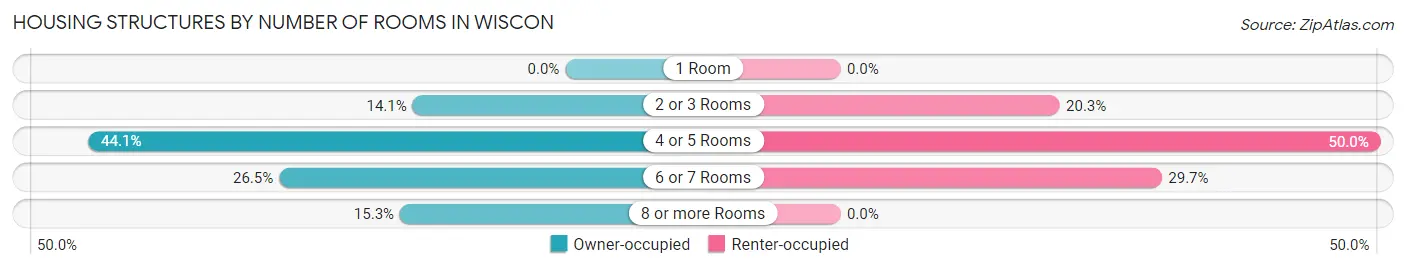
| Number of Rooms | Owner-occupied | Renter-occupied |
| 1 Room | 0 (0.0%) | 0 (0.0%) |
| 2 or 3 Rooms | 24 (14.1%) | 15 (20.3%) |
| 4 or 5 Rooms | 75 (44.1%) | 37 (50.0%) |
| 6 or 7 Rooms | 45 (26.5%) | 22 (29.7%) |
| 8 or more Rooms | 26 (15.3%) | 0 (0.0%) |
| Total | 170 (100.0%) | 74 (100.0%) |
Housing Structure by Heating Type in Wiscon
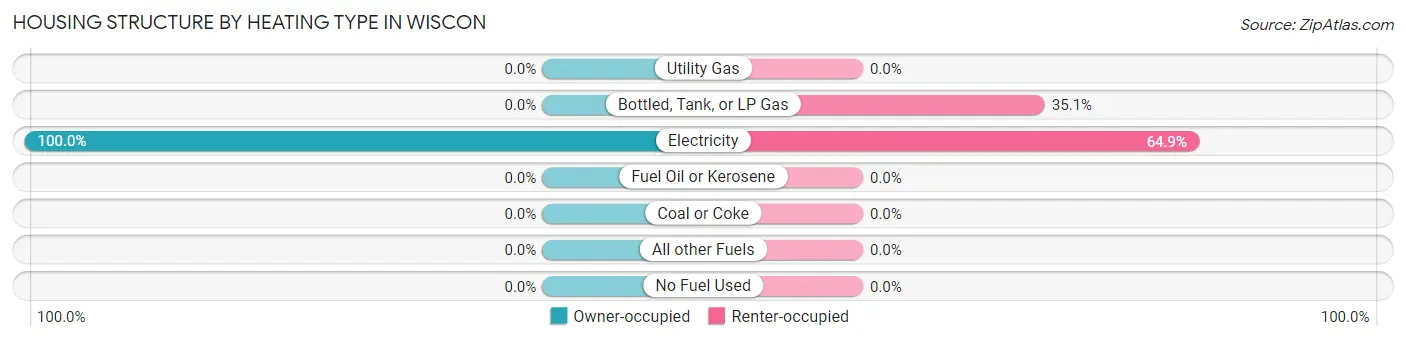
| Heating Type | Owner-occupied | Renter-occupied |
| Utility Gas | 0 (0.0%) | 0 (0.0%) |
| Bottled, Tank, or LP Gas | 0 (0.0%) | 26 (35.1%) |
| Electricity | 170 (100.0%) | 48 (64.9%) |
| Fuel Oil or Kerosene | 0 (0.0%) | 0 (0.0%) |
| Coal or Coke | 0 (0.0%) | 0 (0.0%) |
| All other Fuels | 0 (0.0%) | 0 (0.0%) |
| No Fuel Used | 0 (0.0%) | 0 (0.0%) |
| Total | 170 (100.0%) | 74 (100.0%) |
Household Vehicle Usage in Wiscon
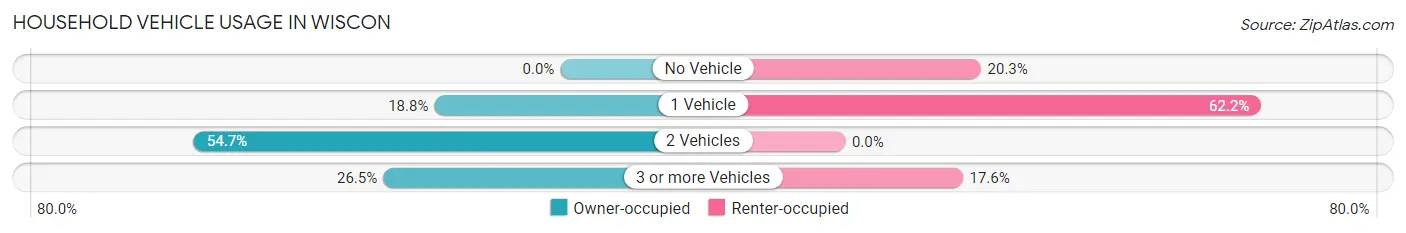
| Vehicles per Household | Owner-occupied | Renter-occupied |
| No Vehicle | 0 (0.0%) | 15 (20.3%) |
| 1 Vehicle | 32 (18.8%) | 46 (62.2%) |
| 2 Vehicles | 93 (54.7%) | 0 (0.0%) |
| 3 or more Vehicles | 45 (26.5%) | 13 (17.6%) |
| Total | 170 (100.0%) | 74 (100.0%) |
Real Estate & Mortgages in Wiscon
Real Estate and Mortgage Overview in Wiscon
| Characteristic | Without Mortgage | With Mortgage |
| Housing Units | 59 | 111 |
| Median Property Value | $116,800 | $123,400 |
| Median Household Income | $51,161 | $0 |
| Monthly Housing Costs | $312 | $0 |
| Real Estate Taxes | $993 | $0 |
Property Value by Mortgage Status in Wiscon
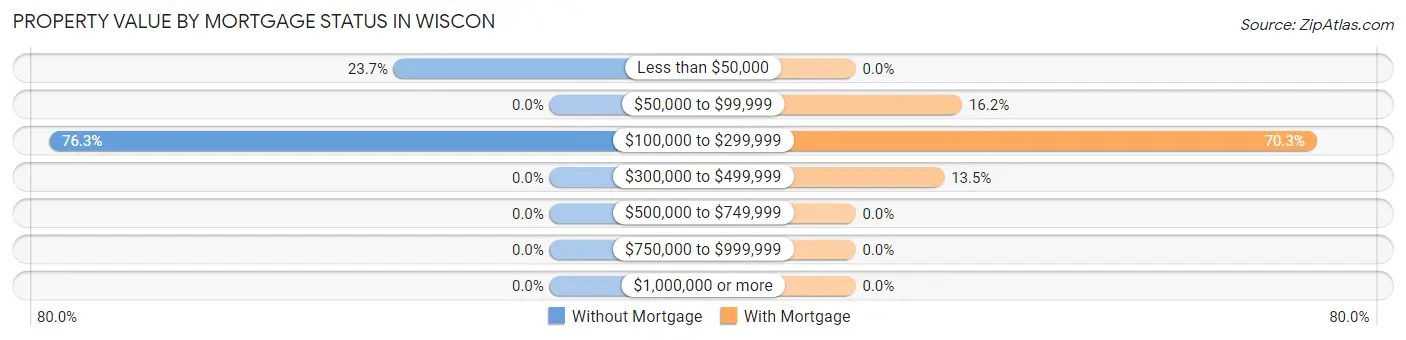
| Property Value | Without Mortgage | With Mortgage |
| Less than $50,000 | 14 (23.7%) | 0 (0.0%) |
| $50,000 to $99,999 | 0 (0.0%) | 18 (16.2%) |
| $100,000 to $299,999 | 45 (76.3%) | 78 (70.3%) |
| $300,000 to $499,999 | 0 (0.0%) | 15 (13.5%) |
| $500,000 to $749,999 | 0 (0.0%) | 0 (0.0%) |
| $750,000 to $999,999 | 0 (0.0%) | 0 (0.0%) |
| $1,000,000 or more | 0 (0.0%) | 0 (0.0%) |
| Total | 59 (100.0%) | 111 (100.0%) |
Household Income by Mortgage Status in Wiscon
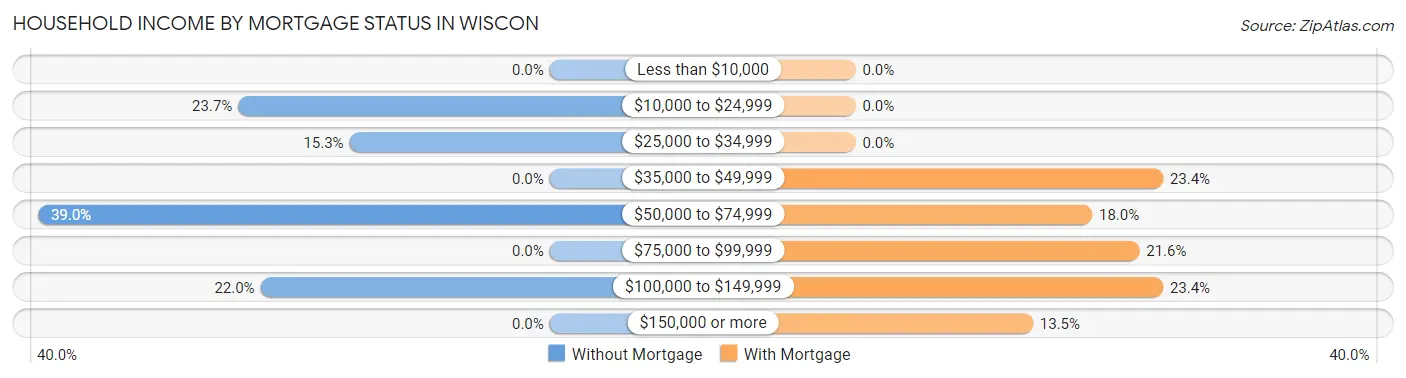
| Household Income | Without Mortgage | With Mortgage |
| Less than $10,000 | 0 (0.0%) | 0 (0.0%) |
| $10,000 to $24,999 | 14 (23.7%) | 0 (0.0%) |
| $25,000 to $34,999 | 9 (15.2%) | 0 (0.0%) |
| $35,000 to $49,999 | 0 (0.0%) | 26 (23.4%) |
| $50,000 to $74,999 | 23 (39.0%) | 20 (18.0%) |
| $75,000 to $99,999 | 0 (0.0%) | 24 (21.6%) |
| $100,000 to $149,999 | 13 (22.0%) | 26 (23.4%) |
| $150,000 or more | 0 (0.0%) | 15 (13.5%) |
| Total | 59 (100.0%) | 111 (100.0%) |
Property Value to Household Income Ratio in Wiscon
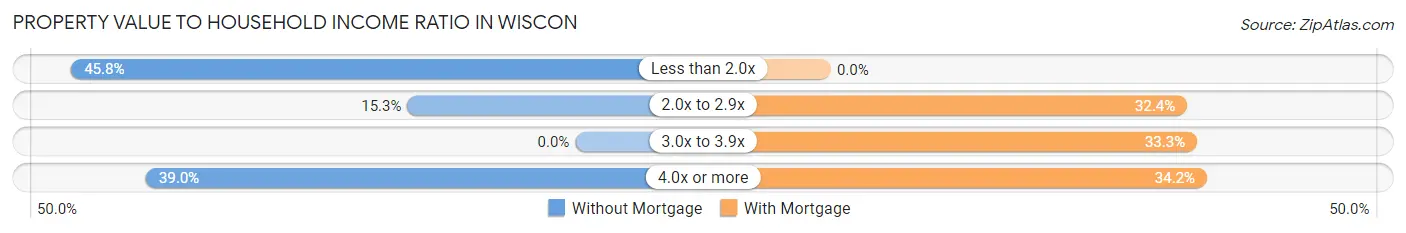
| Value-to-Income Ratio | Without Mortgage | With Mortgage |
| Less than 2.0x | 27 (45.8%) | 0 (0.0%) |
| 2.0x to 2.9x | 9 (15.2%) | 36 (32.4%) |
| 3.0x to 3.9x | 0 (0.0%) | 37 (33.3%) |
| 4.0x or more | 23 (39.0%) | 38 (34.2%) |
| Total | 59 (100.0%) | 111 (100.0%) |
Real Estate Taxes by Mortgage Status in Wiscon
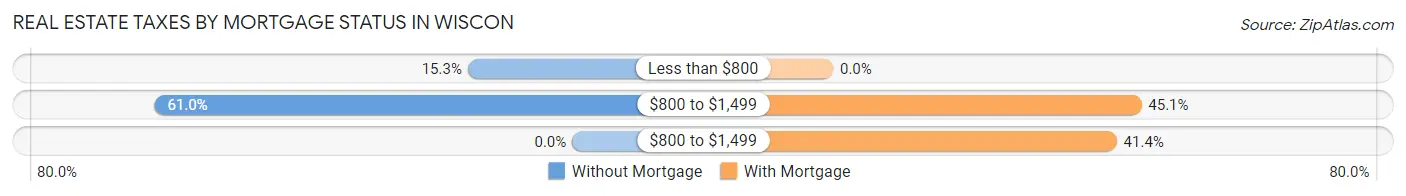
| Property Taxes | Without Mortgage | With Mortgage |
| Less than $800 | 9 (15.2%) | 0 (0.0%) |
| $800 to $1,499 | 36 (61.0%) | 50 (45.1%) |
| $800 to $1,499 | 0 (0.0%) | 46 (41.4%) |
| Total | 59 (100.0%) | 111 (100.0%) |
Health & Disability in Wiscon
Health Insurance Coverage by Age in Wiscon
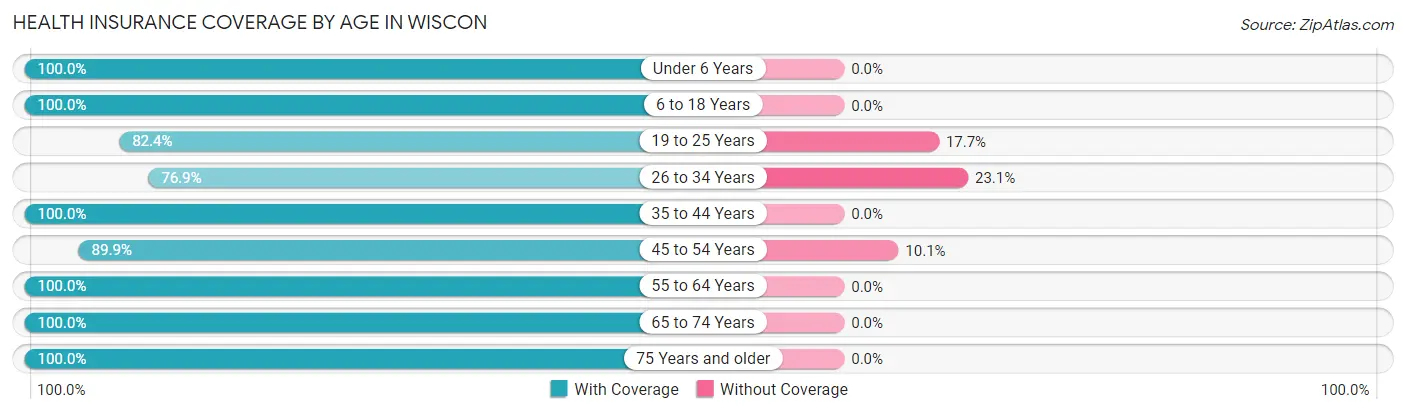
| Age Bracket | With Coverage | Without Coverage |
| Under 6 Years | 13 (100.0%) | 0 (0.0%) |
| 6 to 18 Years | 151 (100.0%) | 0 (0.0%) |
| 19 to 25 Years | 42 (82.4%) | 9 (17.6%) |
| 26 to 34 Years | 50 (76.9%) | 15 (23.1%) |
| 35 to 44 Years | 36 (100.0%) | 0 (0.0%) |
| 45 to 54 Years | 98 (89.9%) | 11 (10.1%) |
| 55 to 64 Years | 126 (100.0%) | 0 (0.0%) |
| 65 to 74 Years | 49 (100.0%) | 0 (0.0%) |
| 75 Years and older | 28 (100.0%) | 0 (0.0%) |
| Total | 593 (94.4%) | 35 (5.6%) |
Health Insurance Coverage by Citizenship Status in Wiscon
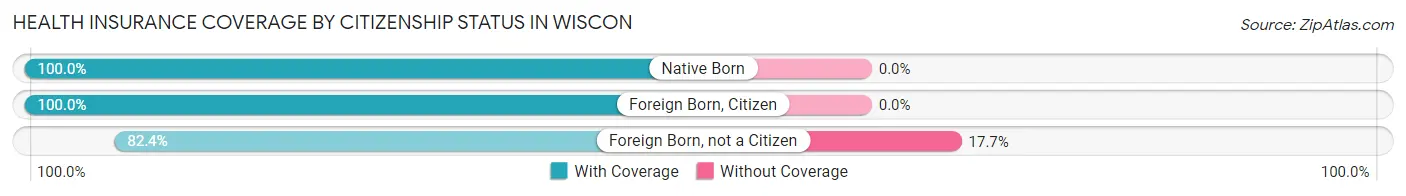
| Citizenship Status | With Coverage | Without Coverage |
| Native Born | 13 (100.0%) | 0 (0.0%) |
| Foreign Born, Citizen | 151 (100.0%) | 0 (0.0%) |
| Foreign Born, not a Citizen | 42 (82.4%) | 9 (17.6%) |
Health Insurance Coverage by Household Income in Wiscon
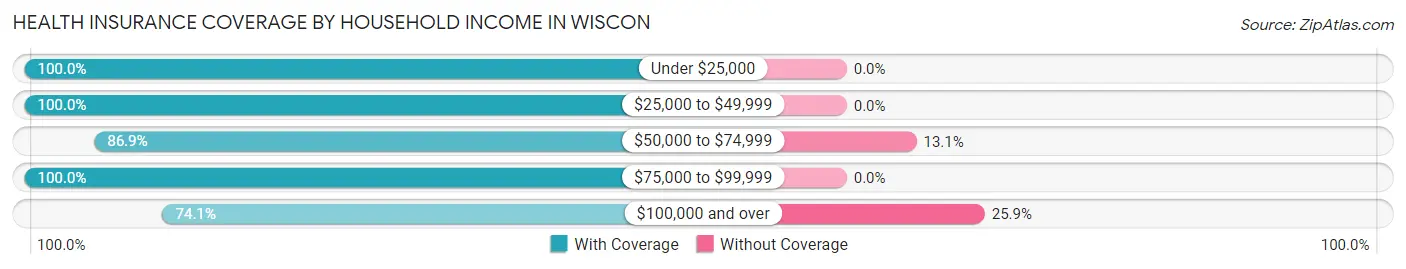
| Household Income | With Coverage | Without Coverage |
| Under $25,000 | 106 (100.0%) | 0 (0.0%) |
| $25,000 to $49,999 | 232 (100.0%) | 0 (0.0%) |
| $50,000 to $74,999 | 133 (86.9%) | 20 (13.1%) |
| $75,000 to $99,999 | 79 (100.0%) | 0 (0.0%) |
| $100,000 and over | 43 (74.1%) | 15 (25.9%) |
Public vs Private Health Insurance Coverage by Age in Wiscon
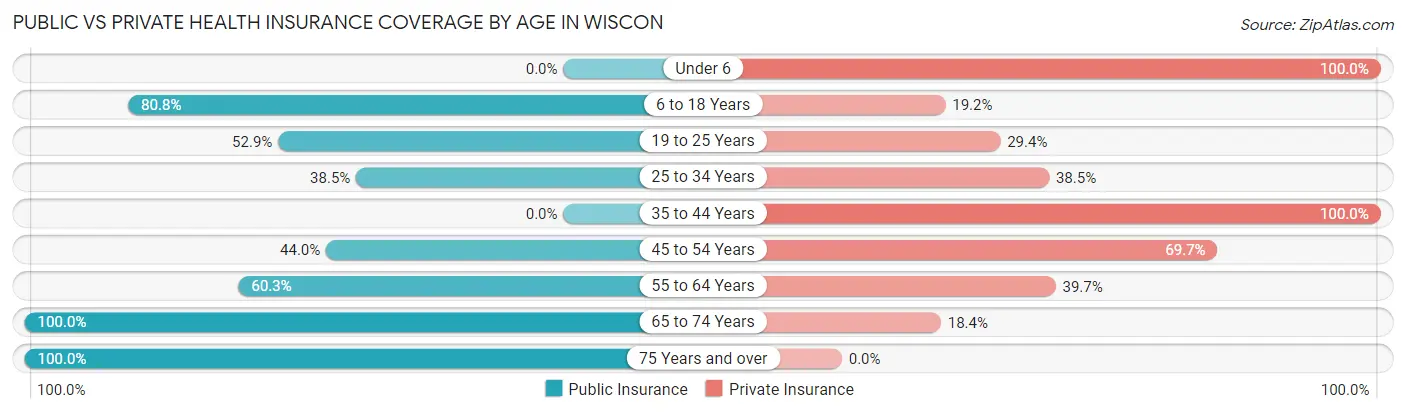
| Age Bracket | Public Insurance | Private Insurance |
| Under 6 | 0 (0.0%) | 13 (100.0%) |
| 6 to 18 Years | 122 (80.8%) | 29 (19.2%) |
| 19 to 25 Years | 27 (52.9%) | 15 (29.4%) |
| 25 to 34 Years | 25 (38.5%) | 25 (38.5%) |
| 35 to 44 Years | 0 (0.0%) | 36 (100.0%) |
| 45 to 54 Years | 48 (44.0%) | 76 (69.7%) |
| 55 to 64 Years | 76 (60.3%) | 50 (39.7%) |
| 65 to 74 Years | 49 (100.0%) | 9 (18.4%) |
| 75 Years and over | 28 (100.0%) | 0 (0.0%) |
| Total | 375 (59.7%) | 253 (40.3%) |
Disability Status by Sex by Age in Wiscon
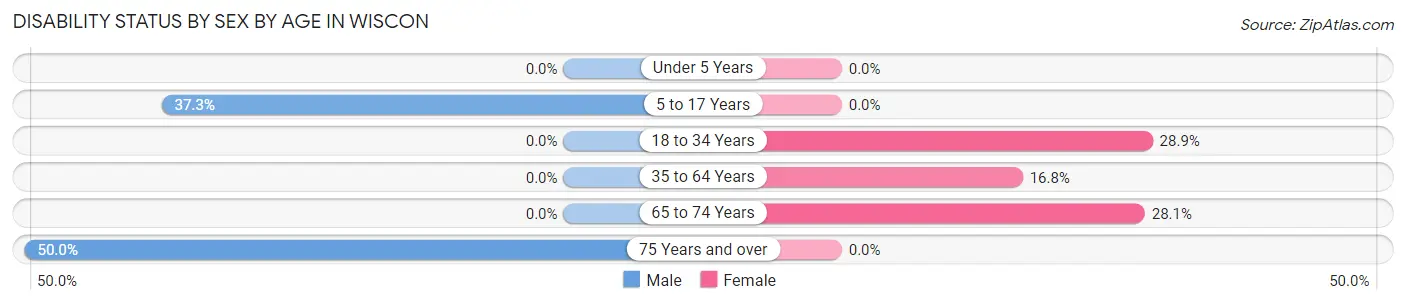
| Age Bracket | Male | Female |
| Under 5 Years | 0 (0.0%) | 0 (0.0%) |
| 5 to 17 Years | 22 (37.3%) | 0 (0.0%) |
| 18 to 34 Years | 0 (0.0%) | 15 (28.8%) |
| 35 to 64 Years | 0 (0.0%) | 23 (16.8%) |
| 65 to 74 Years | 0 (0.0%) | 9 (28.1%) |
| 75 Years and over | 14 (50.0%) | 0 (0.0%) |
Disability Class by Sex by Age in Wiscon
Disability Class: Hearing Difficulty
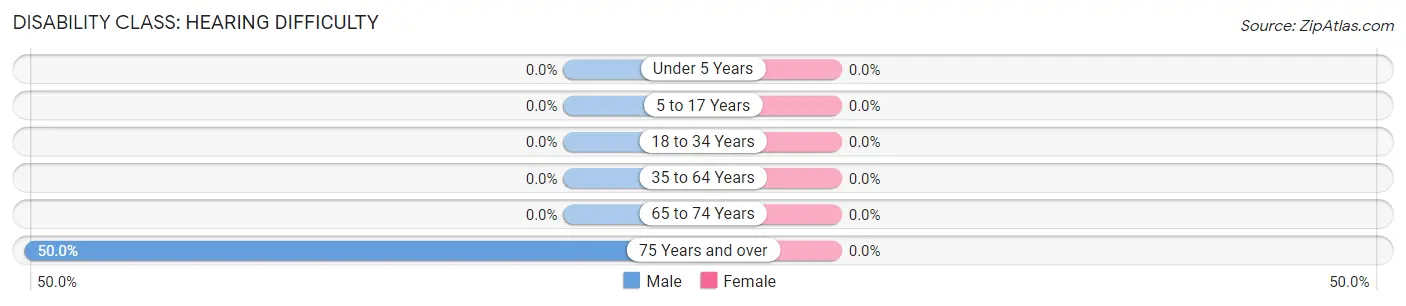
| Age Bracket | Male | Female |
| Under 5 Years | 0 (0.0%) | 0 (0.0%) |
| 5 to 17 Years | 0 (0.0%) | 0 (0.0%) |
| 18 to 34 Years | 0 (0.0%) | 0 (0.0%) |
| 35 to 64 Years | 0 (0.0%) | 0 (0.0%) |
| 65 to 74 Years | 0 (0.0%) | 0 (0.0%) |
| 75 Years and over | 14 (50.0%) | 0 (0.0%) |
Disability Class: Vision Difficulty
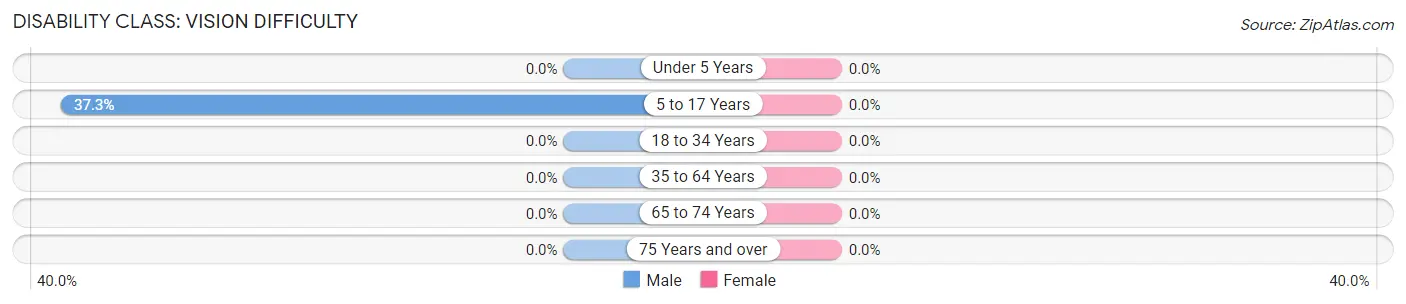
| Age Bracket | Male | Female |
| Under 5 Years | 0 (0.0%) | 0 (0.0%) |
| 5 to 17 Years | 22 (37.3%) | 0 (0.0%) |
| 18 to 34 Years | 0 (0.0%) | 0 (0.0%) |
| 35 to 64 Years | 0 (0.0%) | 0 (0.0%) |
| 65 to 74 Years | 0 (0.0%) | 0 (0.0%) |
| 75 Years and over | 0 (0.0%) | 0 (0.0%) |
Disability Class: Cognitive Difficulty
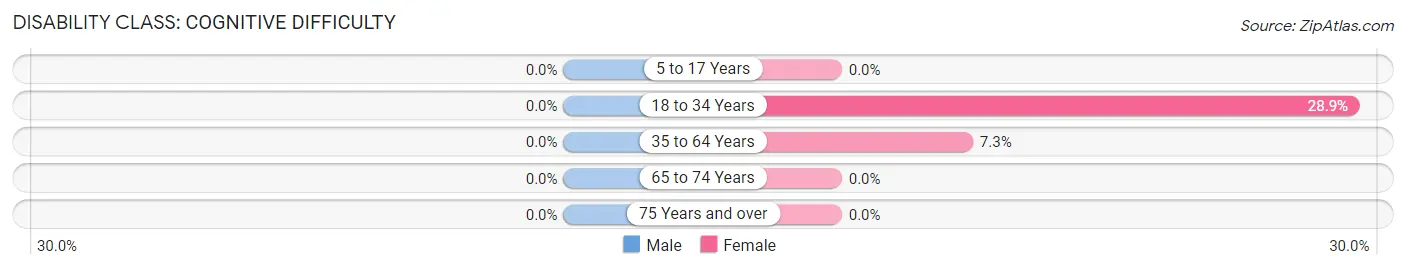
| Age Bracket | Male | Female |
| 5 to 17 Years | 0 (0.0%) | 0 (0.0%) |
| 18 to 34 Years | 0 (0.0%) | 15 (28.8%) |
| 35 to 64 Years | 0 (0.0%) | 10 (7.3%) |
| 65 to 74 Years | 0 (0.0%) | 0 (0.0%) |
| 75 Years and over | 0 (0.0%) | 0 (0.0%) |
Disability Class: Ambulatory Difficulty
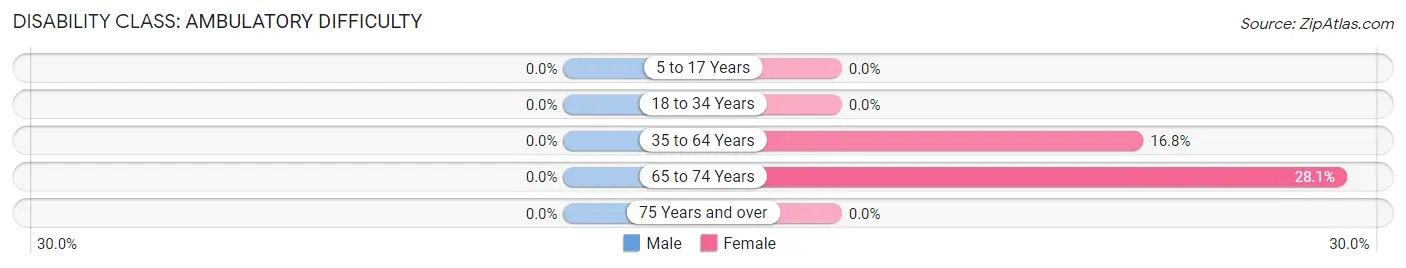
| Age Bracket | Male | Female |
| 5 to 17 Years | 0 (0.0%) | 0 (0.0%) |
| 18 to 34 Years | 0 (0.0%) | 0 (0.0%) |
| 35 to 64 Years | 0 (0.0%) | 23 (16.8%) |
| 65 to 74 Years | 0 (0.0%) | 9 (28.1%) |
| 75 Years and over | 0 (0.0%) | 0 (0.0%) |
Disability Class: Self-Care Difficulty
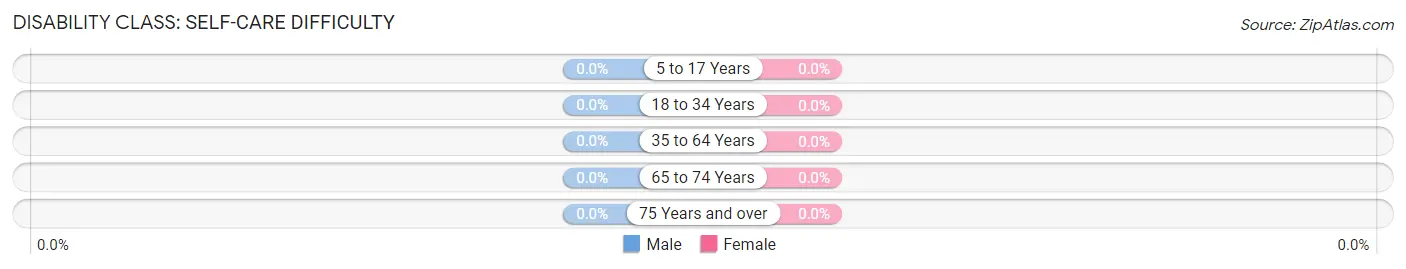
| Age Bracket | Male | Female |
| 5 to 17 Years | 0 (0.0%) | 0 (0.0%) |
| 18 to 34 Years | 0 (0.0%) | 0 (0.0%) |
| 35 to 64 Years | 0 (0.0%) | 0 (0.0%) |
| 65 to 74 Years | 0 (0.0%) | 0 (0.0%) |
| 75 Years and over | 0 (0.0%) | 0 (0.0%) |
Technology Access in Wiscon
Computing Device Access in Wiscon
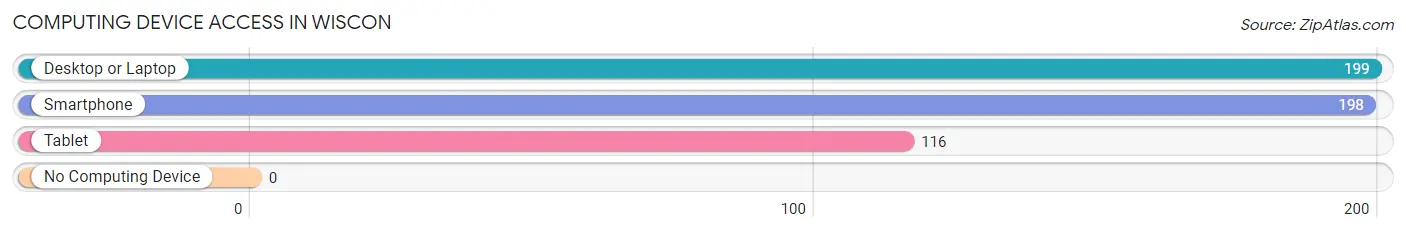
| Device Type | # Households | % Households |
| Desktop or Laptop | 199 | 81.6% |
| Smartphone | 198 | 81.1% |
| Tablet | 116 | 47.5% |
| No Computing Device | 0 | 0.0% |
| Total | 244 | 100.0% |
Internet Access in Wiscon
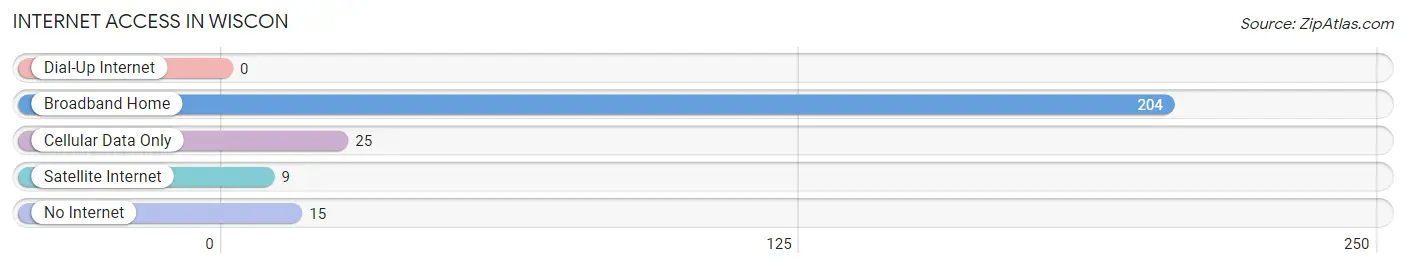
| Internet Type | # Households | % Households |
| Dial-Up Internet | 0 | 0.0% |
| Broadband Home | 204 | 83.6% |
| Cellular Data Only | 25 | 10.2% |
| Satellite Internet | 9 | 3.7% |
| No Internet | 15 | 6.1% |
| Total | 244 | 100.0% |
Wiscon Summary
Wiscon is a small town located in the state of Florida, in the United States. It is situated in the northern part of the state, in the panhandle region, and is part of the larger Pensacola metropolitan area. The town has a population of just over 1,000 people, and is known for its rural charm and small-town atmosphere.
History
Wiscon was founded in 1883 by a group of settlers from the nearby town of Milton. The town was named after the nearby Wiscon Creek, which was named after a Native American chief who lived in the area. The town was originally a farming community, and the main crops grown were cotton, corn, and peanuts. In the early 1900s, the town began to grow and develop, and by the 1920s, it had become a popular tourist destination.
Geography
Wiscon is located in the northern part of Florida, in the panhandle region. It is situated in Santa Rosa County, and is part of the larger Pensacola metropolitan area. The town is located on the banks of the Blackwater River, and is surrounded by rolling hills and lush forests. The climate in Wiscon is humid subtropical, with hot summers and mild winters.
Economy
The economy of Wiscon is largely based on agriculture and tourism. The town is home to several farms, which produce a variety of crops, including cotton, corn, and peanuts. The town is also a popular tourist destination, and is home to several attractions, including the Blackwater River State Park and the Wiscon Wildlife Refuge. In addition, the town is home to several small businesses, including restaurants, shops, and other services.
Demographics
As of the 2010 census, the population of Wiscon was 1,072. The racial makeup of the town was 94.3% White, 2.2% African American, 0.7% Native American, 0.3% Asian, 0.1% Pacific Islander, and 2.4% from other races. The median household income in Wiscon was $37,917, and the median family income was $45,938. The town has a poverty rate of 16.3%, and the unemployment rate is 5.2%.
Wiscon is a small town with a rich history and a unique culture. It is a popular tourist destination, and is home to several attractions and businesses. The town is also home to a diverse population, and has a strong economy based on agriculture and tourism.
Common Questions
What is Per Capita Income in Wiscon?
Per Capita income in Wiscon is $22,092.
What is the Median Family Income in Wiscon?
Median Family Income in Wiscon is $33,427.
What is the Median Household income in Wiscon?
Median Household Income in Wiscon is $40,833.
What is Income or Wage Gap in Wiscon?
Income or Wage Gap in Wiscon is 67.4%.
Women in Wiscon earn 32.6 cents for every dollar earned by a man.
What is Inequality or Gini Index in Wiscon?
Inequality or Gini Index in Wiscon is 0.35.
What is the Total Population of Wiscon?
Total Population of Wiscon is 628.
What is the Total Male Population of Wiscon?
Total Male Population of Wiscon is 329.
What is the Total Female Population of Wiscon?
Total Female Population of Wiscon is 299.
What is the Ratio of Males per 100 Females in Wiscon?
There are 110.03 Males per 100 Females in Wiscon.
What is the Ratio of Females per 100 Males in Wiscon?
There are 90.88 Females per 100 Males in Wiscon.
What is the Median Population Age in Wiscon?
Median Population Age in Wiscon is 42.8 Years.
What is the Average Family Size in Wiscon
Average Family Size in Wiscon is 3.3 People.
What is the Average Household Size in Wiscon
Average Household Size in Wiscon is 2.6 People.
How Large is the Labor Force in Wiscon?
There are 260 People in the Labor Forcein in Wiscon.
What is the Percentage of People in the Labor Force in Wiscon?
52.6% of People are in the Labor Force in Wiscon.
What is the Unemployment Rate in Wiscon?
Unemployment Rate in Wiscon is 13.1%.