Palm Beach, FL Map & Demographics
Palm Beach Map
Palm Beach Overview
$215,141
PER CAPITA INCOME
$222,727
AVG FAMILY INCOME
$190,824
AVG HOUSEHOLD INCOME
44.3%
WAGE / INCOME GAP [ % ]
55.7¢/ $1
WAGE / INCOME GAP [ $ ]
0.57
INEQUALITY / GINI INDEX
9,205
TOTAL POPULATION
4,239
MALE POPULATION
4,966
FEMALE POPULATION
85.36
MALES / 100 FEMALES
117.15
FEMALES / 100 MALES
70.7
MEDIAN AGE
2.2
AVG FAMILY SIZE
1.7
AVG HOUSEHOLD SIZE
2,728
LABOR FORCE [ PEOPLE ]
31.3%
PERCENT IN LABOR FORCE
5.6%
UNEMPLOYMENT RATE
Palm Beach Zip Codes
Palm Beach Area Codes
Income in Palm Beach
Income Overview in Palm Beach
Per Capita Income in Palm Beach is $215,141, while median incomes of families and households are $222,727 and $190,824 respectively.
| Characteristic | Number | Measure |
| Per Capita Income | 9,205 | $215,141 |
| Median Family Income | 2,832 | $222,727 |
| Mean Family Income | 2,832 | $414,800 |
| Median Household Income | 5,370 | $190,824 |
| Mean Household Income | 5,370 | $365,991 |
| Income Deficit | 2,832 | $0 |
| Wage / Income Gap (%) | 9,205 | 44.34% |
| Wage / Income Gap ($) | 9,205 | 55.66¢ per $1 |
| Gini / Inequality Index | 9,205 | 0.57 |
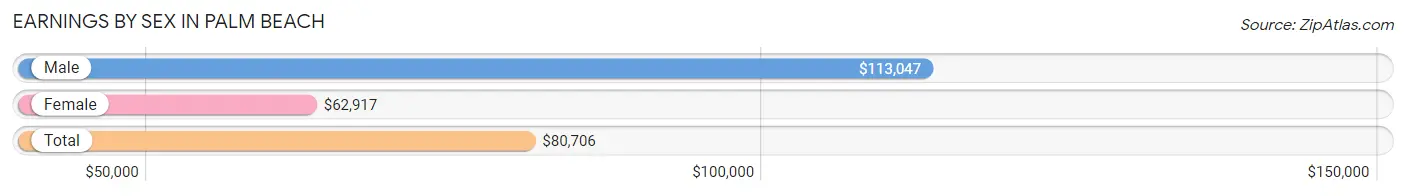
Earnings by Sex in Palm Beach
Average Earnings in Palm Beach are $80,706, $113,047 for men and $62,917 for women, a difference of 44.3%.
| Sex | Number | Average Earnings |
| Male | 2,022 (66.7%) | $113,047 |
| Female | 1,011 (33.3%) | $62,917 |
| Total | 3,033 (100.0%) | $80,706 |
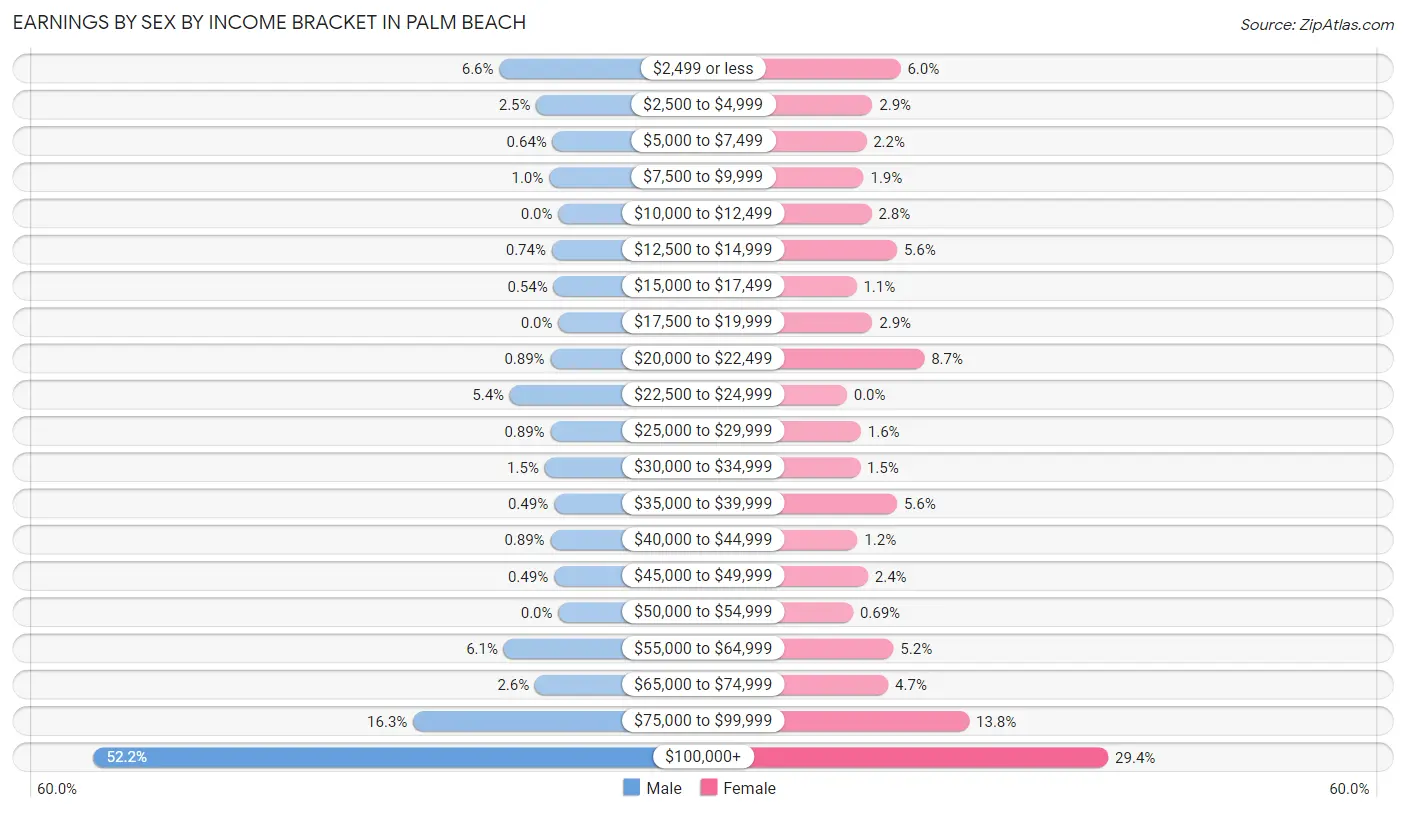
Earnings by Sex by Income Bracket in Palm Beach
The most common earnings brackets in Palm Beach are $100,000+ for men (1,056 | 52.2%) and $100,000+ for women (297 | 29.4%).
| Income | Male | Female |
| $2,499 or less | 134 (6.6%) | 61 (6.0%) |
| $2,500 to $4,999 | 50 (2.5%) | 29 (2.9%) |
| $5,000 to $7,499 | 13 (0.6%) | 22 (2.2%) |
| $7,500 to $9,999 | 21 (1.0%) | 19 (1.9%) |
| $10,000 to $12,499 | 0 (0.0%) | 28 (2.8%) |
| $12,500 to $14,999 | 15 (0.7%) | 57 (5.6%) |
| $15,000 to $17,499 | 11 (0.5%) | 11 (1.1%) |
| $17,500 to $19,999 | 0 (0.0%) | 29 (2.9%) |
| $20,000 to $22,499 | 18 (0.9%) | 88 (8.7%) |
| $22,500 to $24,999 | 110 (5.4%) | 0 (0.0%) |
| $25,000 to $29,999 | 18 (0.9%) | 16 (1.6%) |
| $30,000 to $34,999 | 31 (1.5%) | 15 (1.5%) |
| $35,000 to $39,999 | 10 (0.5%) | 57 (5.6%) |
| $40,000 to $44,999 | 18 (0.9%) | 12 (1.2%) |
| $45,000 to $49,999 | 10 (0.5%) | 24 (2.4%) |
| $50,000 to $54,999 | 0 (0.0%) | 7 (0.7%) |
| $55,000 to $64,999 | 124 (6.1%) | 53 (5.2%) |
| $65,000 to $74,999 | 53 (2.6%) | 47 (4.6%) |
| $75,000 to $99,999 | 330 (16.3%) | 139 (13.8%) |
| $100,000+ | 1,056 (52.2%) | 297 (29.4%) |
| Total | 2,022 (100.0%) | 1,011 (100.0%) |
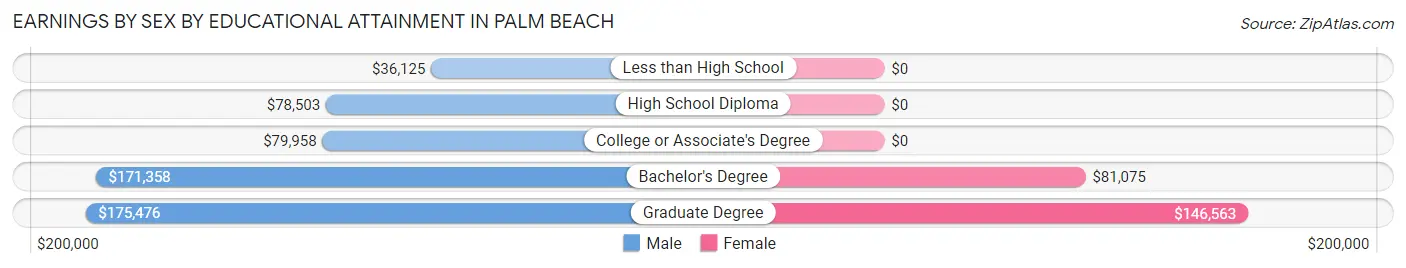
Earnings by Sex by Educational Attainment in Palm Beach
Average earnings in Palm Beach are $115,117 for men and $68,125 for women, a difference of 40.8%. Men with an educational attainment of graduate degree enjoy the highest average annual earnings of $175,476, while those with less than high school education earn the least with $36,125. Women with an educational attainment of graduate degree earn the most with the average annual earnings of $146,563, while those with bachelor's degree education have the smallest earnings of $81,075.
| Educational Attainment | Male Income | Female Income |
| Less than High School | $36,125 | $0 |
| High School Diploma | $78,503 | $0 |
| College or Associate's Degree | $79,958 | $0 |
| Bachelor's Degree | $171,358 | $81,075 |
| Graduate Degree | $175,476 | $146,563 |
| Total | $115,117 | $68,125 |
Family Income in Palm Beach
Family Income Brackets in Palm Beach
According to the Palm Beach family income data, there are 1,444 families falling into the $200,000+ income range, which is the most common income bracket and makes up 51.0% of all families.
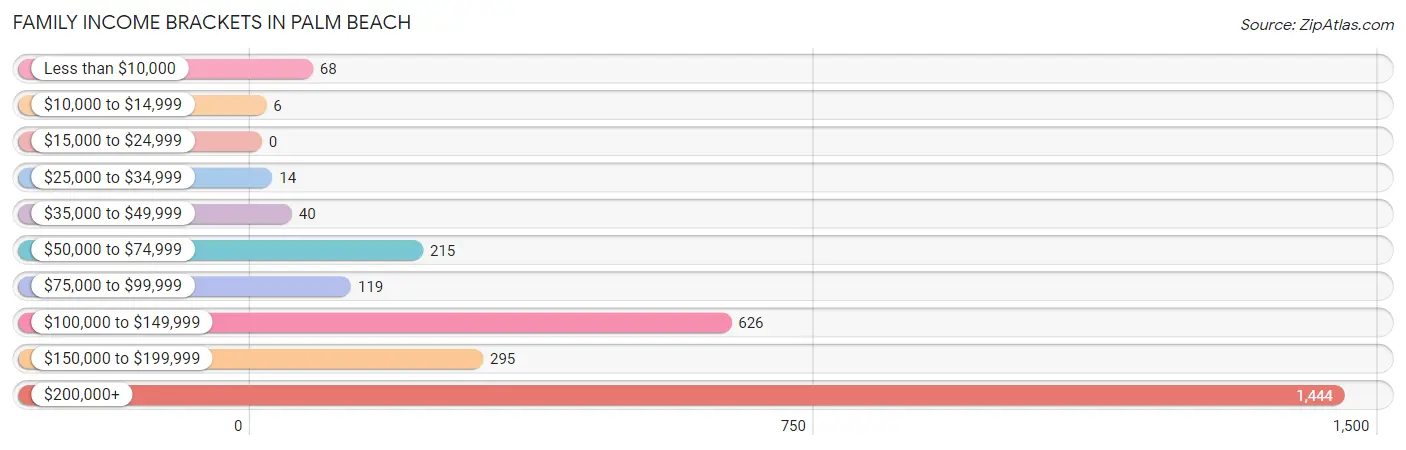
| Income Bracket | # Families | % Families |
| Less than $10,000 | 68 | 2.4% |
| $10,000 to $14,999 | 6 | 0.2% |
| $15,000 to $24,999 | 0 | 0.0% |
| $25,000 to $34,999 | 14 | 0.5% |
| $35,000 to $49,999 | 40 | 1.4% |
| $50,000 to $74,999 | 215 | 7.6% |
| $75,000 to $99,999 | 119 | 4.2% |
| $100,000 to $149,999 | 626 | 22.1% |
| $150,000 to $199,999 | 295 | 10.4% |
| $200,000+ | 1,444 | 51.0% |
Family Income by Famaliy Size in Palm Beach
3-person families (184 | 6.5%) account for the highest median family income in Palm Beach with $250,001 per family, while 2-person families (2,508 | 88.6%) have the highest median income of $96,088 per family member.
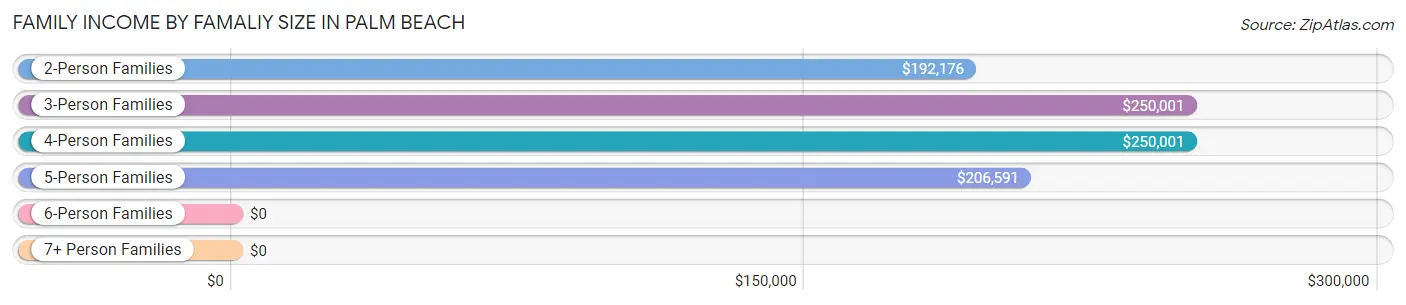
| Income Bracket | # Families | Median Income |
| 2-Person Families | 2,508 (88.6%) | $192,176 |
| 3-Person Families | 184 (6.5%) | $250,001 |
| 4-Person Families | 72 (2.5%) | $250,001 |
| 5-Person Families | 32 (1.1%) | $206,591 |
| 6-Person Families | 36 (1.3%) | $0 |
| 7+ Person Families | 0 (0.0%) | $0 |
| Total | 2,832 (100.0%) | $222,727 |
Family Income by Number of Earners in Palm Beach
The median family income in Palm Beach is $222,727, with families comprising 1 earner (1,142) having the highest median family income of $250,001, while families with no earners (1,261) have the lowest median family income of $160,602, accounting for 40.3% and 44.5% of families, respectively.
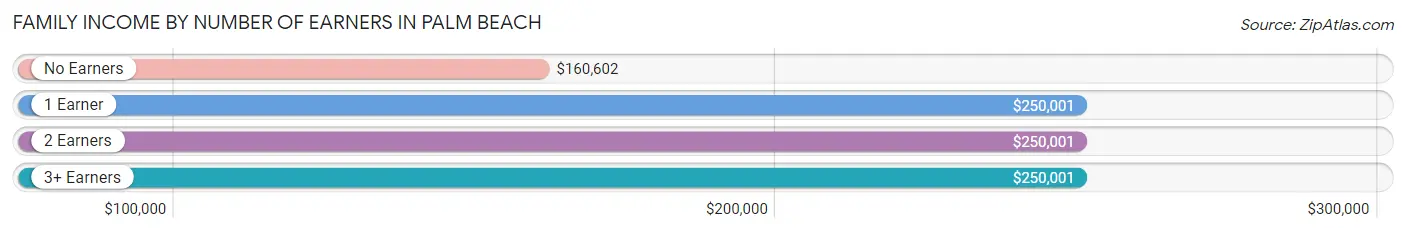
| Number of Earners | # Families | Median Income |
| No Earners | 1,261 (44.5%) | $160,602 |
| 1 Earner | 1,142 (40.3%) | $250,001 |
| 2 Earners | 373 (13.2%) | $250,001 |
| 3+ Earners | 56 (2.0%) | $250,001 |
| Total | 2,832 (100.0%) | $222,727 |
Household Income in Palm Beach
Household Income Brackets in Palm Beach
With 2,594 households falling in the category, the $200,000+ income range is the most frequent in Palm Beach, accounting for 48.3% of all households. In contrast, only 113 households (2.1%) fall into the $15,000 to $24,999 income bracket, making it the least populous group.
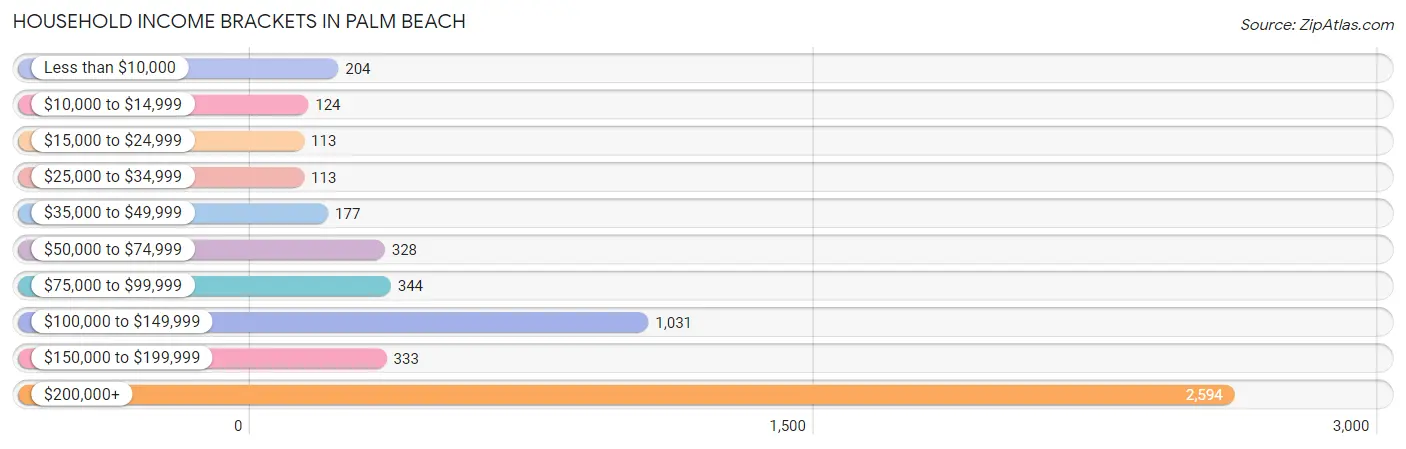
| Income Bracket | # Households | % Households |
| Less than $10,000 | 204 | 3.8% |
| $10,000 to $14,999 | 124 | 2.3% |
| $15,000 to $24,999 | 113 | 2.1% |
| $25,000 to $34,999 | 113 | 2.1% |
| $35,000 to $49,999 | 177 | 3.3% |
| $50,000 to $74,999 | 328 | 6.1% |
| $75,000 to $99,999 | 344 | 6.4% |
| $100,000 to $149,999 | 1,031 | 19.2% |
| $150,000 to $199,999 | 333 | 6.2% |
| $200,000+ | 2,594 | 48.3% |
Household Income by Householder Age in Palm Beach
The median household income in Palm Beach is $190,824, with the highest median household income of $250,001 found in the 45 to 64 years age bracket for the primary householder. A total of 1,082 households (20.2%) fall into this category. Meanwhile, the 15 to 24 years age bracket for the primary householder has the lowest median household income of $0, with 16 households (0.3%) in this group.
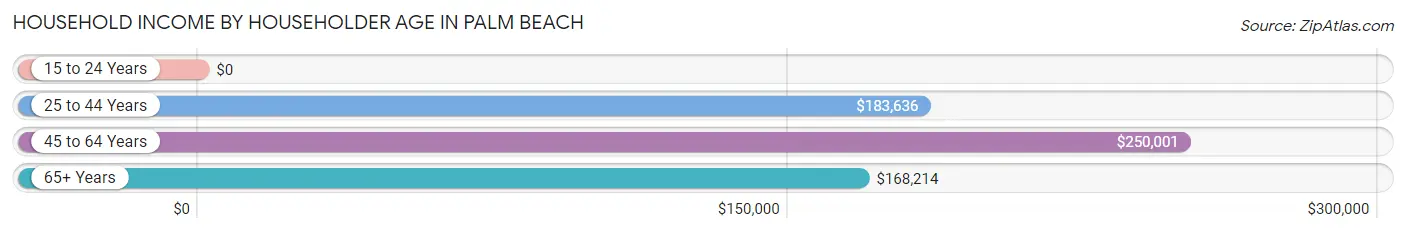
| Income Bracket | # Households | Median Income |
| 15 to 24 Years | 16 (0.3%) | $0 |
| 25 to 44 Years | 264 (4.9%) | $183,636 |
| 45 to 64 Years | 1,082 (20.2%) | $250,001 |
| 65+ Years | 4,008 (74.6%) | $168,214 |
| Total | 5,370 (100.0%) | $190,824 |
Poverty in Palm Beach
Income Below Poverty by Sex and Age in Palm Beach
With 4.0% poverty level for males and 6.1% for females among the residents of Palm Beach, 35 to 44 year old males and 18 to 24 year old females are the most vulnerable to poverty, with 48 males (34.8%) and 16 females (29.6%) in their respective age groups living below the poverty level.
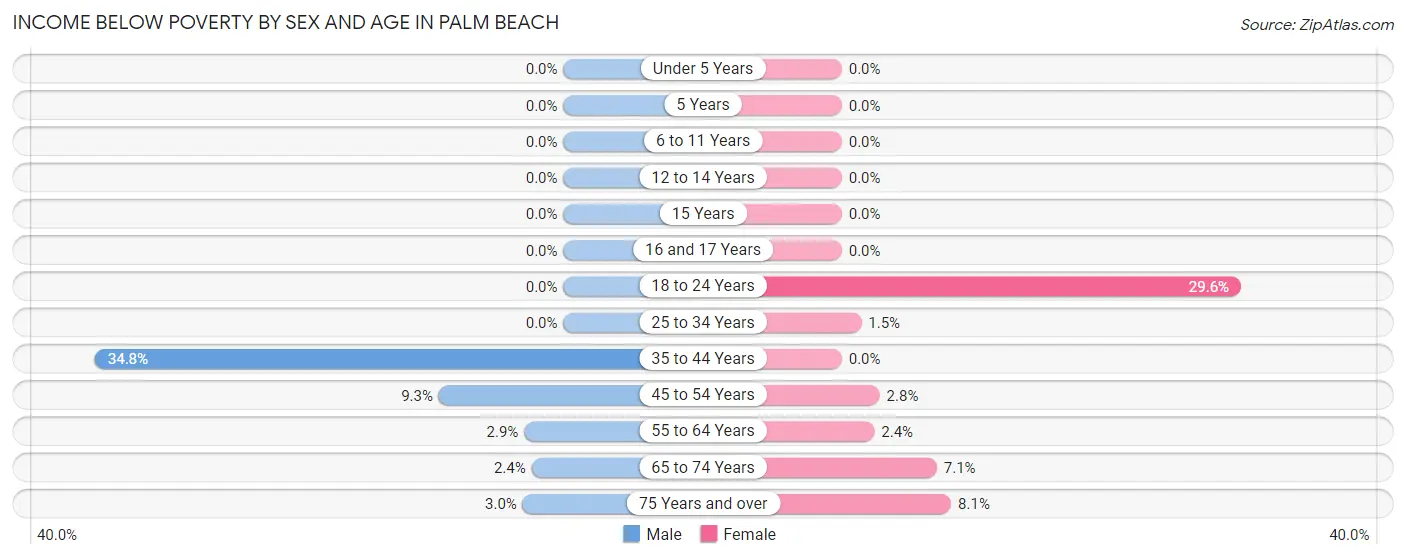
| Age Bracket | Male | Female |
| Under 5 Years | 0 (0.0%) | 0 (0.0%) |
| 5 Years | 0 (0.0%) | 0 (0.0%) |
| 6 to 11 Years | 0 (0.0%) | 0 (0.0%) |
| 12 to 14 Years | 0 (0.0%) | 0 (0.0%) |
| 15 Years | 0 (0.0%) | 0 (0.0%) |
| 16 and 17 Years | 0 (0.0%) | 0 (0.0%) |
| 18 to 24 Years | 0 (0.0%) | 16 (29.6%) |
| 25 to 34 Years | 0 (0.0%) | 1 (1.5%) |
| 35 to 44 Years | 48 (34.8%) | 0 (0.0%) |
| 45 to 54 Years | 27 (9.2%) | 8 (2.8%) |
| 55 to 64 Years | 22 (2.9%) | 21 (2.4%) |
| 65 to 74 Years | 20 (2.4%) | 90 (7.1%) |
| 75 Years and over | 52 (3.0%) | 165 (8.1%) |
| Total | 169 (4.0%) | 301 (6.1%) |
Income Above Poverty by Sex and Age in Palm Beach
According to the poverty statistics in Palm Beach, males aged under 5 years and females aged under 5 years are the age groups that are most secure financially, with 100.0% of males and 100.0% of females in these age groups living above the poverty line.
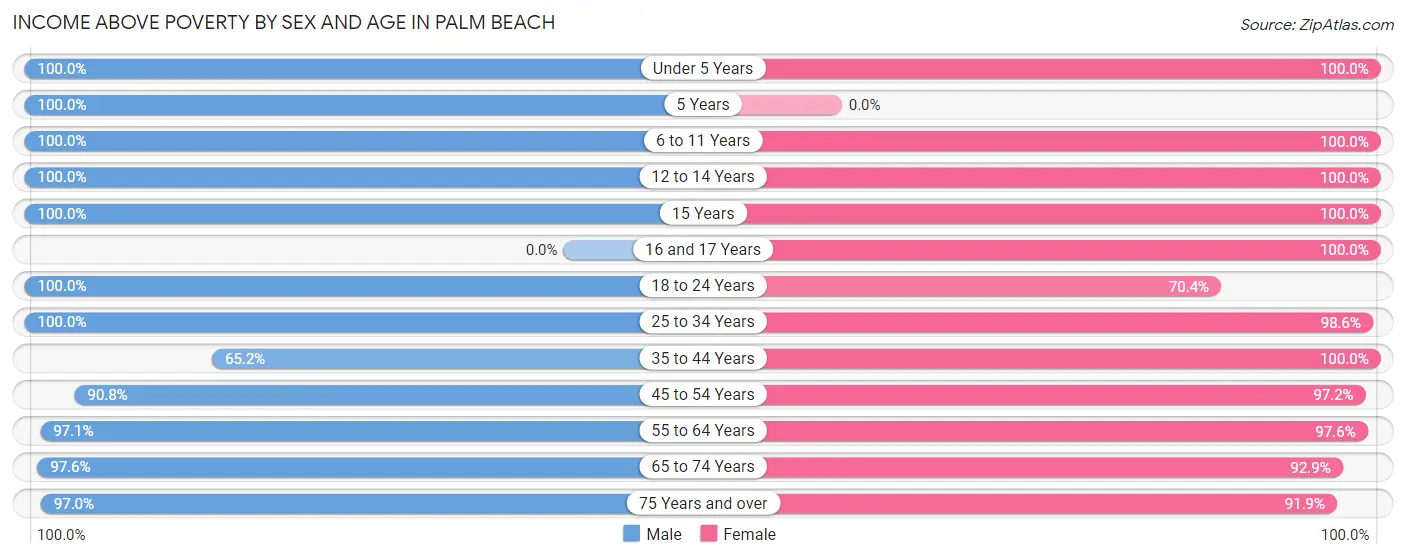
| Age Bracket | Male | Female |
| Under 5 Years | 62 (100.0%) | 74 (100.0%) |
| 5 Years | 7 (100.0%) | 0 (0.0%) |
| 6 to 11 Years | 125 (100.0%) | 46 (100.0%) |
| 12 to 14 Years | 51 (100.0%) | 43 (100.0%) |
| 15 Years | 62 (100.0%) | 20 (100.0%) |
| 16 and 17 Years | 0 (0.0%) | 23 (100.0%) |
| 18 to 24 Years | 74 (100.0%) | 38 (70.4%) |
| 25 to 34 Years | 102 (100.0%) | 68 (98.6%) |
| 35 to 44 Years | 90 (65.2%) | 176 (100.0%) |
| 45 to 54 Years | 265 (90.7%) | 277 (97.2%) |
| 55 to 64 Years | 733 (97.1%) | 847 (97.6%) |
| 65 to 74 Years | 827 (97.6%) | 1,185 (92.9%) |
| 75 Years and over | 1,672 (97.0%) | 1,868 (91.9%) |
| Total | 4,070 (96.0%) | 4,665 (93.9%) |
Income Below Poverty Among Married-Couple Families in Palm Beach
The poverty statistics for married-couple families in Palm Beach show that 2.6% or 69 of the total 2,658 families live below the poverty line. Families with no children have the highest poverty rate of 2.8%, comprising of 69 families. On the other hand, families with 1 or 2 children have the lowest poverty rate of 0.0%, which includes 0 families.
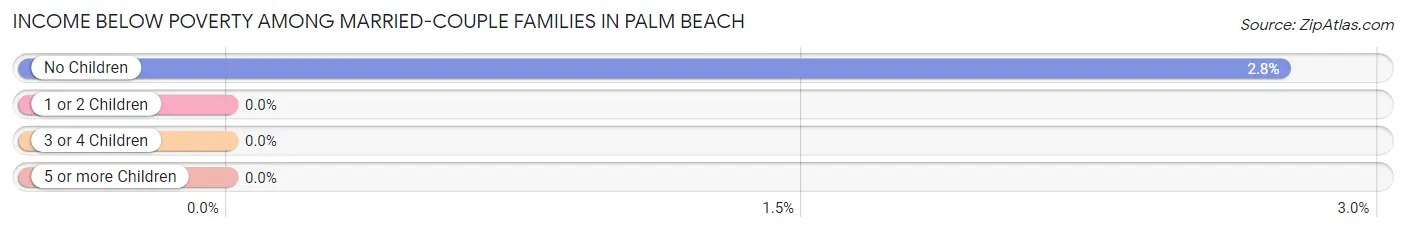
| Children | Above Poverty | Below Poverty |
| No Children | 2,441 (97.3%) | 69 (2.8%) |
| 1 or 2 Children | 80 (100.0%) | 0 (0.0%) |
| 3 or 4 Children | 68 (100.0%) | 0 (0.0%) |
| 5 or more Children | 0 (0.0%) | 0 (0.0%) |
| Total | 2,589 (97.4%) | 69 (2.6%) |
Income Below Poverty Among Single-Parent Households in Palm Beach
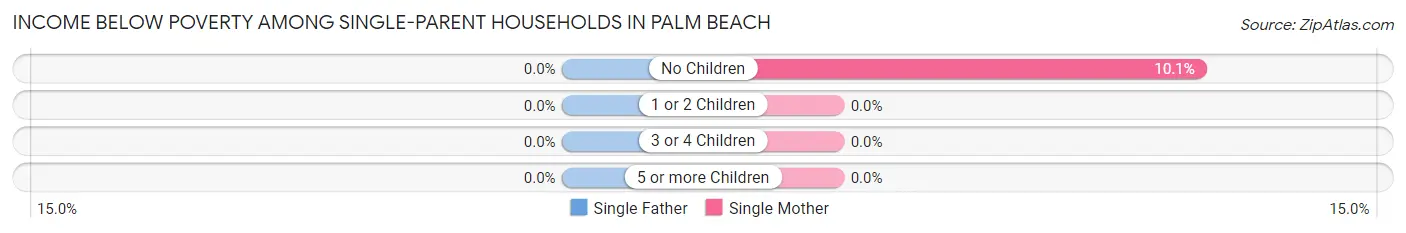
| Children | Single Father | Single Mother |
| No Children | 0 (0.0%) | 7 (10.1%) |
| 1 or 2 Children | 0 (0.0%) | 0 (0.0%) |
| 3 or 4 Children | 0 (0.0%) | 0 (0.0%) |
| 5 or more Children | 0 (0.0%) | 0 (0.0%) |
| Total | 0 (0.0%) | 7 (5.2%) |
Income Below Poverty Among Married-Couple vs Single-Parent Households in Palm Beach
The poverty data for Palm Beach shows that 69 of the married-couple family households (2.6%) and 7 of the single-parent households (4.0%) are living below the poverty level. Within the married-couple family households, those with no children have the highest poverty rate, with 69 households (2.8%) falling below the poverty line. Among the single-parent households, those with no children have the highest poverty rate, with 7 household (10.1%) living below poverty.
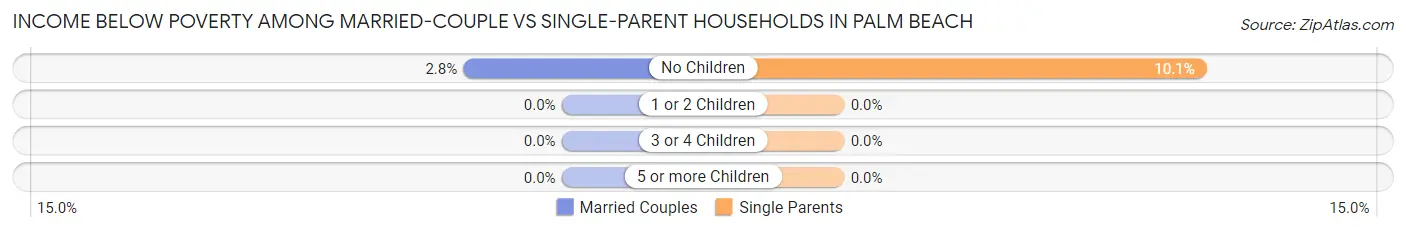
| Children | Married-Couple Families | Single-Parent Households |
| No Children | 69 (2.8%) | 7 (10.1%) |
| 1 or 2 Children | 0 (0.0%) | 0 (0.0%) |
| 3 or 4 Children | 0 (0.0%) | 0 (0.0%) |
| 5 or more Children | 0 (0.0%) | 0 (0.0%) |
| Total | 69 (2.6%) | 7 (4.0%) |
Race in Palm Beach
The most populous races in Palm Beach are White / Caucasian (8,631 | 93.8%), Hispanic or Latino (478 | 5.2%), and Two or more Races (362 | 3.9%).
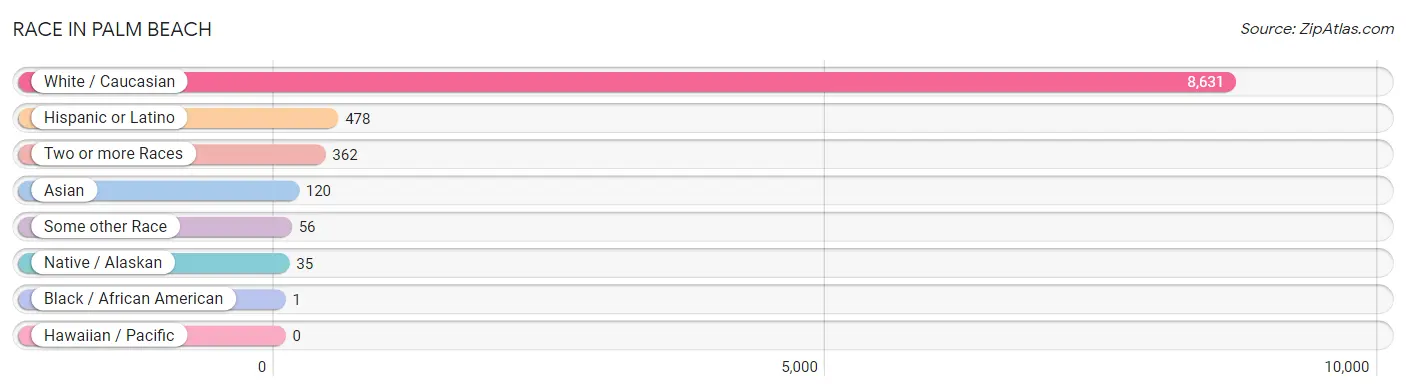
| Race | # Population | % Population |
| Asian | 120 | 1.3% |
| Black / African American | 1 | 0.0% |
| Hawaiian / Pacific | 0 | 0.0% |
| Hispanic or Latino | 478 | 5.2% |
| Native / Alaskan | 35 | 0.4% |
| White / Caucasian | 8,631 | 93.8% |
| Two or more Races | 362 | 3.9% |
| Some other Race | 56 | 0.6% |
| Total | 9,205 | 100.0% |
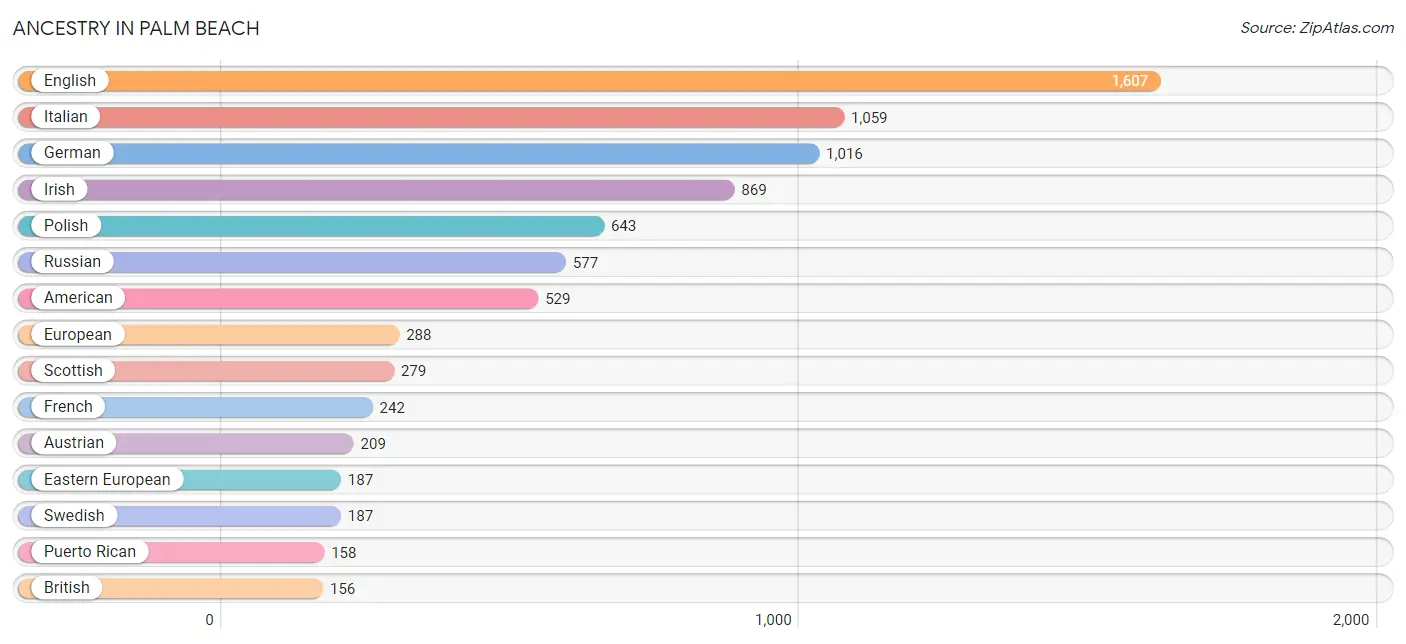
Ancestry in Palm Beach
The most populous ancestries reported in Palm Beach are English (1,607 | 17.5%), Italian (1,059 | 11.5%), German (1,016 | 11.0%), Irish (869 | 9.4%), and Polish (643 | 7.0%), together accounting for 56.4% of all Palm Beach residents.
| Ancestry | # Population | % Population |
| African | 1 | 0.0% |
| American | 529 | 5.8% |
| Apache | 20 | 0.2% |
| Arab | 55 | 0.6% |
| Argentinean | 12 | 0.1% |
| Armenian | 15 | 0.2% |
| Austrian | 209 | 2.3% |
| Basque | 11 | 0.1% |
| Belgian | 23 | 0.3% |
| Brazilian | 15 | 0.2% |
| British | 156 | 1.7% |
| Bulgarian | 10 | 0.1% |
| Canadian | 101 | 1.1% |
| Cherokee | 15 | 0.2% |
| Colombian | 7 | 0.1% |
| Croatian | 12 | 0.1% |
| Cuban | 77 | 0.8% |
| Czech | 18 | 0.2% |
| Danish | 66 | 0.7% |
| Dutch | 45 | 0.5% |
| Eastern European | 187 | 2.0% |
| Ecuadorian | 19 | 0.2% |
| Egyptian | 25 | 0.3% |
| English | 1,607 | 17.5% |
| Estonian | 25 | 0.3% |
| European | 288 | 3.1% |
| Finnish | 26 | 0.3% |
| French | 242 | 2.6% |
| French Canadian | 65 | 0.7% |
| German | 1,016 | 11.0% |
| Greek | 68 | 0.7% |
| Hungarian | 105 | 1.1% |
| Indian (Asian) | 7 | 0.1% |
| Irish | 869 | 9.4% |
| Israeli | 16 | 0.2% |
| Italian | 1,059 | 11.5% |
| Korean | 62 | 0.7% |
| Latvian | 19 | 0.2% |
| Lithuanian | 63 | 0.7% |
| Mexican | 125 | 1.4% |
| Northern European | 3 | 0.0% |
| Norwegian | 84 | 0.9% |
| Pakistani | 42 | 0.5% |
| Peruvian | 23 | 0.3% |
| Polish | 643 | 7.0% |
| Portuguese | 15 | 0.2% |
| Puerto Rican | 158 | 1.7% |
| Romanian | 77 | 0.8% |
| Russian | 577 | 6.3% |
| Scandinavian | 11 | 0.1% |
| Scotch-Irish | 41 | 0.4% |
| Scottish | 279 | 3.0% |
| Slovak | 30 | 0.3% |
| South American | 111 | 1.2% |
| Spanish | 7 | 0.1% |
| Sri Lankan | 21 | 0.2% |
| Subsaharan African | 1 | 0.0% |
| Swedish | 187 | 2.0% |
| Swiss | 39 | 0.4% |
| Thai | 48 | 0.5% |
| Turkish | 21 | 0.2% |
| Ukrainian | 23 | 0.3% |
| Venezuelan | 50 | 0.5% |
| Welsh | 23 | 0.3% | View All 64 Rows |
Immigrants in Palm Beach
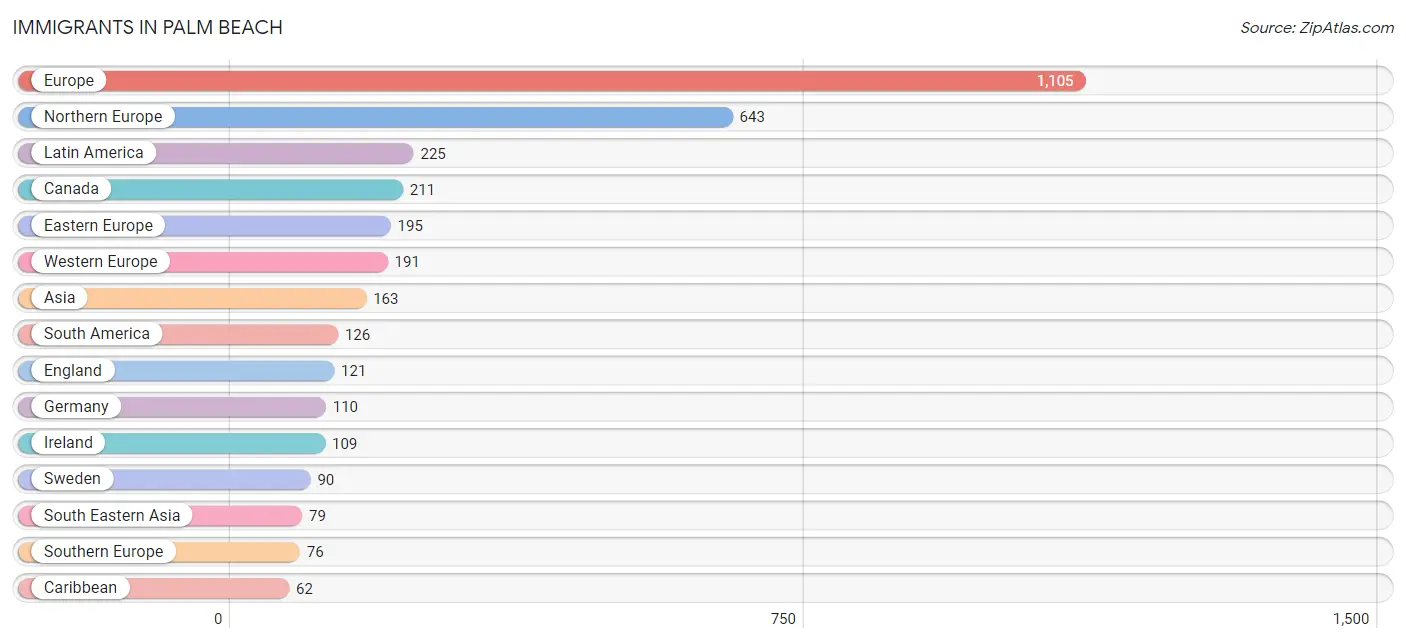
The most numerous immigrant groups reported in Palm Beach came from Europe (1,105 | 12.0%), Northern Europe (643 | 7.0%), Latin America (225 | 2.4%), Canada (211 | 2.3%), and Eastern Europe (195 | 2.1%), together accounting for 25.8% of all Palm Beach residents.
| Immigration Origin | # Population | % Population |
| Africa | 28 | 0.3% |
| Argentina | 12 | 0.1% |
| Asia | 163 | 1.8% |
| Australia | 14 | 0.2% |
| Austria | 50 | 0.5% |
| Belgium | 13 | 0.1% |
| Brazil | 15 | 0.2% |
| Bulgaria | 21 | 0.2% |
| Canada | 211 | 2.3% |
| Caribbean | 62 | 0.7% |
| Central America | 37 | 0.4% |
| China | 18 | 0.2% |
| Colombia | 7 | 0.1% |
| Croatia | 12 | 0.1% |
| Cuba | 56 | 0.6% |
| Denmark | 21 | 0.2% |
| Eastern Asia | 18 | 0.2% |
| Eastern Europe | 195 | 2.1% |
| Ecuador | 19 | 0.2% |
| Egypt | 12 | 0.1% |
| England | 121 | 1.3% |
| Europe | 1,105 | 12.0% |
| France | 18 | 0.2% |
| Germany | 110 | 1.2% |
| Greece | 8 | 0.1% |
| Hong Kong | 7 | 0.1% |
| India | 12 | 0.1% |
| Iran | 8 | 0.1% |
| Ireland | 109 | 1.2% |
| Israel | 19 | 0.2% |
| Italy | 42 | 0.5% |
| Latin America | 225 | 2.4% |
| Lebanon | 15 | 0.2% |
| Mexico | 37 | 0.4% |
| Northern Africa | 12 | 0.1% |
| Northern Europe | 643 | 7.0% |
| Oceania | 14 | 0.2% |
| Peru | 23 | 0.3% |
| Philippines | 28 | 0.3% |
| Poland | 24 | 0.3% |
| Portugal | 19 | 0.2% |
| Romania | 48 | 0.5% |
| Russia | 49 | 0.5% |
| Scotland | 12 | 0.1% |
| South Africa | 16 | 0.2% |
| South America | 126 | 1.4% |
| South Central Asia | 20 | 0.2% |
| South Eastern Asia | 79 | 0.9% |
| Southern Europe | 76 | 0.8% |
| Spain | 7 | 0.1% |
| Sweden | 90 | 1.0% |
| Thailand | 42 | 0.5% |
| Turkey | 12 | 0.1% |
| Ukraine | 16 | 0.2% |
| Venezuela | 50 | 0.5% |
| Vietnam | 9 | 0.1% |
| Western Asia | 46 | 0.5% |
| Western Europe | 191 | 2.1% | View All 58 Rows |
Sex and Age in Palm Beach
Sex and Age in Palm Beach
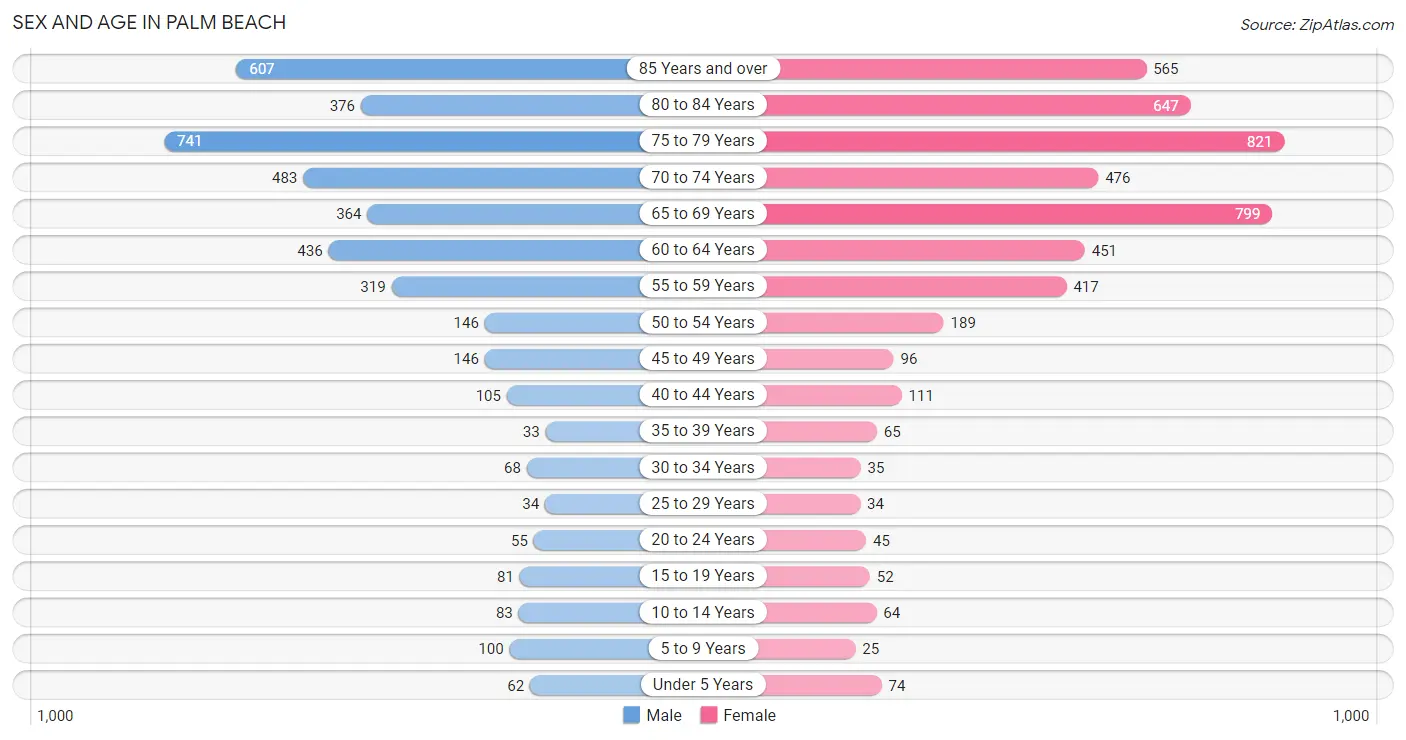
The most populous age groups in Palm Beach are 75 to 79 Years (741 | 17.5%) for men and 75 to 79 Years (821 | 16.5%) for women.
| Age Bracket | Male | Female |
| Under 5 Years | 62 (1.5%) | 74 (1.5%) |
| 5 to 9 Years | 100 (2.4%) | 25 (0.5%) |
| 10 to 14 Years | 83 (2.0%) | 64 (1.3%) |
| 15 to 19 Years | 81 (1.9%) | 52 (1.1%) |
| 20 to 24 Years | 55 (1.3%) | 45 (0.9%) |
| 25 to 29 Years | 34 (0.8%) | 34 (0.7%) |
| 30 to 34 Years | 68 (1.6%) | 35 (0.7%) |
| 35 to 39 Years | 33 (0.8%) | 65 (1.3%) |
| 40 to 44 Years | 105 (2.5%) | 111 (2.2%) |
| 45 to 49 Years | 146 (3.4%) | 96 (1.9%) |
| 50 to 54 Years | 146 (3.4%) | 189 (3.8%) |
| 55 to 59 Years | 319 (7.5%) | 417 (8.4%) |
| 60 to 64 Years | 436 (10.3%) | 451 (9.1%) |
| 65 to 69 Years | 364 (8.6%) | 799 (16.1%) |
| 70 to 74 Years | 483 (11.4%) | 476 (9.6%) |
| 75 to 79 Years | 741 (17.5%) | 821 (16.5%) |
| 80 to 84 Years | 376 (8.9%) | 647 (13.0%) |
| 85 Years and over | 607 (14.3%) | 565 (11.4%) |
| Total | 4,239 (100.0%) | 4,966 (100.0%) |
Families and Households in Palm Beach
Median Family Size in Palm Beach
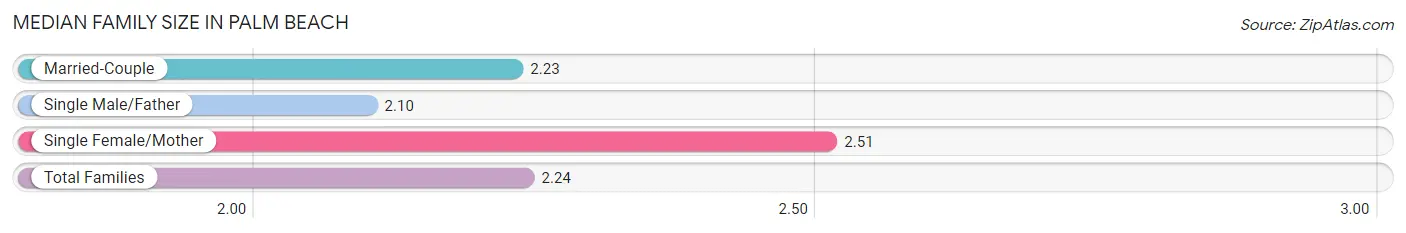
The median family size in Palm Beach is 2.24 persons per family, with single female/mother families (134 | 4.7%) accounting for the largest median family size of 2.51 persons per family. On the other hand, single male/father families (40 | 1.4%) represent the smallest median family size with 2.10 persons per family.
| Family Type | # Families | Family Size |
| Married-Couple | 2,658 (93.9%) | 2.23 |
| Single Male/Father | 40 (1.4%) | 2.10 |
| Single Female/Mother | 134 (4.7%) | 2.51 |
| Total Families | 2,832 (100.0%) | 2.24 |
Median Household Size in Palm Beach
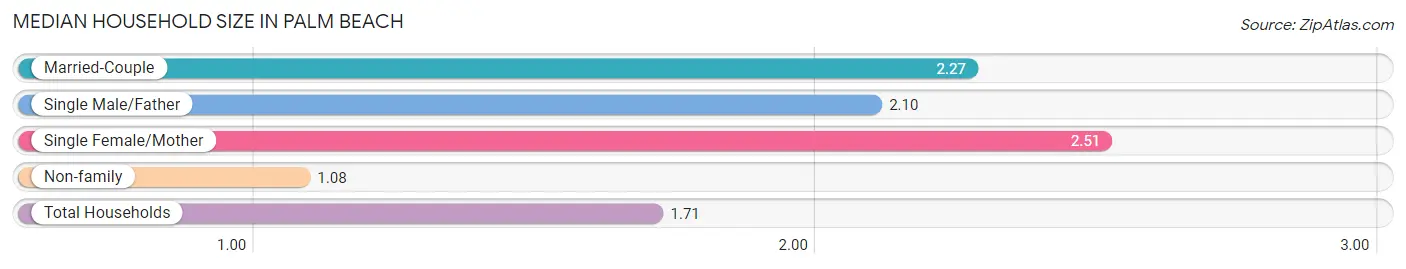
The median household size in Palm Beach is 1.71 persons per household, with single female/mother households (134 | 2.5%) accounting for the largest median household size of 2.51 persons per household. non-family households (2,538 | 47.3%) represent the smallest median household size with 1.08 persons per household.
| Household Type | # Households | Household Size |
| Married-Couple | 2,658 (49.5%) | 2.27 |
| Single Male/Father | 40 (0.7%) | 2.10 |
| Single Female/Mother | 134 (2.5%) | 2.51 |
| Non-family | 2,538 (47.3%) | 1.08 |
| Total Households | 5,370 (100.0%) | 1.71 |
Household Size by Marriage Status in Palm Beach
Out of a total of 5,370 households in Palm Beach, 2,832 (52.7%) are family households, while 2,538 (47.3%) are nonfamily households. The most numerous type of family households are 2-person households, comprising 2,434, and the most common type of nonfamily households are 1-person households, comprising 2,339.
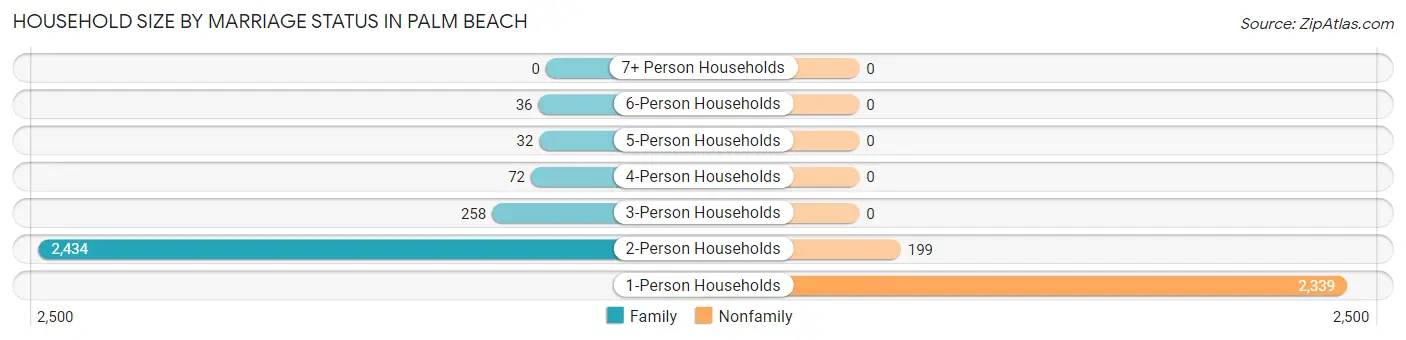
| Household Size | Family Households | Nonfamily Households |
| 1-Person Households | - | 2,339 (43.6%) |
| 2-Person Households | 2,434 (45.3%) | 199 (3.7%) |
| 3-Person Households | 258 (4.8%) | 0 (0.0%) |
| 4-Person Households | 72 (1.3%) | 0 (0.0%) |
| 5-Person Households | 32 (0.6%) | 0 (0.0%) |
| 6-Person Households | 36 (0.7%) | 0 (0.0%) |
| 7+ Person Households | 0 (0.0%) | 0 (0.0%) |
| Total | 2,832 (52.7%) | 2,538 (47.3%) |
Female Fertility in Palm Beach
Fertility by Age in Palm Beach
Average fertility rate in Palm Beach is 25.0 births per 1,000 women. Women in the age bracket of 20 to 34 years have the highest fertility rate with 105.0 births per 1,000 women. Women in the age bracket of 20 to 34 years acount for 100.0% of all women with births.
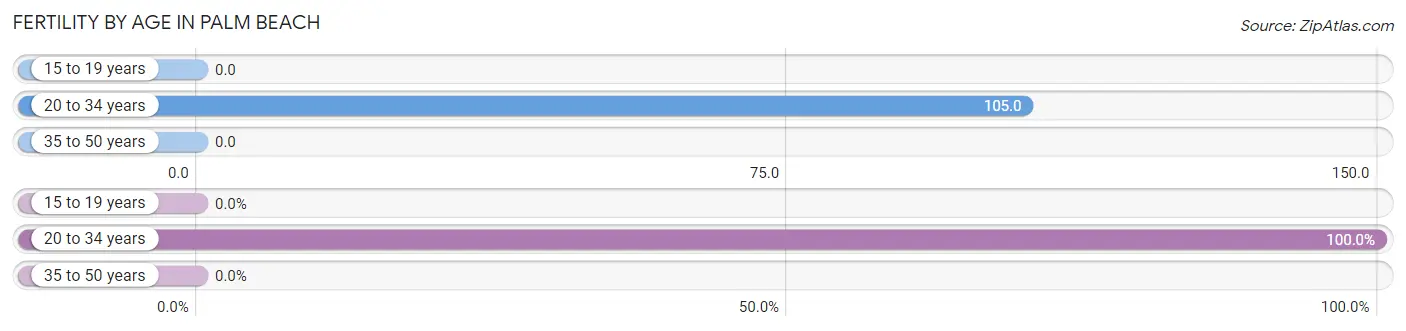
| Age Bracket | Women with Births | Births / 1,000 Women |
| 15 to 19 years | 0 (0.0%) | 0.0 |
| 20 to 34 years | 12 (100.0%) | 105.0 |
| 35 to 50 years | 0 (0.0%) | 0.0 |
| Total | 12 (100.0%) | 25.0 |
Fertility by Age by Marriage Status in Palm Beach
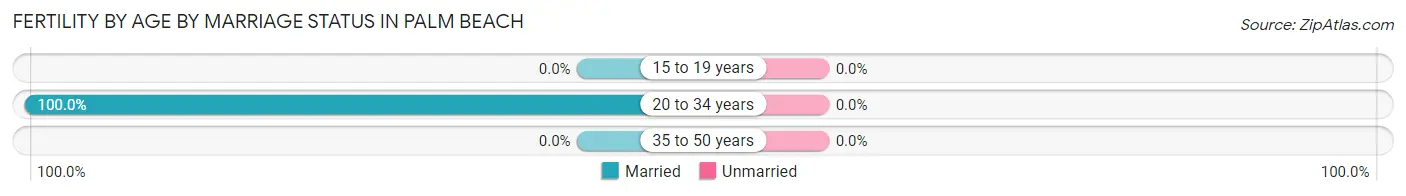
| Age Bracket | Married | Unmarried |
| 15 to 19 years | 0 (0.0%) | 0 (0.0%) |
| 20 to 34 years | 12 (100.0%) | 0 (0.0%) |
| 35 to 50 years | 0 (0.0%) | 0 (0.0%) |
| Total | 12 (100.0%) | 0 (0.0%) |
Fertility by Education in Palm Beach
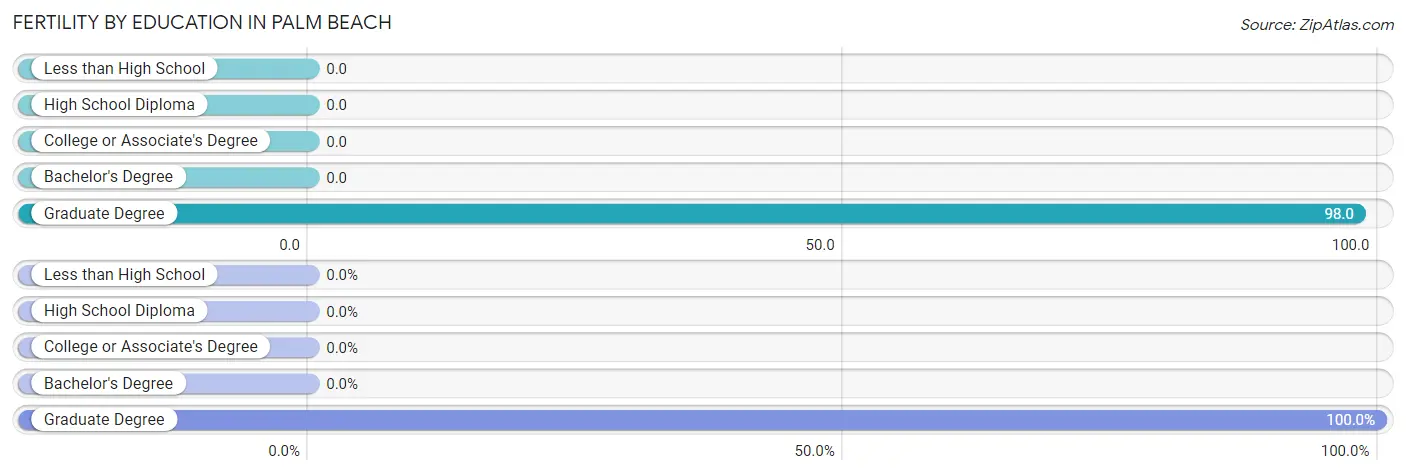
| Educational Attainment | Women with Births | Births / 1,000 Women |
| Less than High School | 0 (0.0%) | 0.0 |
| High School Diploma | 0 (0.0%) | 0.0 |
| College or Associate's Degree | 0 (0.0%) | 0.0 |
| Bachelor's Degree | 0 (0.0%) | 0.0 |
| Graduate Degree | 12 (100.0%) | 98.0 |
| Total | 12 (100.0%) | 25.0 |
Fertility by Education by Marriage Status in Palm Beach
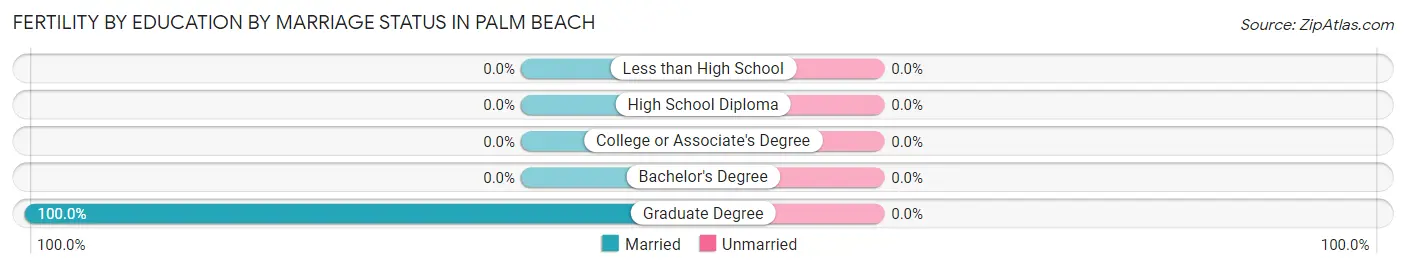
| Educational Attainment | Married | Unmarried |
| Less than High School | 0 (0.0%) | 0 (0.0%) |
| High School Diploma | 0 (0.0%) | 0 (0.0%) |
| College or Associate's Degree | 0 (0.0%) | 0 (0.0%) |
| Bachelor's Degree | 0 (0.0%) | 0 (0.0%) |
| Graduate Degree | 12 (100.0%) | 0 (0.0%) |
| Total | 12 (100.0%) | 0 (0.0%) |
Employment Characteristics in Palm Beach
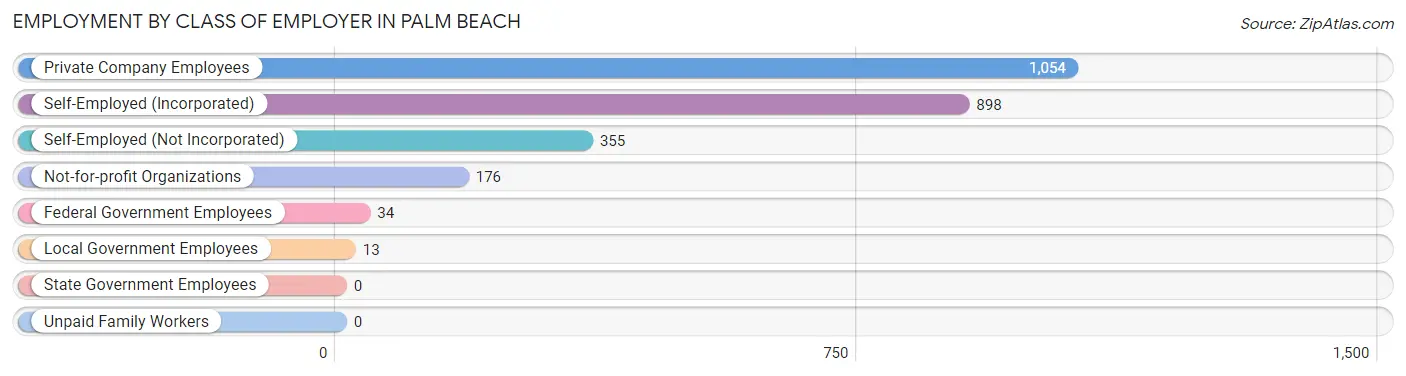
Employment by Class of Employer in Palm Beach
Among the 2,530 employed individuals in Palm Beach, private company employees (1,054 | 41.7%), self-employed (incorporated) (898 | 35.5%), and self-employed (not incorporated) (355 | 14.0%) make up the most common classes of employment.
| Employer Class | # Employees | % Employees |
| Private Company Employees | 1,054 | 41.7% |
| Self-Employed (Incorporated) | 898 | 35.5% |
| Self-Employed (Not Incorporated) | 355 | 14.0% |
| Not-for-profit Organizations | 176 | 7.0% |
| Local Government Employees | 13 | 0.5% |
| State Government Employees | 0 | 0.0% |
| Federal Government Employees | 34 | 1.3% |
| Unpaid Family Workers | 0 | 0.0% |
| Total | 2,530 | 100.0% |
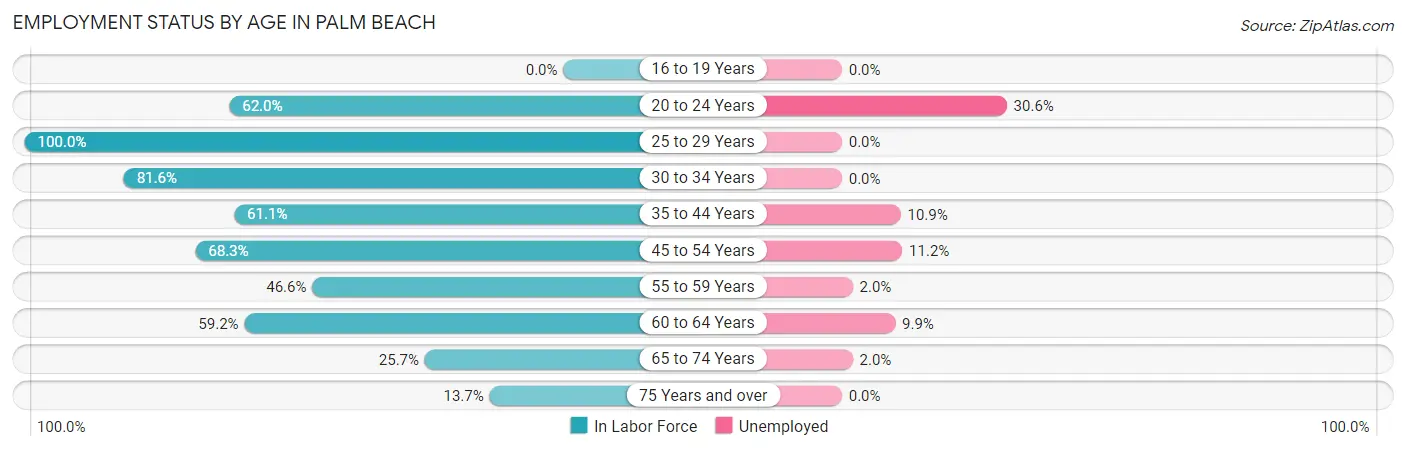
Employment Status by Age in Palm Beach
According to the labor force statistics for Palm Beach, out of the total population over 16 years of age (8,715), 31.3% or 2,728 individuals are in the labor force, with 5.6% or 153 of them unemployed. The age group with the highest labor force participation rate is 25 to 29 years, with 100.0% or 68 individuals in the labor force. Within the labor force, the 20 to 24 years age range has the highest percentage of unemployed individuals, with 30.6% or 19 of them being unemployed.
| Age Bracket | In Labor Force | Unemployed |
| 16 to 19 Years | 0 (0.0%) | 0 (0.0%) |
| 20 to 24 Years | 62 (62.0%) | 19 (30.6%) |
| 25 to 29 Years | 68 (100.0%) | 0 (0.0%) |
| 30 to 34 Years | 84 (81.6%) | 0 (0.0%) |
| 35 to 44 Years | 192 (61.1%) | 21 (10.9%) |
| 45 to 54 Years | 394 (68.3%) | 44 (11.2%) |
| 55 to 59 Years | 343 (46.6%) | 7 (2.0%) |
| 60 to 64 Years | 525 (59.2%) | 52 (9.9%) |
| 65 to 74 Years | 545 (25.7%) | 11 (2.0%) |
| 75 Years and over | 515 (13.7%) | 0 (0.0%) |
| Total | 2,728 (31.3%) | 153 (5.6%) |
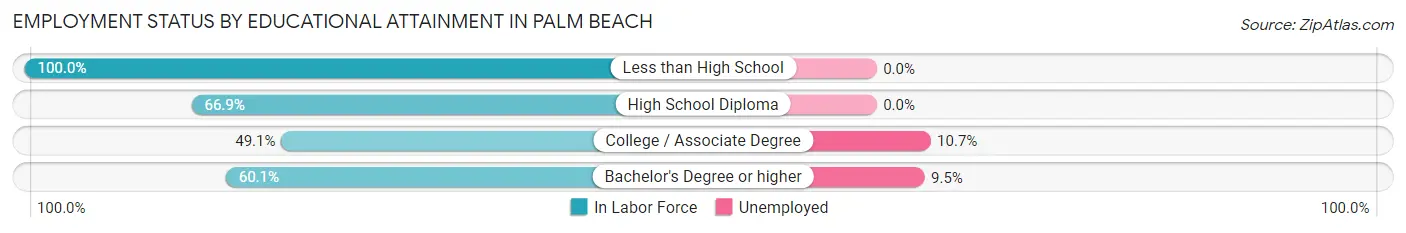
Employment Status by Educational Attainment in Palm Beach
According to labor force statistics for Palm Beach, 59.8% of individuals (1,606) out of the total population between 25 and 64 years of age (2,685) are in the labor force, with 7.7% or 124 of them being unemployed. The group with the highest labor force participation rate are those with the educational attainment of less than high school, with 100.0% or 46 individuals in the labor force. Within the labor force, individuals with college / associate degree education have the highest percentage of unemployment, with 10.7% or 27 of them being unemployed.
| Educational Attainment | In Labor Force | Unemployed |
| Less than High School | 46 (100.0%) | 0 (0.0%) |
| High School Diploma | 291 (66.9%) | 0 (0.0%) |
| College / Associate Degree | 252 (49.1%) | 55 (10.7%) |
| Bachelor's Degree or higher | 1,016 (60.1%) | 161 (9.5%) |
| Total | 1,606 (59.8%) | 207 (7.7%) |
Employment Occupations by Sex in Palm Beach
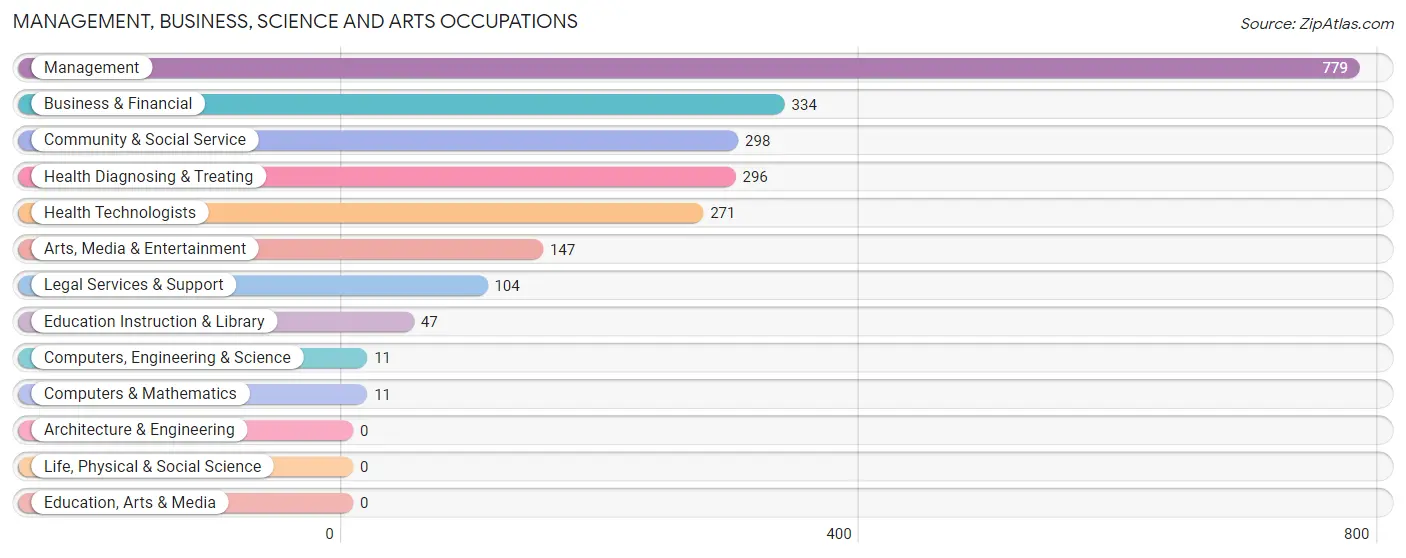
Management, Business, Science and Arts Occupations
The most common Management, Business, Science and Arts occupations in Palm Beach are Management (779 | 30.2%), Business & Financial (334 | 13.0%), Community & Social Service (298 | 11.6%), Health Diagnosing & Treating (296 | 11.5%), and Health Technologists (271 | 10.5%).
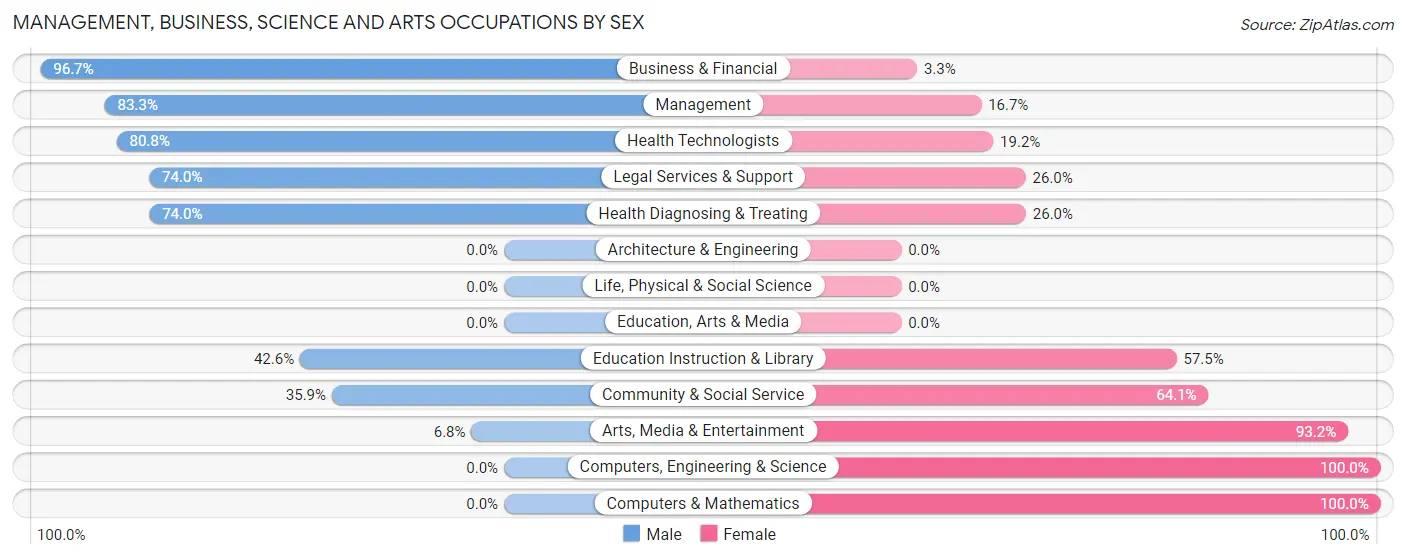
Management, Business, Science and Arts Occupations by Sex
Within the Management, Business, Science and Arts occupations in Palm Beach, the most male-oriented occupations are Business & Financial (96.7%), Management (83.3%), and Health Technologists (80.8%), while the most female-oriented occupations are Computers, Engineering & Science (100.0%), Computers & Mathematics (100.0%), and Arts, Media & Entertainment (93.2%).
| Occupation | Male | Female |
| Management | 649 (83.3%) | 130 (16.7%) |
| Business & Financial | 323 (96.7%) | 11 (3.3%) |
| Computers, Engineering & Science | 0 (0.0%) | 11 (100.0%) |
| Computers & Mathematics | 0 (0.0%) | 11 (100.0%) |
| Architecture & Engineering | 0 (0.0%) | 0 (0.0%) |
| Life, Physical & Social Science | 0 (0.0%) | 0 (0.0%) |
| Community & Social Service | 107 (35.9%) | 191 (64.1%) |
| Education, Arts & Media | 0 (0.0%) | 0 (0.0%) |
| Legal Services & Support | 77 (74.0%) | 27 (26.0%) |
| Education Instruction & Library | 20 (42.5%) | 27 (57.5%) |
| Arts, Media & Entertainment | 10 (6.8%) | 137 (93.2%) |
| Health Diagnosing & Treating | 219 (74.0%) | 77 (26.0%) |
| Health Technologists | 219 (80.8%) | 52 (19.2%) |
| Total (Category) | 1,298 (75.5%) | 420 (24.4%) |
| Total (Overall) | 1,720 (66.8%) | 855 (33.2%) |
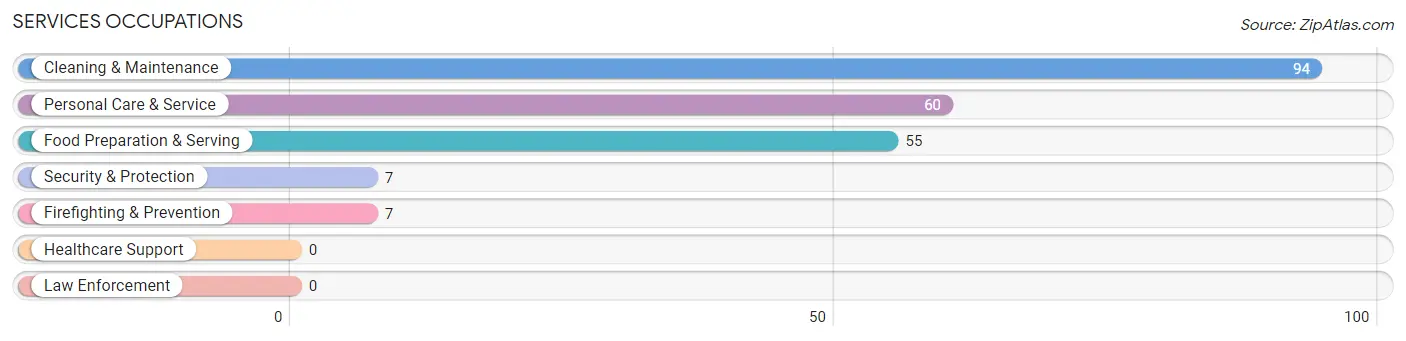
Services Occupations
The most common Services occupations in Palm Beach are Cleaning & Maintenance (94 | 3.6%), Personal Care & Service (60 | 2.3%), Food Preparation & Serving (55 | 2.1%), Security & Protection (7 | 0.3%), and Firefighting & Prevention (7 | 0.3%).
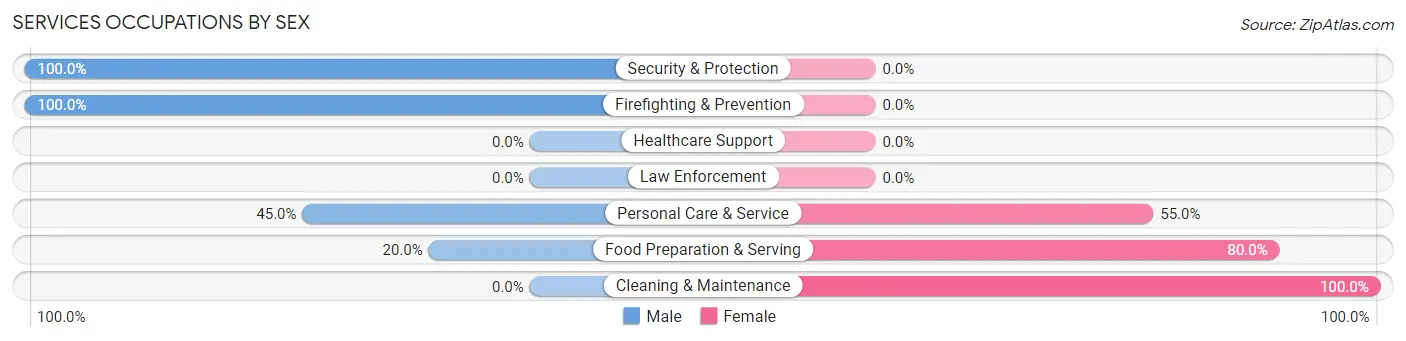
Services Occupations by Sex
Within the Services occupations in Palm Beach, the most male-oriented occupations are Security & Protection (100.0%), Firefighting & Prevention (100.0%), and Personal Care & Service (45.0%), while the most female-oriented occupations are Cleaning & Maintenance (100.0%), Food Preparation & Serving (80.0%), and Personal Care & Service (55.0%).
| Occupation | Male | Female |
| Healthcare Support | 0 (0.0%) | 0 (0.0%) |
| Security & Protection | 7 (100.0%) | 0 (0.0%) |
| Firefighting & Prevention | 7 (100.0%) | 0 (0.0%) |
| Law Enforcement | 0 (0.0%) | 0 (0.0%) |
| Food Preparation & Serving | 11 (20.0%) | 44 (80.0%) |
| Cleaning & Maintenance | 0 (0.0%) | 94 (100.0%) |
| Personal Care & Service | 27 (45.0%) | 33 (55.0%) |
| Total (Category) | 45 (20.8%) | 171 (79.2%) |
| Total (Overall) | 1,720 (66.8%) | 855 (33.2%) |
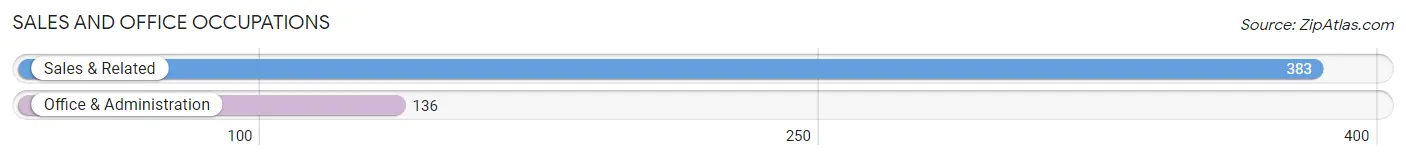
Sales and Office Occupations
The most common Sales and Office occupations in Palm Beach are Sales & Related (383 | 14.9%), and Office & Administration (136 | 5.3%).
Sales and Office Occupations by Sex
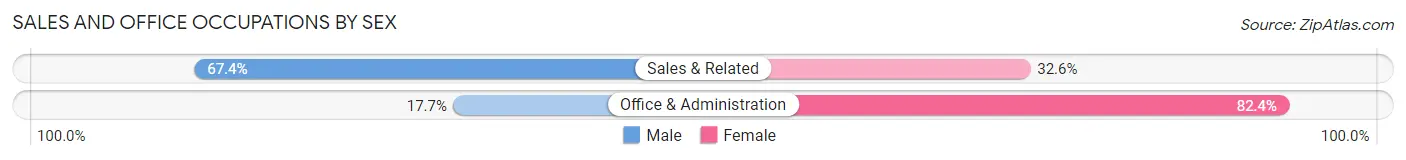
| Occupation | Male | Female |
| Sales & Related | 258 (67.4%) | 125 (32.6%) |
| Office & Administration | 24 (17.6%) | 112 (82.4%) |
| Total (Category) | 282 (54.3%) | 237 (45.7%) |
| Total (Overall) | 1,720 (66.8%) | 855 (33.2%) |
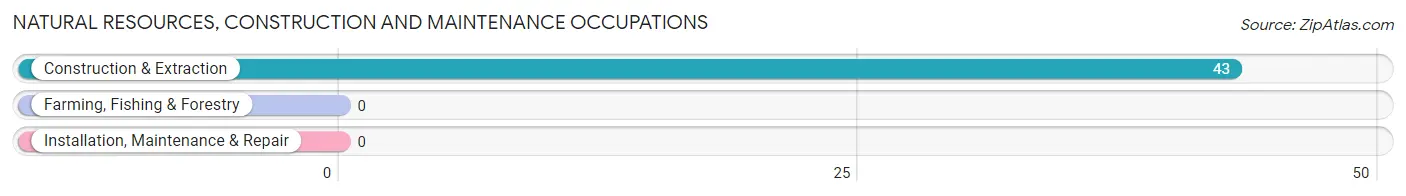
Natural Resources, Construction and Maintenance Occupations
The most common Natural Resources, Construction and Maintenance occupations in Palm Beach are , and Construction & Extraction (43 | 1.7%).
Natural Resources, Construction and Maintenance Occupations by Sex
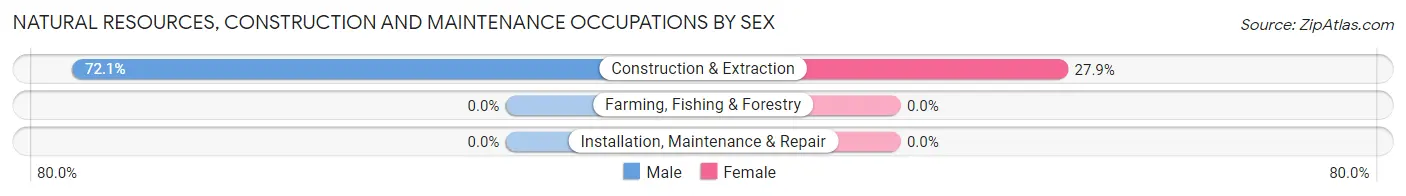
| Occupation | Male | Female |
| Farming, Fishing & Forestry | 0 (0.0%) | 0 (0.0%) |
| Construction & Extraction | 31 (72.1%) | 12 (27.9%) |
| Installation, Maintenance & Repair | 0 (0.0%) | 0 (0.0%) |
| Total (Category) | 31 (72.1%) | 12 (27.9%) |
| Total (Overall) | 1,720 (66.8%) | 855 (33.2%) |
Production, Transportation and Moving Occupations
The most common Production, Transportation and Moving occupations in Palm Beach are Transportation (45 | 1.8%), Production (21 | 0.8%), and Material Moving (13 | 0.5%).
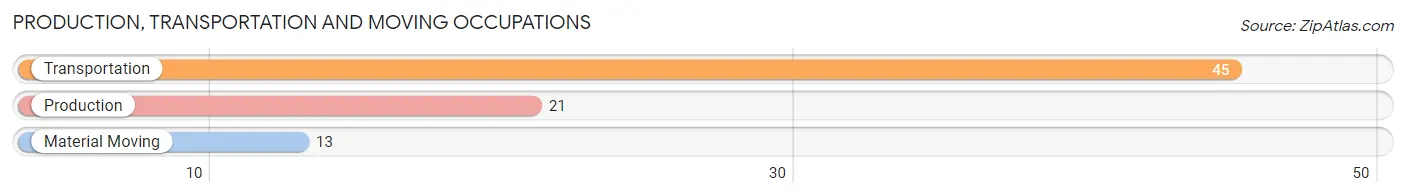
Production, Transportation and Moving Occupations by Sex
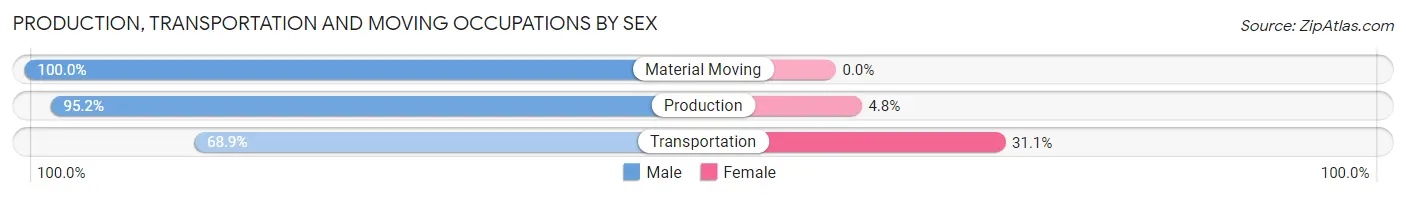
| Occupation | Male | Female |
| Production | 20 (95.2%) | 1 (4.8%) |
| Transportation | 31 (68.9%) | 14 (31.1%) |
| Material Moving | 13 (100.0%) | 0 (0.0%) |
| Total (Category) | 64 (81.0%) | 15 (19.0%) |
| Total (Overall) | 1,720 (66.8%) | 855 (33.2%) |
Employment Industries by Sex in Palm Beach
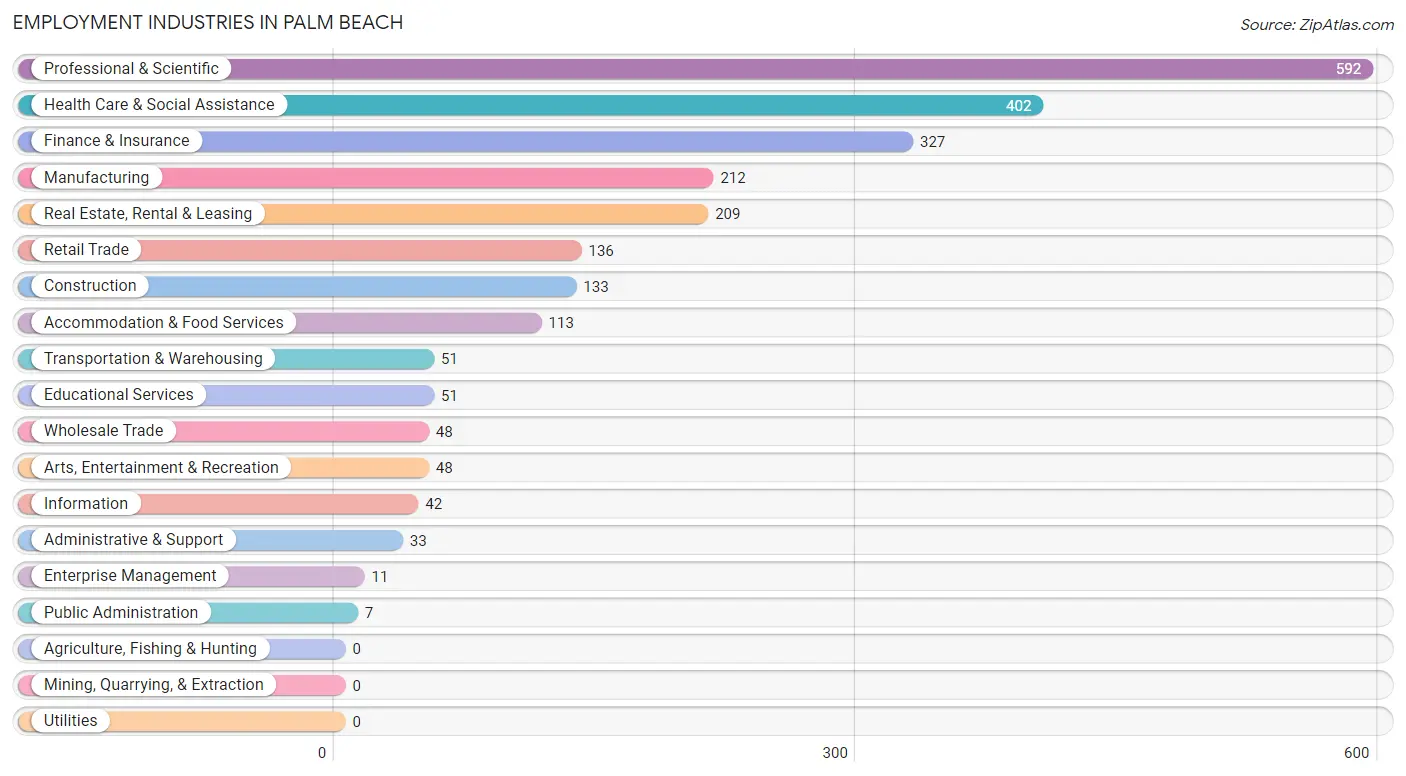
Employment Industries in Palm Beach
The major employment industries in Palm Beach include Professional & Scientific (592 | 23.0%), Health Care & Social Assistance (402 | 15.6%), Finance & Insurance (327 | 12.7%), Manufacturing (212 | 8.2%), and Real Estate, Rental & Leasing (209 | 8.1%).
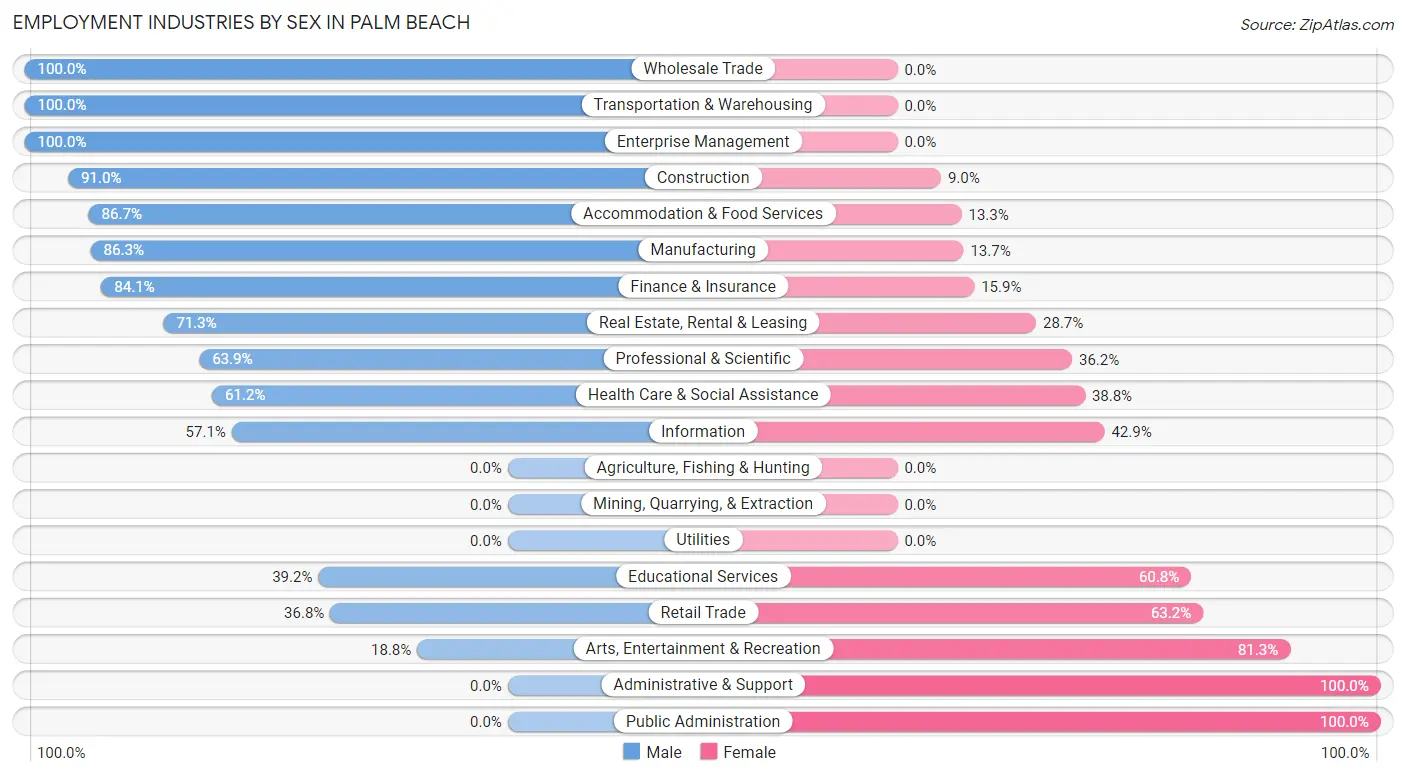
Employment Industries by Sex in Palm Beach
The Palm Beach industries that see more men than women are Wholesale Trade (100.0%), Transportation & Warehousing (100.0%), and Enterprise Management (100.0%), whereas the industries that tend to have a higher number of women are Administrative & Support (100.0%), Public Administration (100.0%), and Arts, Entertainment & Recreation (81.2%).
| Industry | Male | Female |
| Agriculture, Fishing & Hunting | 0 (0.0%) | 0 (0.0%) |
| Mining, Quarrying, & Extraction | 0 (0.0%) | 0 (0.0%) |
| Construction | 121 (91.0%) | 12 (9.0%) |
| Manufacturing | 183 (86.3%) | 29 (13.7%) |
| Wholesale Trade | 48 (100.0%) | 0 (0.0%) |
| Retail Trade | 50 (36.8%) | 86 (63.2%) |
| Transportation & Warehousing | 51 (100.0%) | 0 (0.0%) |
| Utilities | 0 (0.0%) | 0 (0.0%) |
| Information | 24 (57.1%) | 18 (42.9%) |
| Finance & Insurance | 275 (84.1%) | 52 (15.9%) |
| Real Estate, Rental & Leasing | 149 (71.3%) | 60 (28.7%) |
| Professional & Scientific | 378 (63.8%) | 214 (36.1%) |
| Enterprise Management | 11 (100.0%) | 0 (0.0%) |
| Administrative & Support | 0 (0.0%) | 33 (100.0%) |
| Educational Services | 20 (39.2%) | 31 (60.8%) |
| Health Care & Social Assistance | 246 (61.2%) | 156 (38.8%) |
| Arts, Entertainment & Recreation | 9 (18.8%) | 39 (81.2%) |
| Accommodation & Food Services | 98 (86.7%) | 15 (13.3%) |
| Public Administration | 0 (0.0%) | 7 (100.0%) |
| Total | 1,720 (66.8%) | 855 (33.2%) |
Education in Palm Beach
School Enrollment in Palm Beach
The most common levels of schooling among the 577 students in Palm Beach are elementary school (134 | 23.2%), high school (120 | 20.8%), and middle school (103 | 17.8%).
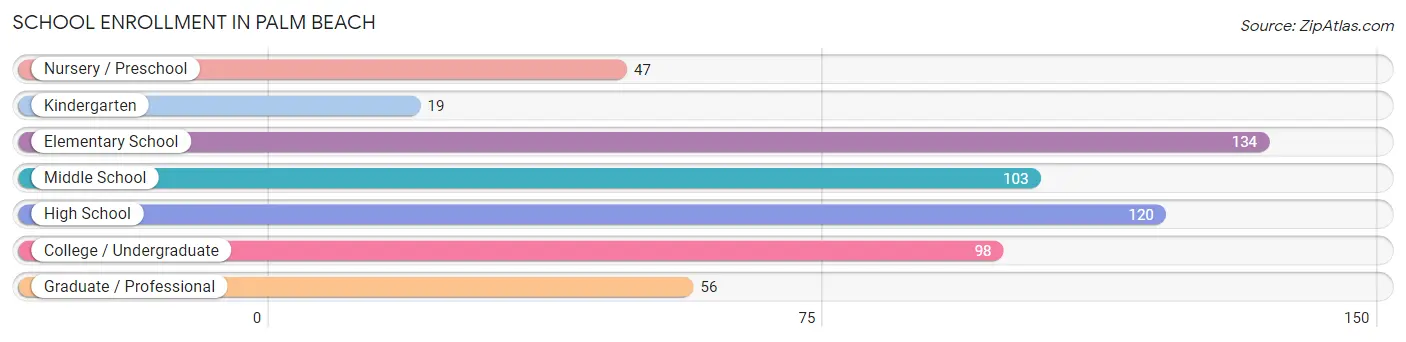
| School Level | # Students | % Students |
| Nursery / Preschool | 47 | 8.2% |
| Kindergarten | 19 | 3.3% |
| Elementary School | 134 | 23.2% |
| Middle School | 103 | 17.8% |
| High School | 120 | 20.8% |
| College / Undergraduate | 98 | 17.0% |
| Graduate / Professional | 56 | 9.7% |
| Total | 577 | 100.0% |
School Enrollment by Age by Funding Source in Palm Beach
Out of a total of 577 students who are enrolled in schools in Palm Beach, 426 (73.8%) attend a private institution, while the remaining 151 (26.2%) are enrolled in public schools. The age group of 3 to 4 year olds has the highest likelihood of being enrolled in private schools, with 40 (100.0% in the age bracket) enrolled. Conversely, the age group of 25 to 34 year olds has the lowest likelihood of being enrolled in a private school, with 9 (100.0% in the age bracket) attending a public institution.
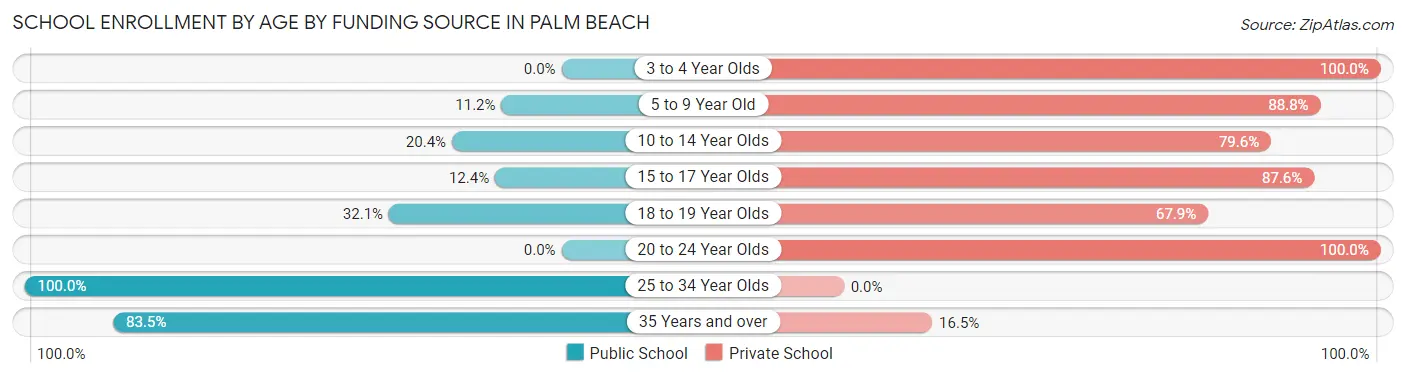
| Age Bracket | Public School | Private School |
| 3 to 4 Year Olds | 0 (0.0%) | 40 (100.0%) |
| 5 to 9 Year Old | 14 (11.2%) | 111 (88.8%) |
| 10 to 14 Year Olds | 30 (20.4%) | 117 (79.6%) |
| 15 to 17 Year Olds | 13 (12.4%) | 92 (87.6%) |
| 18 to 19 Year Olds | 9 (32.1%) | 19 (67.9%) |
| 20 to 24 Year Olds | 0 (0.0%) | 32 (100.0%) |
| 25 to 34 Year Olds | 9 (100.0%) | 0 (0.0%) |
| 35 Years and over | 76 (83.5%) | 15 (16.5%) |
| Total | 151 (26.2%) | 426 (73.8%) |
Educational Attainment by Field of Study in Palm Beach
Business (1,225 | 19.8%), social sciences (1,059 | 17.1%), literature & languages (672 | 10.9%), education (532 | 8.6%), and science & technology (491 | 7.9%) are the most common fields of study among 6,187 individuals in Palm Beach who have obtained a bachelor's degree or higher.
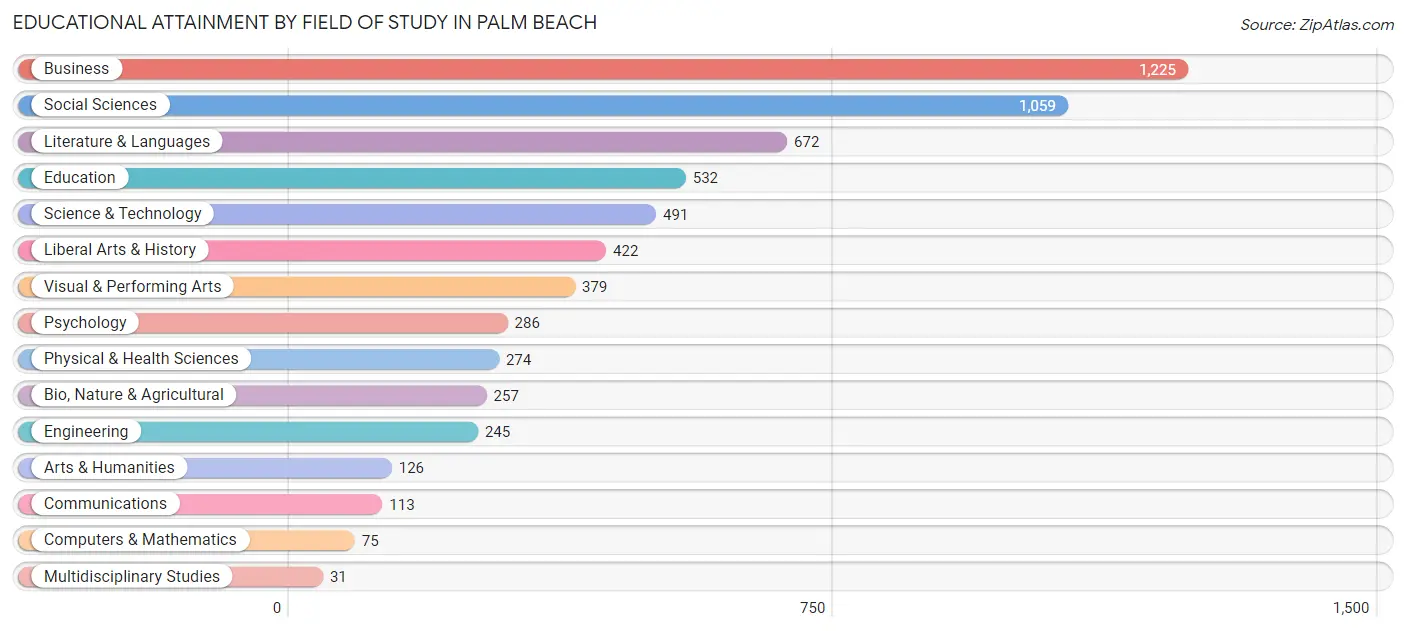
| Field of Study | # Graduates | % Graduates |
| Computers & Mathematics | 75 | 1.2% |
| Bio, Nature & Agricultural | 257 | 4.2% |
| Physical & Health Sciences | 274 | 4.4% |
| Psychology | 286 | 4.6% |
| Social Sciences | 1,059 | 17.1% |
| Engineering | 245 | 4.0% |
| Multidisciplinary Studies | 31 | 0.5% |
| Science & Technology | 491 | 7.9% |
| Business | 1,225 | 19.8% |
| Education | 532 | 8.6% |
| Literature & Languages | 672 | 10.9% |
| Liberal Arts & History | 422 | 6.8% |
| Visual & Performing Arts | 379 | 6.1% |
| Communications | 113 | 1.8% |
| Arts & Humanities | 126 | 2.0% |
| Total | 6,187 | 100.0% |
Transportation & Commute in Palm Beach
Vehicle Availability by Sex in Palm Beach
The most prevalent vehicle ownership categories in Palm Beach are males with 1 vehicle (673, accounting for 39.4%) and females with 1 vehicle (267, making up 82.1%).
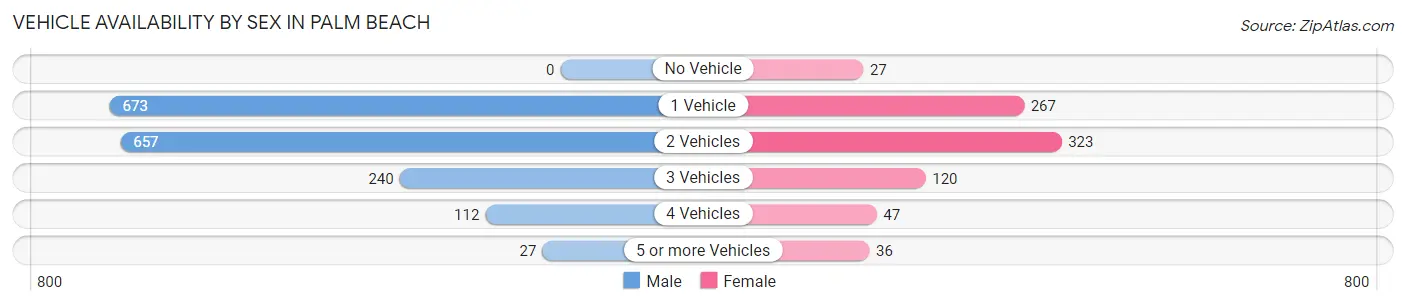
| Vehicles Available | Male | Female |
| No Vehicle | 0 (0.0%) | 27 (3.3%) |
| 1 Vehicle | 673 (39.4%) | 267 (32.6%) |
| 2 Vehicles | 657 (38.4%) | 323 (39.4%) |
| 3 Vehicles | 240 (14.0%) | 120 (14.6%) |
| 4 Vehicles | 112 (6.6%) | 47 (5.7%) |
| 5 or more Vehicles | 27 (1.6%) | 36 (4.4%) |
| Total | 1,709 (100.0%) | 820 (100.0%) |
Commute Time in Palm Beach
The most frequently occuring commute durations in Palm Beach are 10 to 14 minutes (447 commuters, 27.5%), 5 to 9 minutes (225 commuters, 13.9%), and 25 to 29 minutes (191 commuters, 11.8%).
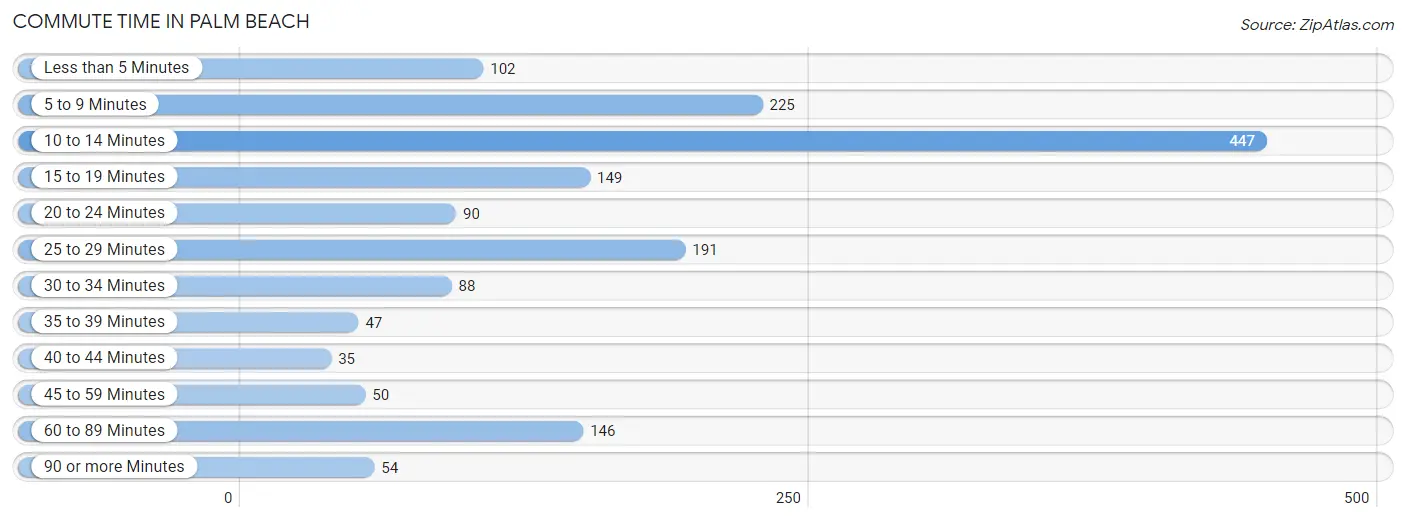
| Commute Time | # Commuters | % Commuters |
| Less than 5 Minutes | 102 | 6.3% |
| 5 to 9 Minutes | 225 | 13.9% |
| 10 to 14 Minutes | 447 | 27.5% |
| 15 to 19 Minutes | 149 | 9.2% |
| 20 to 24 Minutes | 90 | 5.5% |
| 25 to 29 Minutes | 191 | 11.8% |
| 30 to 34 Minutes | 88 | 5.4% |
| 35 to 39 Minutes | 47 | 2.9% |
| 40 to 44 Minutes | 35 | 2.2% |
| 45 to 59 Minutes | 50 | 3.1% |
| 60 to 89 Minutes | 146 | 9.0% |
| 90 or more Minutes | 54 | 3.3% |
Commute Time by Sex in Palm Beach
The most common commute times in Palm Beach are 10 to 14 minutes (294 commuters, 28.5%) for males and 10 to 14 minutes (153 commuters, 25.9%) for females.
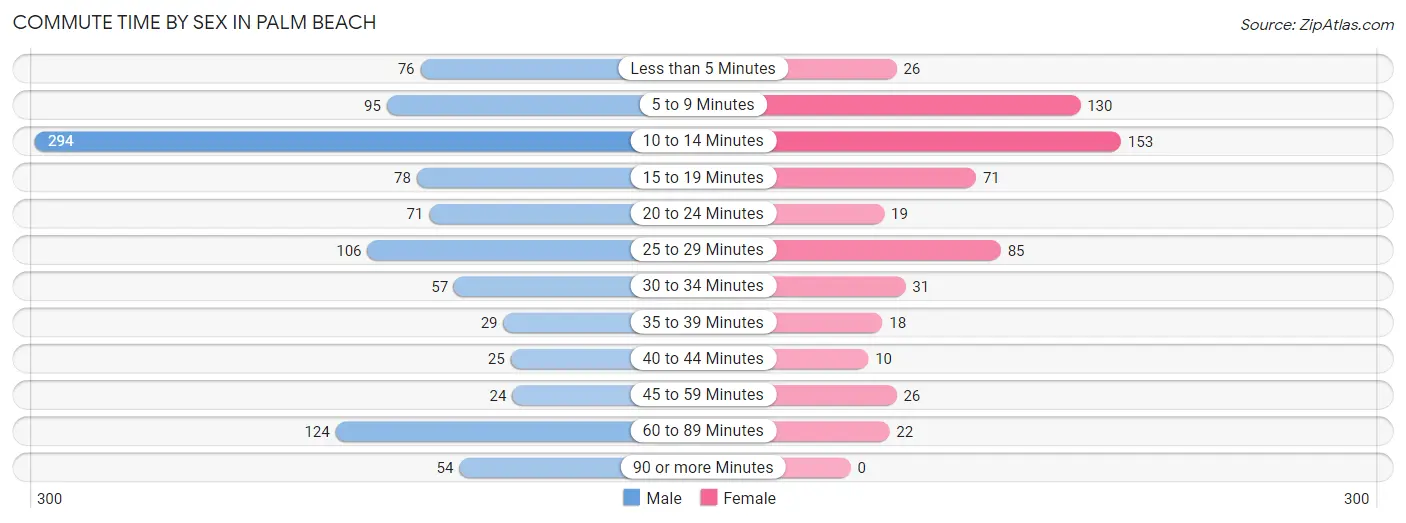
| Commute Time | Male | Female |
| Less than 5 Minutes | 76 (7.4%) | 26 (4.4%) |
| 5 to 9 Minutes | 95 (9.2%) | 130 (22.0%) |
| 10 to 14 Minutes | 294 (28.5%) | 153 (25.9%) |
| 15 to 19 Minutes | 78 (7.5%) | 71 (12.0%) |
| 20 to 24 Minutes | 71 (6.9%) | 19 (3.2%) |
| 25 to 29 Minutes | 106 (10.3%) | 85 (14.4%) |
| 30 to 34 Minutes | 57 (5.5%) | 31 (5.2%) |
| 35 to 39 Minutes | 29 (2.8%) | 18 (3.0%) |
| 40 to 44 Minutes | 25 (2.4%) | 10 (1.7%) |
| 45 to 59 Minutes | 24 (2.3%) | 26 (4.4%) |
| 60 to 89 Minutes | 124 (12.0%) | 22 (3.7%) |
| 90 or more Minutes | 54 (5.2%) | 0 (0.0%) |
Time of Departure to Work by Sex in Palm Beach
The most frequent times of departure to work in Palm Beach are 7:30 AM to 7:59 AM (242, 23.4%) for males and 9:00 AM to 9:59 AM (247, 41.8%) for females.
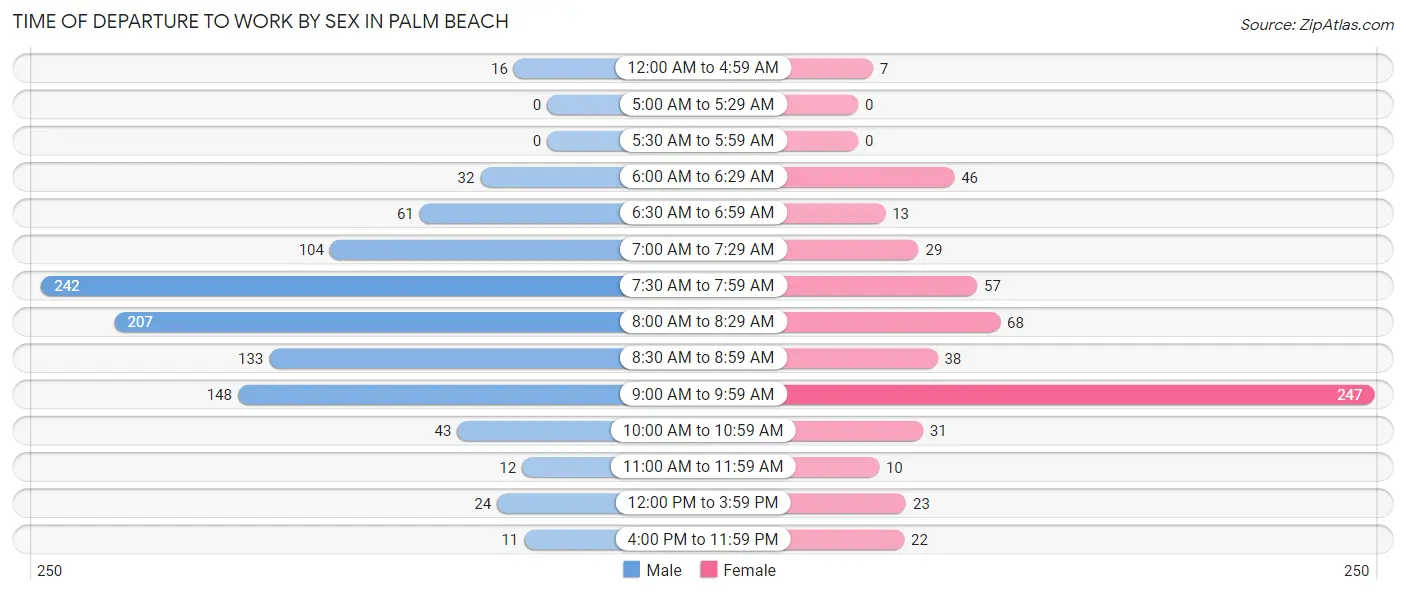
| Time of Departure | Male | Female |
| 12:00 AM to 4:59 AM | 16 (1.5%) | 7 (1.2%) |
| 5:00 AM to 5:29 AM | 0 (0.0%) | 0 (0.0%) |
| 5:30 AM to 5:59 AM | 0 (0.0%) | 0 (0.0%) |
| 6:00 AM to 6:29 AM | 32 (3.1%) | 46 (7.8%) |
| 6:30 AM to 6:59 AM | 61 (5.9%) | 13 (2.2%) |
| 7:00 AM to 7:29 AM | 104 (10.1%) | 29 (4.9%) |
| 7:30 AM to 7:59 AM | 242 (23.4%) | 57 (9.6%) |
| 8:00 AM to 8:29 AM | 207 (20.0%) | 68 (11.5%) |
| 8:30 AM to 8:59 AM | 133 (12.9%) | 38 (6.4%) |
| 9:00 AM to 9:59 AM | 148 (14.3%) | 247 (41.8%) |
| 10:00 AM to 10:59 AM | 43 (4.2%) | 31 (5.2%) |
| 11:00 AM to 11:59 AM | 12 (1.2%) | 10 (1.7%) |
| 12:00 PM to 3:59 PM | 24 (2.3%) | 23 (3.9%) |
| 4:00 PM to 11:59 PM | 11 (1.1%) | 22 (3.7%) |
| Total | 1,033 (100.0%) | 591 (100.0%) |
Housing Occupancy in Palm Beach
Occupancy by Ownership in Palm Beach
Of the total 5,370 dwellings in Palm Beach, owner-occupied units account for 4,519 (84.2%), while renter-occupied units make up 851 (15.9%).
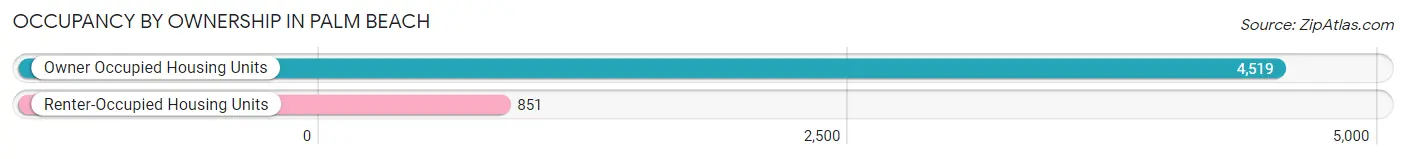
| Occupancy | # Housing Units | % Housing Units |
| Owner Occupied Housing Units | 4,519 | 84.2% |
| Renter-Occupied Housing Units | 851 | 15.9% |
| Total Occupied Housing Units | 5,370 | 100.0% |
Occupancy by Household Size in Palm Beach
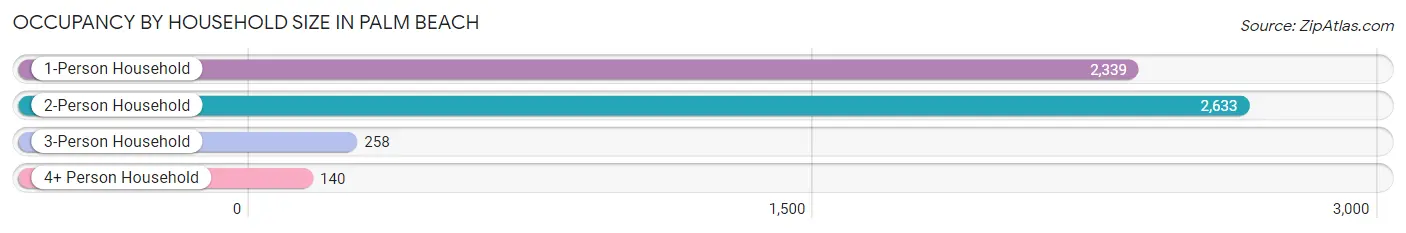
| Household Size | # Housing Units | % Housing Units |
| 1-Person Household | 2,339 | 43.6% |
| 2-Person Household | 2,633 | 49.0% |
| 3-Person Household | 258 | 4.8% |
| 4+ Person Household | 140 | 2.6% |
| Total Housing Units | 5,370 | 100.0% |
Occupancy by Ownership by Household Size in Palm Beach
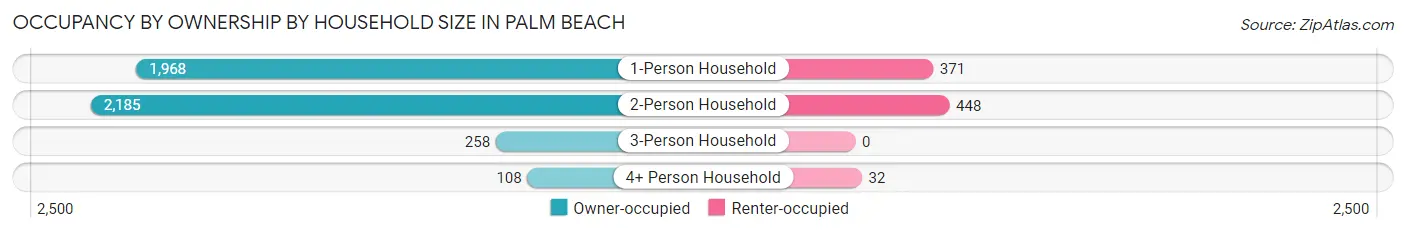
| Household Size | Owner-occupied | Renter-occupied |
| 1-Person Household | 1,968 (84.1%) | 371 (15.9%) |
| 2-Person Household | 2,185 (83.0%) | 448 (17.0%) |
| 3-Person Household | 258 (100.0%) | 0 (0.0%) |
| 4+ Person Household | 108 (77.1%) | 32 (22.9%) |
| Total Housing Units | 4,519 (84.2%) | 851 (15.9%) |
Occupancy by Educational Attainment in Palm Beach
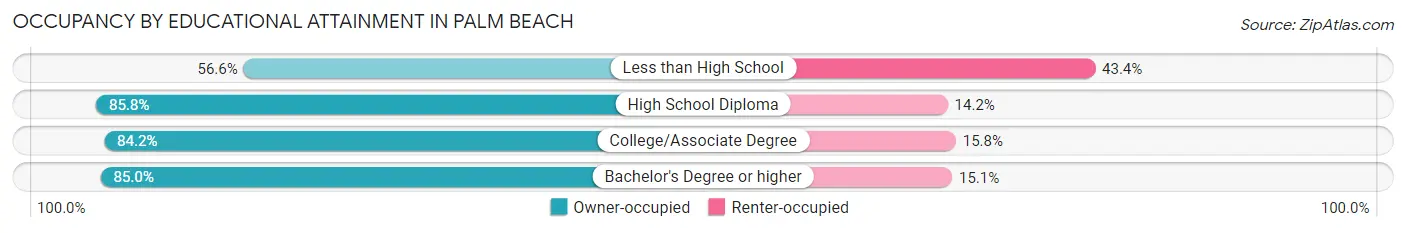
| Household Size | Owner-occupied | Renter-occupied |
| Less than High School | 73 (56.6%) | 56 (43.4%) |
| High School Diploma | 212 (85.8%) | 35 (14.2%) |
| College/Associate Degree | 977 (84.2%) | 183 (15.8%) |
| Bachelor's Degree or higher | 3,257 (85.0%) | 577 (15.0%) |
Occupancy by Age of Householder in Palm Beach
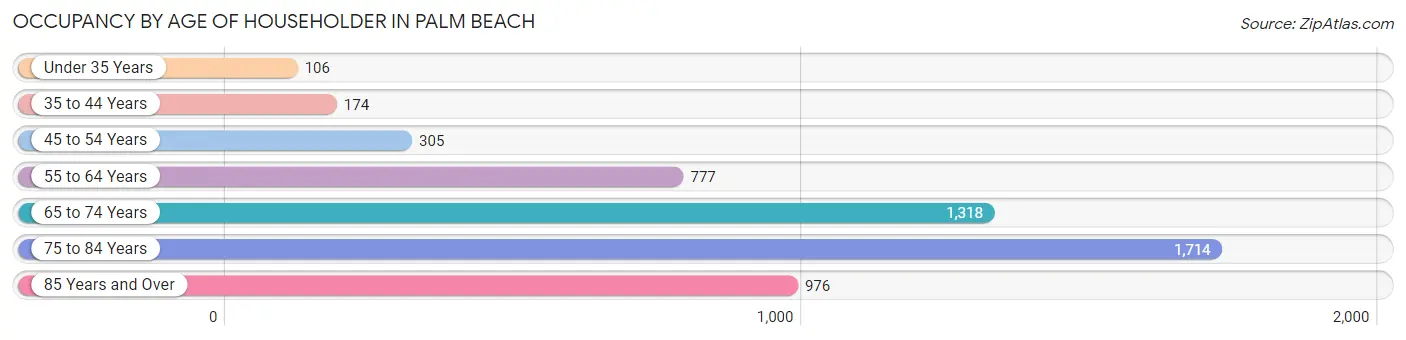
| Age Bracket | # Households | % Households |
| Under 35 Years | 106 | 2.0% |
| 35 to 44 Years | 174 | 3.2% |
| 45 to 54 Years | 305 | 5.7% |
| 55 to 64 Years | 777 | 14.5% |
| 65 to 74 Years | 1,318 | 24.5% |
| 75 to 84 Years | 1,714 | 31.9% |
| 85 Years and Over | 976 | 18.2% |
| Total | 5,370 | 100.0% |
Housing Finances in Palm Beach
Median Income by Occupancy in Palm Beach
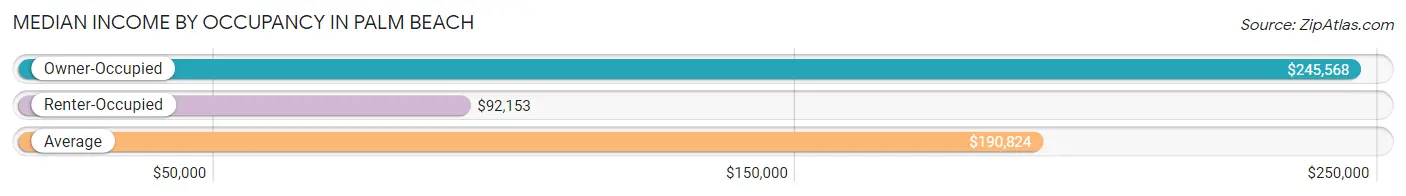
| Occupancy Type | # Households | Median Income |
| Owner-Occupied | 4,519 (84.2%) | $245,568 |
| Renter-Occupied | 851 (15.9%) | $92,153 |
| Average | 5,370 (100.0%) | $190,824 |
Occupancy by Householder Income Bracket in Palm Beach
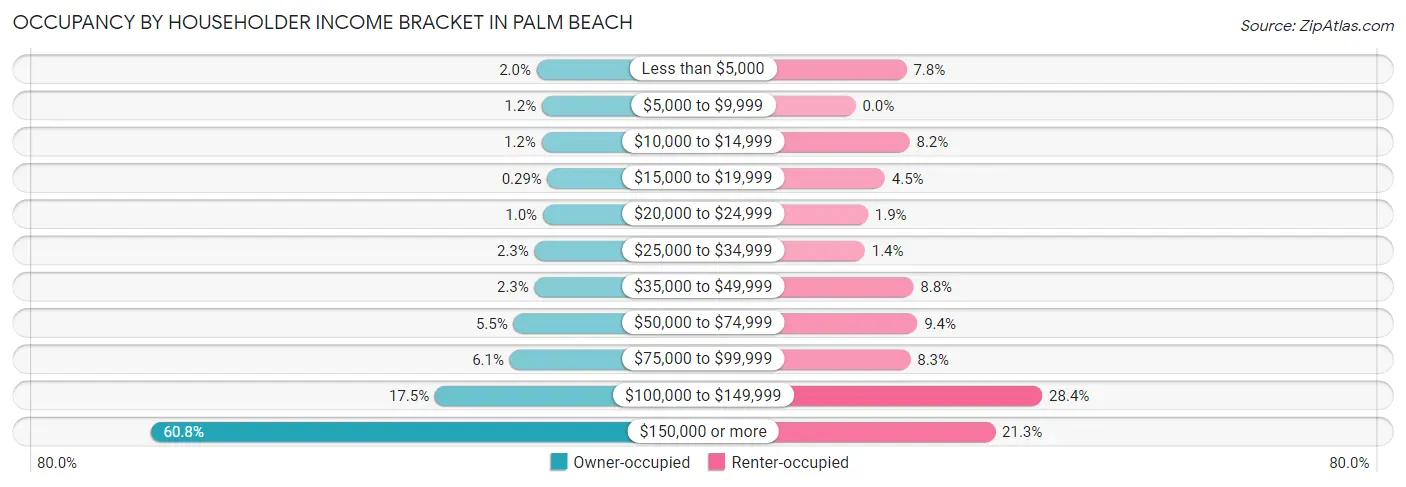
| Income Bracket | Owner-occupied | Renter-occupied |
| Less than $5,000 | 88 (1.9%) | 66 (7.8%) |
| $5,000 to $9,999 | 52 (1.1%) | 0 (0.0%) |
| $10,000 to $14,999 | 55 (1.2%) | 70 (8.2%) |
| $15,000 to $19,999 | 13 (0.3%) | 38 (4.5%) |
| $20,000 to $24,999 | 46 (1.0%) | 16 (1.9%) |
| $25,000 to $34,999 | 103 (2.3%) | 12 (1.4%) |
| $35,000 to $49,999 | 103 (2.3%) | 75 (8.8%) |
| $50,000 to $74,999 | 248 (5.5%) | 80 (9.4%) |
| $75,000 to $99,999 | 274 (6.1%) | 71 (8.3%) |
| $100,000 to $149,999 | 789 (17.5%) | 242 (28.4%) |
| $150,000 or more | 2,748 (60.8%) | 181 (21.3%) |
| Total | 4,519 (100.0%) | 851 (100.0%) |
Monthly Housing Cost Tiers in Palm Beach
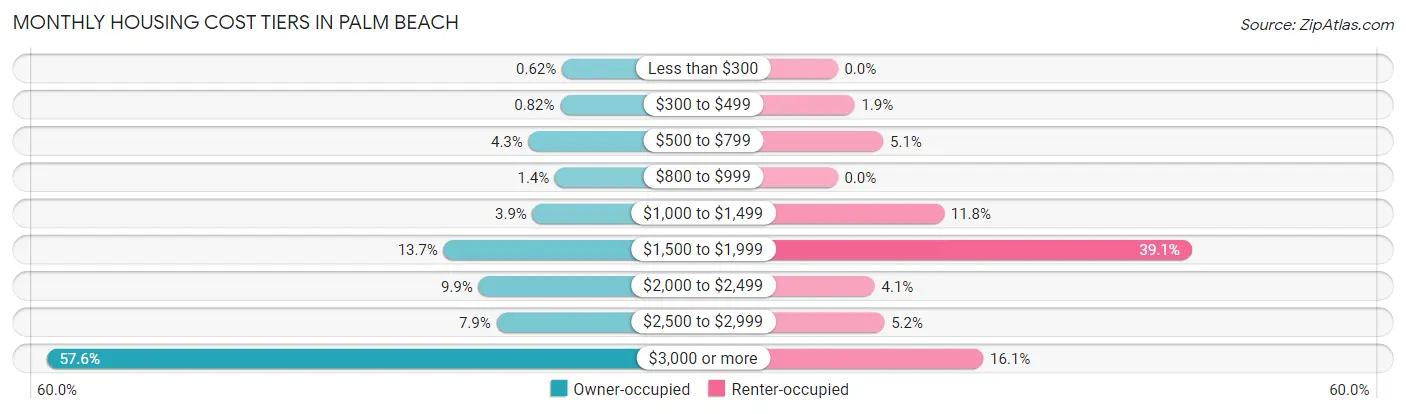
| Monthly Cost | Owner-occupied | Renter-occupied |
| Less than $300 | 28 (0.6%) | 0 (0.0%) |
| $300 to $499 | 37 (0.8%) | 16 (1.9%) |
| $500 to $799 | 195 (4.3%) | 43 (5.1%) |
| $800 to $999 | 63 (1.4%) | 0 (0.0%) |
| $1,000 to $1,499 | 175 (3.9%) | 100 (11.7%) |
| $1,500 to $1,999 | 619 (13.7%) | 333 (39.1%) |
| $2,000 to $2,499 | 445 (9.9%) | 35 (4.1%) |
| $2,500 to $2,999 | 355 (7.9%) | 44 (5.2%) |
| $3,000 or more | 2,602 (57.6%) | 137 (16.1%) |
| Total | 4,519 (100.0%) | 851 (100.0%) |
Physical Housing Characteristics in Palm Beach
Housing Structures in Palm Beach
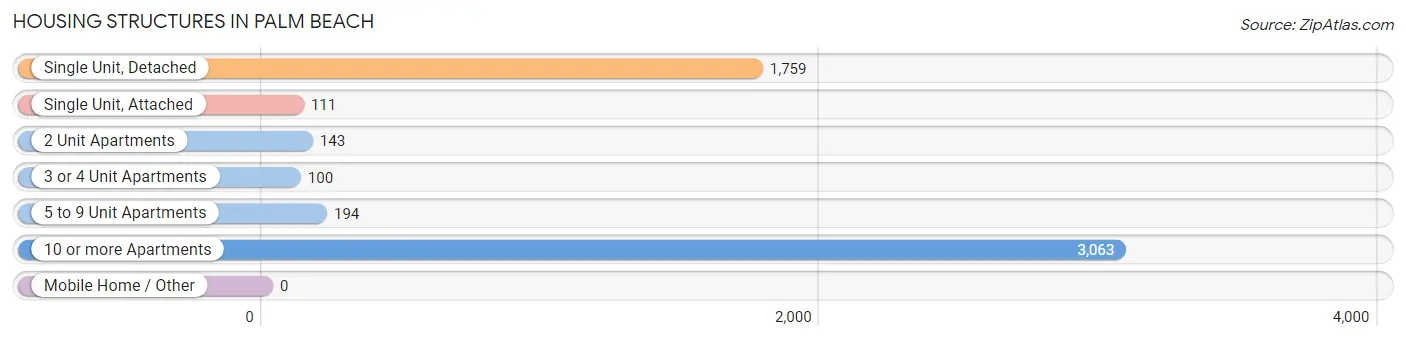
| Structure Type | # Housing Units | % Housing Units |
| Single Unit, Detached | 1,759 | 32.8% |
| Single Unit, Attached | 111 | 2.1% |
| 2 Unit Apartments | 143 | 2.7% |
| 3 or 4 Unit Apartments | 100 | 1.9% |
| 5 to 9 Unit Apartments | 194 | 3.6% |
| 10 or more Apartments | 3,063 | 57.0% |
| Mobile Home / Other | 0 | 0.0% |
| Total | 5,370 | 100.0% |
Housing Structures by Occupancy in Palm Beach
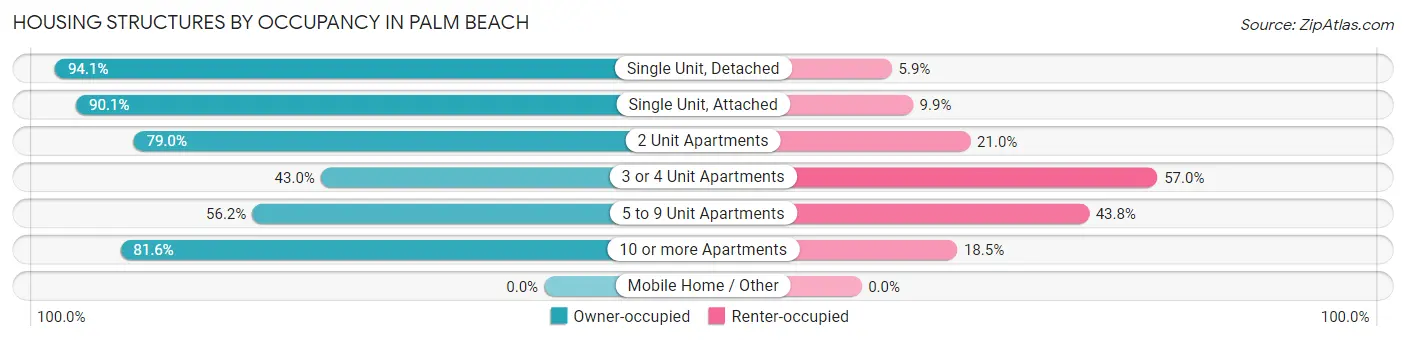
| Structure Type | Owner-occupied | Renter-occupied |
| Single Unit, Detached | 1,656 (94.1%) | 103 (5.9%) |
| Single Unit, Attached | 100 (90.1%) | 11 (9.9%) |
| 2 Unit Apartments | 113 (79.0%) | 30 (21.0%) |
| 3 or 4 Unit Apartments | 43 (43.0%) | 57 (57.0%) |
| 5 to 9 Unit Apartments | 109 (56.2%) | 85 (43.8%) |
| 10 or more Apartments | 2,498 (81.6%) | 565 (18.4%) |
| Mobile Home / Other | 0 (0.0%) | 0 (0.0%) |
| Total | 4,519 (84.2%) | 851 (15.9%) |
Housing Structures by Number of Rooms in Palm Beach
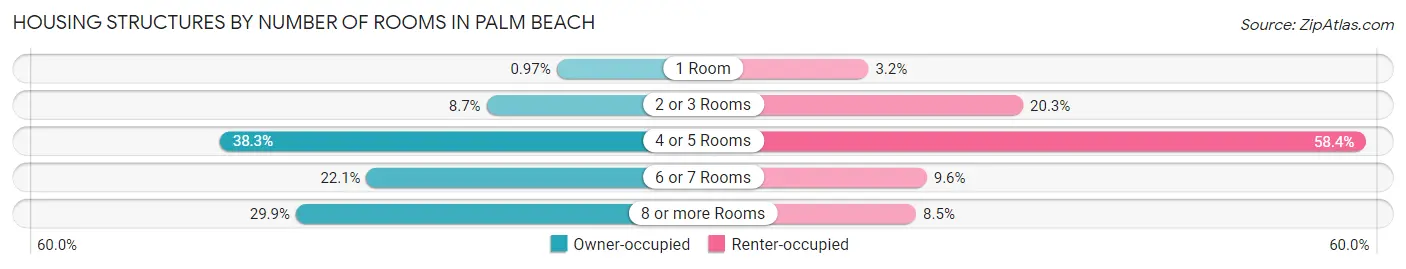
| Number of Rooms | Owner-occupied | Renter-occupied |
| 1 Room | 44 (1.0%) | 27 (3.2%) |
| 2 or 3 Rooms | 395 (8.7%) | 173 (20.3%) |
| 4 or 5 Rooms | 1,732 (38.3%) | 497 (58.4%) |
| 6 or 7 Rooms | 997 (22.1%) | 82 (9.6%) |
| 8 or more Rooms | 1,351 (29.9%) | 72 (8.5%) |
| Total | 4,519 (100.0%) | 851 (100.0%) |
Housing Structure by Heating Type in Palm Beach
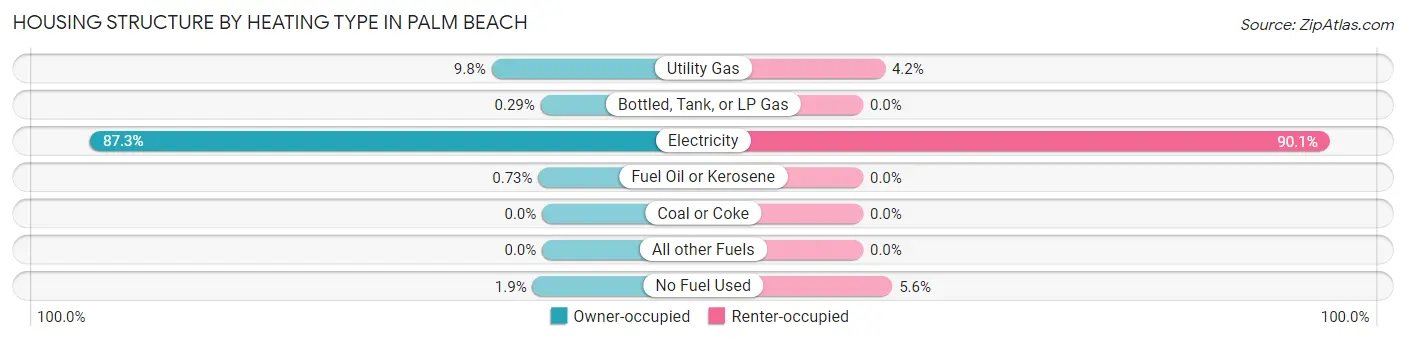
| Heating Type | Owner-occupied | Renter-occupied |
| Utility Gas | 442 (9.8%) | 36 (4.2%) |
| Bottled, Tank, or LP Gas | 13 (0.3%) | 0 (0.0%) |
| Electricity | 3,947 (87.3%) | 767 (90.1%) |
| Fuel Oil or Kerosene | 33 (0.7%) | 0 (0.0%) |
| Coal or Coke | 0 (0.0%) | 0 (0.0%) |
| All other Fuels | 0 (0.0%) | 0 (0.0%) |
| No Fuel Used | 84 (1.9%) | 48 (5.6%) |
| Total | 4,519 (100.0%) | 851 (100.0%) |
Household Vehicle Usage in Palm Beach
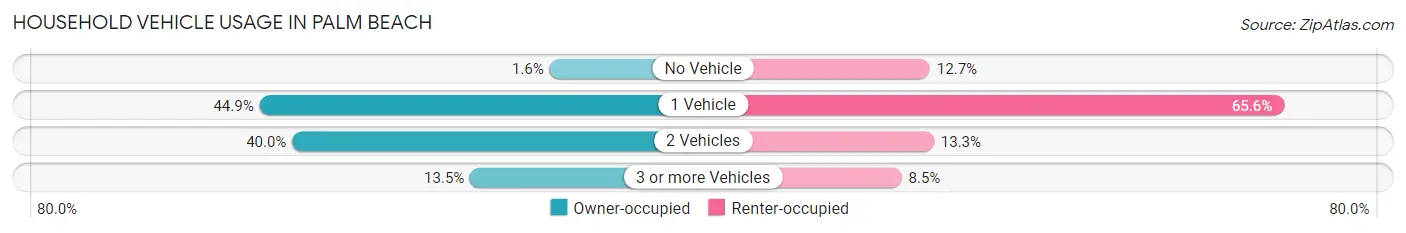
| Vehicles per Household | Owner-occupied | Renter-occupied |
| No Vehicle | 72 (1.6%) | 108 (12.7%) |
| 1 Vehicle | 2,030 (44.9%) | 558 (65.6%) |
| 2 Vehicles | 1,809 (40.0%) | 113 (13.3%) |
| 3 or more Vehicles | 608 (13.5%) | 72 (8.5%) |
| Total | 4,519 (100.0%) | 851 (100.0%) |
Real Estate & Mortgages in Palm Beach
Real Estate and Mortgage Overview in Palm Beach
| Characteristic | Without Mortgage | With Mortgage |
| Housing Units | 3,450 | 1,069 |
| Median Property Value | $1,596,500 | $2,000,001 |
| Median Household Income | $212,000 | $782 |
| Monthly Housing Costs | $1,501 | $958 |
| Real Estate Taxes | $10,001 | $0 |
Property Value by Mortgage Status in Palm Beach
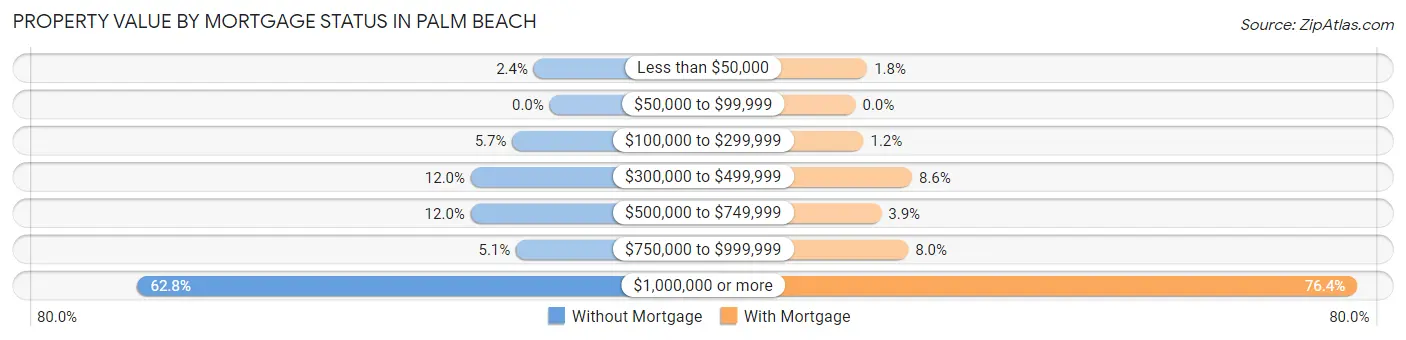
| Property Value | Without Mortgage | With Mortgage |
| Less than $50,000 | 83 (2.4%) | 19 (1.8%) |
| $50,000 to $99,999 | 0 (0.0%) | 0 (0.0%) |
| $100,000 to $299,999 | 196 (5.7%) | 13 (1.2%) |
| $300,000 to $499,999 | 414 (12.0%) | 92 (8.6%) |
| $500,000 to $749,999 | 415 (12.0%) | 42 (3.9%) |
| $750,000 to $999,999 | 176 (5.1%) | 86 (8.0%) |
| $1,000,000 or more | 2,166 (62.8%) | 817 (76.4%) |
| Total | 3,450 (100.0%) | 1,069 (100.0%) |
Household Income by Mortgage Status in Palm Beach
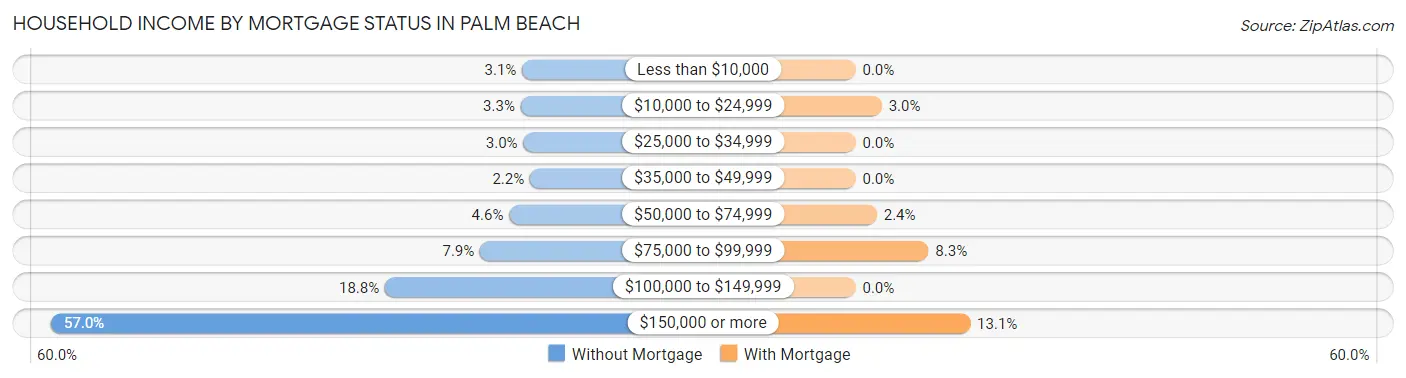
| Household Income | Without Mortgage | With Mortgage |
| Less than $10,000 | 108 (3.1%) | 0 (0.0%) |
| $10,000 to $24,999 | 114 (3.3%) | 32 (3.0%) |
| $25,000 to $34,999 | 103 (3.0%) | 0 (0.0%) |
| $35,000 to $49,999 | 77 (2.2%) | 0 (0.0%) |
| $50,000 to $74,999 | 159 (4.6%) | 26 (2.4%) |
| $75,000 to $99,999 | 274 (7.9%) | 89 (8.3%) |
| $100,000 to $149,999 | 649 (18.8%) | 0 (0.0%) |
| $150,000 or more | 1,966 (57.0%) | 140 (13.1%) |
| Total | 3,450 (100.0%) | 1,069 (100.0%) |
Property Value to Household Income Ratio in Palm Beach
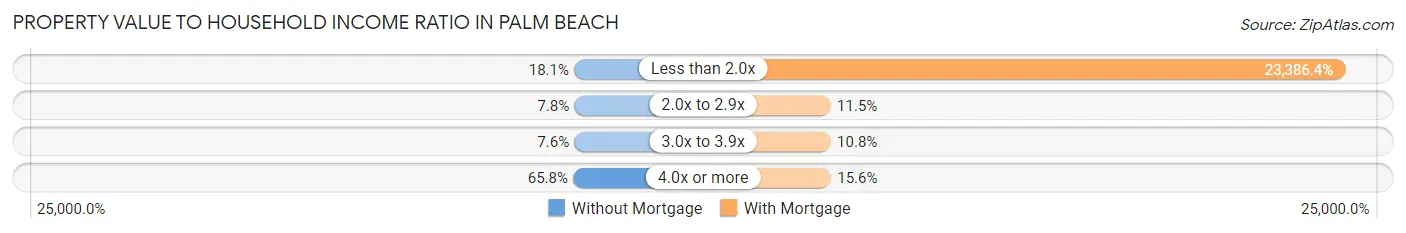
| Value-to-Income Ratio | Without Mortgage | With Mortgage |
| Less than 2.0x | 625 (18.1%) | 250,001 (23,386.4%) |
| 2.0x to 2.9x | 269 (7.8%) | 123 (11.5%) |
| 3.0x to 3.9x | 262 (7.6%) | 115 (10.8%) |
| 4.0x or more | 2,271 (65.8%) | 167 (15.6%) |
| Total | 3,450 (100.0%) | 1,069 (100.0%) |
Real Estate Taxes by Mortgage Status in Palm Beach
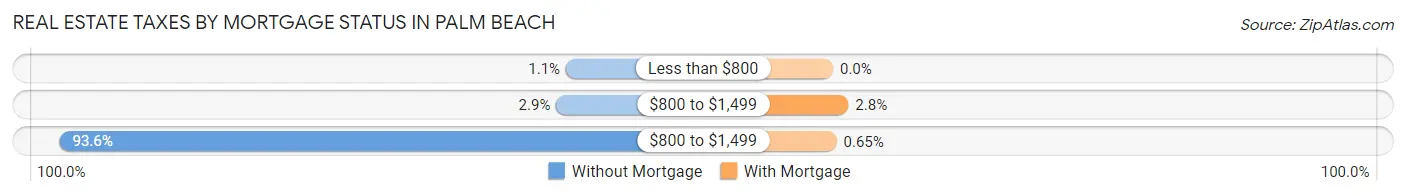
| Property Taxes | Without Mortgage | With Mortgage |
| Less than $800 | 39 (1.1%) | 0 (0.0%) |
| $800 to $1,499 | 100 (2.9%) | 30 (2.8%) |
| $800 to $1,499 | 3,230 (93.6%) | 7 (0.6%) |
| Total | 3,450 (100.0%) | 1,069 (100.0%) |
Health & Disability in Palm Beach
Health Insurance Coverage by Age in Palm Beach
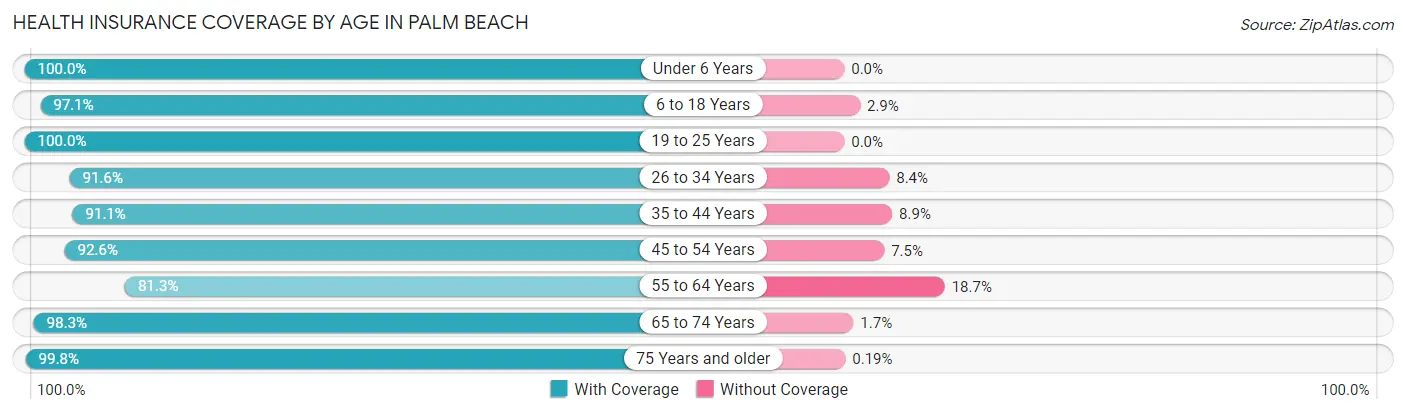
| Age Bracket | With Coverage | Without Coverage |
| Under 6 Years | 143 (100.0%) | 0 (0.0%) |
| 6 to 18 Years | 365 (97.1%) | 11 (2.9%) |
| 19 to 25 Years | 150 (100.0%) | 0 (0.0%) |
| 26 to 34 Years | 131 (91.6%) | 12 (8.4%) |
| 35 to 44 Years | 286 (91.1%) | 28 (8.9%) |
| 45 to 54 Years | 534 (92.5%) | 43 (7.4%) |
| 55 to 64 Years | 1,319 (81.3%) | 304 (18.7%) |
| 65 to 74 Years | 2,086 (98.3%) | 36 (1.7%) |
| 75 Years and older | 3,750 (99.8%) | 7 (0.2%) |
| Total | 8,764 (95.2%) | 441 (4.8%) |
Health Insurance Coverage by Citizenship Status in Palm Beach
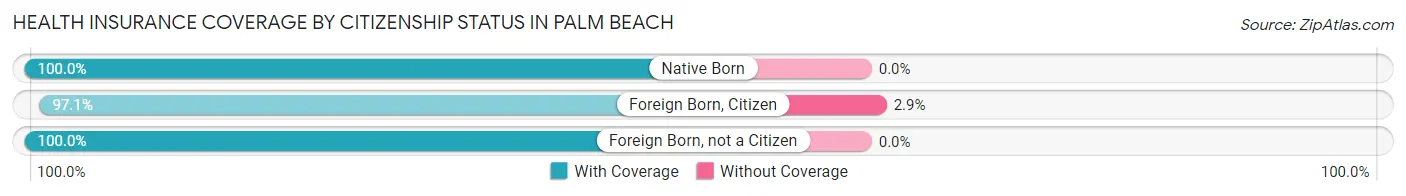
| Citizenship Status | With Coverage | Without Coverage |
| Native Born | 143 (100.0%) | 0 (0.0%) |
| Foreign Born, Citizen | 365 (97.1%) | 11 (2.9%) |
| Foreign Born, not a Citizen | 150 (100.0%) | 0 (0.0%) |
Health Insurance Coverage by Household Income in Palm Beach
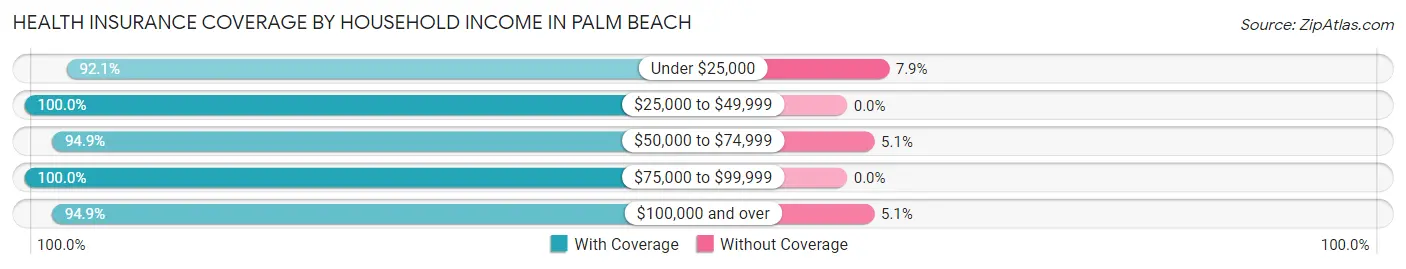
| Household Income | With Coverage | Without Coverage |
| Under $25,000 | 480 (92.1%) | 41 (7.9%) |
| $25,000 to $49,999 | 389 (100.0%) | 0 (0.0%) |
| $50,000 to $74,999 | 592 (94.9%) | 32 (5.1%) |
| $75,000 to $99,999 | 478 (100.0%) | 0 (0.0%) |
| $100,000 and over | 6,825 (94.9%) | 367 (5.1%) |
Public vs Private Health Insurance Coverage by Age in Palm Beach
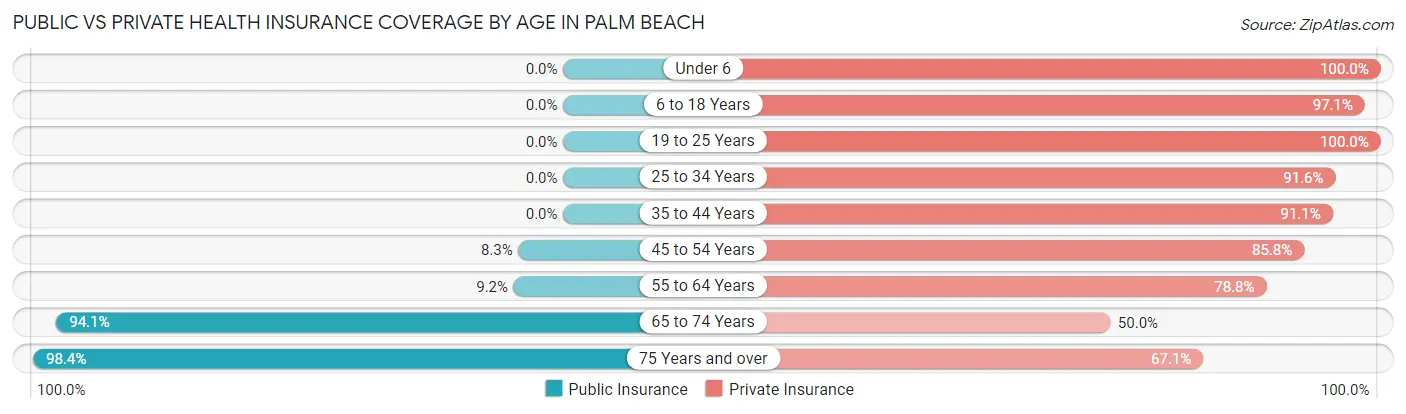
| Age Bracket | Public Insurance | Private Insurance |
| Under 6 | 0 (0.0%) | 143 (100.0%) |
| 6 to 18 Years | 0 (0.0%) | 365 (97.1%) |
| 19 to 25 Years | 0 (0.0%) | 150 (100.0%) |
| 25 to 34 Years | 0 (0.0%) | 131 (91.6%) |
| 35 to 44 Years | 0 (0.0%) | 286 (91.1%) |
| 45 to 54 Years | 48 (8.3%) | 495 (85.8%) |
| 55 to 64 Years | 149 (9.2%) | 1,279 (78.8%) |
| 65 to 74 Years | 1,997 (94.1%) | 1,060 (49.9%) |
| 75 Years and over | 3,698 (98.4%) | 2,520 (67.1%) |
| Total | 5,892 (64.0%) | 6,429 (69.8%) |
Disability Status by Sex by Age in Palm Beach
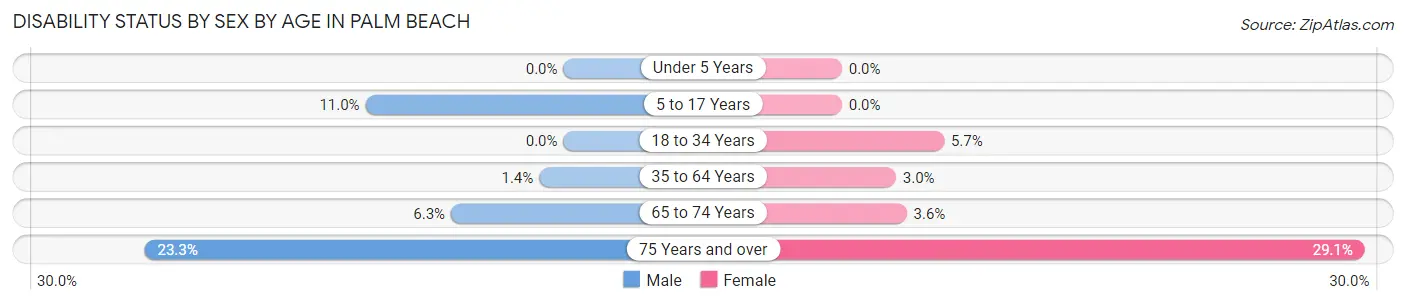
| Age Bracket | Male | Female |
| Under 5 Years | 0 (0.0%) | 0 (0.0%) |
| 5 to 17 Years | 27 (11.0%) | 0 (0.0%) |
| 18 to 34 Years | 0 (0.0%) | 7 (5.7%) |
| 35 to 64 Years | 16 (1.3%) | 40 (3.0%) |
| 65 to 74 Years | 53 (6.3%) | 46 (3.6%) |
| 75 Years and over | 402 (23.3%) | 592 (29.1%) |
Disability Class by Sex by Age in Palm Beach
Disability Class: Hearing Difficulty
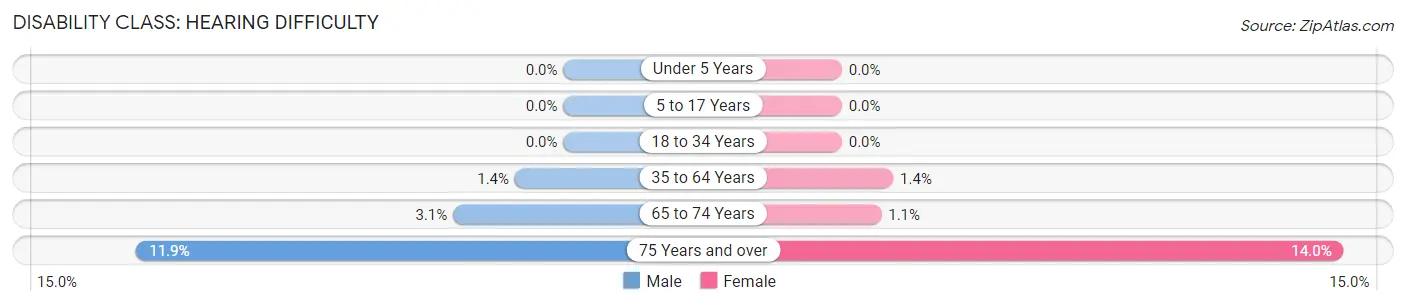
| Age Bracket | Male | Female |
| Under 5 Years | 0 (0.0%) | 0 (0.0%) |
| 5 to 17 Years | 0 (0.0%) | 0 (0.0%) |
| 18 to 34 Years | 0 (0.0%) | 0 (0.0%) |
| 35 to 64 Years | 16 (1.3%) | 19 (1.4%) |
| 65 to 74 Years | 26 (3.1%) | 14 (1.1%) |
| 75 Years and over | 205 (11.9%) | 284 (14.0%) |
Disability Class: Vision Difficulty
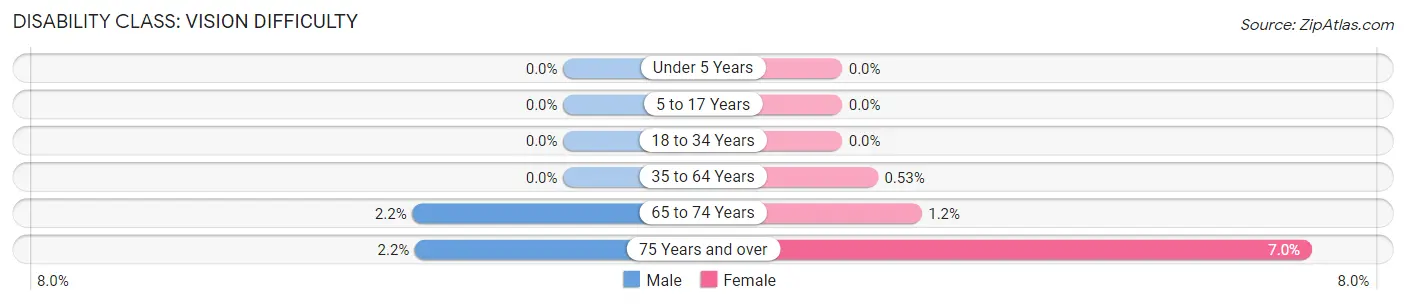
| Age Bracket | Male | Female |
| Under 5 Years | 0 (0.0%) | 0 (0.0%) |
| 5 to 17 Years | 0 (0.0%) | 0 (0.0%) |
| 18 to 34 Years | 0 (0.0%) | 0 (0.0%) |
| 35 to 64 Years | 0 (0.0%) | 7 (0.5%) |
| 65 to 74 Years | 19 (2.2%) | 15 (1.2%) |
| 75 Years and over | 38 (2.2%) | 142 (7.0%) |
Disability Class: Cognitive Difficulty
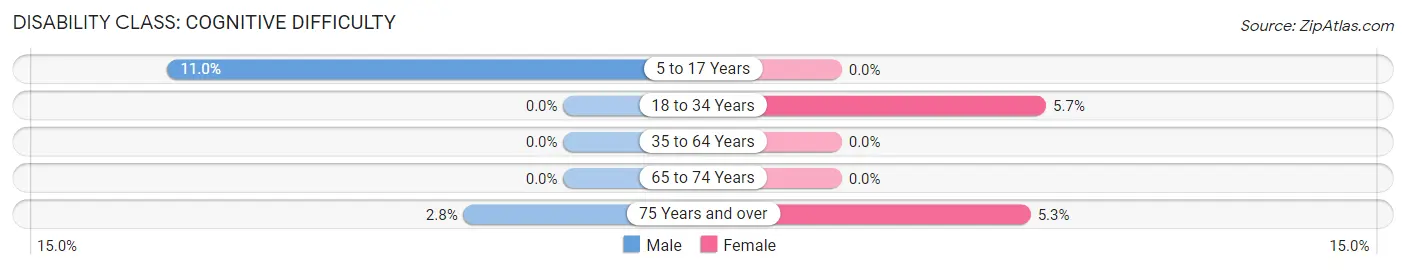
| Age Bracket | Male | Female |
| 5 to 17 Years | 27 (11.0%) | 0 (0.0%) |
| 18 to 34 Years | 0 (0.0%) | 7 (5.7%) |
| 35 to 64 Years | 0 (0.0%) | 0 (0.0%) |
| 65 to 74 Years | 0 (0.0%) | 0 (0.0%) |
| 75 Years and over | 48 (2.8%) | 107 (5.3%) |
Disability Class: Ambulatory Difficulty
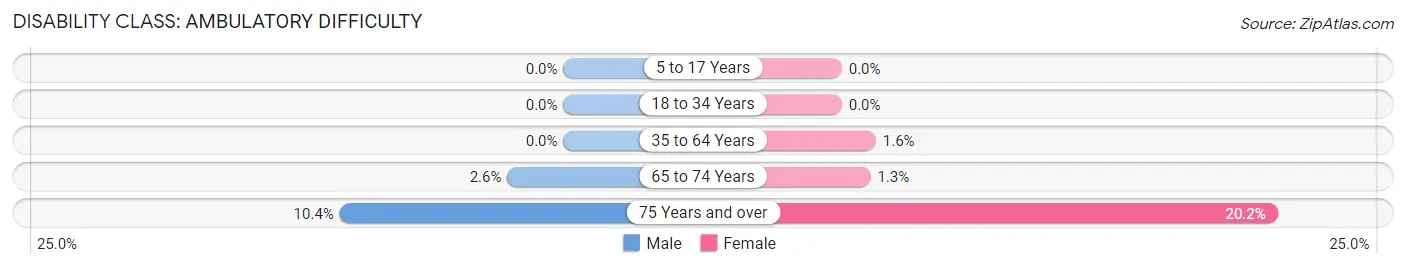
| Age Bracket | Male | Female |
| 5 to 17 Years | 0 (0.0%) | 0 (0.0%) |
| 18 to 34 Years | 0 (0.0%) | 0 (0.0%) |
| 35 to 64 Years | 0 (0.0%) | 21 (1.6%) |
| 65 to 74 Years | 22 (2.6%) | 17 (1.3%) |
| 75 Years and over | 179 (10.4%) | 411 (20.2%) |
Disability Class: Self-Care Difficulty
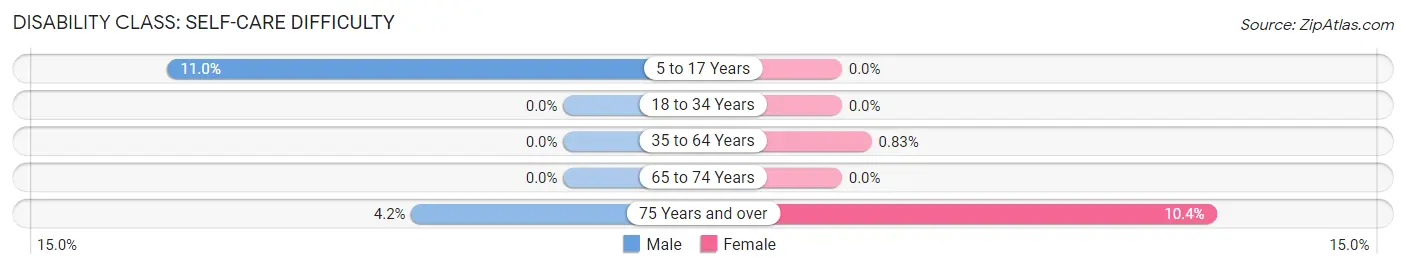
| Age Bracket | Male | Female |
| 5 to 17 Years | 27 (11.0%) | 0 (0.0%) |
| 18 to 34 Years | 0 (0.0%) | 0 (0.0%) |
| 35 to 64 Years | 0 (0.0%) | 11 (0.8%) |
| 65 to 74 Years | 0 (0.0%) | 0 (0.0%) |
| 75 Years and over | 73 (4.2%) | 212 (10.4%) |
Technology Access in Palm Beach
Computing Device Access in Palm Beach
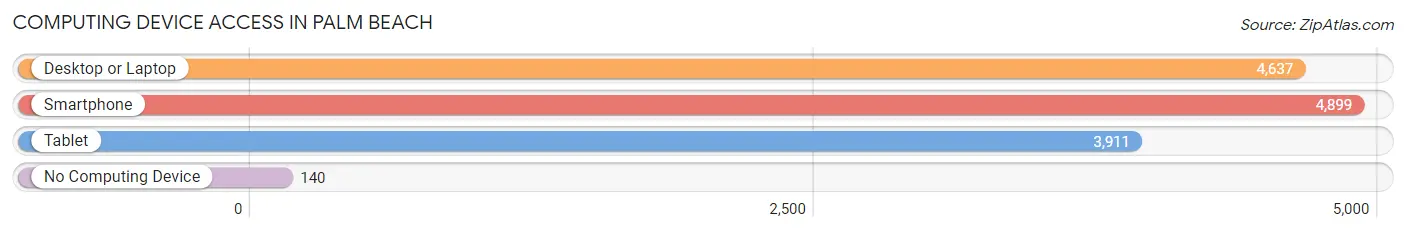
| Device Type | # Households | % Households |
| Desktop or Laptop | 4,637 | 86.4% |
| Smartphone | 4,899 | 91.2% |
| Tablet | 3,911 | 72.8% |
| No Computing Device | 140 | 2.6% |
| Total | 5,370 | 100.0% |
Internet Access in Palm Beach
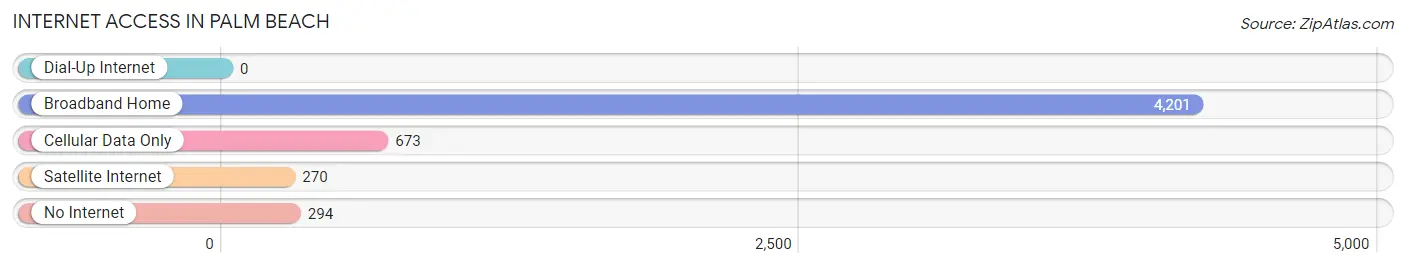
| Internet Type | # Households | % Households |
| Dial-Up Internet | 0 | 0.0% |
| Broadband Home | 4,201 | 78.2% |
| Cellular Data Only | 673 | 12.5% |
| Satellite Internet | 270 | 5.0% |
| No Internet | 294 | 5.5% |
| Total | 5,370 | 100.0% |
Palm Beach Summary
Palm Beach is a town located in Palm Beach County, Florida, United States. It is situated on the eastern coast of the state, along the Atlantic Ocean. The town is known for its luxurious lifestyle, beautiful beaches, and high-end shopping. It is also home to some of the wealthiest people in the United States.
Geography
Palm Beach is located on the eastern coast of Florida, along the Atlantic Ocean. It is bordered by the cities of West Palm Beach and Lake Worth to the north, and by the cities of Boca Raton and Delray Beach to the south. The town is situated on a barrier island, which is separated from the mainland by the Intracoastal Waterway. The town is approximately 16 miles long and 1.5 miles wide.
The town is known for its beautiful beaches, which are lined with white sand and crystal clear waters. The beaches are popular for swimming, sunbathing, and other recreational activities. The town also has several parks, including the John D. MacArthur Beach State Park, which is located on the northern end of the island.
Economy
Palm Beach is known for its luxurious lifestyle and high-end shopping. The town is home to some of the wealthiest people in the United States, and it is a popular destination for tourists from around the world. The town is also home to several large corporations, including the Breakers Hotel, the Flagler Museum, and the Palm Beach Zoo.
The town's economy is largely driven by tourism, with visitors coming to the area to enjoy the beaches, shopping, and other attractions. The town also has a thriving real estate market, with many luxury homes and condos being sold in the area.
Demographics
As of the 2010 census, the population of Palm Beach was 8,348. The racial makeup of the town was 94.3% White, 2.2% African American, 0.3% Native American, 1.2% Asian, 0.1% Pacific Islander, 0.7% from other races, and 1.3% from two or more races. Hispanic or Latino of any race were 4.2% of the population.
The median income for a household in the town was $87,811, and the median income for a family was $103,945. The per capita income for the town was $64,945. About 4.3% of families and 6.2% of the population were below the poverty line, including 8.2% of those under age 18 and 4.2% of those age 65 or over.
Conclusion
Palm Beach is a town located in Palm Beach County, Florida, United States. It is situated on the eastern coast of the state, along the Atlantic Ocean. The town is known for its luxurious lifestyle, beautiful beaches, and high-end shopping. It is also home to some of the wealthiest people in the United States. The town's economy is largely driven by tourism, with visitors coming to the area to enjoy the beaches, shopping, and other attractions. As of the 2010 census, the population of Palm Beach was 8,348. The racial makeup of the town was 94.3% White, 2.2% African American, 0.3% Native American, 1.2% Asian, 0.1% Pacific Islander, 0.7% from other races, and 1.3% from two or more races. The median income for a household in the town was $87,811, and the median income for a family was $103,945.
Common Questions
What is Per Capita Income in Palm Beach?
Per Capita income in Palm Beach is $215,141.
What is the Median Family Income in Palm Beach?
Median Family Income in Palm Beach is $222,727.
What is the Median Household income in Palm Beach?
Median Household Income in Palm Beach is $190,824.
What is Income or Wage Gap in Palm Beach?
Income or Wage Gap in Palm Beach is 44.3%.
Women in Palm Beach earn 55.7 cents for every dollar earned by a man.
What is Inequality or Gini Index in Palm Beach?
Inequality or Gini Index in Palm Beach is 0.57.
What is the Total Population of Palm Beach?
Total Population of Palm Beach is 9,205.
What is the Total Male Population of Palm Beach?
Total Male Population of Palm Beach is 4,239.
What is the Total Female Population of Palm Beach?
Total Female Population of Palm Beach is 4,966.
What is the Ratio of Males per 100 Females in Palm Beach?
There are 85.36 Males per 100 Females in Palm Beach.
What is the Ratio of Females per 100 Males in Palm Beach?
There are 117.15 Females per 100 Males in Palm Beach.
What is the Median Population Age in Palm Beach?
Median Population Age in Palm Beach is 70.7 Years.
What is the Average Family Size in Palm Beach
Average Family Size in Palm Beach is 2.2 People.
What is the Average Household Size in Palm Beach
Average Household Size in Palm Beach is 1.7 People.
How Large is the Labor Force in Palm Beach?
There are 2,728 People in the Labor Forcein in Palm Beach.
What is the Percentage of People in the Labor Force in Palm Beach?
31.3% of People are in the Labor Force in Palm Beach.
What is the Unemployment Rate in Palm Beach?
Unemployment Rate in Palm Beach is 5.6%.