Haverhill, FL Map & Demographics
Haverhill Map
Haverhill Overview
$30,640
PER CAPITA INCOME
$72,188
AVG FAMILY INCOME
$73,636
AVG HOUSEHOLD INCOME
22.5%
WAGE / INCOME GAP [ % ]
77.5¢/ $1
WAGE / INCOME GAP [ $ ]
0.39
INEQUALITY / GINI INDEX
2,859
TOTAL POPULATION
1,353
MALE POPULATION
1,506
FEMALE POPULATION
89.84
MALES / 100 FEMALES
111.31
FEMALES / 100 MALES
37.2
MEDIAN AGE
3.7
AVG FAMILY SIZE
3.4
AVG HOUSEHOLD SIZE
1,503
LABOR FORCE [ PEOPLE ]
71.8%
PERCENT IN LABOR FORCE
4.7%
UNEMPLOYMENT RATE
Haverhill Area Codes
Income in Haverhill
Income Overview in Haverhill
Per Capita Income in Haverhill is $30,640, while median incomes of families and households are $72,188 and $73,636 respectively.
| Characteristic | Number | Measure |
| Per Capita Income | 2,859 | $30,640 |
| Median Family Income | 678 | $72,188 |
| Mean Family Income | 678 | $99,357 |
| Median Household Income | 826 | $73,636 |
| Mean Household Income | 826 | $100,827 |
| Income Deficit | 678 | $0 |
| Wage / Income Gap (%) | 2,859 | 22.52% |
| Wage / Income Gap ($) | 2,859 | 77.48¢ per $1 |
| Gini / Inequality Index | 2,859 | 0.39 |
Earnings by Sex in Haverhill
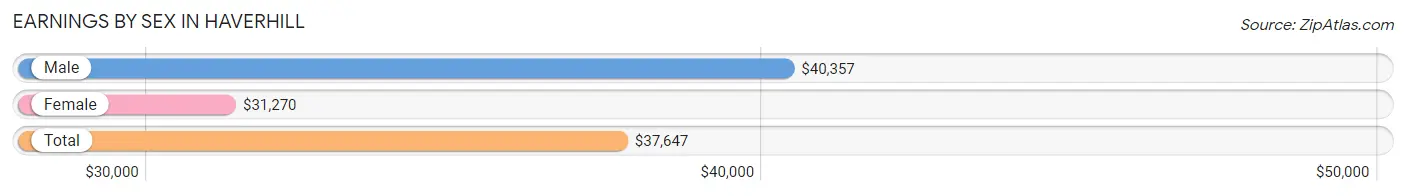
Average Earnings in Haverhill are $37,647, $40,357 for men and $31,270 for women, a difference of 22.5%.
| Sex | Number | Average Earnings |
| Male | 800 (50.6%) | $40,357 |
| Female | 782 (49.4%) | $31,270 |
| Total | 1,582 (100.0%) | $37,647 |
Earnings by Sex by Income Bracket in Haverhill
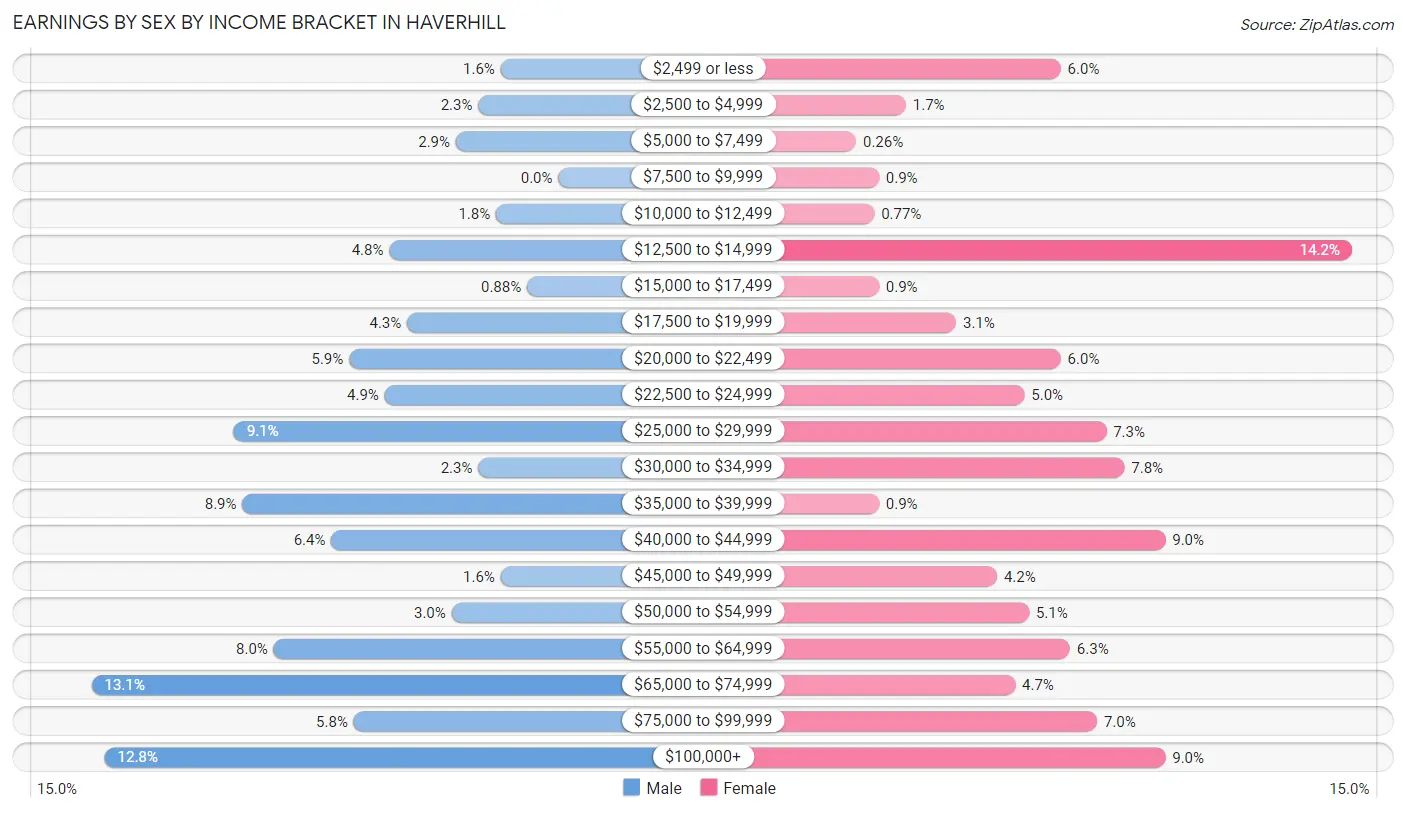
The most common earnings brackets in Haverhill are $65,000 to $74,999 for men (105 | 13.1%) and $12,500 to $14,999 for women (111 | 14.2%).
| Income | Male | Female |
| $2,499 or less | 13 (1.6%) | 47 (6.0%) |
| $2,500 to $4,999 | 18 (2.2%) | 13 (1.7%) |
| $5,000 to $7,499 | 23 (2.9%) | 2 (0.3%) |
| $7,500 to $9,999 | 0 (0.0%) | 7 (0.9%) |
| $10,000 to $12,499 | 14 (1.8%) | 6 (0.8%) |
| $12,500 to $14,999 | 38 (4.8%) | 111 (14.2%) |
| $15,000 to $17,499 | 7 (0.9%) | 7 (0.9%) |
| $17,500 to $19,999 | 34 (4.3%) | 24 (3.1%) |
| $20,000 to $22,499 | 47 (5.9%) | 47 (6.0%) |
| $22,500 to $24,999 | 39 (4.9%) | 39 (5.0%) |
| $25,000 to $29,999 | 73 (9.1%) | 57 (7.3%) |
| $30,000 to $34,999 | 18 (2.2%) | 61 (7.8%) |
| $35,000 to $39,999 | 71 (8.9%) | 7 (0.9%) |
| $40,000 to $44,999 | 51 (6.4%) | 70 (8.9%) |
| $45,000 to $49,999 | 13 (1.6%) | 33 (4.2%) |
| $50,000 to $54,999 | 24 (3.0%) | 40 (5.1%) |
| $55,000 to $64,999 | 64 (8.0%) | 49 (6.3%) |
| $65,000 to $74,999 | 105 (13.1%) | 37 (4.7%) |
| $75,000 to $99,999 | 46 (5.8%) | 55 (7.0%) |
| $100,000+ | 102 (12.8%) | 70 (8.9%) |
| Total | 800 (100.0%) | 782 (100.0%) |
Earnings by Sex by Educational Attainment in Haverhill
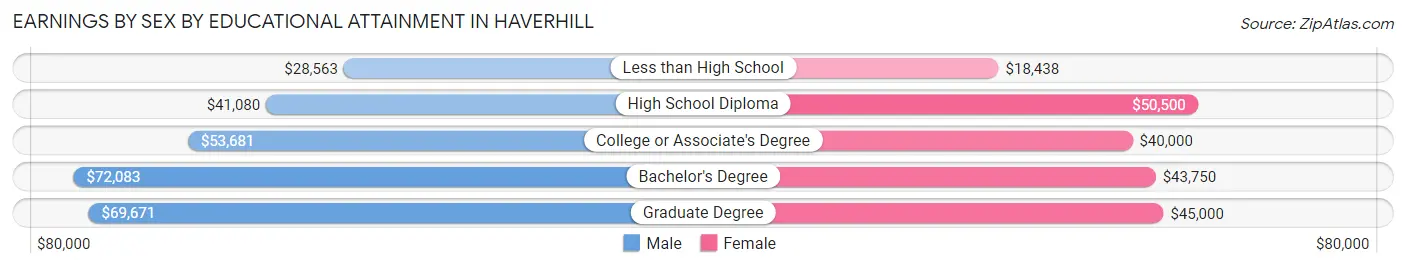
Average earnings in Haverhill are $42,179 for men and $40,393 for women, a difference of 4.2%. Men with an educational attainment of bachelor's degree enjoy the highest average annual earnings of $72,083, while those with less than high school education earn the least with $28,563. Women with an educational attainment of high school diploma earn the most with the average annual earnings of $50,500, while those with less than high school education have the smallest earnings of $18,438.
| Educational Attainment | Male Income | Female Income |
| Less than High School | $28,563 | $18,438 |
| High School Diploma | $41,080 | $50,500 |
| College or Associate's Degree | $53,681 | $40,000 |
| Bachelor's Degree | $72,083 | $43,750 |
| Graduate Degree | $69,671 | $45,000 |
| Total | $42,179 | $40,393 |
Family Income in Haverhill
Family Income Brackets in Haverhill
According to the Haverhill family income data, there are 177 families falling into the $50,000 to $74,999 income range, which is the most common income bracket and makes up 26.1% of all families. Conversely, the $10,000 to $14,999 income bracket is the least frequent group with only 15 families (2.2%) belonging to this category.
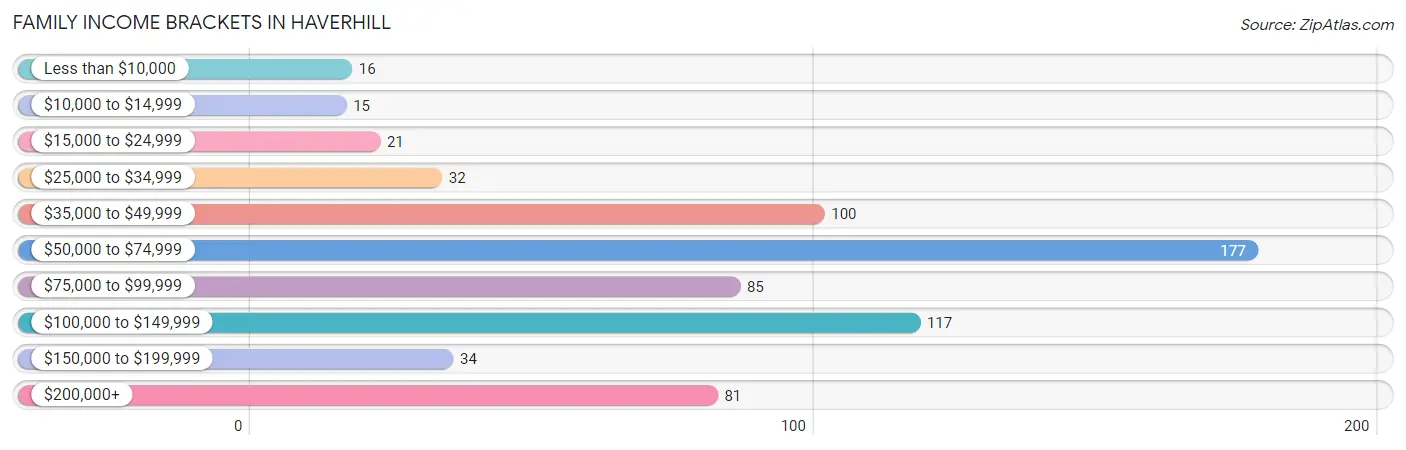
| Income Bracket | # Families | % Families |
| Less than $10,000 | 16 | 2.4% |
| $10,000 to $14,999 | 15 | 2.2% |
| $15,000 to $24,999 | 21 | 3.1% |
| $25,000 to $34,999 | 32 | 4.7% |
| $35,000 to $49,999 | 100 | 14.7% |
| $50,000 to $74,999 | 177 | 26.1% |
| $75,000 to $99,999 | 85 | 12.5% |
| $100,000 to $149,999 | 117 | 17.3% |
| $150,000 to $199,999 | 34 | 5.0% |
| $200,000+ | 81 | 11.9% |
Family Income by Famaliy Size in Haverhill
2-person families (237 | 35.0%) account for the highest median family income in Haverhill with $72,422 per family, while 2-person families (237 | 35.0%) have the highest median income of $36,211 per family member.
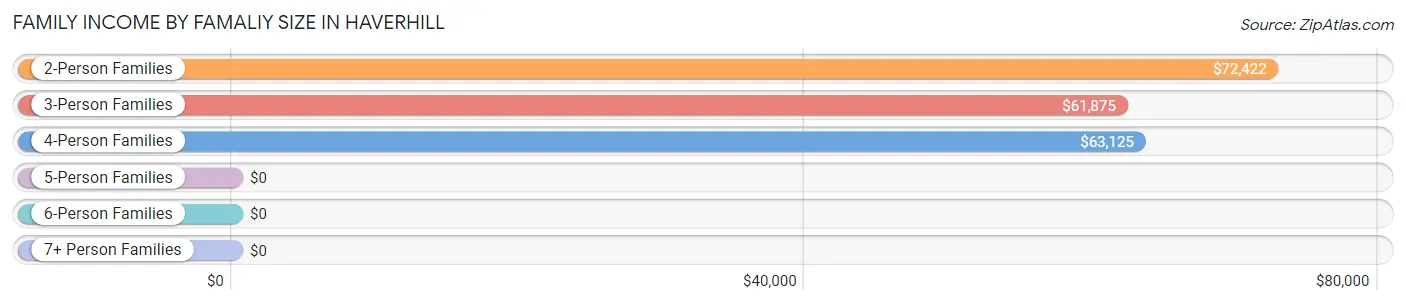
| Income Bracket | # Families | Median Income |
| 2-Person Families | 237 (35.0%) | $72,422 |
| 3-Person Families | 127 (18.7%) | $61,875 |
| 4-Person Families | 168 (24.8%) | $63,125 |
| 5-Person Families | 67 (9.9%) | $0 |
| 6-Person Families | 59 (8.7%) | $0 |
| 7+ Person Families | 20 (2.9%) | $0 |
| Total | 678 (100.0%) | $72,188 |
Family Income by Number of Earners in Haverhill
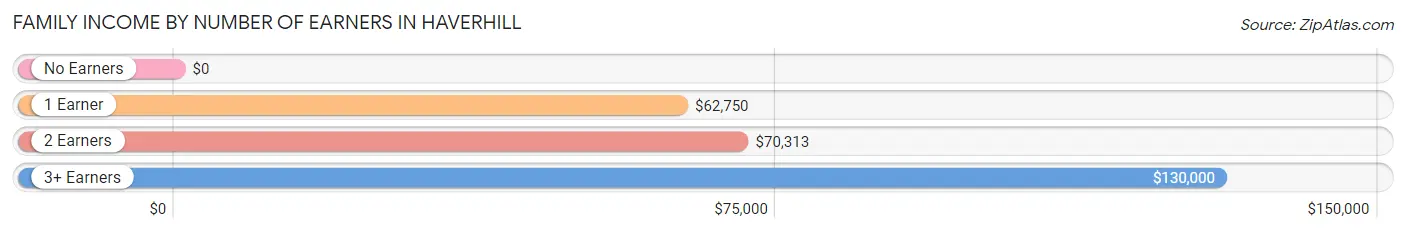
| Number of Earners | # Families | Median Income |
| No Earners | 35 (5.2%) | $0 |
| 1 Earner | 186 (27.4%) | $62,750 |
| 2 Earners | 325 (47.9%) | $70,313 |
| 3+ Earners | 132 (19.5%) | $130,000 |
| Total | 678 (100.0%) | $72,188 |
Household Income in Haverhill
Household Income Brackets in Haverhill
With 191 households falling in the category, the $50,000 to $74,999 income range is the most frequent in Haverhill, accounting for 23.1% of all households. In contrast, only 5 households (0.6%) fall into the less than $10,000 income bracket, making it the least populous group.
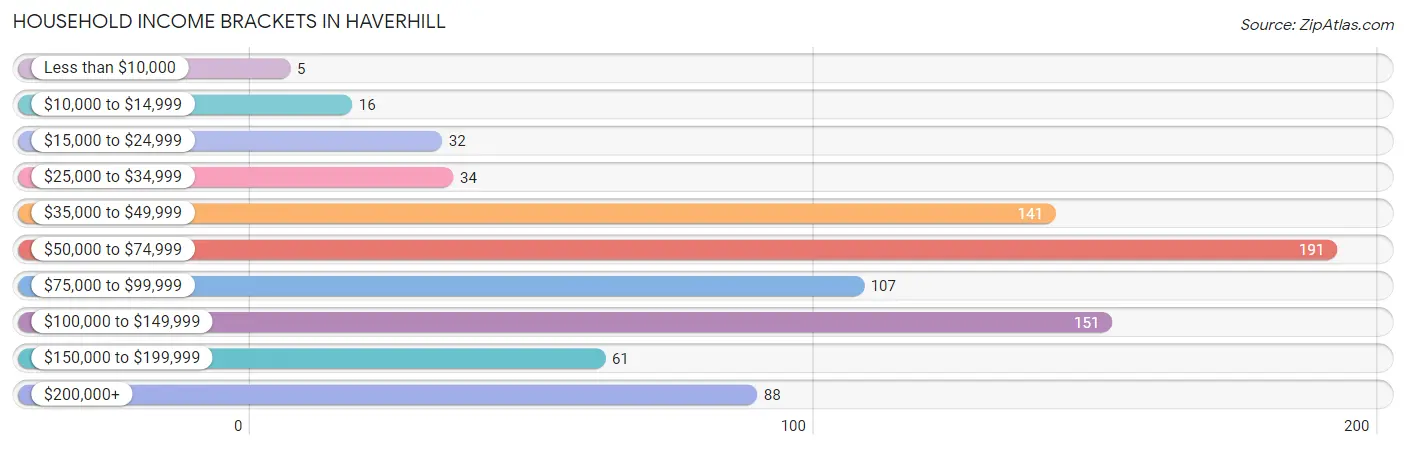
| Income Bracket | # Households | % Households |
| Less than $10,000 | 5 | 0.6% |
| $10,000 to $14,999 | 16 | 1.9% |
| $15,000 to $24,999 | 32 | 3.9% |
| $25,000 to $34,999 | 34 | 4.1% |
| $35,000 to $49,999 | 141 | 17.1% |
| $50,000 to $74,999 | 191 | 23.1% |
| $75,000 to $99,999 | 107 | 13.0% |
| $100,000 to $149,999 | 151 | 18.3% |
| $150,000 to $199,999 | 61 | 7.4% |
| $200,000+ | 88 | 10.7% |
Household Income by Householder Age in Haverhill
The median household income in Haverhill is $73,636, with the highest median household income of $89,044 found in the 45 to 64 years age bracket for the primary householder. A total of 461 households (55.8%) fall into this category. Meanwhile, the 15 to 24 years age bracket for the primary householder has the lowest median household income of $0, with 7 households (0.9%) in this group.
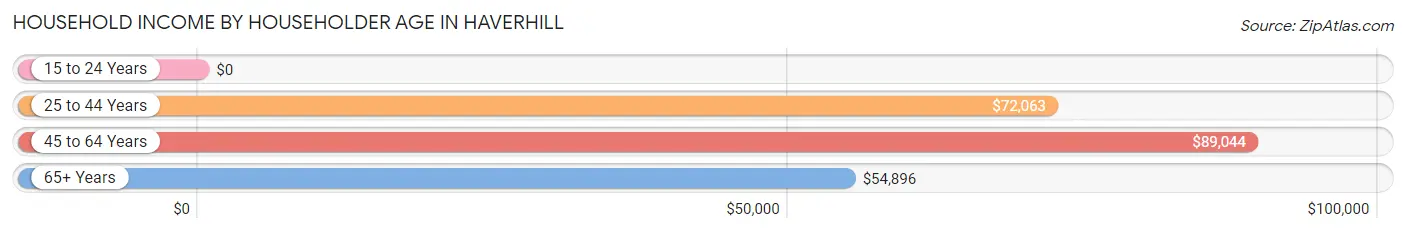
| Income Bracket | # Households | Median Income |
| 15 to 24 Years | 7 (0.9%) | $0 |
| 25 to 44 Years | 217 (26.3%) | $72,063 |
| 45 to 64 Years | 461 (55.8%) | $89,044 |
| 65+ Years | 141 (17.1%) | $54,896 |
| Total | 826 (100.0%) | $73,636 |
Poverty in Haverhill
Income Below Poverty by Sex and Age in Haverhill
With 6.7% poverty level for males and 8.0% for females among the residents of Haverhill, under 5 year old males and under 5 year old females are the most vulnerable to poverty, with 22 males (25.0%) and 23 females (33.3%) in their respective age groups living below the poverty level.
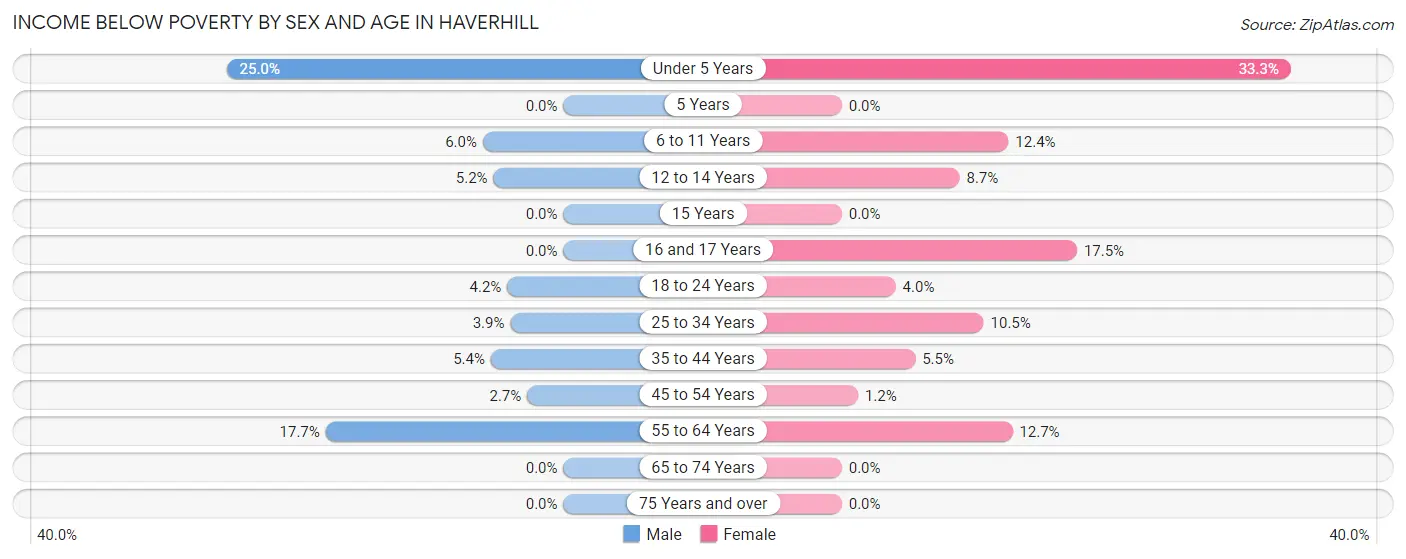
| Age Bracket | Male | Female |
| Under 5 Years | 22 (25.0%) | 23 (33.3%) |
| 5 Years | 0 (0.0%) | 0 (0.0%) |
| 6 to 11 Years | 7 (6.0%) | 24 (12.4%) |
| 12 to 14 Years | 4 (5.2%) | 9 (8.7%) |
| 15 Years | 0 (0.0%) | 0 (0.0%) |
| 16 and 17 Years | 0 (0.0%) | 11 (17.5%) |
| 18 to 24 Years | 4 (4.2%) | 6 (4.0%) |
| 25 to 34 Years | 5 (3.9%) | 14 (10.5%) |
| 35 to 44 Years | 9 (5.4%) | 11 (5.4%) |
| 45 to 54 Years | 9 (2.7%) | 3 (1.2%) |
| 55 to 64 Years | 30 (17.6%) | 19 (12.7%) |
| 65 to 74 Years | 0 (0.0%) | 0 (0.0%) |
| 75 Years and over | 0 (0.0%) | 0 (0.0%) |
| Total | 90 (6.7%) | 120 (8.0%) |
Income Above Poverty by Sex and Age in Haverhill
According to the poverty statistics in Haverhill, males aged 5 years and females aged 5 years are the age groups that are most secure financially, with 100.0% of males and 100.0% of females in these age groups living above the poverty line.
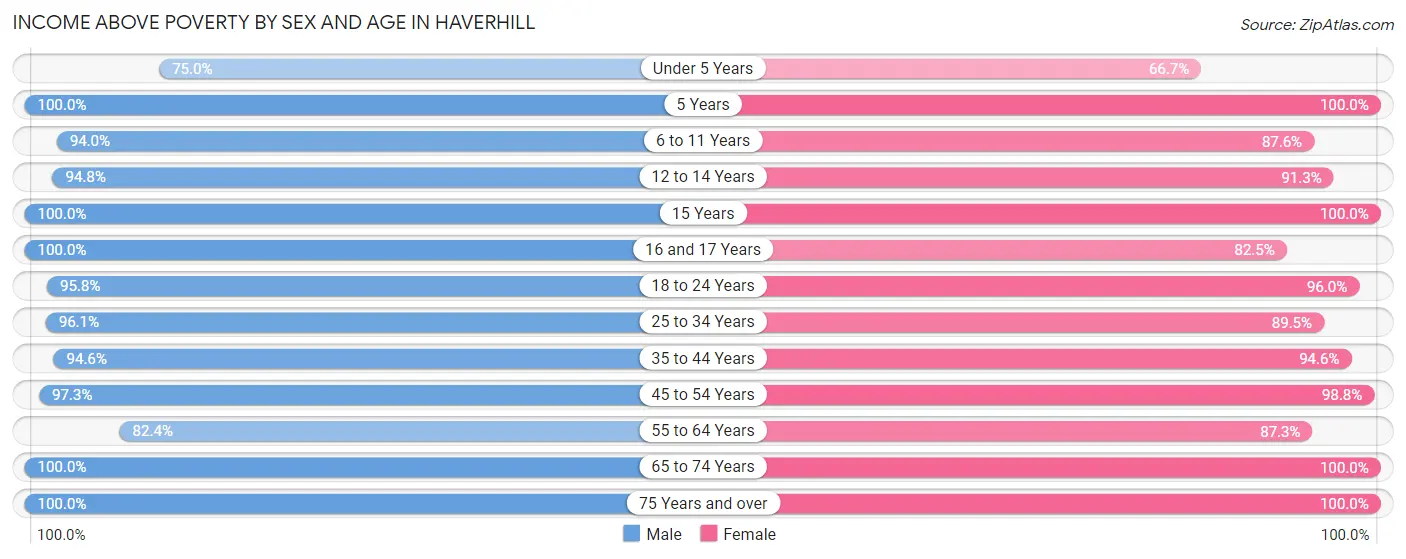
| Age Bracket | Male | Female |
| Under 5 Years | 66 (75.0%) | 46 (66.7%) |
| 5 Years | 6 (100.0%) | 28 (100.0%) |
| 6 to 11 Years | 110 (94.0%) | 170 (87.6%) |
| 12 to 14 Years | 73 (94.8%) | 94 (91.3%) |
| 15 Years | 22 (100.0%) | 49 (100.0%) |
| 16 and 17 Years | 14 (100.0%) | 52 (82.5%) |
| 18 to 24 Years | 92 (95.8%) | 144 (96.0%) |
| 25 to 34 Years | 122 (96.1%) | 119 (89.5%) |
| 35 to 44 Years | 158 (94.6%) | 191 (94.6%) |
| 45 to 54 Years | 326 (97.3%) | 247 (98.8%) |
| 55 to 64 Years | 140 (82.4%) | 131 (87.3%) |
| 65 to 74 Years | 97 (100.0%) | 69 (100.0%) |
| 75 Years and over | 25 (100.0%) | 46 (100.0%) |
| Total | 1,251 (93.3%) | 1,386 (92.0%) |
Income Below Poverty Among Married-Couple Families in Haverhill
The poverty statistics for married-couple families in Haverhill show that 2.2% or 10 of the total 454 families live below the poverty line. Families with 3 or 4 children have the highest poverty rate of 6.2%, comprising of 6 families. On the other hand, families with no children have the lowest poverty rate of 0.0%, which includes 0 families.
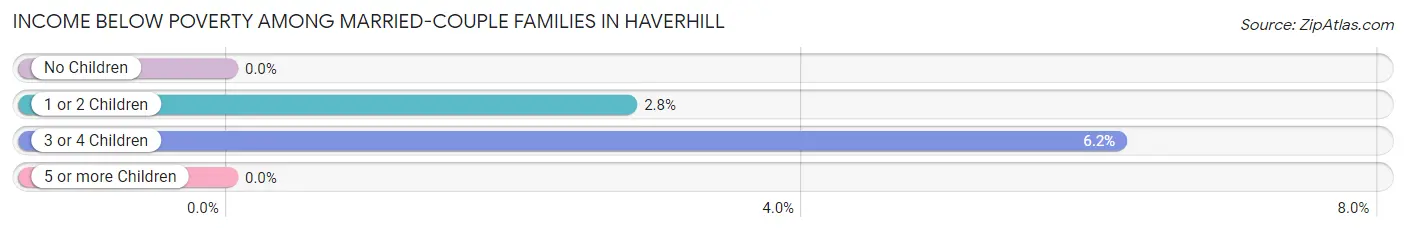
| Children | Above Poverty | Below Poverty |
| No Children | 213 (100.0%) | 0 (0.0%) |
| 1 or 2 Children | 140 (97.2%) | 4 (2.8%) |
| 3 or 4 Children | 91 (93.8%) | 6 (6.2%) |
| 5 or more Children | 0 (0.0%) | 0 (0.0%) |
| Total | 444 (97.8%) | 10 (2.2%) |
Income Below Poverty Among Single-Parent Households in Haverhill
According to the poverty data in Haverhill, 29.2% or 26 single-father households and 8.9% or 12 single-mother households are living below the poverty line. Among single-father households, those with 1 or 2 children have the highest poverty rate, with 26 households (49.1%) experiencing poverty. Likewise, among single-mother households, those with 3 or 4 children have the highest poverty rate, with 7 households (100.0%) falling below the poverty line.
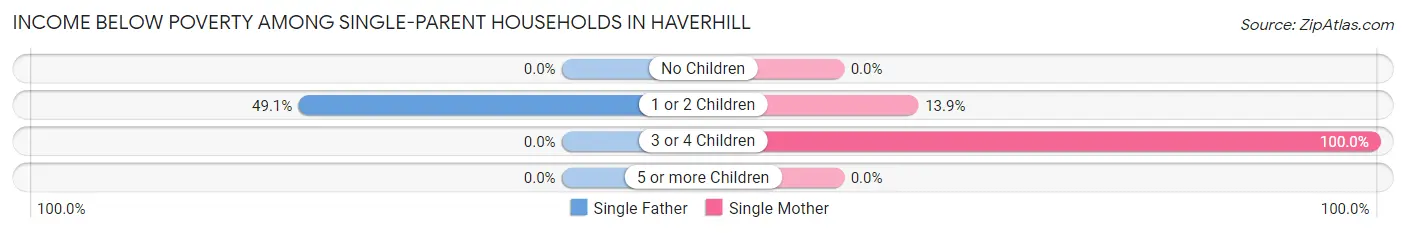
| Children | Single Father | Single Mother |
| No Children | 0 (0.0%) | 0 (0.0%) |
| 1 or 2 Children | 26 (49.1%) | 5 (13.9%) |
| 3 or 4 Children | 0 (0.0%) | 7 (100.0%) |
| 5 or more Children | 0 (0.0%) | 0 (0.0%) |
| Total | 26 (29.2%) | 12 (8.9%) |
Income Below Poverty Among Married-Couple vs Single-Parent Households in Haverhill
The poverty data for Haverhill shows that 10 of the married-couple family households (2.2%) and 38 of the single-parent households (17.0%) are living below the poverty level. Within the married-couple family households, those with 3 or 4 children have the highest poverty rate, with 6 households (6.2%) falling below the poverty line. Among the single-parent households, those with 3 or 4 children have the highest poverty rate, with 7 household (100.0%) living below poverty.
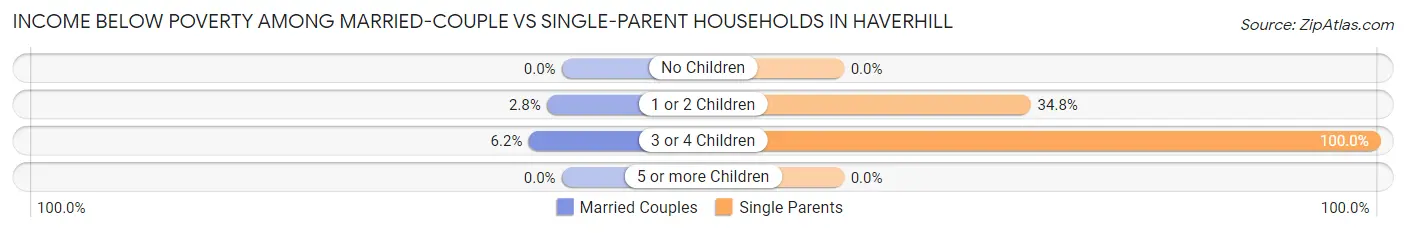
| Children | Married-Couple Families | Single-Parent Households |
| No Children | 0 (0.0%) | 0 (0.0%) |
| 1 or 2 Children | 4 (2.8%) | 31 (34.8%) |
| 3 or 4 Children | 6 (6.2%) | 7 (100.0%) |
| 5 or more Children | 0 (0.0%) | 0 (0.0%) |
| Total | 10 (2.2%) | 38 (17.0%) |
Race in Haverhill
The most populous races in Haverhill are White / Caucasian (1,064 | 37.2%), Hispanic or Latino (1,058 | 37.0%), and Black / African American (948 | 33.2%).
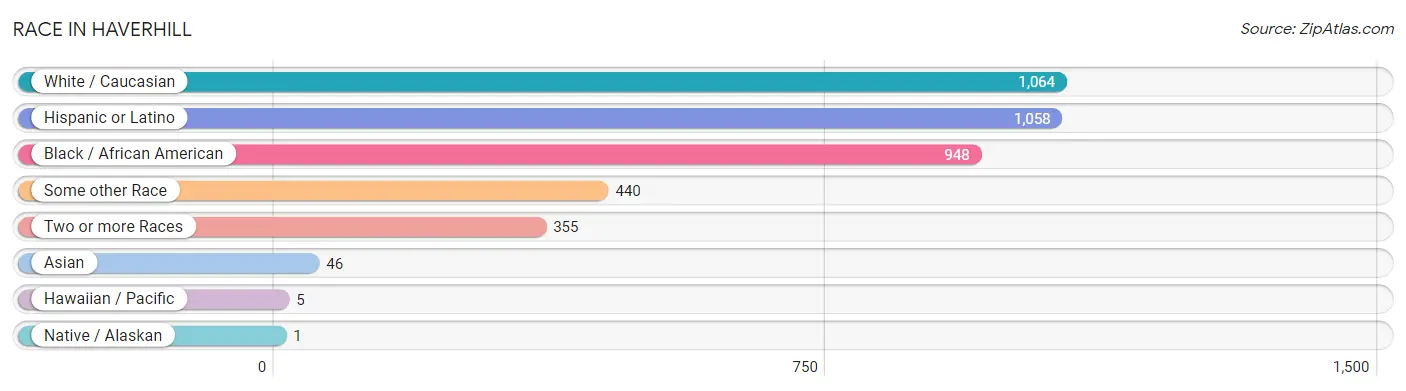
| Race | # Population | % Population |
| Asian | 46 | 1.6% |
| Black / African American | 948 | 33.2% |
| Hawaiian / Pacific | 5 | 0.2% |
| Hispanic or Latino | 1,058 | 37.0% |
| Native / Alaskan | 1 | 0.0% |
| White / Caucasian | 1,064 | 37.2% |
| Two or more Races | 355 | 12.4% |
| Some other Race | 440 | 15.4% |
| Total | 2,859 | 100.0% |
Ancestry in Haverhill
The most populous ancestries reported in Haverhill are Central American (371 | 13.0%), Haitian (269 | 9.4%), Honduran (253 | 8.8%), Cuban (210 | 7.3%), and Jamaican (148 | 5.2%), together accounting for 43.8% of all Haverhill residents.
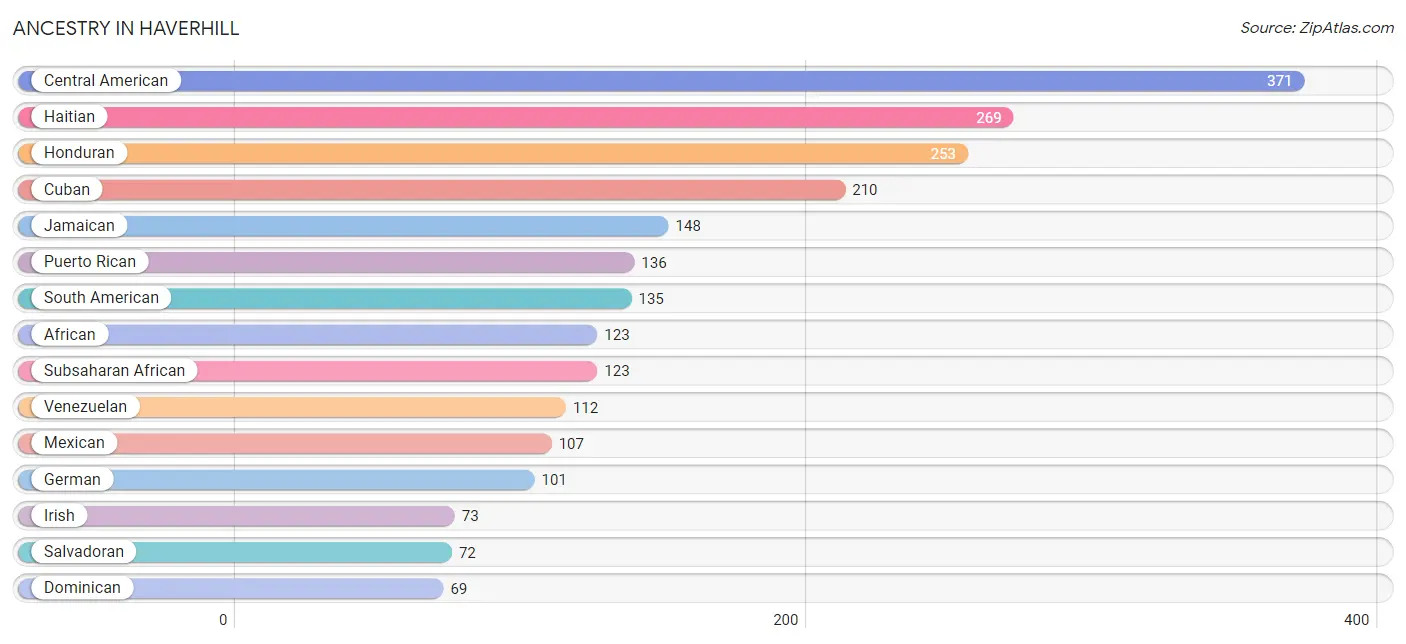
| Ancestry | # Population | % Population |
| African | 123 | 4.3% |
| American | 57 | 2.0% |
| Blackfeet | 2 | 0.1% |
| British West Indian | 5 | 0.2% |
| Central American | 371 | 13.0% |
| Central American Indian | 1 | 0.0% |
| Colombian | 11 | 0.4% |
| Costa Rican | 12 | 0.4% |
| Croatian | 6 | 0.2% |
| Cuban | 210 | 7.3% |
| Danish | 4 | 0.1% |
| Dominican | 69 | 2.4% |
| Eastern European | 13 | 0.4% |
| English | 54 | 1.9% |
| European | 27 | 0.9% |
| French | 25 | 0.9% |
| French Canadian | 5 | 0.2% |
| German | 101 | 3.5% |
| Guamanian / Chamorro | 5 | 0.2% |
| Guatemalan | 18 | 0.6% |
| Haitian | 269 | 9.4% |
| Honduran | 253 | 8.8% |
| Irish | 73 | 2.5% |
| Italian | 45 | 1.6% |
| Jamaican | 148 | 5.2% |
| Korean | 3 | 0.1% |
| Mexican | 107 | 3.7% |
| Nicaraguan | 16 | 0.6% |
| Norwegian | 6 | 0.2% |
| Peruvian | 12 | 0.4% |
| Polish | 41 | 1.4% |
| Portuguese | 24 | 0.8% |
| Puerto Rican | 136 | 4.8% |
| Salvadoran | 72 | 2.5% |
| Scandinavian | 7 | 0.2% |
| Scottish | 30 | 1.1% |
| Slovak | 11 | 0.4% |
| South American | 135 | 4.7% |
| Spaniard | 26 | 0.9% |
| Sri Lankan | 27 | 0.9% |
| Subsaharan African | 123 | 4.3% |
| Swedish | 4 | 0.1% |
| Thai | 16 | 0.6% |
| Venezuelan | 112 | 3.9% |
| West Indian | 1 | 0.0% | View All 45 Rows |
Immigrants in Haverhill
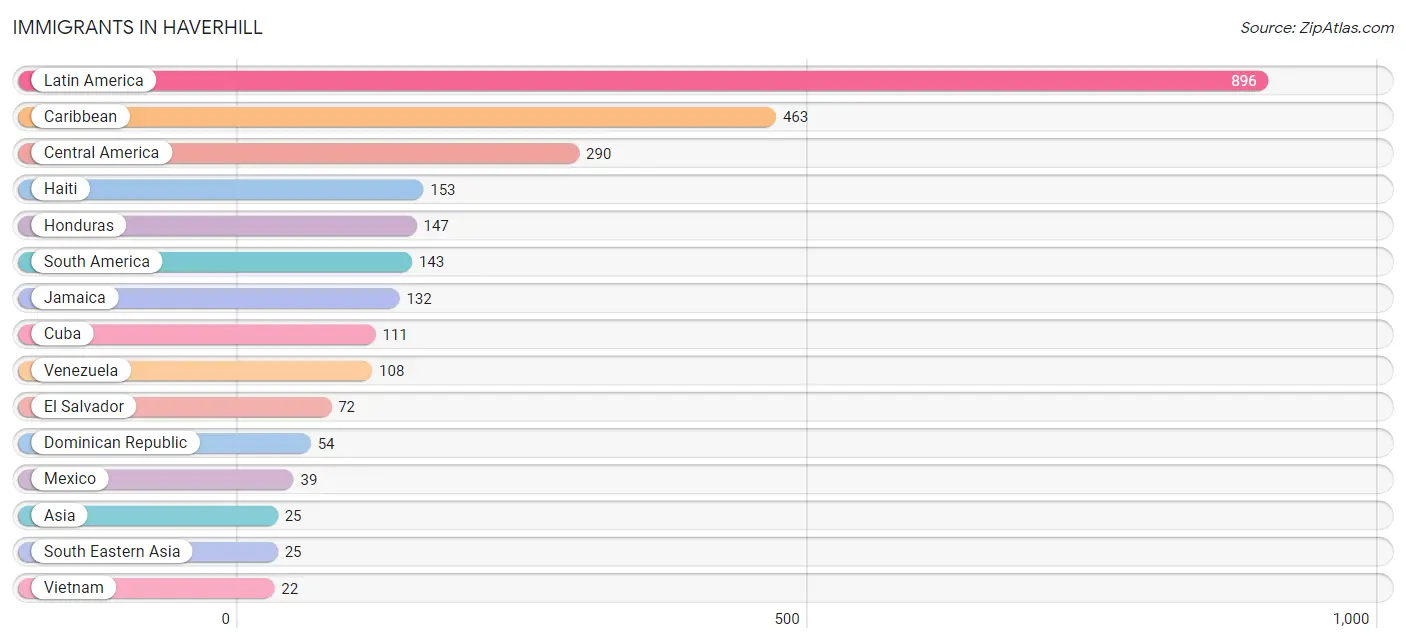
The most numerous immigrant groups reported in Haverhill came from Latin America (896 | 31.3%), Caribbean (463 | 16.2%), Central America (290 | 10.1%), Haiti (153 | 5.3%), and Honduras (147 | 5.1%), together accounting for 68.2% of all Haverhill residents.
| Immigration Origin | # Population | % Population |
| Asia | 25 | 0.9% |
| Bahamas | 8 | 0.3% |
| Caribbean | 463 | 16.2% |
| Central America | 290 | 10.1% |
| Colombia | 7 | 0.2% |
| Cuba | 111 | 3.9% |
| Dominican Republic | 54 | 1.9% |
| El Salvador | 72 | 2.5% |
| Europe | 11 | 0.4% |
| France | 3 | 0.1% |
| Germany | 8 | 0.3% |
| Guatemala | 18 | 0.6% |
| Guyana | 16 | 0.6% |
| Haiti | 153 | 5.3% |
| Honduras | 147 | 5.1% |
| Jamaica | 132 | 4.6% |
| Latin America | 896 | 31.3% |
| Mexico | 39 | 1.4% |
| Nicaragua | 14 | 0.5% |
| Peru | 12 | 0.4% |
| Philippines | 3 | 0.1% |
| South America | 143 | 5.0% |
| South Eastern Asia | 25 | 0.9% |
| Venezuela | 108 | 3.8% |
| Vietnam | 22 | 0.8% |
| Western Europe | 11 | 0.4% | View All 26 Rows |
Sex and Age in Haverhill
Sex and Age in Haverhill
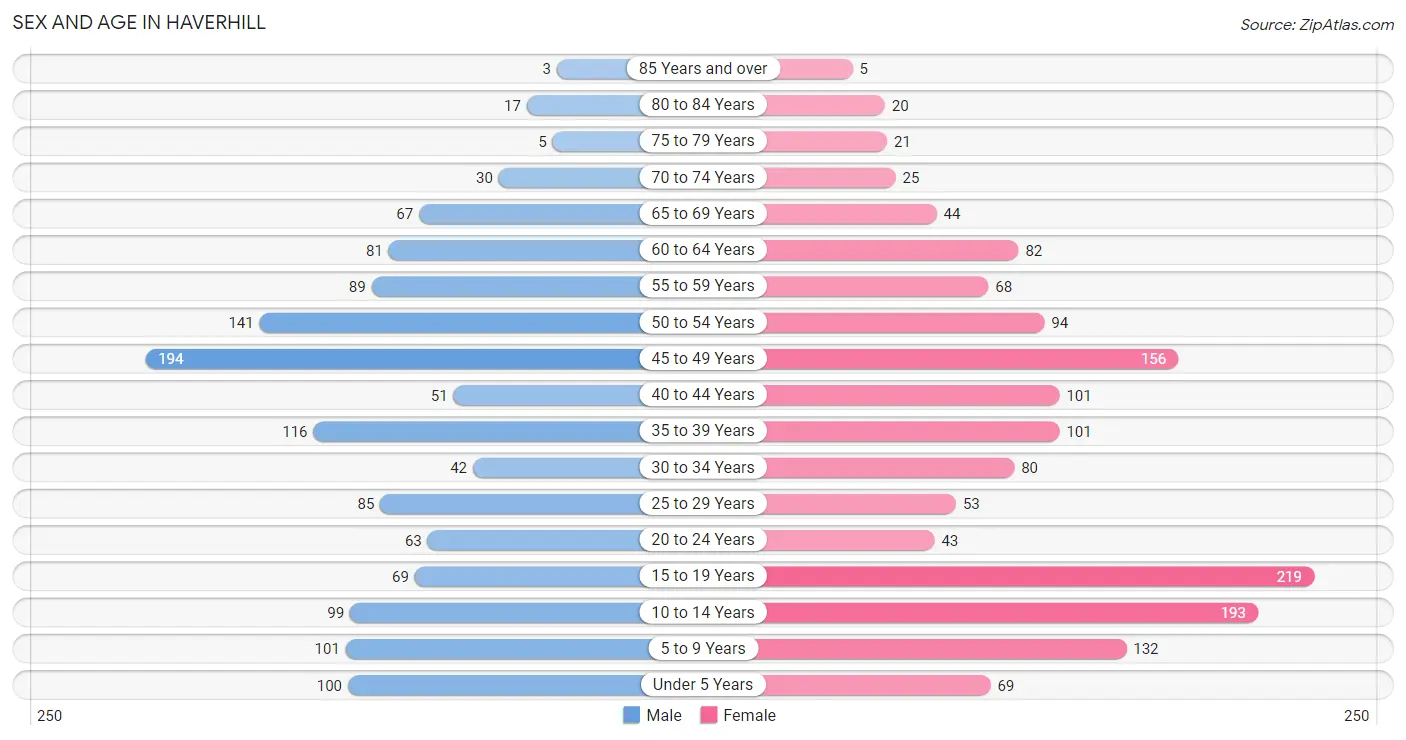
The most populous age groups in Haverhill are 45 to 49 Years (194 | 14.3%) for men and 15 to 19 Years (219 | 14.5%) for women.
| Age Bracket | Male | Female |
| Under 5 Years | 100 (7.4%) | 69 (4.6%) |
| 5 to 9 Years | 101 (7.5%) | 132 (8.8%) |
| 10 to 14 Years | 99 (7.3%) | 193 (12.8%) |
| 15 to 19 Years | 69 (5.1%) | 219 (14.5%) |
| 20 to 24 Years | 63 (4.7%) | 43 (2.9%) |
| 25 to 29 Years | 85 (6.3%) | 53 (3.5%) |
| 30 to 34 Years | 42 (3.1%) | 80 (5.3%) |
| 35 to 39 Years | 116 (8.6%) | 101 (6.7%) |
| 40 to 44 Years | 51 (3.8%) | 101 (6.7%) |
| 45 to 49 Years | 194 (14.3%) | 156 (10.4%) |
| 50 to 54 Years | 141 (10.4%) | 94 (6.2%) |
| 55 to 59 Years | 89 (6.6%) | 68 (4.5%) |
| 60 to 64 Years | 81 (6.0%) | 82 (5.4%) |
| 65 to 69 Years | 67 (5.0%) | 44 (2.9%) |
| 70 to 74 Years | 30 (2.2%) | 25 (1.7%) |
| 75 to 79 Years | 5 (0.4%) | 21 (1.4%) |
| 80 to 84 Years | 17 (1.3%) | 20 (1.3%) |
| 85 Years and over | 3 (0.2%) | 5 (0.3%) |
| Total | 1,353 (100.0%) | 1,506 (100.0%) |
Families and Households in Haverhill
Median Family Size in Haverhill
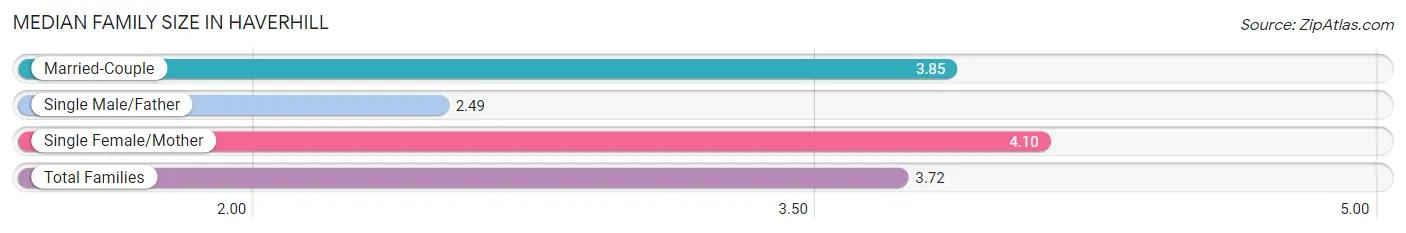
The median family size in Haverhill is 3.72 persons per family, with single female/mother families (135 | 19.9%) accounting for the largest median family size of 4.1 persons per family. On the other hand, single male/father families (89 | 13.1%) represent the smallest median family size with 2.49 persons per family.
| Family Type | # Families | Family Size |
| Married-Couple | 454 (67.0%) | 3.85 |
| Single Male/Father | 89 (13.1%) | 2.49 |
| Single Female/Mother | 135 (19.9%) | 4.10 |
| Total Families | 678 (100.0%) | 3.72 |
Median Household Size in Haverhill
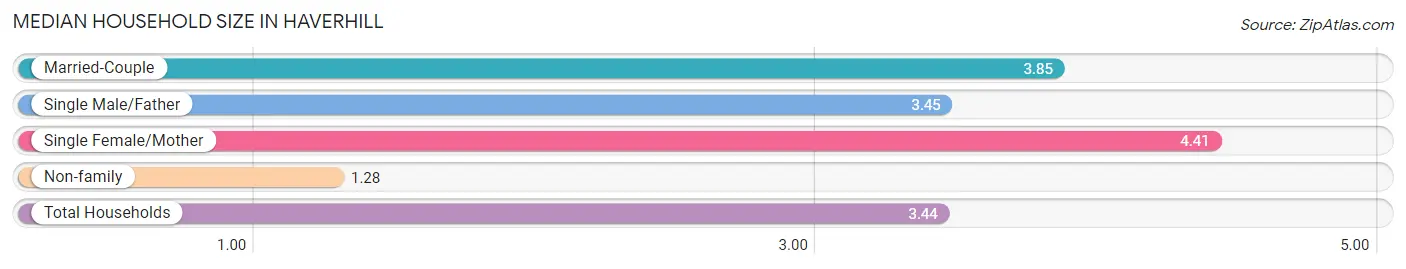
The median household size in Haverhill is 3.44 persons per household, with single female/mother households (135 | 16.3%) accounting for the largest median household size of 4.41 persons per household. non-family households (148 | 17.9%) represent the smallest median household size with 1.28 persons per household.
| Household Type | # Households | Household Size |
| Married-Couple | 454 (55.0%) | 3.85 |
| Single Male/Father | 89 (10.8%) | 3.45 |
| Single Female/Mother | 135 (16.3%) | 4.41 |
| Non-family | 148 (17.9%) | 1.28 |
| Total Households | 826 (100.0%) | 3.44 |
Household Size by Marriage Status in Haverhill
Out of a total of 826 households in Haverhill, 678 (82.1%) are family households, while 148 (17.9%) are nonfamily households. The most numerous type of family households are 2-person households, comprising 218, and the most common type of nonfamily households are 1-person households, comprising 119.
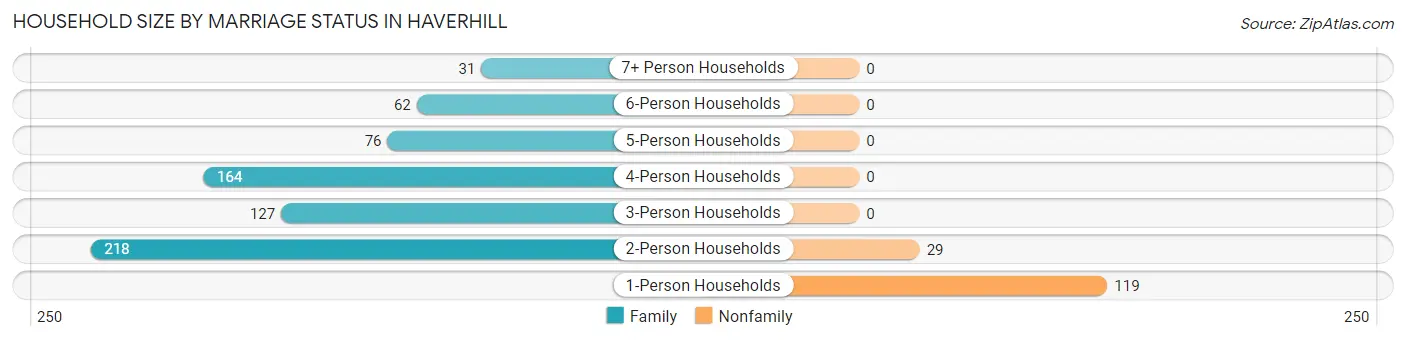
| Household Size | Family Households | Nonfamily Households |
| 1-Person Households | - | 119 (14.4%) |
| 2-Person Households | 218 (26.4%) | 29 (3.5%) |
| 3-Person Households | 127 (15.4%) | 0 (0.0%) |
| 4-Person Households | 164 (19.9%) | 0 (0.0%) |
| 5-Person Households | 76 (9.2%) | 0 (0.0%) |
| 6-Person Households | 62 (7.5%) | 0 (0.0%) |
| 7+ Person Households | 31 (3.7%) | 0 (0.0%) |
| Total | 678 (82.1%) | 148 (17.9%) |
Female Fertility in Haverhill
Fertility by Age in Haverhill
Average fertility rate in Haverhill is 13.0 births per 1,000 women. Women in the age bracket of 20 to 34 years have the highest fertility rate with 28.0 births per 1,000 women. Women in the age bracket of 20 to 34 years acount for 50.0% of all women with births.
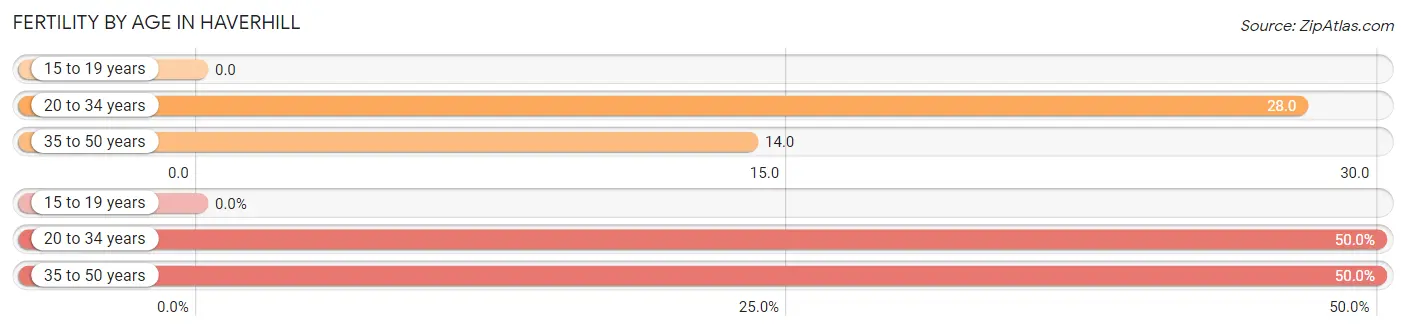
| Age Bracket | Women with Births | Births / 1,000 Women |
| 15 to 19 years | 0 (0.0%) | 0.0 |
| 20 to 34 years | 5 (50.0%) | 28.0 |
| 35 to 50 years | 5 (50.0%) | 14.0 |
| Total | 10 (100.0%) | 13.0 |
Fertility by Age by Marriage Status in Haverhill
50.0% of women with births (10) in Haverhill are married. The highest percentage of unmarried women with births falls into 20 to 34 years age bracket with 100.0% of them unmarried at the time of birth, while the lowest percentage of unmarried women with births belong to 35 to 50 years age bracket with 0.0% of them unmarried.
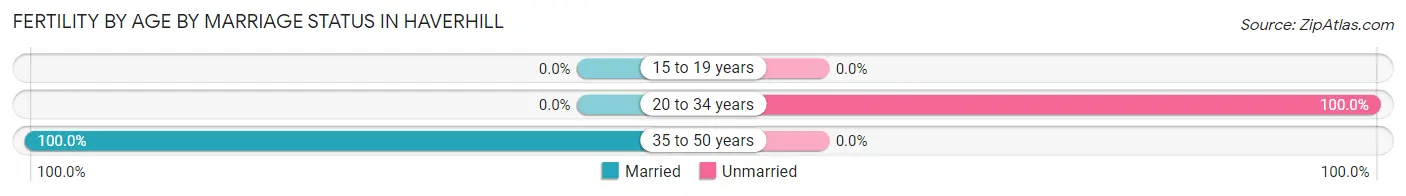
| Age Bracket | Married | Unmarried |
| 15 to 19 years | 0 (0.0%) | 0 (0.0%) |
| 20 to 34 years | 0 (0.0%) | 5 (100.0%) |
| 35 to 50 years | 5 (100.0%) | 0 (0.0%) |
| Total | 5 (50.0%) | 5 (50.0%) |
Fertility by Education in Haverhill
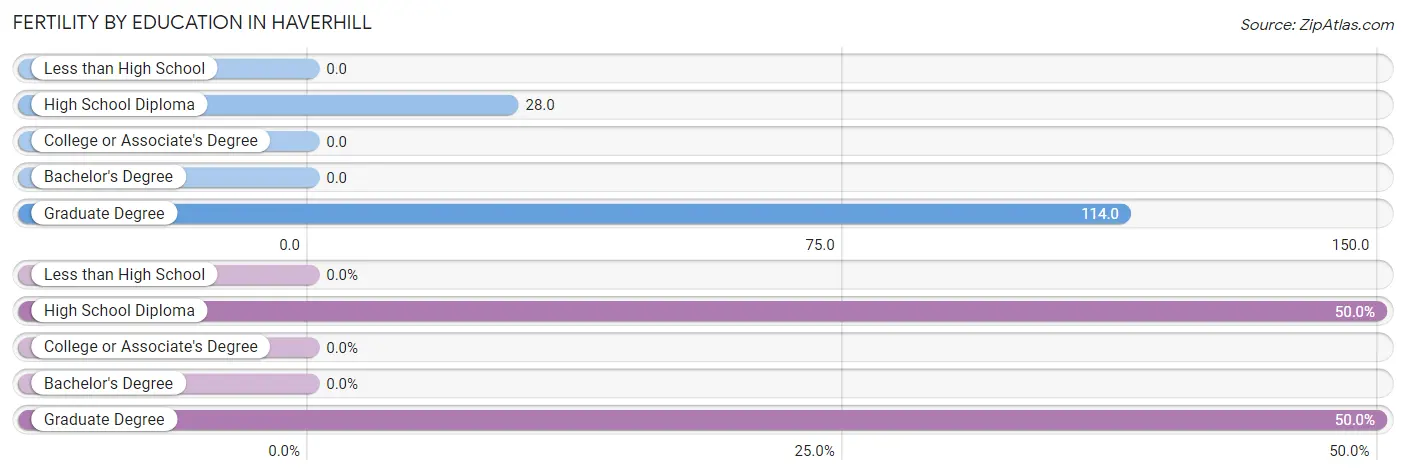
| Educational Attainment | Women with Births | Births / 1,000 Women |
| Less than High School | 0 (0.0%) | 0.0 |
| High School Diploma | 5 (50.0%) | 28.0 |
| College or Associate's Degree | 0 (0.0%) | 0.0 |
| Bachelor's Degree | 0 (0.0%) | 0.0 |
| Graduate Degree | 5 (50.0%) | 114.0 |
| Total | 10 (100.0%) | 13.0 |
Fertility by Education by Marriage Status in Haverhill
50.0% of women with births in Haverhill are unmarried. Women with the educational attainment of graduate degree are most likely to be married with 100.0% of them married at childbirth, while women with the educational attainment of high school diploma are least likely to be married with 100.0% of them unmarried at childbirth.
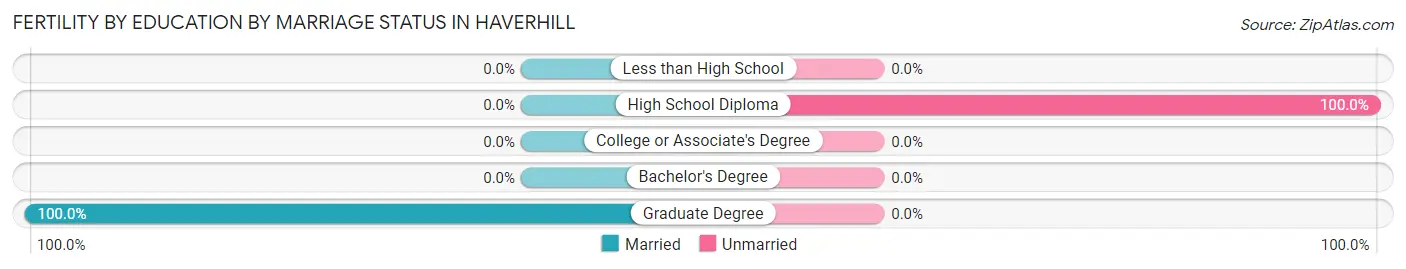
| Educational Attainment | Married | Unmarried |
| Less than High School | 0 (0.0%) | 0 (0.0%) |
| High School Diploma | 0 (0.0%) | 5 (100.0%) |
| College or Associate's Degree | 0 (0.0%) | 0 (0.0%) |
| Bachelor's Degree | 0 (0.0%) | 0 (0.0%) |
| Graduate Degree | 5 (100.0%) | 0 (0.0%) |
| Total | 5 (50.0%) | 5 (50.0%) |
Employment Characteristics in Haverhill
Employment by Class of Employer in Haverhill
Among the 1,425 employed individuals in Haverhill, private company employees (905 | 63.5%), self-employed (incorporated) (152 | 10.7%), and local government employees (93 | 6.5%) make up the most common classes of employment.
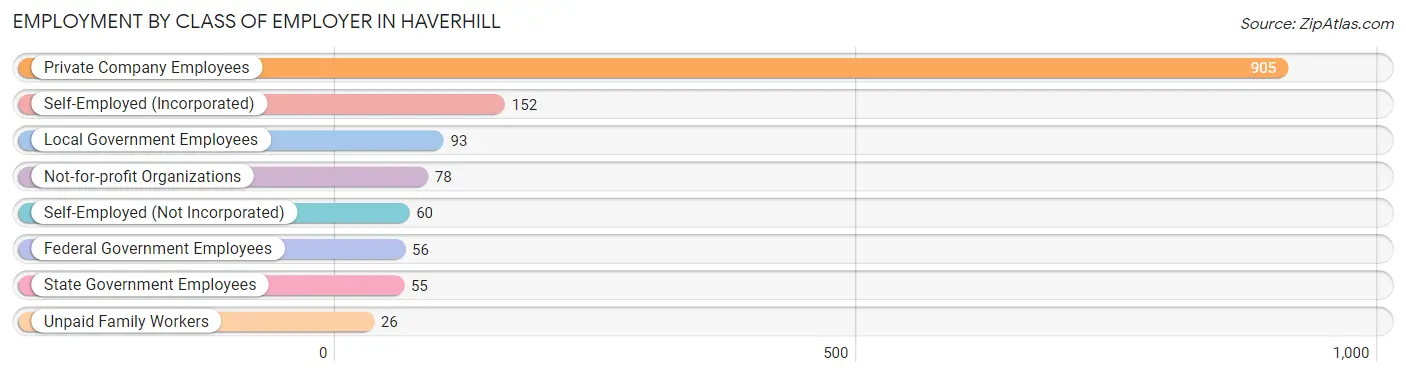
| Employer Class | # Employees | % Employees |
| Private Company Employees | 905 | 63.5% |
| Self-Employed (Incorporated) | 152 | 10.7% |
| Self-Employed (Not Incorporated) | 60 | 4.2% |
| Not-for-profit Organizations | 78 | 5.5% |
| Local Government Employees | 93 | 6.5% |
| State Government Employees | 55 | 3.9% |
| Federal Government Employees | 56 | 3.9% |
| Unpaid Family Workers | 26 | 1.8% |
| Total | 1,425 | 100.0% |
Employment Status by Age in Haverhill
According to the labor force statistics for Haverhill, out of the total population over 16 years of age (2,094), 71.8% or 1,503 individuals are in the labor force, with 4.7% or 71 of them unemployed. The age group with the highest labor force participation rate is 45 to 54 years, with 90.9% or 532 individuals in the labor force. Within the labor force, the 16 to 19 years age range has the highest percentage of unemployed individuals, with 32.3% or 32 of them being unemployed.
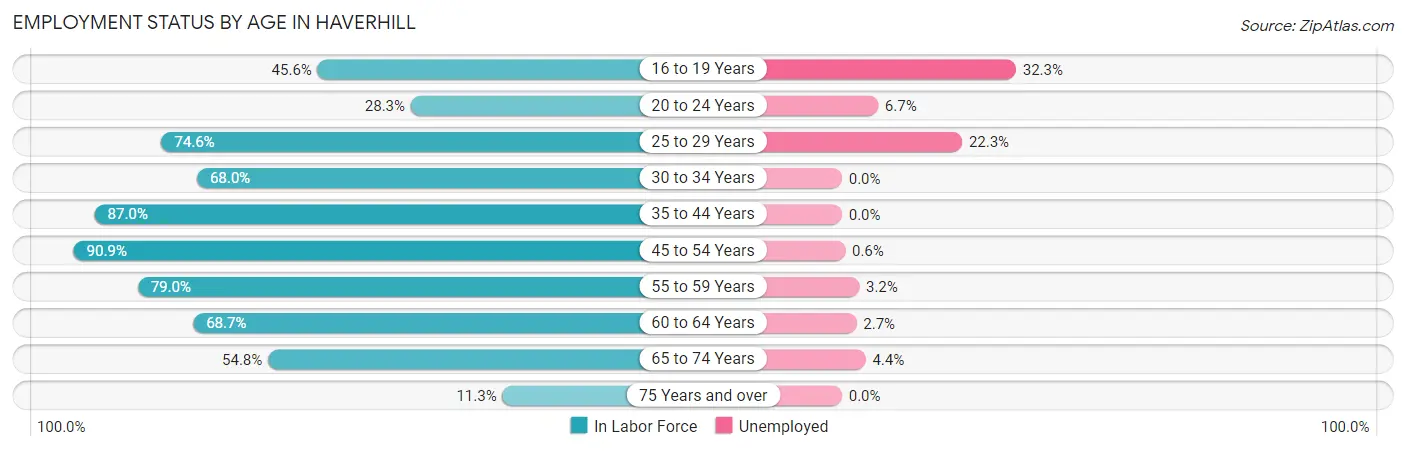
| Age Bracket | In Labor Force | Unemployed |
| 16 to 19 Years | 99 (45.6%) | 32 (32.3%) |
| 20 to 24 Years | 30 (28.3%) | 2 (6.7%) |
| 25 to 29 Years | 103 (74.6%) | 23 (22.3%) |
| 30 to 34 Years | 83 (68.0%) | 0 (0.0%) |
| 35 to 44 Years | 321 (87.0%) | 0 (0.0%) |
| 45 to 54 Years | 532 (90.9%) | 3 (0.6%) |
| 55 to 59 Years | 124 (79.0%) | 4 (3.2%) |
| 60 to 64 Years | 112 (68.7%) | 3 (2.7%) |
| 65 to 74 Years | 91 (54.8%) | 4 (4.4%) |
| 75 Years and over | 8 (11.3%) | 0 (0.0%) |
| Total | 1,503 (71.8%) | 71 (4.7%) |
Employment Status by Educational Attainment in Haverhill
According to labor force statistics for Haverhill, 83.1% of individuals (1,275) out of the total population between 25 and 64 years of age (1,534) are in the labor force, with 2.6% or 33 of them being unemployed. The group with the highest labor force participation rate are those with the educational attainment of bachelor's degree or higher, with 89.9% or 375 individuals in the labor force. Within the labor force, individuals with high school diploma education have the highest percentage of unemployment, with 7.5% or 27 of them being unemployed.
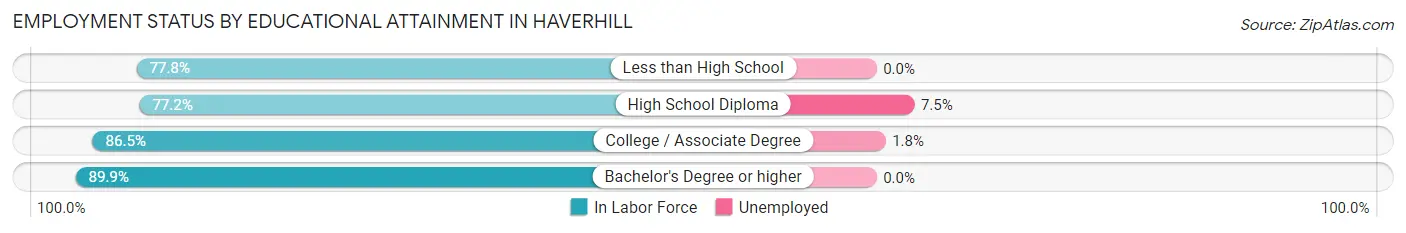
| Educational Attainment | In Labor Force | Unemployed |
| Less than High School | 207 (77.8%) | 0 (0.0%) |
| High School Diploma | 359 (77.2%) | 35 (7.5%) |
| College / Associate Degree | 334 (86.5%) | 7 (1.8%) |
| Bachelor's Degree or higher | 375 (89.9%) | 0 (0.0%) |
| Total | 1,275 (83.1%) | 40 (2.6%) |
Employment Occupations by Sex in Haverhill
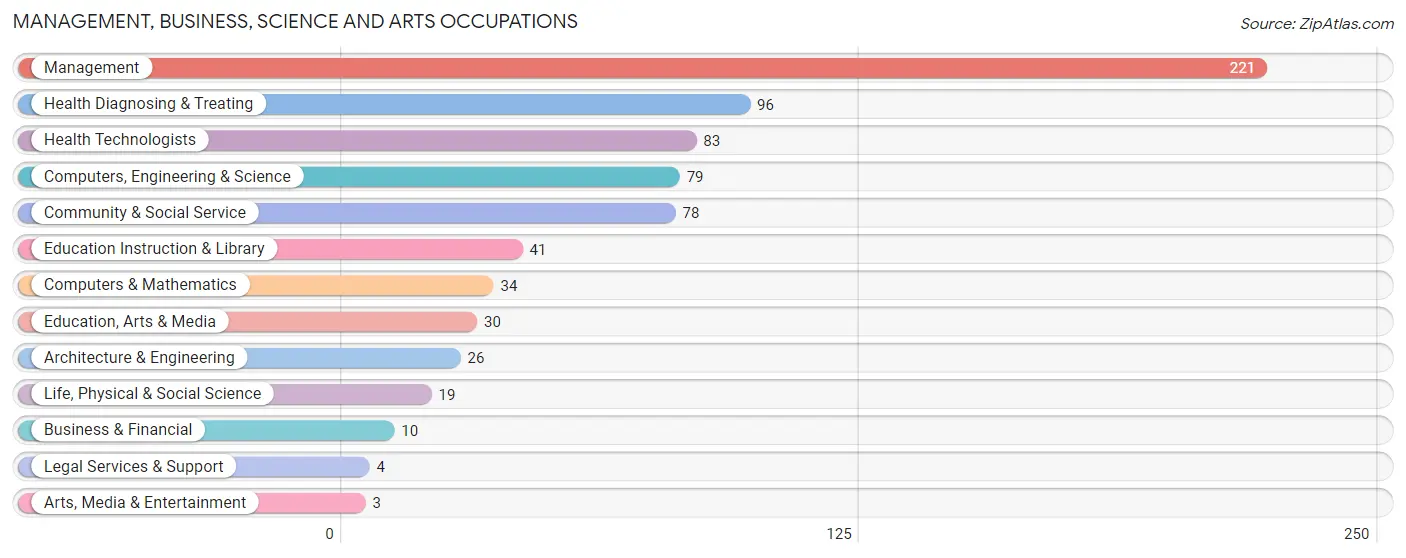
Management, Business, Science and Arts Occupations
The most common Management, Business, Science and Arts occupations in Haverhill are Management (221 | 15.5%), Health Diagnosing & Treating (96 | 6.7%), Health Technologists (83 | 5.8%), Computers, Engineering & Science (79 | 5.5%), and Community & Social Service (78 | 5.5%).
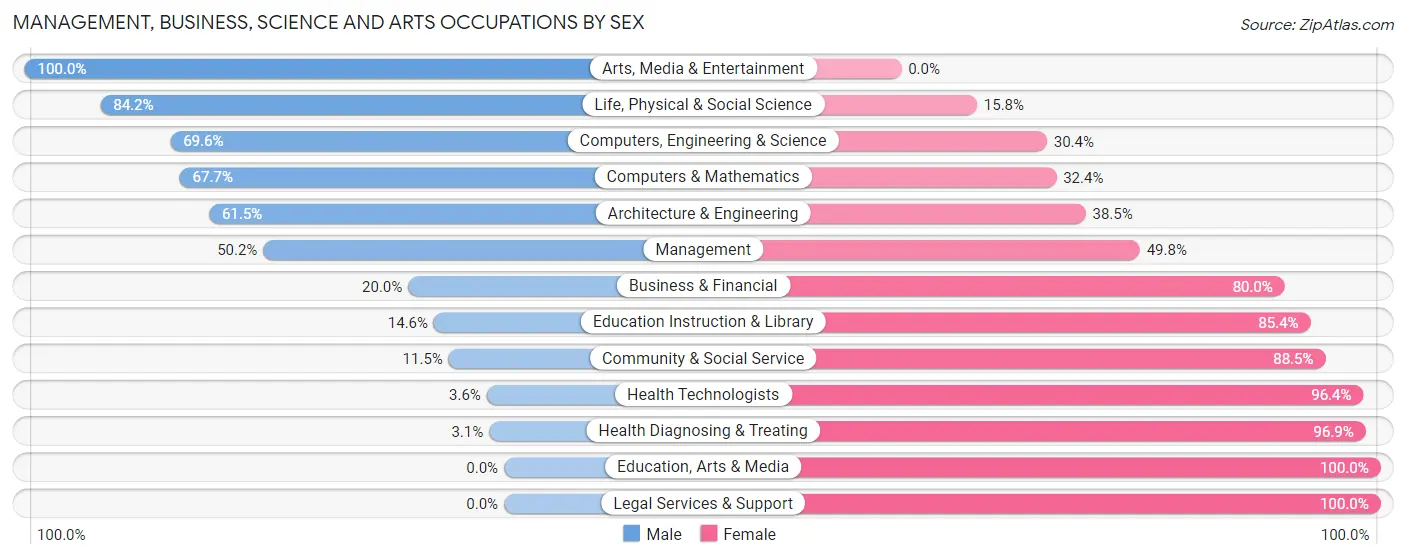
Management, Business, Science and Arts Occupations by Sex
Within the Management, Business, Science and Arts occupations in Haverhill, the most male-oriented occupations are Arts, Media & Entertainment (100.0%), Life, Physical & Social Science (84.2%), and Computers, Engineering & Science (69.6%), while the most female-oriented occupations are Education, Arts & Media (100.0%), Legal Services & Support (100.0%), and Health Diagnosing & Treating (96.9%).
| Occupation | Male | Female |
| Management | 111 (50.2%) | 110 (49.8%) |
| Business & Financial | 2 (20.0%) | 8 (80.0%) |
| Computers, Engineering & Science | 55 (69.6%) | 24 (30.4%) |
| Computers & Mathematics | 23 (67.6%) | 11 (32.4%) |
| Architecture & Engineering | 16 (61.5%) | 10 (38.5%) |
| Life, Physical & Social Science | 16 (84.2%) | 3 (15.8%) |
| Community & Social Service | 9 (11.5%) | 69 (88.5%) |
| Education, Arts & Media | 0 (0.0%) | 30 (100.0%) |
| Legal Services & Support | 0 (0.0%) | 4 (100.0%) |
| Education Instruction & Library | 6 (14.6%) | 35 (85.4%) |
| Arts, Media & Entertainment | 3 (100.0%) | 0 (0.0%) |
| Health Diagnosing & Treating | 3 (3.1%) | 93 (96.9%) |
| Health Technologists | 3 (3.6%) | 80 (96.4%) |
| Total (Category) | 180 (37.2%) | 304 (62.8%) |
| Total (Overall) | 716 (50.2%) | 710 (49.8%) |
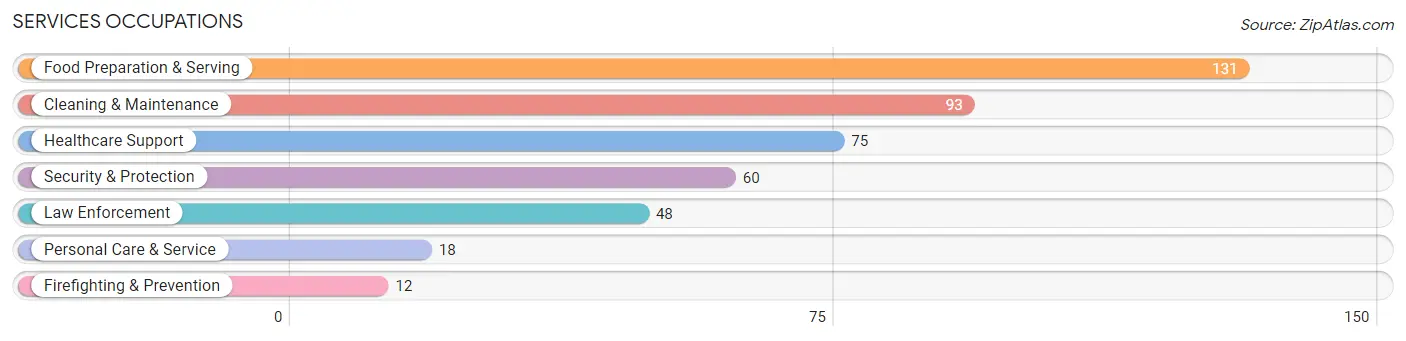
Services Occupations
The most common Services occupations in Haverhill are Food Preparation & Serving (131 | 9.2%), Cleaning & Maintenance (93 | 6.5%), Healthcare Support (75 | 5.3%), Security & Protection (60 | 4.2%), and Law Enforcement (48 | 3.4%).
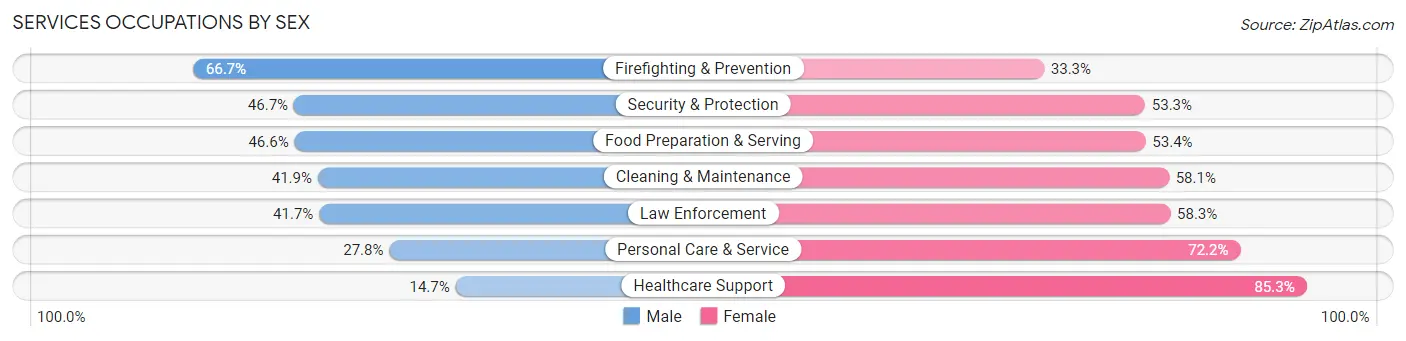
Services Occupations by Sex
Within the Services occupations in Haverhill, the most male-oriented occupations are Firefighting & Prevention (66.7%), Security & Protection (46.7%), and Food Preparation & Serving (46.6%), while the most female-oriented occupations are Healthcare Support (85.3%), Personal Care & Service (72.2%), and Law Enforcement (58.3%).
| Occupation | Male | Female |
| Healthcare Support | 11 (14.7%) | 64 (85.3%) |
| Security & Protection | 28 (46.7%) | 32 (53.3%) |
| Firefighting & Prevention | 8 (66.7%) | 4 (33.3%) |
| Law Enforcement | 20 (41.7%) | 28 (58.3%) |
| Food Preparation & Serving | 61 (46.6%) | 70 (53.4%) |
| Cleaning & Maintenance | 39 (41.9%) | 54 (58.1%) |
| Personal Care & Service | 5 (27.8%) | 13 (72.2%) |
| Total (Category) | 144 (38.2%) | 233 (61.8%) |
| Total (Overall) | 716 (50.2%) | 710 (49.8%) |
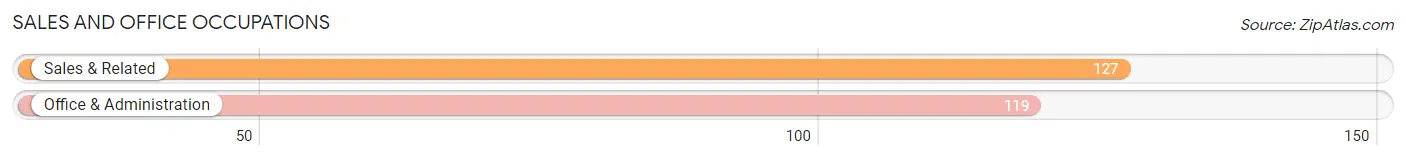
Sales and Office Occupations
The most common Sales and Office occupations in Haverhill are Sales & Related (127 | 8.9%), and Office & Administration (119 | 8.4%).
Sales and Office Occupations by Sex
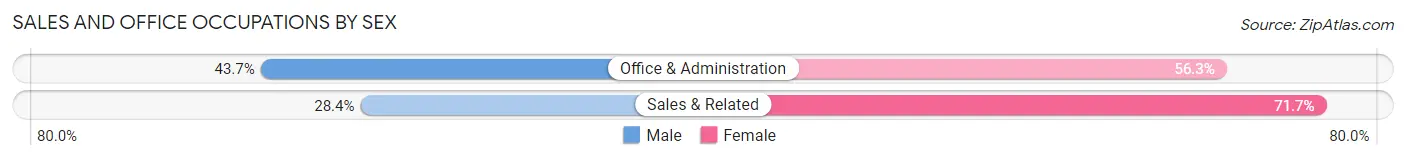
| Occupation | Male | Female |
| Sales & Related | 36 (28.3%) | 91 (71.7%) |
| Office & Administration | 52 (43.7%) | 67 (56.3%) |
| Total (Category) | 88 (35.8%) | 158 (64.2%) |
| Total (Overall) | 716 (50.2%) | 710 (49.8%) |
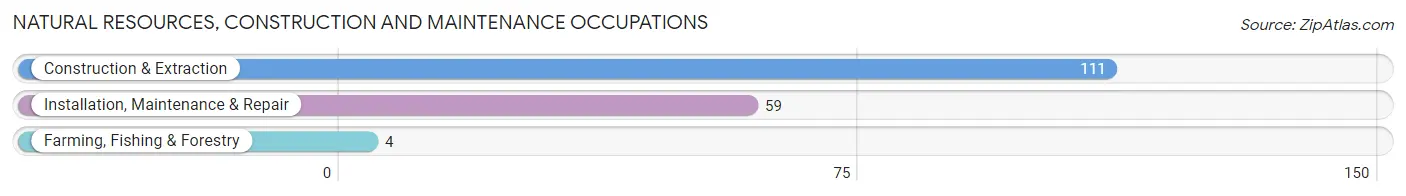
Natural Resources, Construction and Maintenance Occupations
The most common Natural Resources, Construction and Maintenance occupations in Haverhill are Construction & Extraction (111 | 7.8%), Installation, Maintenance & Repair (59 | 4.1%), and Farming, Fishing & Forestry (4 | 0.3%).
Natural Resources, Construction and Maintenance Occupations by Sex
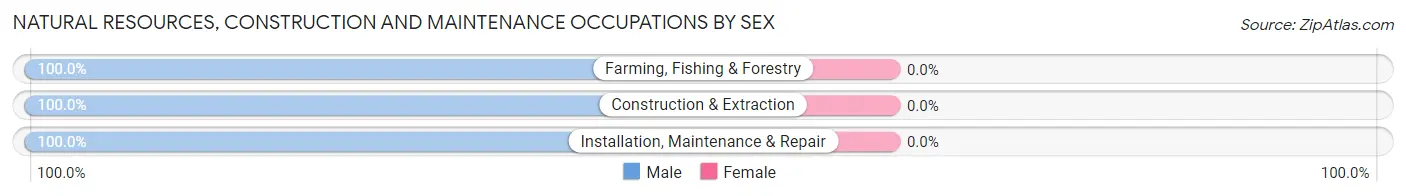
| Occupation | Male | Female |
| Farming, Fishing & Forestry | 4 (100.0%) | 0 (0.0%) |
| Construction & Extraction | 111 (100.0%) | 0 (0.0%) |
| Installation, Maintenance & Repair | 59 (100.0%) | 0 (0.0%) |
| Total (Category) | 174 (100.0%) | 0 (0.0%) |
| Total (Overall) | 716 (50.2%) | 710 (49.8%) |
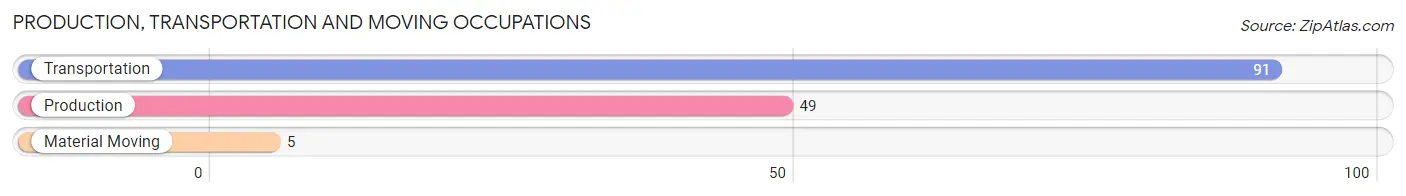
Production, Transportation and Moving Occupations
The most common Production, Transportation and Moving occupations in Haverhill are Transportation (91 | 6.4%), Production (49 | 3.4%), and Material Moving (5 | 0.4%).
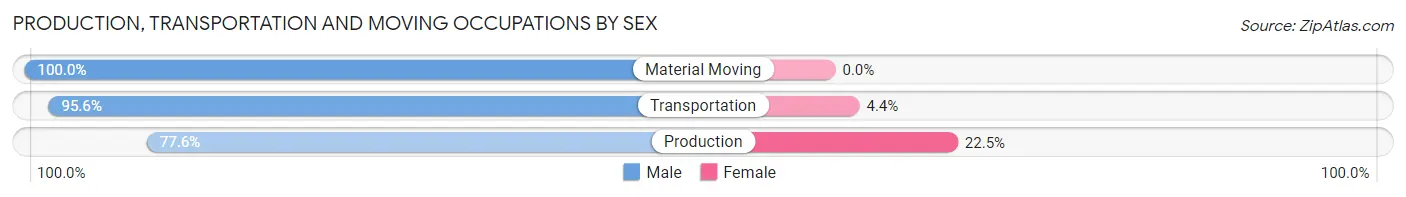
Production, Transportation and Moving Occupations by Sex
| Occupation | Male | Female |
| Production | 38 (77.5%) | 11 (22.5%) |
| Transportation | 87 (95.6%) | 4 (4.4%) |
| Material Moving | 5 (100.0%) | 0 (0.0%) |
| Total (Category) | 130 (89.7%) | 15 (10.3%) |
| Total (Overall) | 716 (50.2%) | 710 (49.8%) |
Employment Industries by Sex in Haverhill
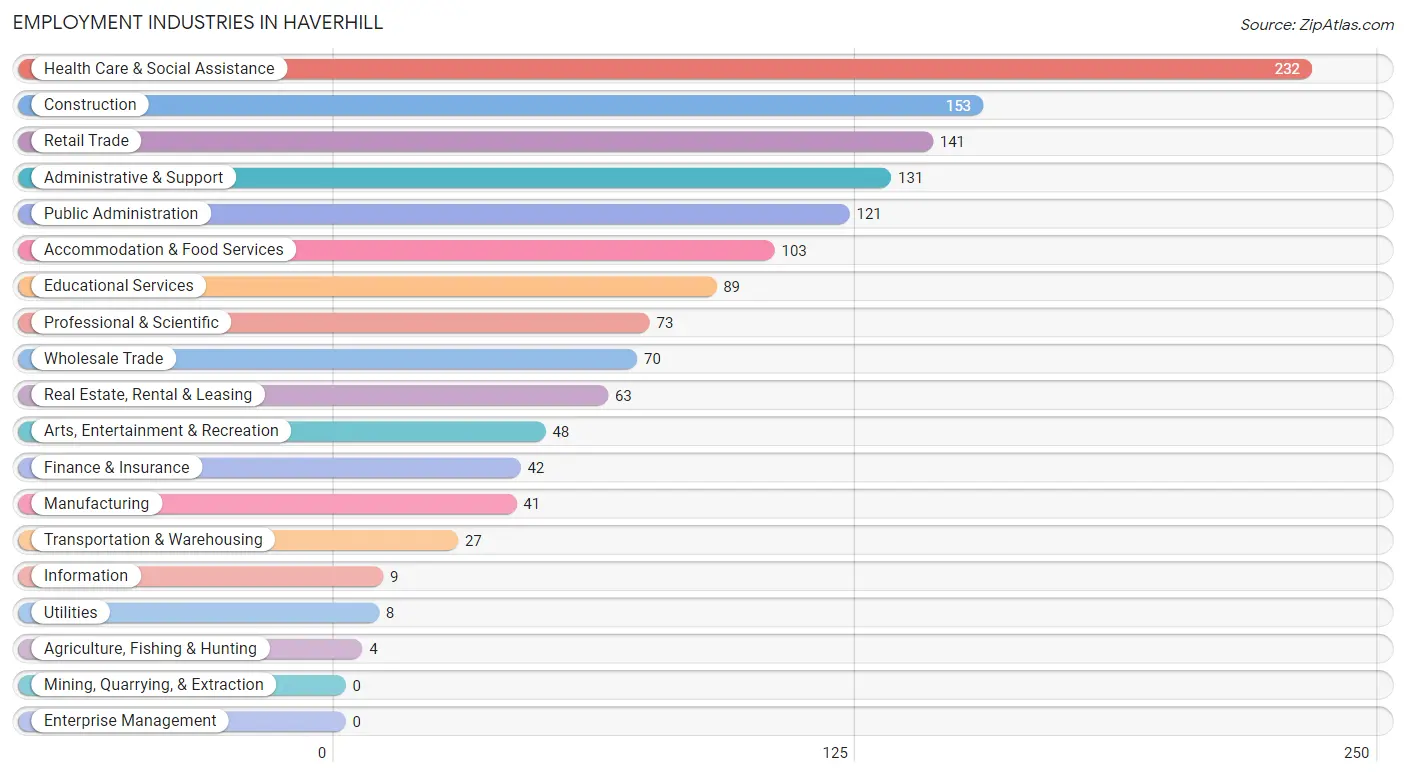
Employment Industries in Haverhill
The major employment industries in Haverhill include Health Care & Social Assistance (232 | 16.3%), Construction (153 | 10.7%), Retail Trade (141 | 9.9%), Administrative & Support (131 | 9.2%), and Public Administration (121 | 8.5%).
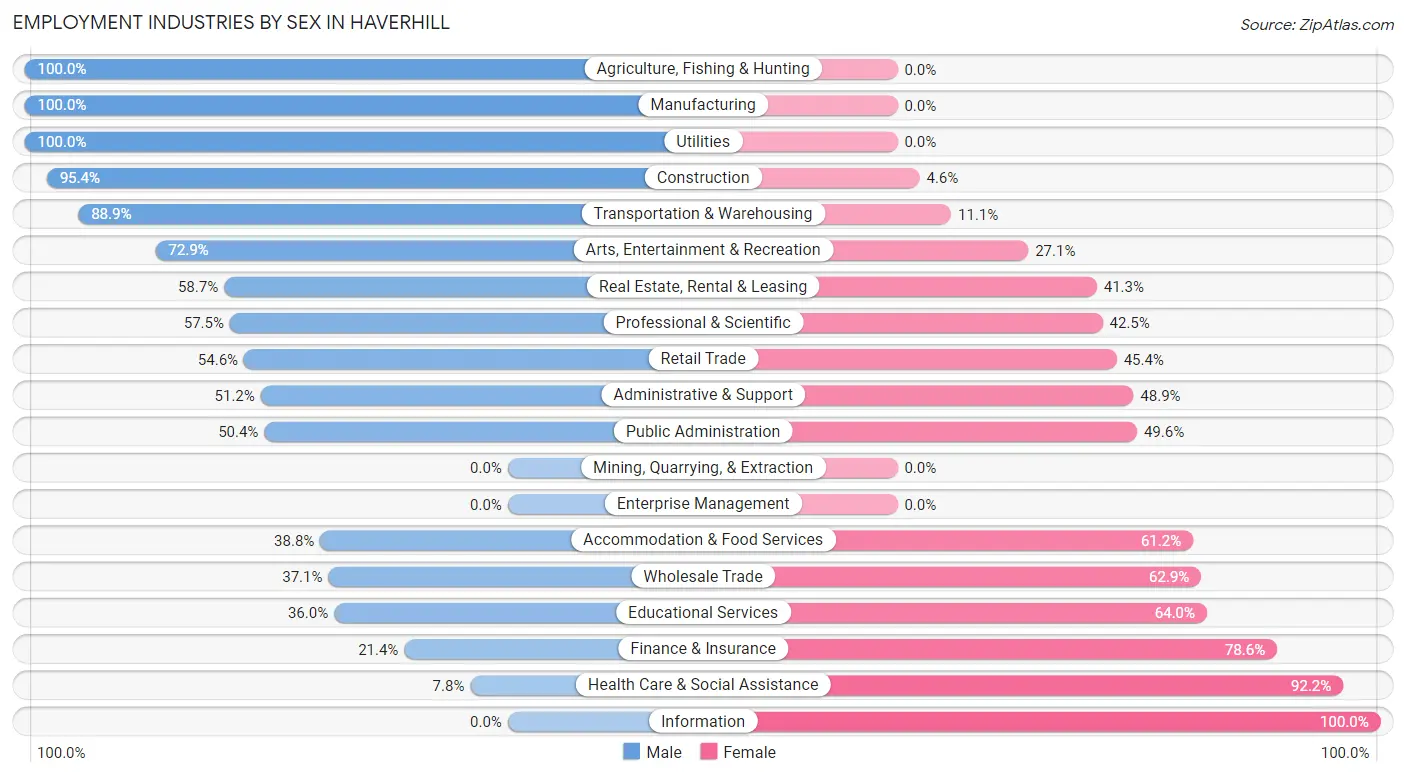
Employment Industries by Sex in Haverhill
The Haverhill industries that see more men than women are Agriculture, Fishing & Hunting (100.0%), Manufacturing (100.0%), and Utilities (100.0%), whereas the industries that tend to have a higher number of women are Information (100.0%), Health Care & Social Assistance (92.2%), and Finance & Insurance (78.6%).
| Industry | Male | Female |
| Agriculture, Fishing & Hunting | 4 (100.0%) | 0 (0.0%) |
| Mining, Quarrying, & Extraction | 0 (0.0%) | 0 (0.0%) |
| Construction | 146 (95.4%) | 7 (4.6%) |
| Manufacturing | 41 (100.0%) | 0 (0.0%) |
| Wholesale Trade | 26 (37.1%) | 44 (62.9%) |
| Retail Trade | 77 (54.6%) | 64 (45.4%) |
| Transportation & Warehousing | 24 (88.9%) | 3 (11.1%) |
| Utilities | 8 (100.0%) | 0 (0.0%) |
| Information | 0 (0.0%) | 9 (100.0%) |
| Finance & Insurance | 9 (21.4%) | 33 (78.6%) |
| Real Estate, Rental & Leasing | 37 (58.7%) | 26 (41.3%) |
| Professional & Scientific | 42 (57.5%) | 31 (42.5%) |
| Enterprise Management | 0 (0.0%) | 0 (0.0%) |
| Administrative & Support | 67 (51.1%) | 64 (48.8%) |
| Educational Services | 32 (36.0%) | 57 (64.0%) |
| Health Care & Social Assistance | 18 (7.8%) | 214 (92.2%) |
| Arts, Entertainment & Recreation | 35 (72.9%) | 13 (27.1%) |
| Accommodation & Food Services | 40 (38.8%) | 63 (61.2%) |
| Public Administration | 61 (50.4%) | 60 (49.6%) |
| Total | 716 (50.2%) | 710 (49.8%) |
Education in Haverhill
School Enrollment in Haverhill
The most common levels of schooling among the 954 students in Haverhill are high school (265 | 27.8%), middle school (218 | 22.9%), and elementary school (197 | 20.6%).
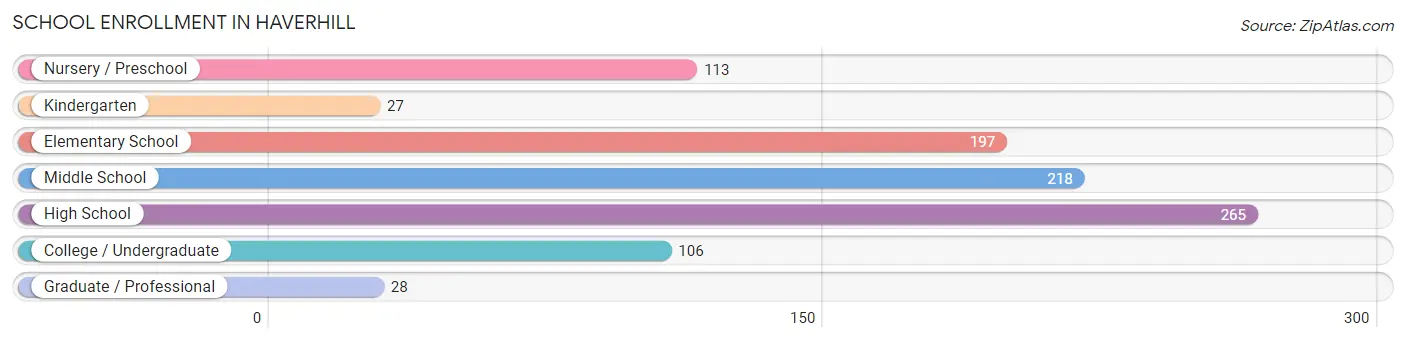
| School Level | # Students | % Students |
| Nursery / Preschool | 113 | 11.8% |
| Kindergarten | 27 | 2.8% |
| Elementary School | 197 | 20.6% |
| Middle School | 218 | 22.9% |
| High School | 265 | 27.8% |
| College / Undergraduate | 106 | 11.1% |
| Graduate / Professional | 28 | 2.9% |
| Total | 954 | 100.0% |
School Enrollment by Age by Funding Source in Haverhill
Out of a total of 954 students who are enrolled in schools in Haverhill, 159 (16.7%) attend a private institution, while the remaining 795 (83.3%) are enrolled in public schools. The age group of 3 to 4 year olds has the highest likelihood of being enrolled in private schools, with 57 (63.3% in the age bracket) enrolled. Conversely, the age group of 18 to 19 year olds has the lowest likelihood of being enrolled in a private school, with 114 (100.0% in the age bracket) attending a public institution.
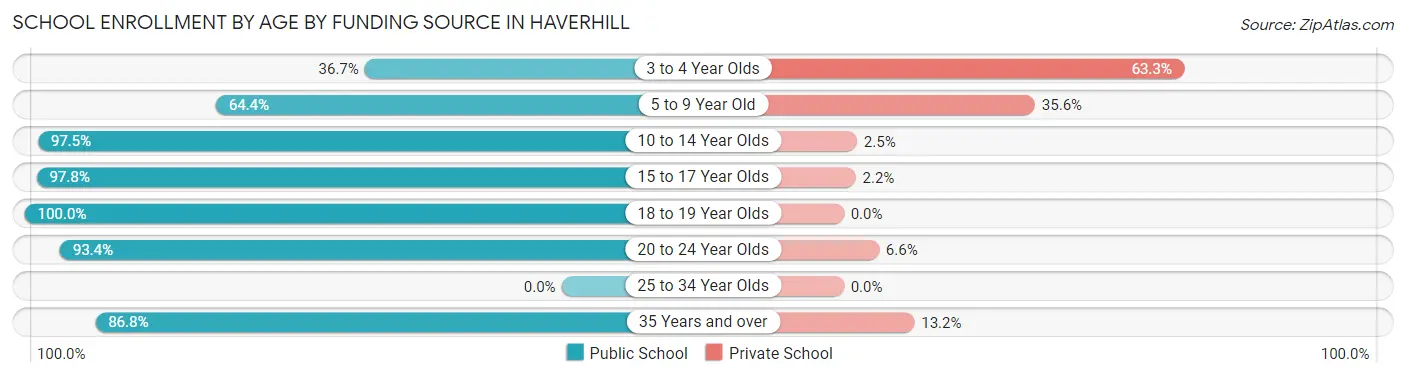
| Age Bracket | Public School | Private School |
| 3 to 4 Year Olds | 33 (36.7%) | 57 (63.3%) |
| 5 to 9 Year Old | 150 (64.4%) | 83 (35.6%) |
| 10 to 14 Year Olds | 276 (97.5%) | 7 (2.5%) |
| 15 to 17 Year Olds | 132 (97.8%) | 3 (2.2%) |
| 18 to 19 Year Olds | 114 (100.0%) | 0 (0.0%) |
| 20 to 24 Year Olds | 57 (93.4%) | 4 (6.6%) |
| 25 to 34 Year Olds | 0 (0.0%) | 0 (0.0%) |
| 35 Years and over | 33 (86.8%) | 5 (13.2%) |
| Total | 795 (83.3%) | 159 (16.7%) |
Educational Attainment by Field of Study in Haverhill
Business (157 | 33.1%), education (72 | 15.2%), arts & humanities (55 | 11.6%), social sciences (48 | 10.1%), and science & technology (38 | 8.0%) are the most common fields of study among 474 individuals in Haverhill who have obtained a bachelor's degree or higher.
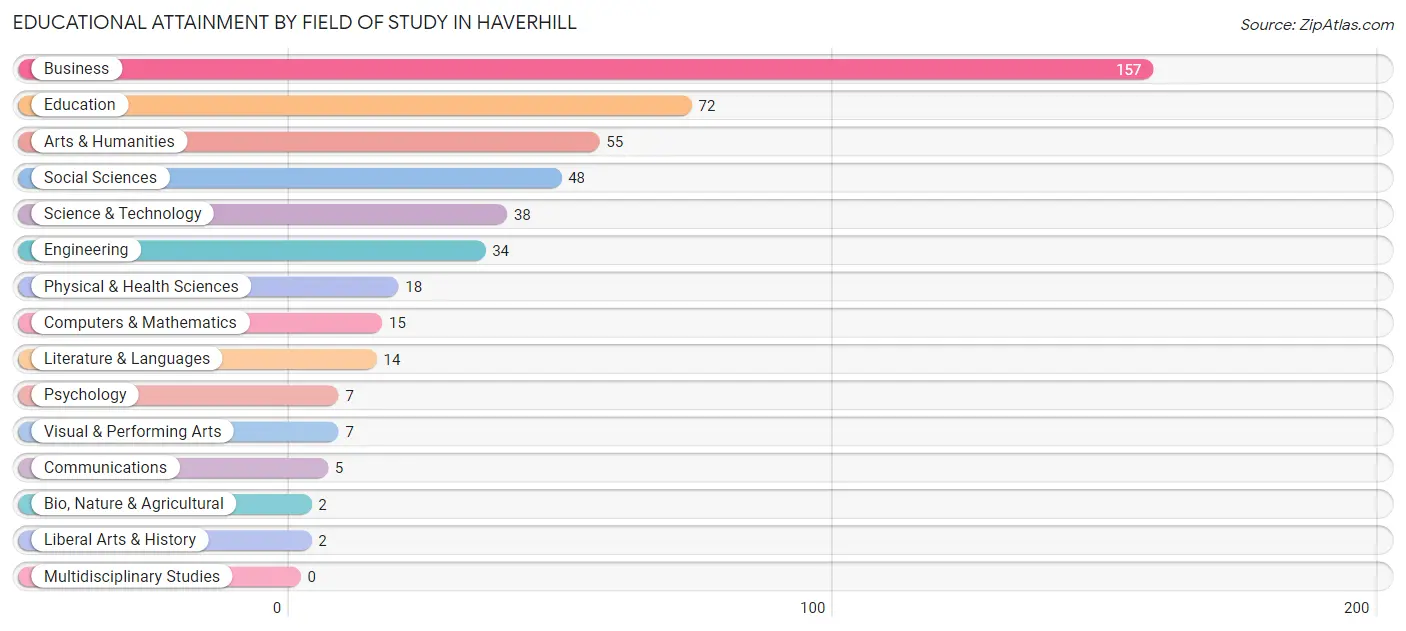
| Field of Study | # Graduates | % Graduates |
| Computers & Mathematics | 15 | 3.2% |
| Bio, Nature & Agricultural | 2 | 0.4% |
| Physical & Health Sciences | 18 | 3.8% |
| Psychology | 7 | 1.5% |
| Social Sciences | 48 | 10.1% |
| Engineering | 34 | 7.2% |
| Multidisciplinary Studies | 0 | 0.0% |
| Science & Technology | 38 | 8.0% |
| Business | 157 | 33.1% |
| Education | 72 | 15.2% |
| Literature & Languages | 14 | 2.9% |
| Liberal Arts & History | 2 | 0.4% |
| Visual & Performing Arts | 7 | 1.5% |
| Communications | 5 | 1.1% |
| Arts & Humanities | 55 | 11.6% |
| Total | 474 | 100.0% |
Transportation & Commute in Haverhill
Vehicle Availability by Sex in Haverhill
The most prevalent vehicle ownership categories in Haverhill are males with 3 vehicles (284, accounting for 39.7%) and females with 3 vehicles (223, making up 40.1%).
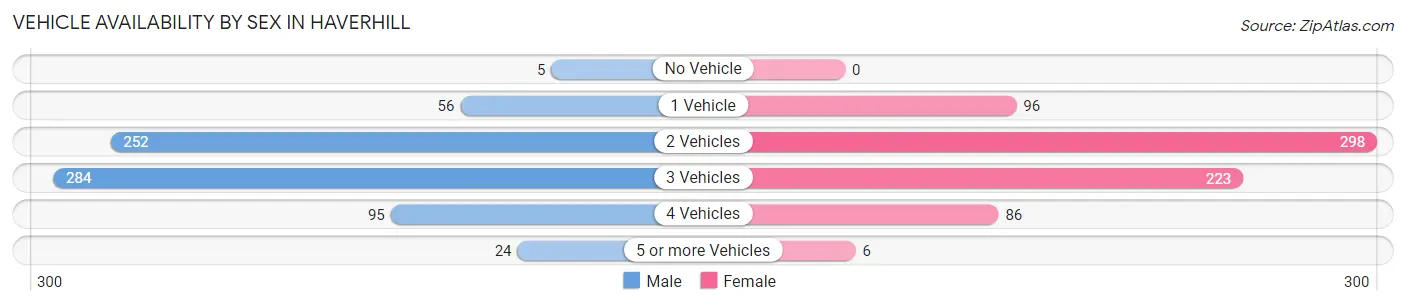
| Vehicles Available | Male | Female |
| No Vehicle | 5 (0.7%) | 0 (0.0%) |
| 1 Vehicle | 56 (7.8%) | 96 (13.5%) |
| 2 Vehicles | 252 (35.2%) | 298 (42.0%) |
| 3 Vehicles | 284 (39.7%) | 223 (31.5%) |
| 4 Vehicles | 95 (13.3%) | 86 (12.1%) |
| 5 or more Vehicles | 24 (3.4%) | 6 (0.9%) |
| Total | 716 (100.0%) | 709 (100.0%) |
Commute Time in Haverhill
The most frequently occuring commute durations in Haverhill are 15 to 19 minutes (263 commuters, 19.3%), 30 to 34 minutes (253 commuters, 18.5%), and 20 to 24 minutes (235 commuters, 17.2%).
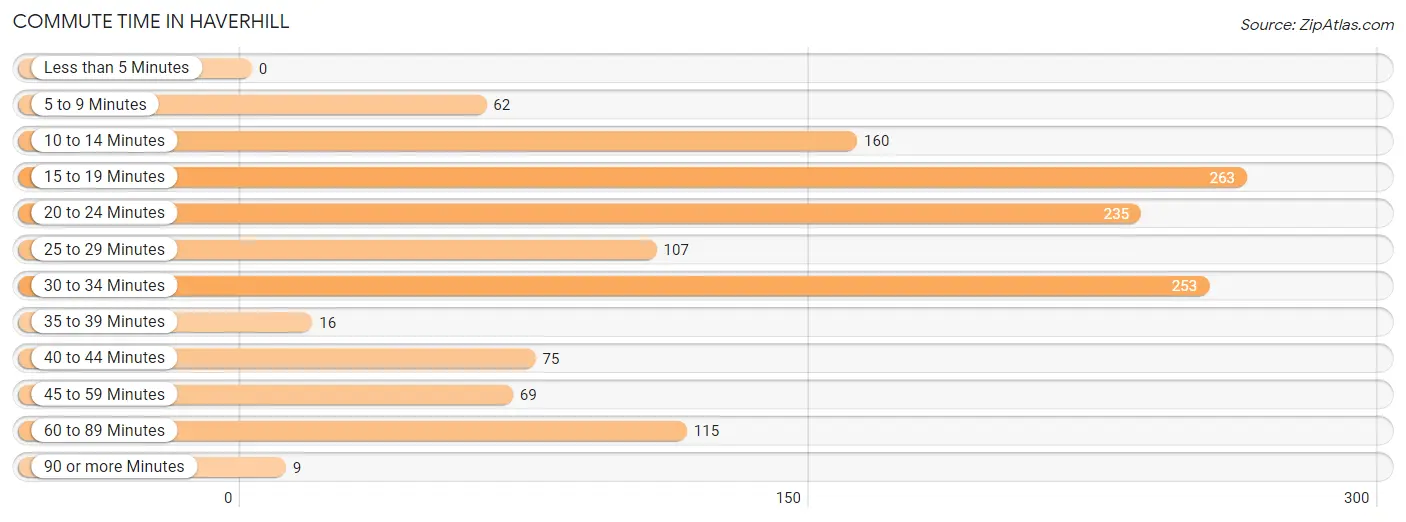
| Commute Time | # Commuters | % Commuters |
| Less than 5 Minutes | 0 | 0.0% |
| 5 to 9 Minutes | 62 | 4.5% |
| 10 to 14 Minutes | 160 | 11.7% |
| 15 to 19 Minutes | 263 | 19.3% |
| 20 to 24 Minutes | 235 | 17.2% |
| 25 to 29 Minutes | 107 | 7.8% |
| 30 to 34 Minutes | 253 | 18.5% |
| 35 to 39 Minutes | 16 | 1.2% |
| 40 to 44 Minutes | 75 | 5.5% |
| 45 to 59 Minutes | 69 | 5.1% |
| 60 to 89 Minutes | 115 | 8.4% |
| 90 or more Minutes | 9 | 0.7% |
Commute Time by Sex in Haverhill
The most common commute times in Haverhill are 15 to 19 minutes (153 commuters, 22.3%) for males and 20 to 24 minutes (144 commuters, 21.3%) for females.
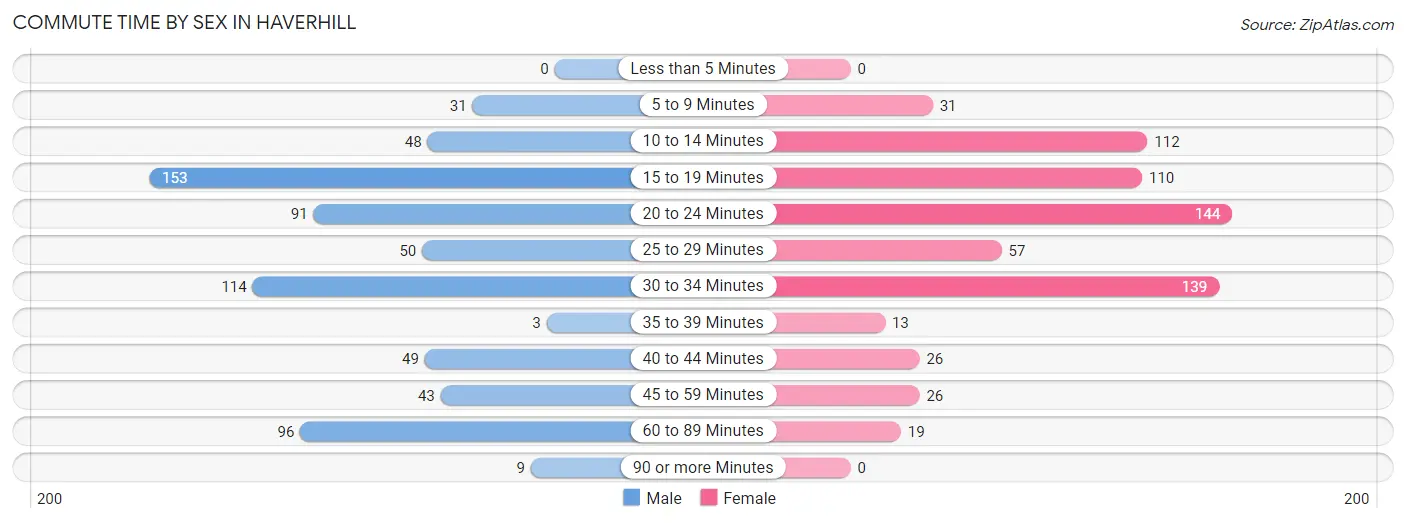
| Commute Time | Male | Female |
| Less than 5 Minutes | 0 (0.0%) | 0 (0.0%) |
| 5 to 9 Minutes | 31 (4.5%) | 31 (4.6%) |
| 10 to 14 Minutes | 48 (7.0%) | 112 (16.5%) |
| 15 to 19 Minutes | 153 (22.3%) | 110 (16.3%) |
| 20 to 24 Minutes | 91 (13.3%) | 144 (21.3%) |
| 25 to 29 Minutes | 50 (7.3%) | 57 (8.4%) |
| 30 to 34 Minutes | 114 (16.6%) | 139 (20.5%) |
| 35 to 39 Minutes | 3 (0.4%) | 13 (1.9%) |
| 40 to 44 Minutes | 49 (7.1%) | 26 (3.8%) |
| 45 to 59 Minutes | 43 (6.3%) | 26 (3.8%) |
| 60 to 89 Minutes | 96 (14.0%) | 19 (2.8%) |
| 90 or more Minutes | 9 (1.3%) | 0 (0.0%) |
Time of Departure to Work by Sex in Haverhill
The most frequent times of departure to work in Haverhill are 7:00 AM to 7:29 AM (106, 15.4%) for males and 6:00 AM to 6:29 AM (120, 17.7%) for females.
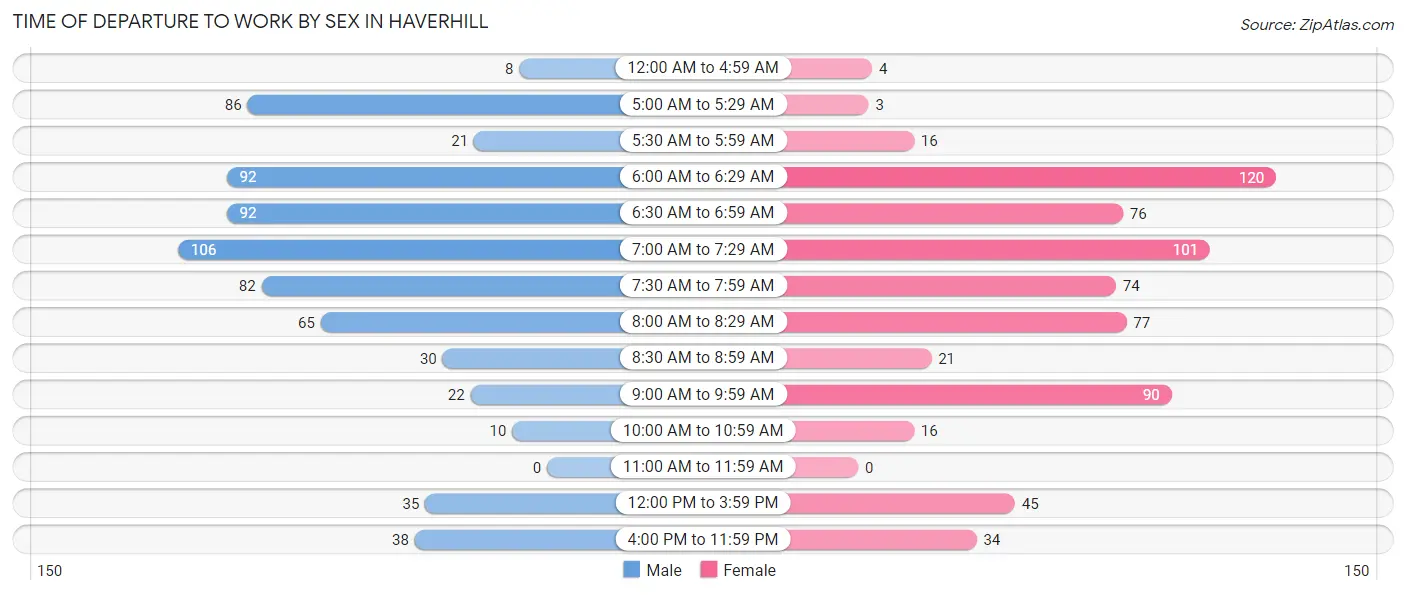
| Time of Departure | Male | Female |
| 12:00 AM to 4:59 AM | 8 (1.2%) | 4 (0.6%) |
| 5:00 AM to 5:29 AM | 86 (12.5%) | 3 (0.4%) |
| 5:30 AM to 5:59 AM | 21 (3.1%) | 16 (2.4%) |
| 6:00 AM to 6:29 AM | 92 (13.4%) | 120 (17.7%) |
| 6:30 AM to 6:59 AM | 92 (13.4%) | 76 (11.2%) |
| 7:00 AM to 7:29 AM | 106 (15.4%) | 101 (14.9%) |
| 7:30 AM to 7:59 AM | 82 (11.9%) | 74 (10.9%) |
| 8:00 AM to 8:29 AM | 65 (9.5%) | 77 (11.4%) |
| 8:30 AM to 8:59 AM | 30 (4.4%) | 21 (3.1%) |
| 9:00 AM to 9:59 AM | 22 (3.2%) | 90 (13.3%) |
| 10:00 AM to 10:59 AM | 10 (1.5%) | 16 (2.4%) |
| 11:00 AM to 11:59 AM | 0 (0.0%) | 0 (0.0%) |
| 12:00 PM to 3:59 PM | 35 (5.1%) | 45 (6.7%) |
| 4:00 PM to 11:59 PM | 38 (5.5%) | 34 (5.0%) |
| Total | 687 (100.0%) | 677 (100.0%) |
Housing Occupancy in Haverhill
Occupancy by Ownership in Haverhill
Of the total 826 dwellings in Haverhill, owner-occupied units account for 633 (76.6%), while renter-occupied units make up 193 (23.4%).
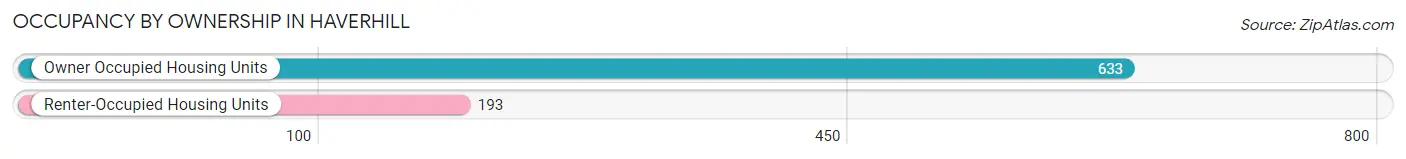
| Occupancy | # Housing Units | % Housing Units |
| Owner Occupied Housing Units | 633 | 76.6% |
| Renter-Occupied Housing Units | 193 | 23.4% |
| Total Occupied Housing Units | 826 | 100.0% |
Occupancy by Household Size in Haverhill
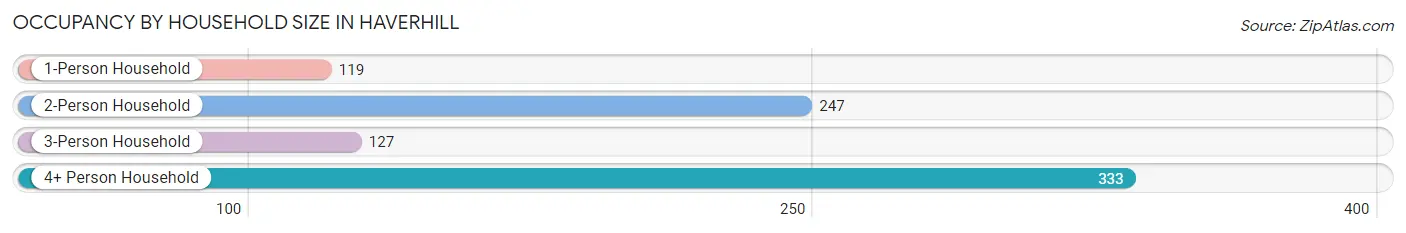
| Household Size | # Housing Units | % Housing Units |
| 1-Person Household | 119 | 14.4% |
| 2-Person Household | 247 | 29.9% |
| 3-Person Household | 127 | 15.4% |
| 4+ Person Household | 333 | 40.3% |
| Total Housing Units | 826 | 100.0% |
Occupancy by Ownership by Household Size in Haverhill
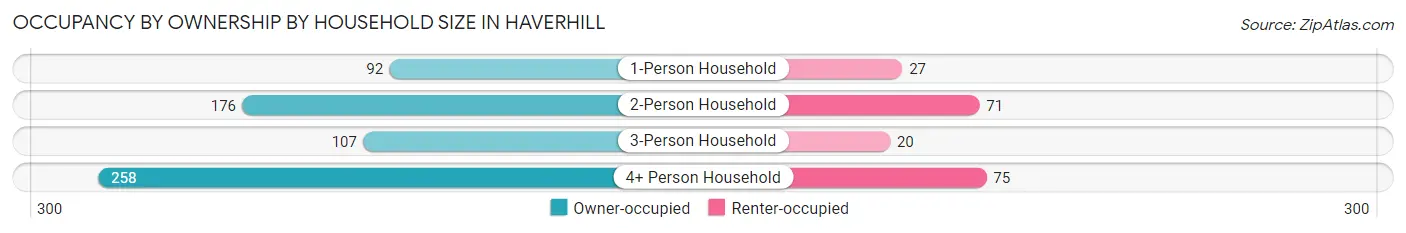
| Household Size | Owner-occupied | Renter-occupied |
| 1-Person Household | 92 (77.3%) | 27 (22.7%) |
| 2-Person Household | 176 (71.3%) | 71 (28.7%) |
| 3-Person Household | 107 (84.3%) | 20 (15.8%) |
| 4+ Person Household | 258 (77.5%) | 75 (22.5%) |
| Total Housing Units | 633 (76.6%) | 193 (23.4%) |
Occupancy by Educational Attainment in Haverhill
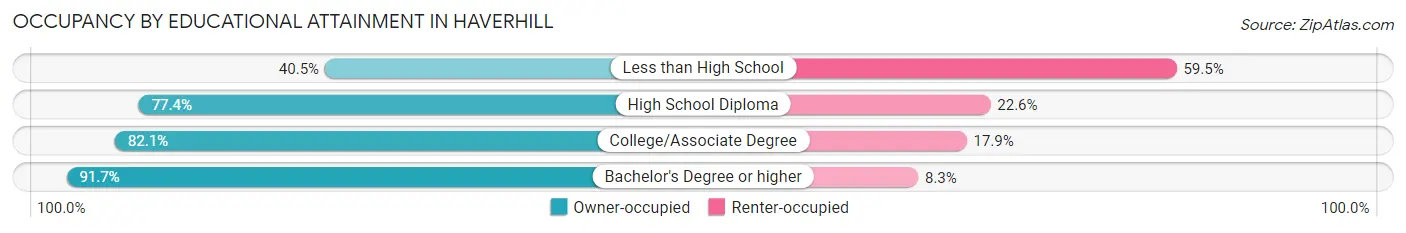
| Household Size | Owner-occupied | Renter-occupied |
| Less than High School | 53 (40.5%) | 78 (59.5%) |
| High School Diploma | 205 (77.4%) | 60 (22.6%) |
| College/Associate Degree | 165 (82.1%) | 36 (17.9%) |
| Bachelor's Degree or higher | 210 (91.7%) | 19 (8.3%) |
Occupancy by Age of Householder in Haverhill
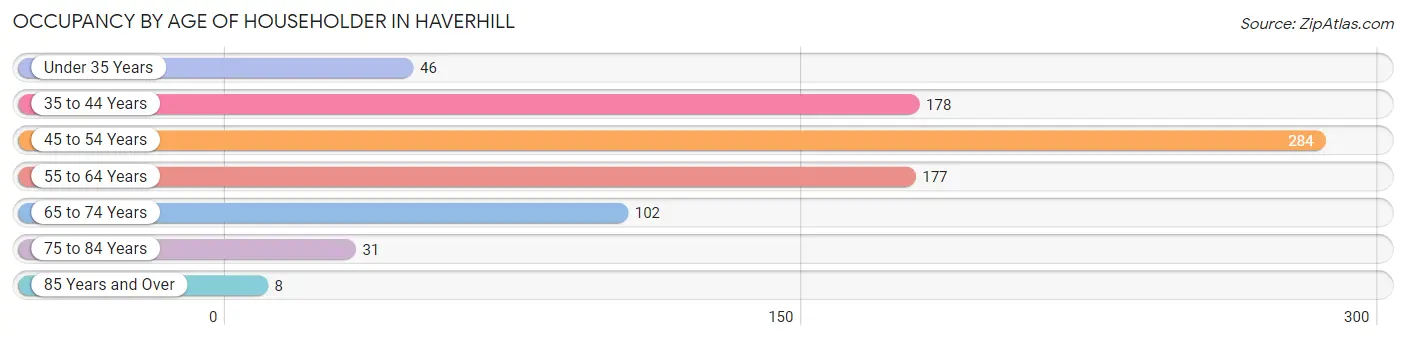
| Age Bracket | # Households | % Households |
| Under 35 Years | 46 | 5.6% |
| 35 to 44 Years | 178 | 21.5% |
| 45 to 54 Years | 284 | 34.4% |
| 55 to 64 Years | 177 | 21.4% |
| 65 to 74 Years | 102 | 12.3% |
| 75 to 84 Years | 31 | 3.7% |
| 85 Years and Over | 8 | 1.0% |
| Total | 826 | 100.0% |
Housing Finances in Haverhill
Median Income by Occupancy in Haverhill
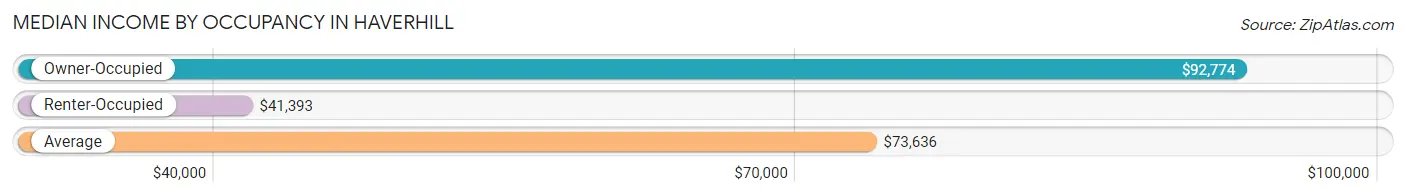
| Occupancy Type | # Households | Median Income |
| Owner-Occupied | 633 (76.6%) | $92,774 |
| Renter-Occupied | 193 (23.4%) | $41,393 |
| Average | 826 (100.0%) | $73,636 |
Occupancy by Householder Income Bracket in Haverhill
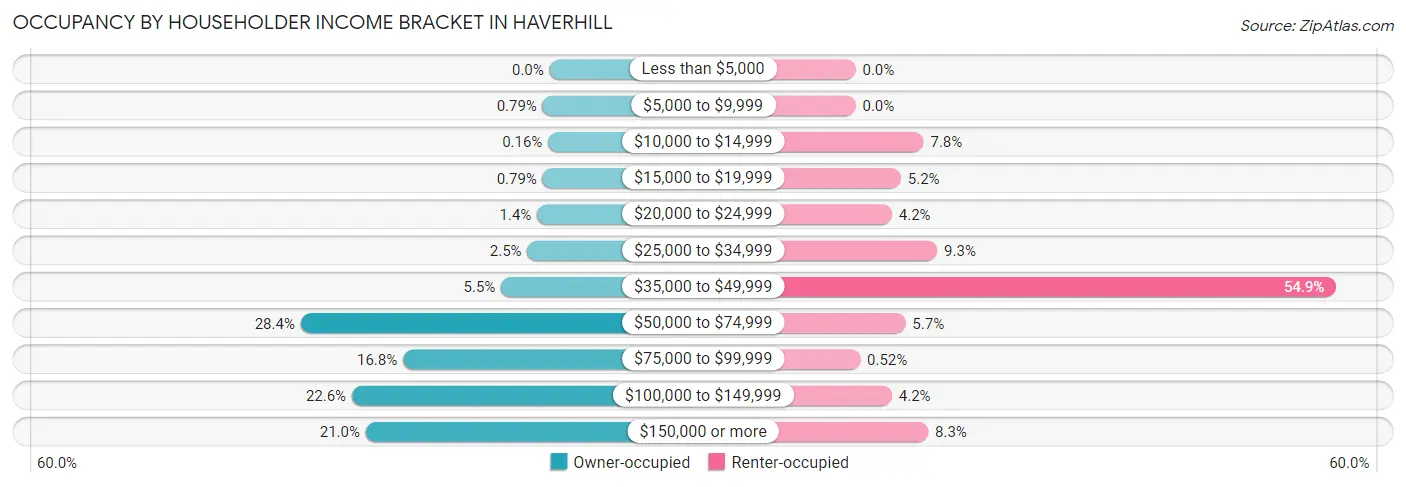
| Income Bracket | Owner-occupied | Renter-occupied |
| Less than $5,000 | 0 (0.0%) | 0 (0.0%) |
| $5,000 to $9,999 | 5 (0.8%) | 0 (0.0%) |
| $10,000 to $14,999 | 1 (0.2%) | 15 (7.8%) |
| $15,000 to $19,999 | 5 (0.8%) | 10 (5.2%) |
| $20,000 to $24,999 | 9 (1.4%) | 8 (4.2%) |
| $25,000 to $34,999 | 16 (2.5%) | 18 (9.3%) |
| $35,000 to $49,999 | 35 (5.5%) | 106 (54.9%) |
| $50,000 to $74,999 | 180 (28.4%) | 11 (5.7%) |
| $75,000 to $99,999 | 106 (16.8%) | 1 (0.5%) |
| $100,000 to $149,999 | 143 (22.6%) | 8 (4.2%) |
| $150,000 or more | 133 (21.0%) | 16 (8.3%) |
| Total | 633 (100.0%) | 193 (100.0%) |
Monthly Housing Cost Tiers in Haverhill
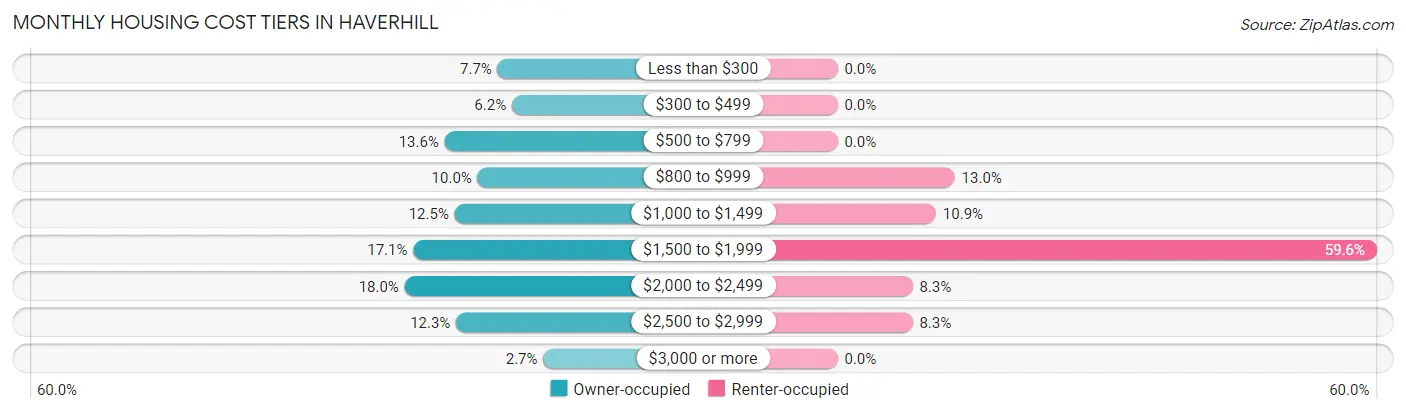
| Monthly Cost | Owner-occupied | Renter-occupied |
| Less than $300 | 49 (7.7%) | 0 (0.0%) |
| $300 to $499 | 39 (6.2%) | 0 (0.0%) |
| $500 to $799 | 86 (13.6%) | 0 (0.0%) |
| $800 to $999 | 63 (10.0%) | 25 (13.0%) |
| $1,000 to $1,499 | 79 (12.5%) | 21 (10.9%) |
| $1,500 to $1,999 | 108 (17.1%) | 115 (59.6%) |
| $2,000 to $2,499 | 114 (18.0%) | 16 (8.3%) |
| $2,500 to $2,999 | 78 (12.3%) | 16 (8.3%) |
| $3,000 or more | 17 (2.7%) | 0 (0.0%) |
| Total | 633 (100.0%) | 193 (100.0%) |
Physical Housing Characteristics in Haverhill
Housing Structures in Haverhill
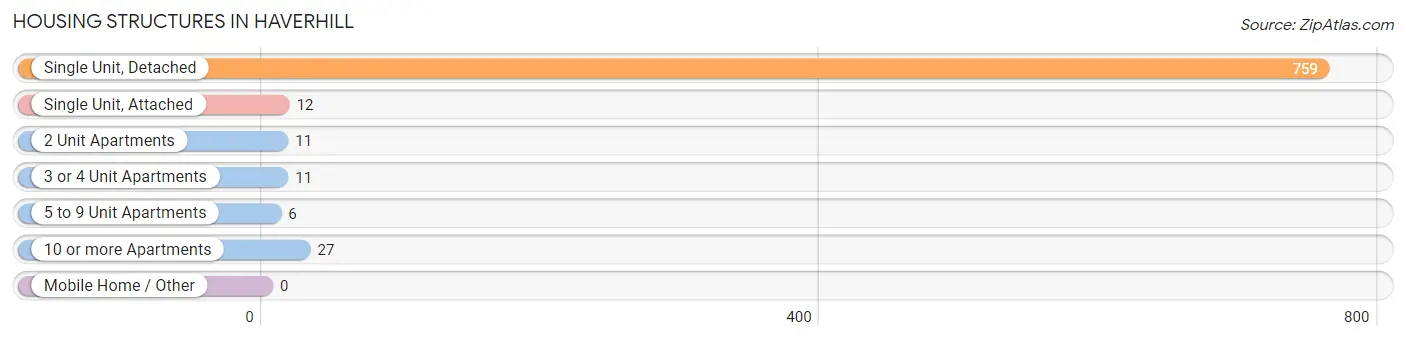
| Structure Type | # Housing Units | % Housing Units |
| Single Unit, Detached | 759 | 91.9% |
| Single Unit, Attached | 12 | 1.5% |
| 2 Unit Apartments | 11 | 1.3% |
| 3 or 4 Unit Apartments | 11 | 1.3% |
| 5 to 9 Unit Apartments | 6 | 0.7% |
| 10 or more Apartments | 27 | 3.3% |
| Mobile Home / Other | 0 | 0.0% |
| Total | 826 | 100.0% |
Housing Structures by Occupancy in Haverhill
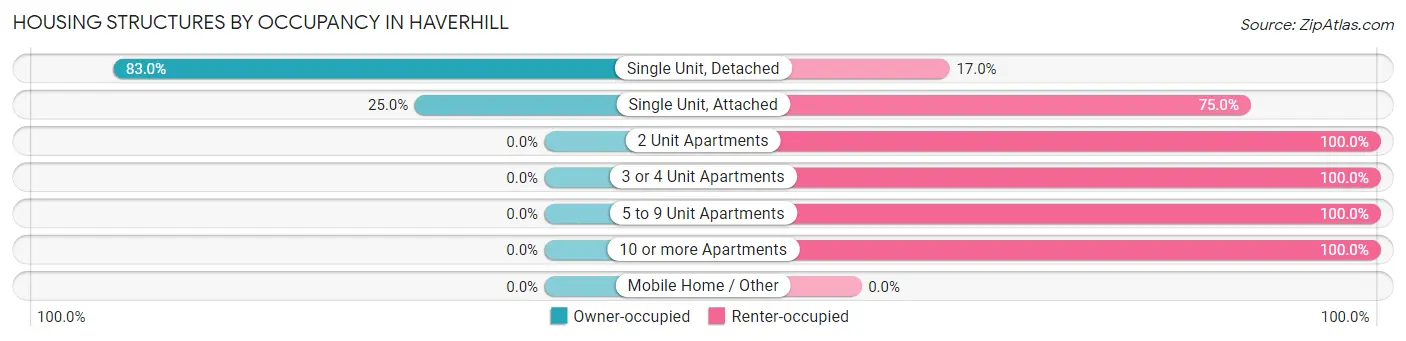
| Structure Type | Owner-occupied | Renter-occupied |
| Single Unit, Detached | 630 (83.0%) | 129 (17.0%) |
| Single Unit, Attached | 3 (25.0%) | 9 (75.0%) |
| 2 Unit Apartments | 0 (0.0%) | 11 (100.0%) |
| 3 or 4 Unit Apartments | 0 (0.0%) | 11 (100.0%) |
| 5 to 9 Unit Apartments | 0 (0.0%) | 6 (100.0%) |
| 10 or more Apartments | 0 (0.0%) | 27 (100.0%) |
| Mobile Home / Other | 0 (0.0%) | 0 (0.0%) |
| Total | 633 (76.6%) | 193 (23.4%) |
Housing Structures by Number of Rooms in Haverhill
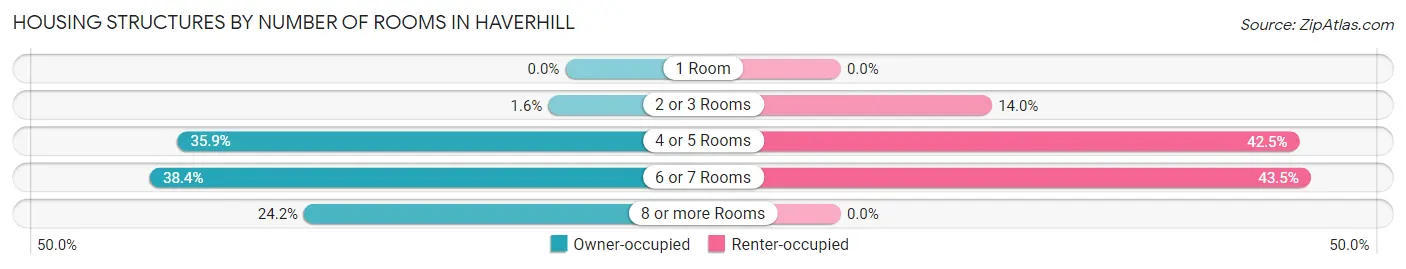
| Number of Rooms | Owner-occupied | Renter-occupied |
| 1 Room | 0 (0.0%) | 0 (0.0%) |
| 2 or 3 Rooms | 10 (1.6%) | 27 (14.0%) |
| 4 or 5 Rooms | 227 (35.9%) | 82 (42.5%) |
| 6 or 7 Rooms | 243 (38.4%) | 84 (43.5%) |
| 8 or more Rooms | 153 (24.2%) | 0 (0.0%) |
| Total | 633 (100.0%) | 193 (100.0%) |
Housing Structure by Heating Type in Haverhill
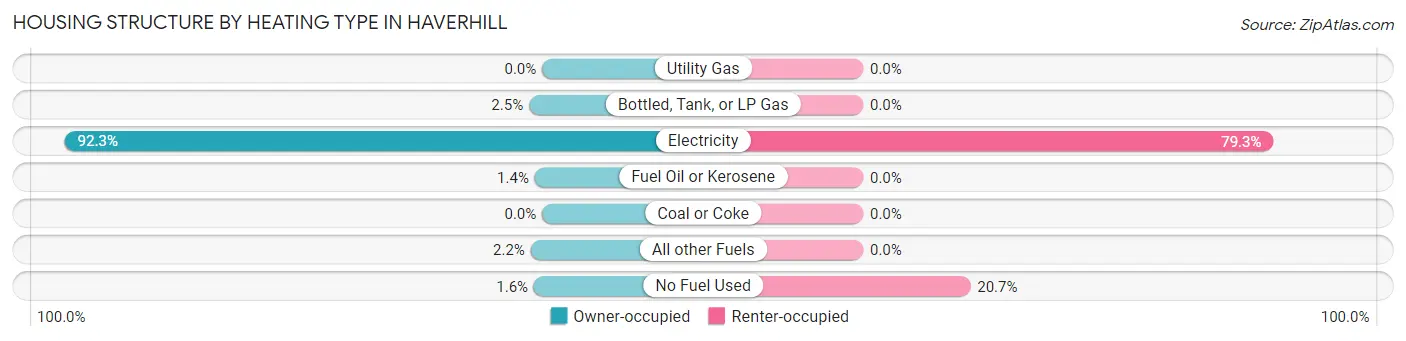
| Heating Type | Owner-occupied | Renter-occupied |
| Utility Gas | 0 (0.0%) | 0 (0.0%) |
| Bottled, Tank, or LP Gas | 16 (2.5%) | 0 (0.0%) |
| Electricity | 584 (92.3%) | 153 (79.3%) |
| Fuel Oil or Kerosene | 9 (1.4%) | 0 (0.0%) |
| Coal or Coke | 0 (0.0%) | 0 (0.0%) |
| All other Fuels | 14 (2.2%) | 0 (0.0%) |
| No Fuel Used | 10 (1.6%) | 40 (20.7%) |
| Total | 633 (100.0%) | 193 (100.0%) |
Household Vehicle Usage in Haverhill
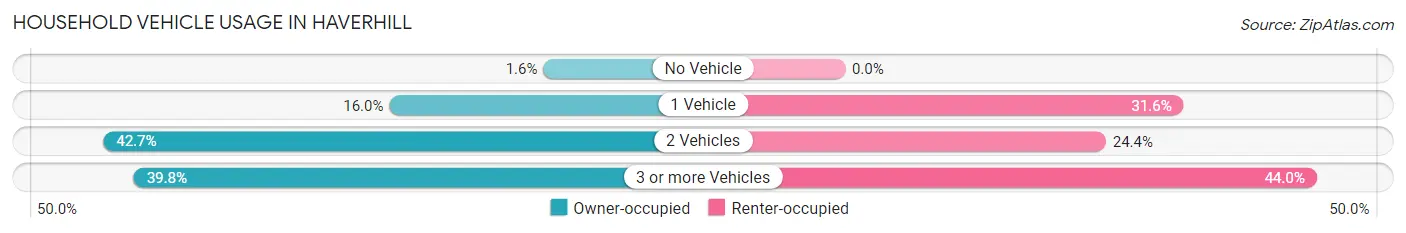
| Vehicles per Household | Owner-occupied | Renter-occupied |
| No Vehicle | 10 (1.6%) | 0 (0.0%) |
| 1 Vehicle | 101 (16.0%) | 61 (31.6%) |
| 2 Vehicles | 270 (42.6%) | 47 (24.3%) |
| 3 or more Vehicles | 252 (39.8%) | 85 (44.0%) |
| Total | 633 (100.0%) | 193 (100.0%) |
Real Estate & Mortgages in Haverhill
Real Estate and Mortgage Overview in Haverhill
| Characteristic | Without Mortgage | With Mortgage |
| Housing Units | 225 | 408 |
| Median Property Value | $280,300 | $328,100 |
| Median Household Income | $85,536 | $112 |
| Monthly Housing Costs | $678 | $17 |
| Real Estate Taxes | $2,982 | $16 |
Property Value by Mortgage Status in Haverhill
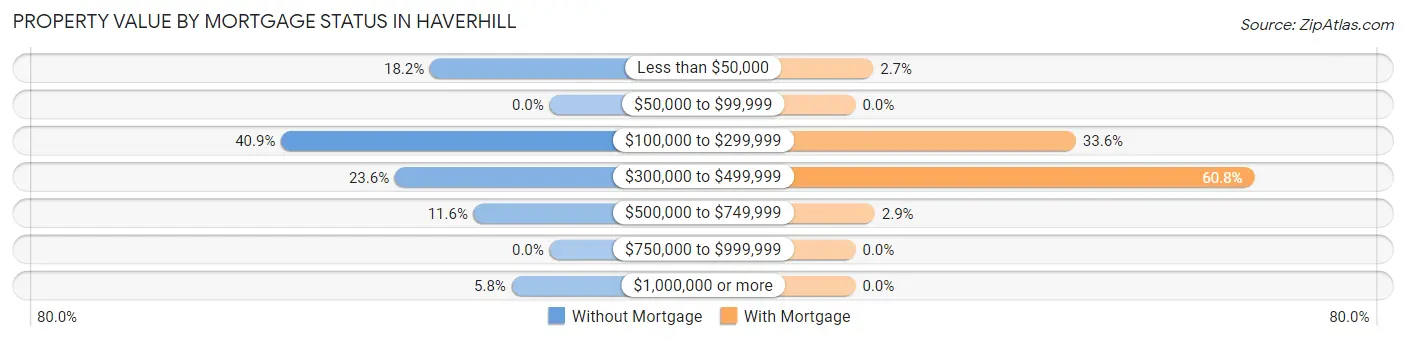
| Property Value | Without Mortgage | With Mortgage |
| Less than $50,000 | 41 (18.2%) | 11 (2.7%) |
| $50,000 to $99,999 | 0 (0.0%) | 0 (0.0%) |
| $100,000 to $299,999 | 92 (40.9%) | 137 (33.6%) |
| $300,000 to $499,999 | 53 (23.6%) | 248 (60.8%) |
| $500,000 to $749,999 | 26 (11.6%) | 12 (2.9%) |
| $750,000 to $999,999 | 0 (0.0%) | 0 (0.0%) |
| $1,000,000 or more | 13 (5.8%) | 0 (0.0%) |
| Total | 225 (100.0%) | 408 (100.0%) |
Household Income by Mortgage Status in Haverhill
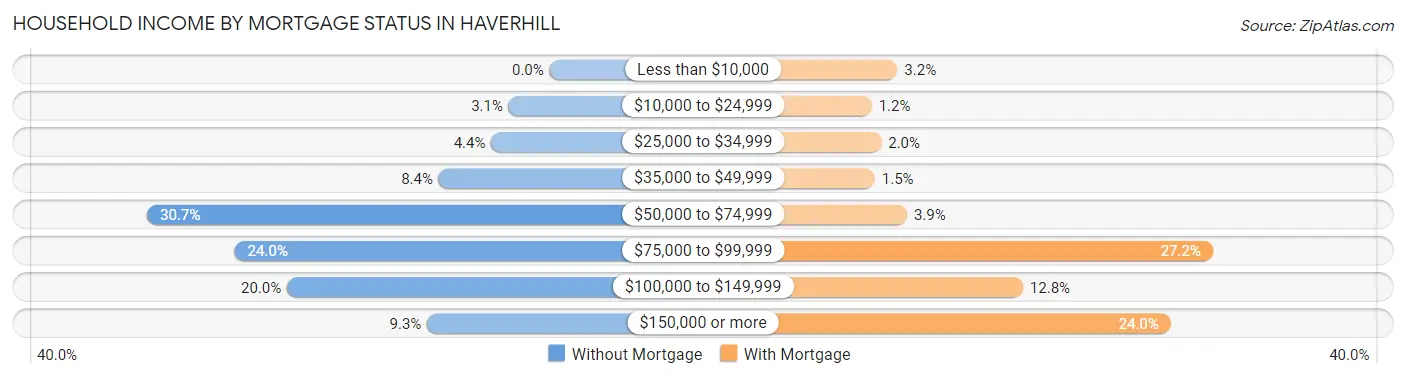
| Household Income | Without Mortgage | With Mortgage |
| Less than $10,000 | 0 (0.0%) | 13 (3.2%) |
| $10,000 to $24,999 | 7 (3.1%) | 5 (1.2%) |
| $25,000 to $34,999 | 10 (4.4%) | 8 (2.0%) |
| $35,000 to $49,999 | 19 (8.4%) | 6 (1.5%) |
| $50,000 to $74,999 | 69 (30.7%) | 16 (3.9%) |
| $75,000 to $99,999 | 54 (24.0%) | 111 (27.2%) |
| $100,000 to $149,999 | 45 (20.0%) | 52 (12.8%) |
| $150,000 or more | 21 (9.3%) | 98 (24.0%) |
| Total | 225 (100.0%) | 408 (100.0%) |
Property Value to Household Income Ratio in Haverhill
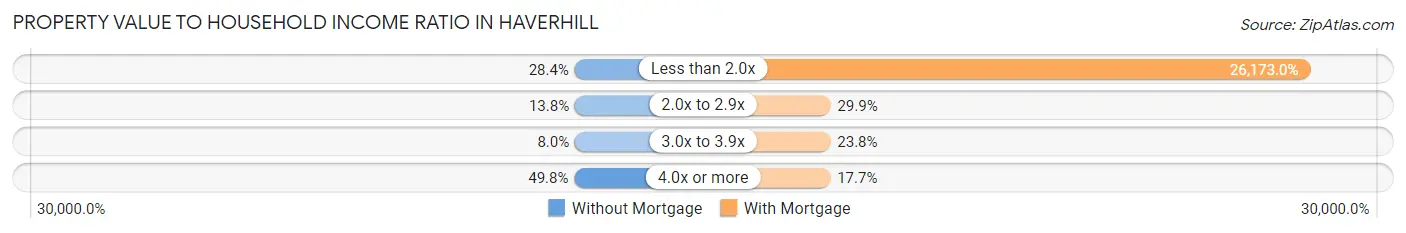
| Value-to-Income Ratio | Without Mortgage | With Mortgage |
| Less than 2.0x | 64 (28.4%) | 106,786 (26,173.0%) |
| 2.0x to 2.9x | 31 (13.8%) | 122 (29.9%) |
| 3.0x to 3.9x | 18 (8.0%) | 97 (23.8%) |
| 4.0x or more | 112 (49.8%) | 72 (17.6%) |
| Total | 225 (100.0%) | 408 (100.0%) |
Real Estate Taxes by Mortgage Status in Haverhill
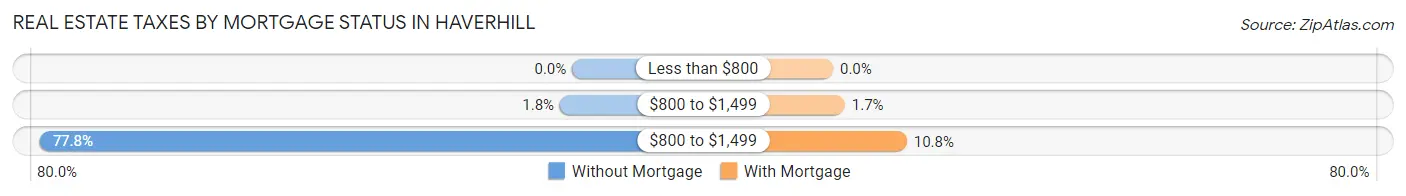
| Property Taxes | Without Mortgage | With Mortgage |
| Less than $800 | 0 (0.0%) | 0 (0.0%) |
| $800 to $1,499 | 4 (1.8%) | 7 (1.7%) |
| $800 to $1,499 | 175 (77.8%) | 44 (10.8%) |
| Total | 225 (100.0%) | 408 (100.0%) |
Health & Disability in Haverhill
Health Insurance Coverage by Age in Haverhill
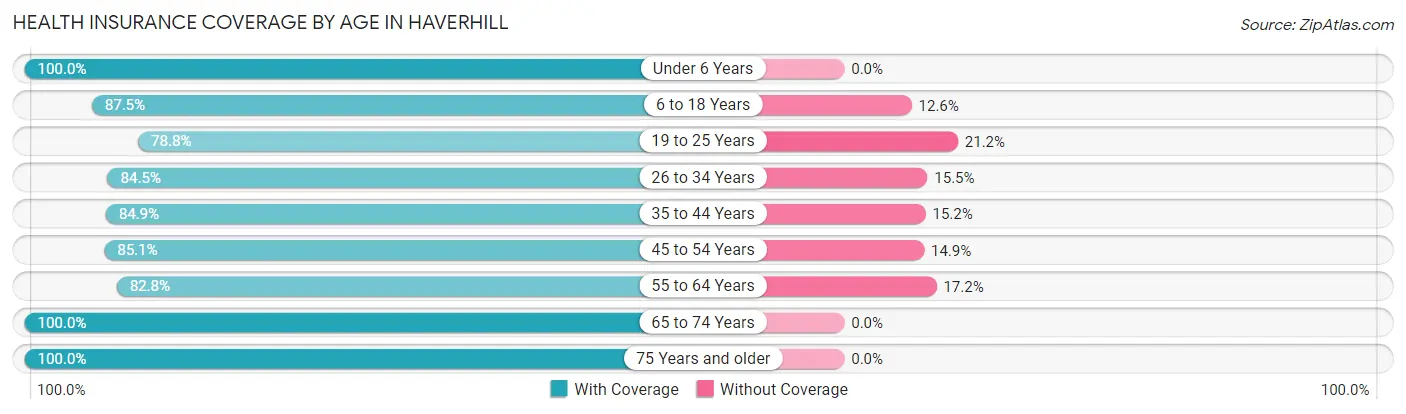
| Age Bracket | With Coverage | Without Coverage |
| Under 6 Years | 203 (100.0%) | 0 (0.0%) |
| 6 to 18 Years | 655 (87.5%) | 94 (12.6%) |
| 19 to 25 Years | 134 (78.8%) | 36 (21.2%) |
| 26 to 34 Years | 191 (84.5%) | 35 (15.5%) |
| 35 to 44 Years | 308 (84.9%) | 55 (15.1%) |
| 45 to 54 Years | 498 (85.1%) | 87 (14.9%) |
| 55 to 64 Years | 265 (82.8%) | 55 (17.2%) |
| 65 to 74 Years | 166 (100.0%) | 0 (0.0%) |
| 75 Years and older | 71 (100.0%) | 0 (0.0%) |
| Total | 2,491 (87.3%) | 362 (12.7%) |
Health Insurance Coverage by Citizenship Status in Haverhill
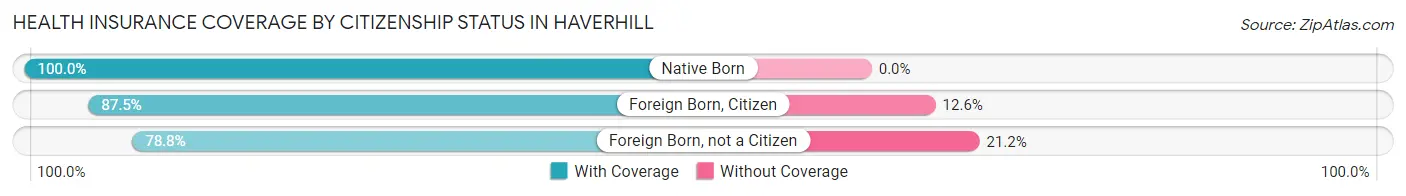
| Citizenship Status | With Coverage | Without Coverage |
| Native Born | 203 (100.0%) | 0 (0.0%) |
| Foreign Born, Citizen | 655 (87.5%) | 94 (12.6%) |
| Foreign Born, not a Citizen | 134 (78.8%) | 36 (21.2%) |
Health Insurance Coverage by Household Income in Haverhill
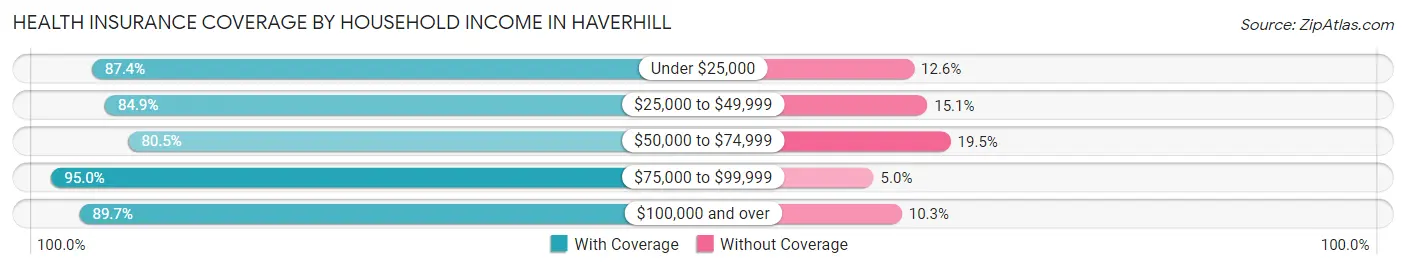
| Household Income | With Coverage | Without Coverage |
| Under $25,000 | 104 (87.4%) | 15 (12.6%) |
| $25,000 to $49,999 | 450 (84.9%) | 80 (15.1%) |
| $50,000 to $74,999 | 480 (80.5%) | 116 (19.5%) |
| $75,000 to $99,999 | 302 (95.0%) | 16 (5.0%) |
| $100,000 and over | 1,141 (89.7%) | 131 (10.3%) |
Public vs Private Health Insurance Coverage by Age in Haverhill
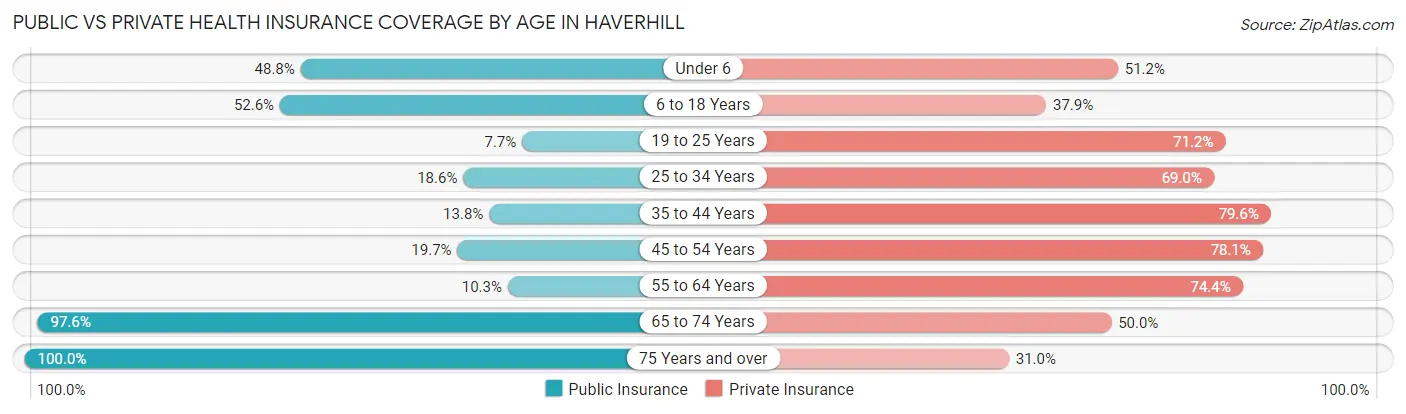
| Age Bracket | Public Insurance | Private Insurance |
| Under 6 | 99 (48.8%) | 104 (51.2%) |
| 6 to 18 Years | 394 (52.6%) | 284 (37.9%) |
| 19 to 25 Years | 13 (7.6%) | 121 (71.2%) |
| 25 to 34 Years | 42 (18.6%) | 156 (69.0%) |
| 35 to 44 Years | 50 (13.8%) | 289 (79.6%) |
| 45 to 54 Years | 115 (19.7%) | 457 (78.1%) |
| 55 to 64 Years | 33 (10.3%) | 238 (74.4%) |
| 65 to 74 Years | 162 (97.6%) | 83 (50.0%) |
| 75 Years and over | 71 (100.0%) | 22 (31.0%) |
| Total | 979 (34.3%) | 1,754 (61.5%) |
Disability Status by Sex by Age in Haverhill
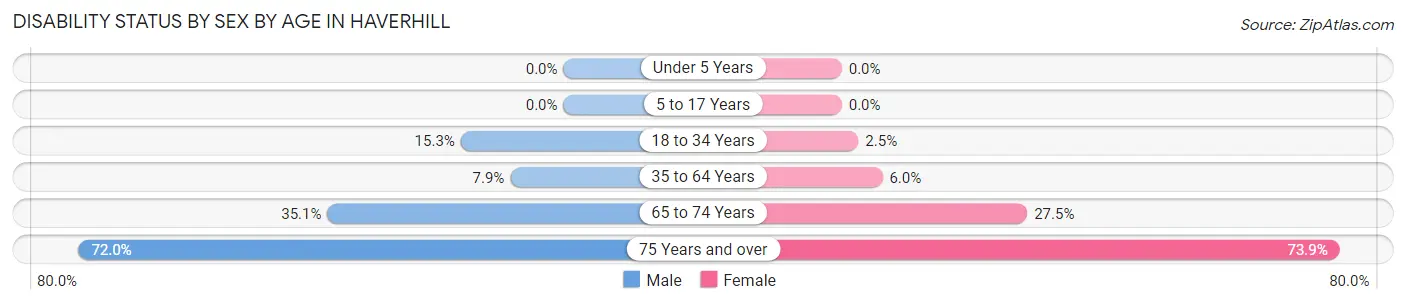
| Age Bracket | Male | Female |
| Under 5 Years | 0 (0.0%) | 0 (0.0%) |
| 5 to 17 Years | 0 (0.0%) | 0 (0.0%) |
| 18 to 34 Years | 34 (15.2%) | 7 (2.5%) |
| 35 to 64 Years | 53 (7.9%) | 36 (6.0%) |
| 65 to 74 Years | 34 (35.0%) | 19 (27.5%) |
| 75 Years and over | 18 (72.0%) | 34 (73.9%) |
Disability Class by Sex by Age in Haverhill
Disability Class: Hearing Difficulty
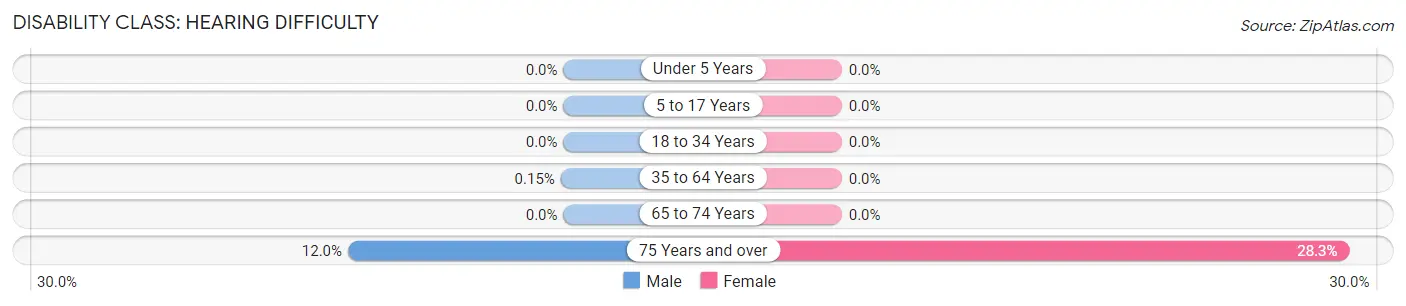
| Age Bracket | Male | Female |
| Under 5 Years | 0 (0.0%) | 0 (0.0%) |
| 5 to 17 Years | 0 (0.0%) | 0 (0.0%) |
| 18 to 34 Years | 0 (0.0%) | 0 (0.0%) |
| 35 to 64 Years | 1 (0.2%) | 0 (0.0%) |
| 65 to 74 Years | 0 (0.0%) | 0 (0.0%) |
| 75 Years and over | 3 (12.0%) | 13 (28.3%) |
Disability Class: Vision Difficulty
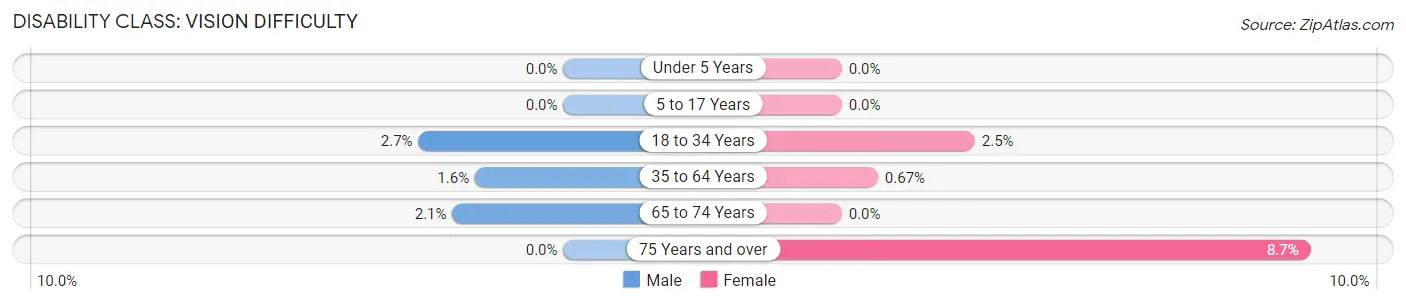
| Age Bracket | Male | Female |
| Under 5 Years | 0 (0.0%) | 0 (0.0%) |
| 5 to 17 Years | 0 (0.0%) | 0 (0.0%) |
| 18 to 34 Years | 6 (2.7%) | 7 (2.5%) |
| 35 to 64 Years | 11 (1.6%) | 4 (0.7%) |
| 65 to 74 Years | 2 (2.1%) | 0 (0.0%) |
| 75 Years and over | 0 (0.0%) | 4 (8.7%) |
Disability Class: Cognitive Difficulty
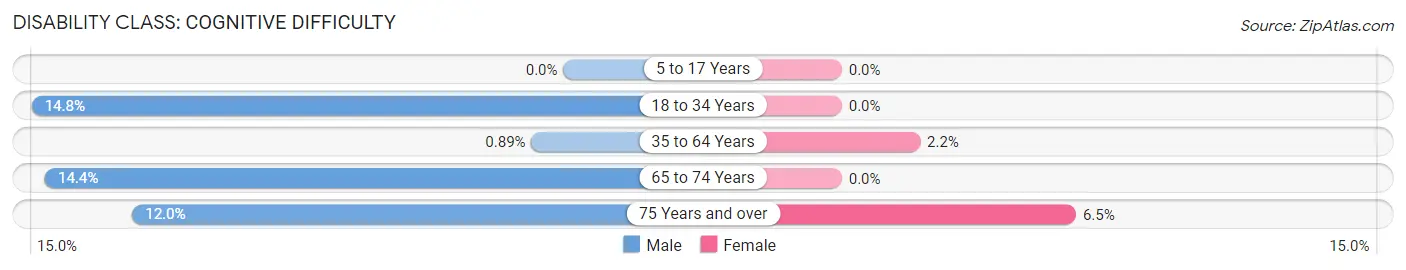
| Age Bracket | Male | Female |
| 5 to 17 Years | 0 (0.0%) | 0 (0.0%) |
| 18 to 34 Years | 33 (14.8%) | 0 (0.0%) |
| 35 to 64 Years | 6 (0.9%) | 13 (2.2%) |
| 65 to 74 Years | 14 (14.4%) | 0 (0.0%) |
| 75 Years and over | 3 (12.0%) | 3 (6.5%) |
Disability Class: Ambulatory Difficulty
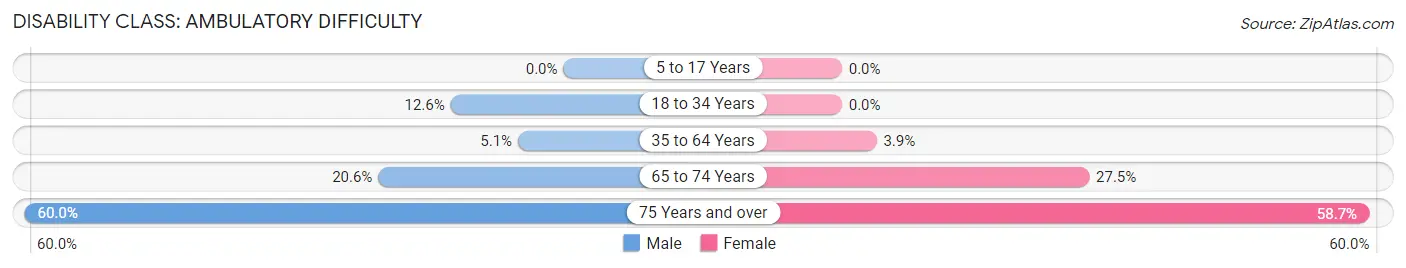
| Age Bracket | Male | Female |
| 5 to 17 Years | 0 (0.0%) | 0 (0.0%) |
| 18 to 34 Years | 28 (12.6%) | 0 (0.0%) |
| 35 to 64 Years | 34 (5.1%) | 23 (3.9%) |
| 65 to 74 Years | 20 (20.6%) | 19 (27.5%) |
| 75 Years and over | 15 (60.0%) | 27 (58.7%) |
Disability Class: Self-Care Difficulty
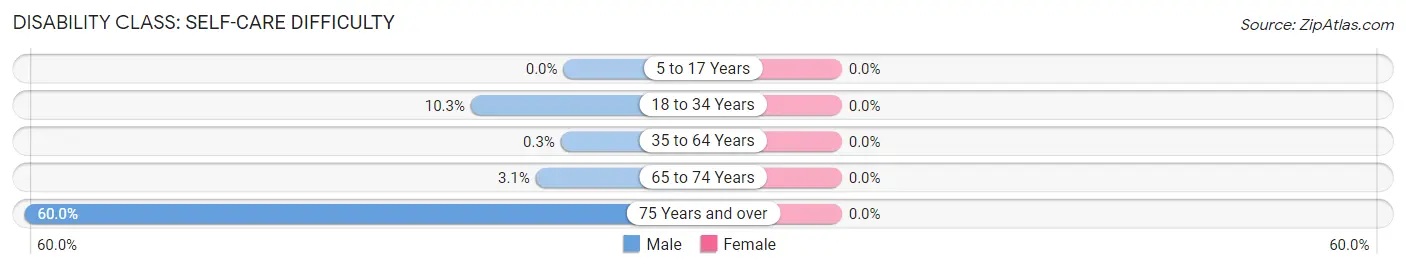
| Age Bracket | Male | Female |
| 5 to 17 Years | 0 (0.0%) | 0 (0.0%) |
| 18 to 34 Years | 23 (10.3%) | 0 (0.0%) |
| 35 to 64 Years | 2 (0.3%) | 0 (0.0%) |
| 65 to 74 Years | 3 (3.1%) | 0 (0.0%) |
| 75 Years and over | 15 (60.0%) | 0 (0.0%) |
Technology Access in Haverhill
Computing Device Access in Haverhill
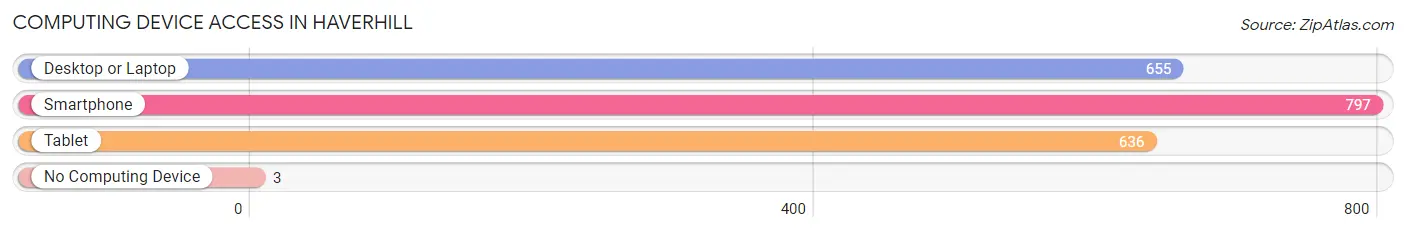
| Device Type | # Households | % Households |
| Desktop or Laptop | 655 | 79.3% |
| Smartphone | 797 | 96.5% |
| Tablet | 636 | 77.0% |
| No Computing Device | 3 | 0.4% |
| Total | 826 | 100.0% |
Internet Access in Haverhill
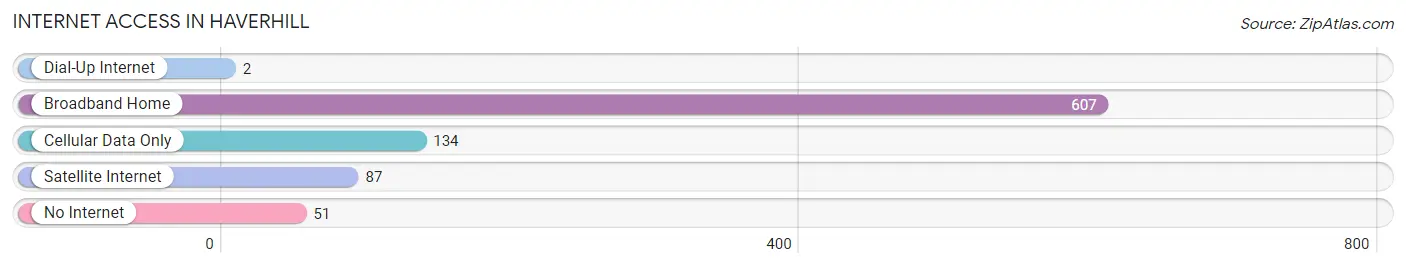
| Internet Type | # Households | % Households |
| Dial-Up Internet | 2 | 0.2% |
| Broadband Home | 607 | 73.5% |
| Cellular Data Only | 134 | 16.2% |
| Satellite Internet | 87 | 10.5% |
| No Internet | 51 | 6.2% |
| Total | 826 | 100.0% |
Haverhill Summary
Haverhill is a small unincorporated community located in Palm Beach County, Florida. It is located in the western part of the county, just south of the city of West Palm Beach. The population of Haverhill was estimated to be around 4,000 in 2020.
Geography
Haverhill is located in the western part of Palm Beach County, just south of the city of West Palm Beach. It is bordered by the cities of Lake Worth and Greenacres to the north, and the city of Boynton Beach to the south. The community is situated on the western edge of the Everglades, and is surrounded by a number of lakes and canals. The area is mostly flat, with some low hills in the northern part of the community.
Economy
Haverhill is primarily a residential community, with most of its residents employed in the nearby cities of West Palm Beach and Lake Worth. The community is home to a number of small businesses, including restaurants, convenience stores, and auto repair shops. The area is also home to a number of industrial and manufacturing businesses, including a large paper mill.
Demographics
Haverhill is a predominantly white community, with a population that is approximately 75% white and 25% African American. The median household income in the community is around $50,000, and the median home value is around $200,000. The unemployment rate in the community is around 5%, which is slightly lower than the national average.
History
Haverhill was first settled in the late 19th century by settlers from the Bahamas. The community was named after the town of Haverhill, Massachusetts, which was the hometown of one of the original settlers. The area was primarily used for farming and ranching, and the community remained relatively small until the 1950s, when the population began to grow rapidly. The community was officially incorporated in 1959, and has since grown to become a small but vibrant community.
Conclusion
Haverhill is a small unincorporated community located in Palm Beach County, Florida. It is a predominantly white community, with a population that is approximately 75% white and 25% African American. The community is primarily residential, with most of its residents employed in the nearby cities of West Palm Beach and Lake Worth. The area is also home to a number of small businesses, including restaurants, convenience stores, and auto repair shops. Haverhill has a long history, dating back to the late 19th century, and has grown to become a vibrant and diverse community.
Common Questions
What is Per Capita Income in Haverhill?
Per Capita income in Haverhill is $30,640.
What is the Median Family Income in Haverhill?
Median Family Income in Haverhill is $72,188.
What is the Median Household income in Haverhill?
Median Household Income in Haverhill is $73,636.
What is Income or Wage Gap in Haverhill?
Income or Wage Gap in Haverhill is 22.5%.
Women in Haverhill earn 77.5 cents for every dollar earned by a man.
What is Inequality or Gini Index in Haverhill?
Inequality or Gini Index in Haverhill is 0.39.
What is the Total Population of Haverhill?
Total Population of Haverhill is 2,859.
What is the Total Male Population of Haverhill?
Total Male Population of Haverhill is 1,353.
What is the Total Female Population of Haverhill?
Total Female Population of Haverhill is 1,506.
What is the Ratio of Males per 100 Females in Haverhill?
There are 89.84 Males per 100 Females in Haverhill.
What is the Ratio of Females per 100 Males in Haverhill?
There are 111.31 Females per 100 Males in Haverhill.
What is the Median Population Age in Haverhill?
Median Population Age in Haverhill is 37.2 Years.
What is the Average Family Size in Haverhill
Average Family Size in Haverhill is 3.7 People.
What is the Average Household Size in Haverhill
Average Household Size in Haverhill is 3.4 People.
How Large is the Labor Force in Haverhill?
There are 1,503 People in the Labor Forcein in Haverhill.
What is the Percentage of People in the Labor Force in Haverhill?
71.8% of People are in the Labor Force in Haverhill.
What is the Unemployment Rate in Haverhill?
Unemployment Rate in Haverhill is 4.7%.