Harbour Heights, FL Map & Demographics
Harbour Heights Map
Harbour Heights Overview
$34,401
PER CAPITA INCOME
$71,106
AVG FAMILY INCOME
$54,877
AVG HOUSEHOLD INCOME
18.4%
WAGE / INCOME GAP [ % ]
81.6¢/ $1
WAGE / INCOME GAP [ $ ]
0.44
INEQUALITY / GINI INDEX
4,145
TOTAL POPULATION
2,233
MALE POPULATION
1,912
FEMALE POPULATION
116.79
MALES / 100 FEMALES
85.62
FEMALES / 100 MALES
55.6
MEDIAN AGE
2.8
AVG FAMILY SIZE
2.3
AVG HOUSEHOLD SIZE
1,913
LABOR FORCE [ PEOPLE ]
54.2%
PERCENT IN LABOR FORCE
16.9%
UNEMPLOYMENT RATE
Income in Harbour Heights
Income Overview in Harbour Heights
Per Capita Income in Harbour Heights is $34,401, while median incomes of families and households are $71,106 and $54,877 respectively.
| Characteristic | Number | Measure |
| Per Capita Income | 4,145 | $34,401 |
| Median Family Income | 1,192 | $71,106 |
| Mean Family Income | 1,192 | $93,892 |
| Median Household Income | 1,801 | $54,877 |
| Mean Household Income | 1,801 | $76,667 |
| Income Deficit | 1,192 | $0 |
| Wage / Income Gap (%) | 4,145 | 18.35% |
| Wage / Income Gap ($) | 4,145 | 81.65¢ per $1 |
| Gini / Inequality Index | 4,145 | 0.44 |
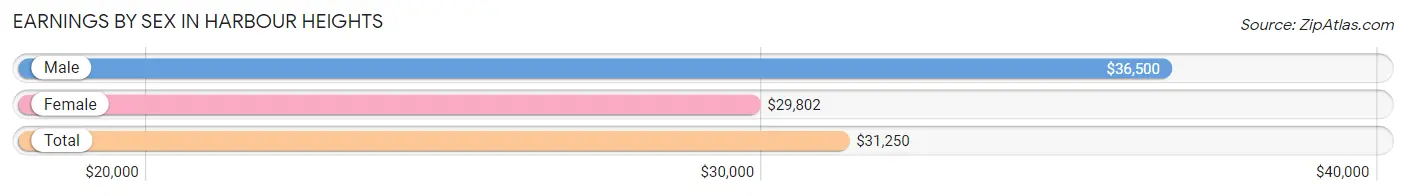
Earnings by Sex in Harbour Heights
Average Earnings in Harbour Heights are $31,250, $36,500 for men and $29,802 for women, a difference of 18.3%.
| Sex | Number | Average Earnings |
| Male | 1,028 (54.0%) | $36,500 |
| Female | 877 (46.0%) | $29,802 |
| Total | 1,905 (100.0%) | $31,250 |
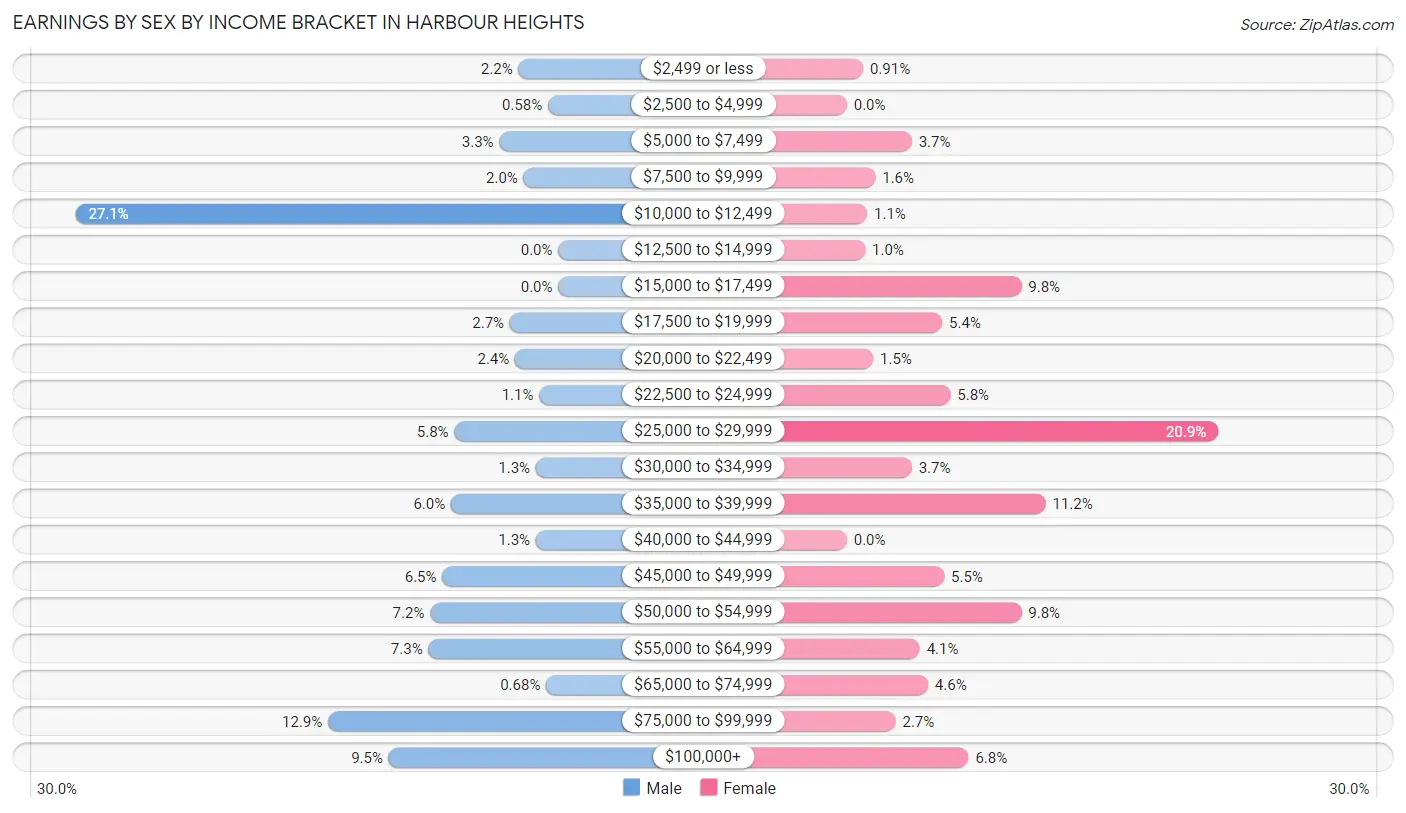
Earnings by Sex by Income Bracket in Harbour Heights
The most common earnings brackets in Harbour Heights are $10,000 to $12,499 for men (279 | 27.1%) and $25,000 to $29,999 for women (183 | 20.9%).
| Income | Male | Female |
| $2,499 or less | 23 (2.2%) | 8 (0.9%) |
| $2,500 to $4,999 | 6 (0.6%) | 0 (0.0%) |
| $5,000 to $7,499 | 34 (3.3%) | 32 (3.6%) |
| $7,500 to $9,999 | 20 (1.9%) | 14 (1.6%) |
| $10,000 to $12,499 | 279 (27.1%) | 10 (1.1%) |
| $12,500 to $14,999 | 0 (0.0%) | 9 (1.0%) |
| $15,000 to $17,499 | 0 (0.0%) | 86 (9.8%) |
| $17,500 to $19,999 | 28 (2.7%) | 47 (5.4%) |
| $20,000 to $22,499 | 25 (2.4%) | 13 (1.5%) |
| $22,500 to $24,999 | 11 (1.1%) | 51 (5.8%) |
| $25,000 to $29,999 | 60 (5.8%) | 183 (20.9%) |
| $30,000 to $34,999 | 13 (1.3%) | 32 (3.6%) |
| $35,000 to $39,999 | 62 (6.0%) | 98 (11.2%) |
| $40,000 to $44,999 | 13 (1.3%) | 0 (0.0%) |
| $45,000 to $49,999 | 67 (6.5%) | 48 (5.5%) |
| $50,000 to $54,999 | 74 (7.2%) | 86 (9.8%) |
| $55,000 to $64,999 | 75 (7.3%) | 36 (4.1%) |
| $65,000 to $74,999 | 7 (0.7%) | 40 (4.6%) |
| $75,000 to $99,999 | 133 (12.9%) | 24 (2.7%) |
| $100,000+ | 98 (9.5%) | 60 (6.8%) |
| Total | 1,028 (100.0%) | 877 (100.0%) |
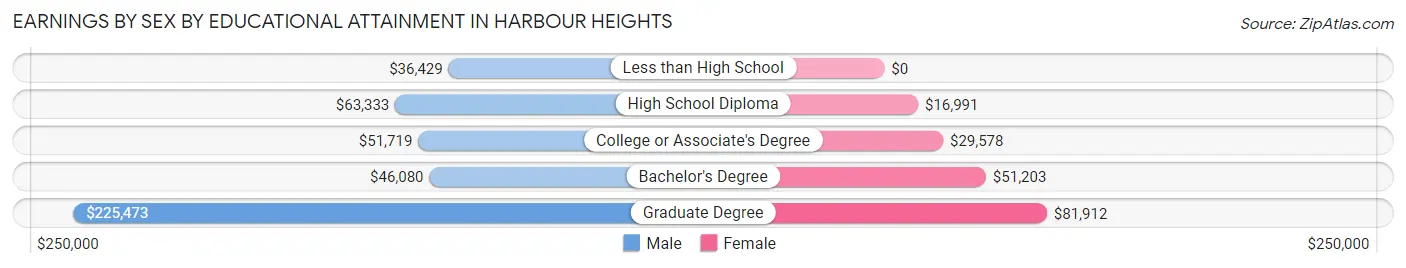
Earnings by Sex by Educational Attainment in Harbour Heights
Average earnings in Harbour Heights are $53,015 for men and $29,980 for women, a difference of 43.4%. Men with an educational attainment of graduate degree enjoy the highest average annual earnings of $225,473, while those with less than high school education earn the least with $36,429. Women with an educational attainment of graduate degree earn the most with the average annual earnings of $81,912, while those with high school diploma education have the smallest earnings of $16,991.
| Educational Attainment | Male Income | Female Income |
| Less than High School | $36,429 | $0 |
| High School Diploma | $63,333 | $16,991 |
| College or Associate's Degree | $51,719 | $29,578 |
| Bachelor's Degree | $46,080 | $51,203 |
| Graduate Degree | $225,473 | $81,912 |
| Total | $53,015 | $29,980 |
Family Income in Harbour Heights
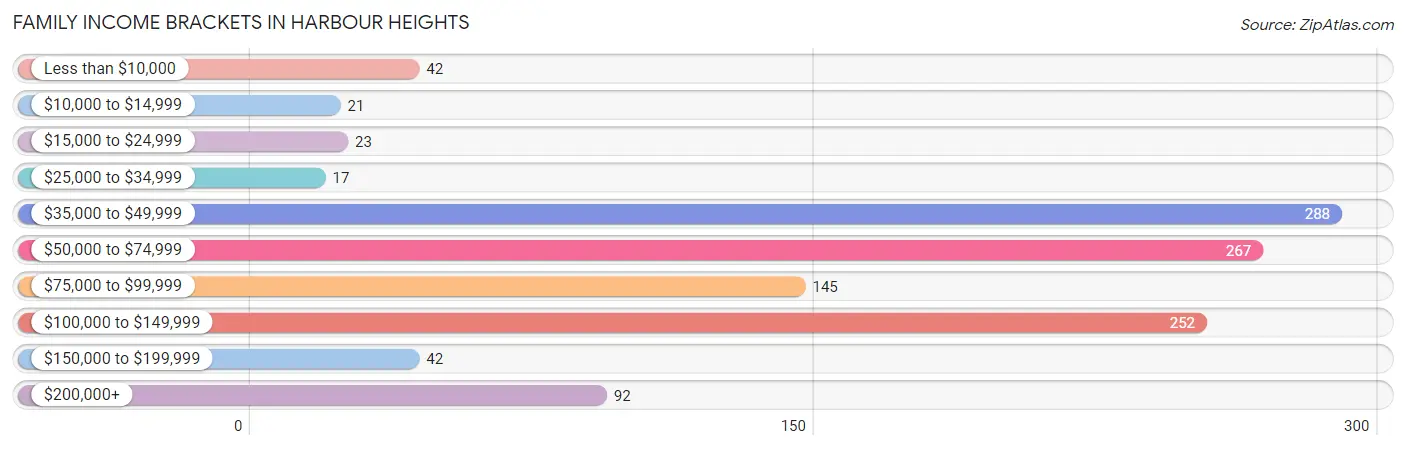
Family Income Brackets in Harbour Heights
According to the Harbour Heights family income data, there are 288 families falling into the $35,000 to $49,999 income range, which is the most common income bracket and makes up 24.2% of all families. Conversely, the $25,000 to $34,999 income bracket is the least frequent group with only 17 families (1.4%) belonging to this category.
| Income Bracket | # Families | % Families |
| Less than $10,000 | 42 | 3.5% |
| $10,000 to $14,999 | 21 | 1.8% |
| $15,000 to $24,999 | 23 | 1.9% |
| $25,000 to $34,999 | 17 | 1.4% |
| $35,000 to $49,999 | 288 | 24.2% |
| $50,000 to $74,999 | 267 | 22.4% |
| $75,000 to $99,999 | 145 | 12.2% |
| $100,000 to $149,999 | 252 | 21.1% |
| $150,000 to $199,999 | 42 | 3.5% |
| $200,000+ | 92 | 7.7% |
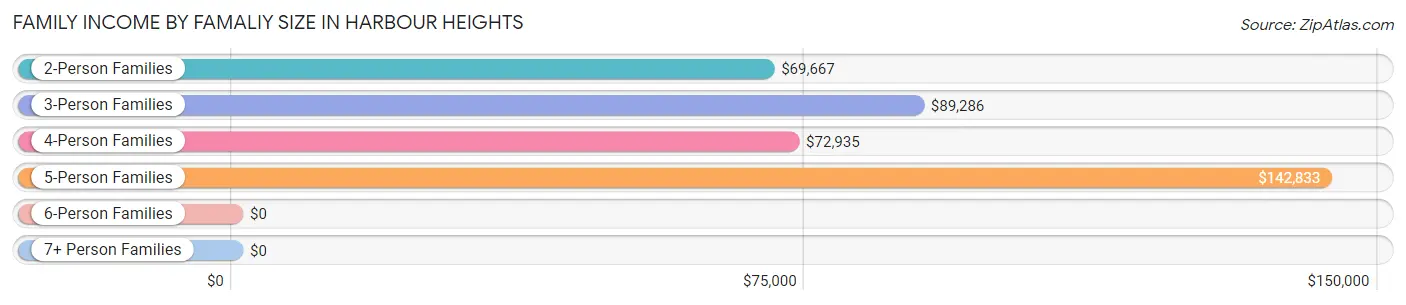
Family Income by Famaliy Size in Harbour Heights
5-person families (26 | 2.2%) account for the highest median family income in Harbour Heights with $142,833 per family, while 2-person families (802 | 67.3%) have the highest median income of $34,834 per family member.
| Income Bracket | # Families | Median Income |
| 2-Person Families | 802 (67.3%) | $69,667 |
| 3-Person Families | 144 (12.1%) | $89,286 |
| 4-Person Families | 204 (17.1%) | $72,935 |
| 5-Person Families | 26 (2.2%) | $142,833 |
| 6-Person Families | 16 (1.3%) | $0 |
| 7+ Person Families | 0 (0.0%) | $0 |
| Total | 1,192 (100.0%) | $71,106 |
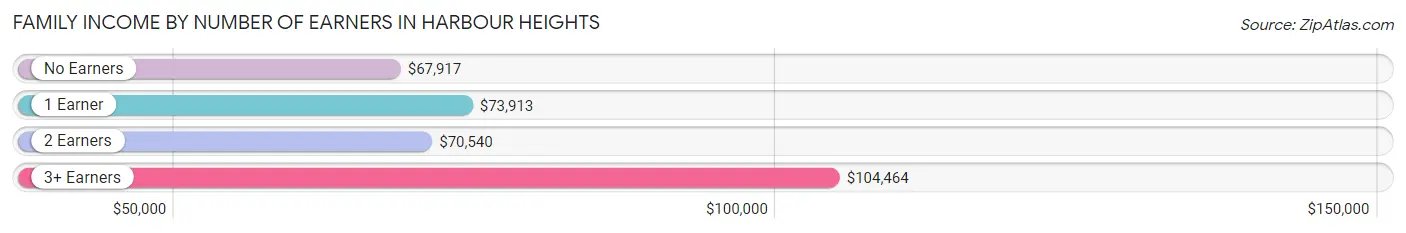
Family Income by Number of Earners in Harbour Heights
The median family income in Harbour Heights is $71,106, with families comprising 3+ earners (51) having the highest median family income of $104,464, while families with no earners (252) have the lowest median family income of $67,917, accounting for 4.3% and 21.1% of families, respectively.
| Number of Earners | # Families | Median Income |
| No Earners | 252 (21.1%) | $67,917 |
| 1 Earner | 384 (32.2%) | $73,913 |
| 2 Earners | 505 (42.4%) | $70,540 |
| 3+ Earners | 51 (4.3%) | $104,464 |
| Total | 1,192 (100.0%) | $71,106 |
Household Income in Harbour Heights
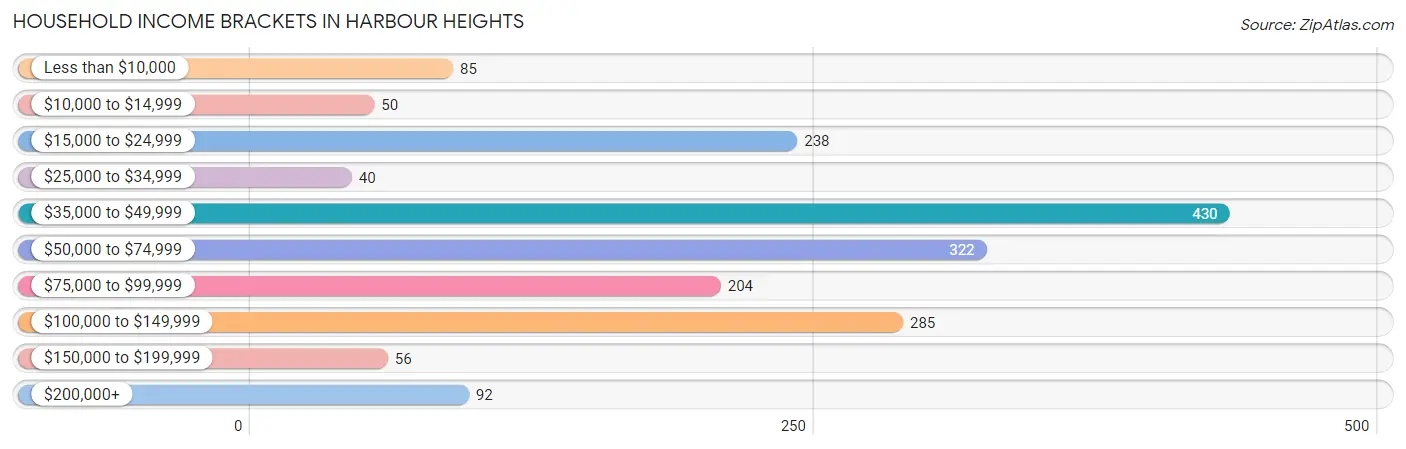
Household Income Brackets in Harbour Heights
With 430 households falling in the category, the $35,000 to $49,999 income range is the most frequent in Harbour Heights, accounting for 23.9% of all households. In contrast, only 40 households (2.2%) fall into the $25,000 to $34,999 income bracket, making it the least populous group.
| Income Bracket | # Households | % Households |
| Less than $10,000 | 85 | 4.7% |
| $10,000 to $14,999 | 50 | 2.8% |
| $15,000 to $24,999 | 238 | 13.2% |
| $25,000 to $34,999 | 40 | 2.2% |
| $35,000 to $49,999 | 430 | 23.9% |
| $50,000 to $74,999 | 322 | 17.9% |
| $75,000 to $99,999 | 204 | 11.3% |
| $100,000 to $149,999 | 285 | 15.8% |
| $150,000 to $199,999 | 56 | 3.1% |
| $200,000+ | 92 | 5.1% |
Household Income by Householder Age in Harbour Heights
The median household income in Harbour Heights is $54,877, with the highest median household income of $70,321 found in the 45 to 64 years age bracket for the primary householder. A total of 629 households (34.9%) fall into this category. Meanwhile, the 15 to 24 years age bracket for the primary householder has the lowest median household income of $0, with 37 households (2.1%) in this group.
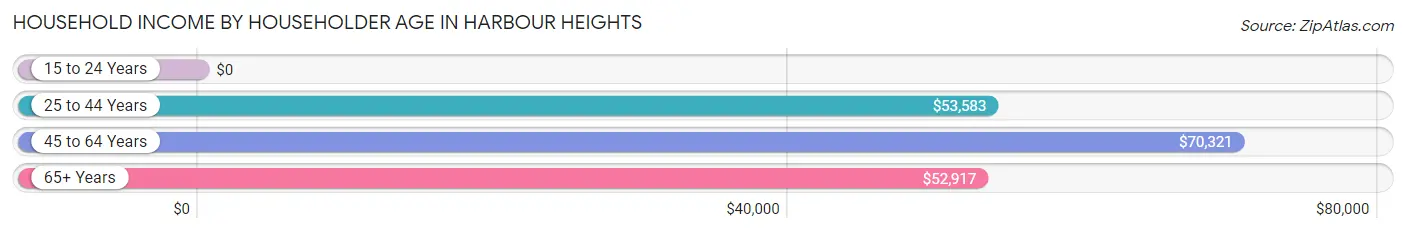
| Income Bracket | # Households | Median Income |
| 15 to 24 Years | 37 (2.1%) | $0 |
| 25 to 44 Years | 285 (15.8%) | $53,583 |
| 45 to 64 Years | 629 (34.9%) | $70,321 |
| 65+ Years | 850 (47.2%) | $52,917 |
| Total | 1,801 (100.0%) | $54,877 |
Poverty in Harbour Heights
Income Below Poverty by Sex and Age in Harbour Heights
With 15.7% poverty level for males and 13.2% for females among the residents of Harbour Heights, 65 to 74 year old males and 6 to 11 year old females are the most vulnerable to poverty, with 209 males (39.6%) and 24 females (72.7%) in their respective age groups living below the poverty level.
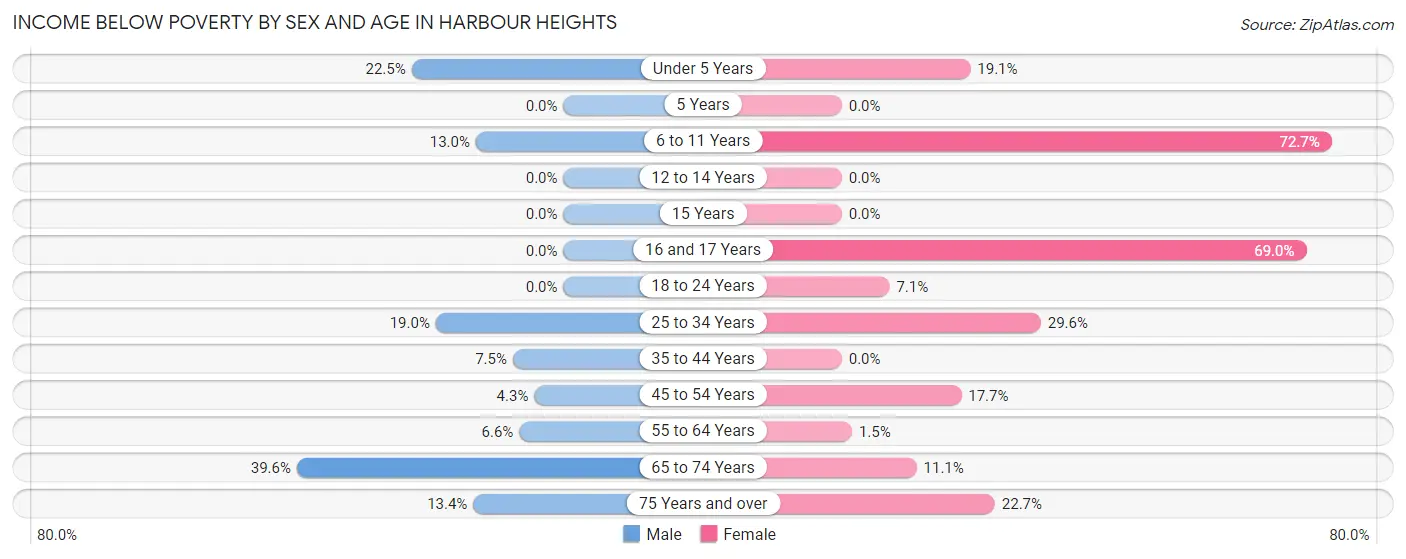
| Age Bracket | Male | Female |
| Under 5 Years | 16 (22.5%) | 21 (19.1%) |
| 5 Years | 0 (0.0%) | 0 (0.0%) |
| 6 to 11 Years | 26 (13.0%) | 24 (72.7%) |
| 12 to 14 Years | 0 (0.0%) | 0 (0.0%) |
| 15 Years | 0 (0.0%) | 0 (0.0%) |
| 16 and 17 Years | 0 (0.0%) | 20 (69.0%) |
| 18 to 24 Years | 0 (0.0%) | 8 (7.1%) |
| 25 to 34 Years | 29 (19.0%) | 52 (29.5%) |
| 35 to 44 Years | 9 (7.5%) | 0 (0.0%) |
| 45 to 54 Years | 7 (4.3%) | 22 (17.7%) |
| 55 to 64 Years | 20 (6.6%) | 7 (1.5%) |
| 65 to 74 Years | 209 (39.6%) | 39 (11.1%) |
| 75 Years and over | 34 (13.4%) | 60 (22.7%) |
| Total | 350 (15.7%) | 253 (13.2%) |
Income Above Poverty by Sex and Age in Harbour Heights
According to the poverty statistics in Harbour Heights, males aged 5 years and females aged 5 years are the age groups that are most secure financially, with 100.0% of males and 100.0% of females in these age groups living above the poverty line.
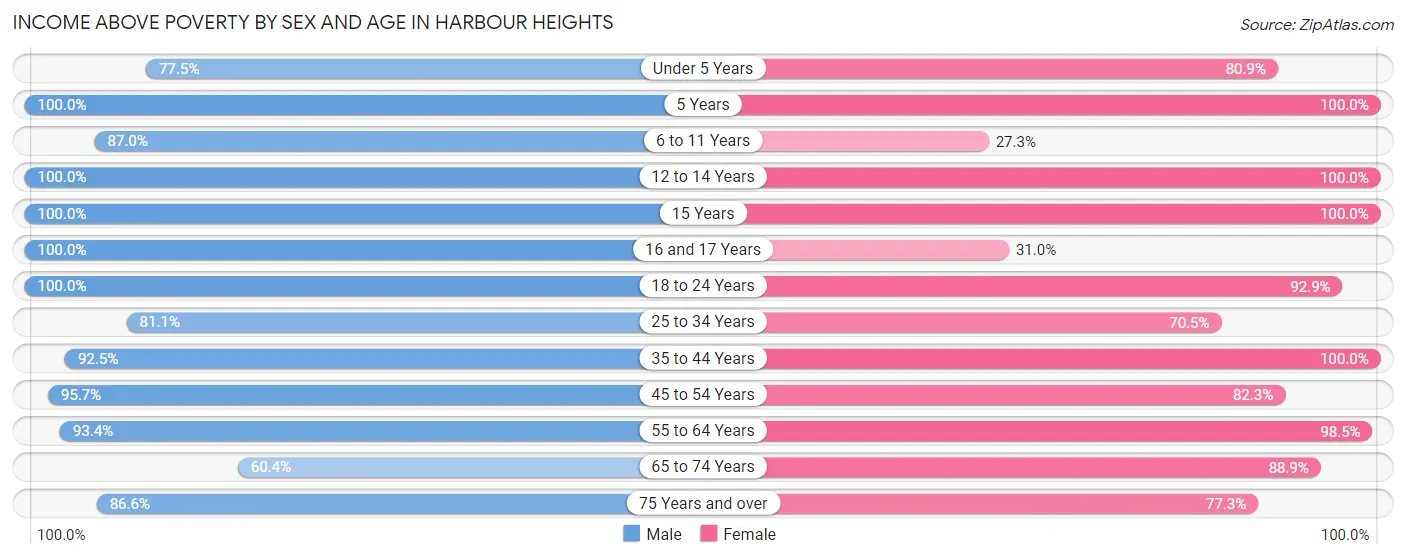
| Age Bracket | Male | Female |
| Under 5 Years | 55 (77.5%) | 89 (80.9%) |
| 5 Years | 33 (100.0%) | 27 (100.0%) |
| 6 to 11 Years | 174 (87.0%) | 9 (27.3%) |
| 12 to 14 Years | 67 (100.0%) | 51 (100.0%) |
| 15 Years | 19 (100.0%) | 5 (100.0%) |
| 16 and 17 Years | 16 (100.0%) | 9 (31.0%) |
| 18 to 24 Years | 305 (100.0%) | 105 (92.9%) |
| 25 to 34 Years | 124 (81.0%) | 124 (70.5%) |
| 35 to 44 Years | 111 (92.5%) | 165 (100.0%) |
| 45 to 54 Years | 155 (95.7%) | 102 (82.3%) |
| 55 to 64 Years | 285 (93.4%) | 457 (98.5%) |
| 65 to 74 Years | 319 (60.4%) | 312 (88.9%) |
| 75 Years and over | 220 (86.6%) | 204 (77.3%) |
| Total | 1,883 (84.3%) | 1,659 (86.8%) |
Income Below Poverty Among Married-Couple Families in Harbour Heights
The poverty statistics for married-couple families in Harbour Heights show that 8.0% or 69 of the total 862 families live below the poverty line. Families with 1 or 2 children have the highest poverty rate of 10.1%, comprising of 22 families. On the other hand, families with 3 or 4 children have the lowest poverty rate of 0.0%, which includes 0 families.
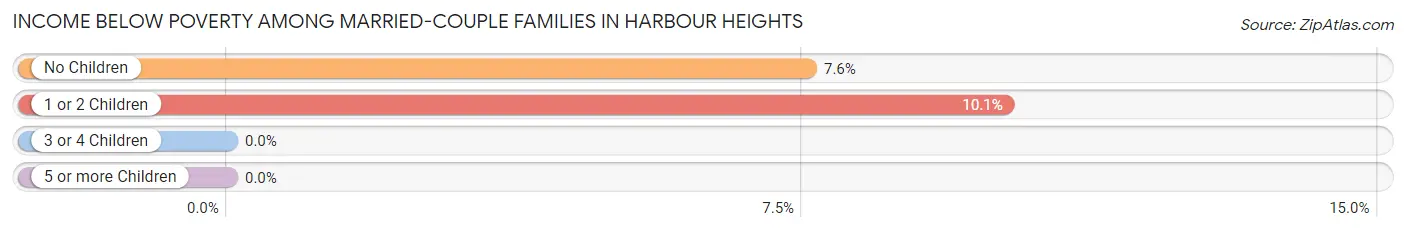
| Children | Above Poverty | Below Poverty |
| No Children | 575 (92.4%) | 47 (7.6%) |
| 1 or 2 Children | 195 (89.9%) | 22 (10.1%) |
| 3 or 4 Children | 23 (100.0%) | 0 (0.0%) |
| 5 or more Children | 0 (0.0%) | 0 (0.0%) |
| Total | 793 (92.0%) | 69 (8.0%) |
Income Below Poverty Among Single-Parent Households in Harbour Heights
According to the poverty data in Harbour Heights, 28.0% or 14 single-father households and 8.6% or 24 single-mother households are living below the poverty line. Among single-father households, those with no children have the highest poverty rate, with 7 households (100.0%) experiencing poverty. Likewise, among single-mother households, those with 3 or 4 children have the highest poverty rate, with 16 households (41.0%) falling below the poverty line.
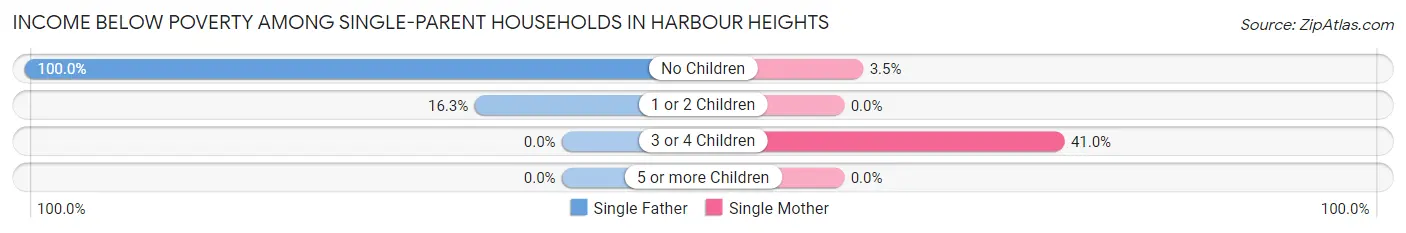
| Children | Single Father | Single Mother |
| No Children | 7 (100.0%) | 8 (3.5%) |
| 1 or 2 Children | 7 (16.3%) | 0 (0.0%) |
| 3 or 4 Children | 0 (0.0%) | 16 (41.0%) |
| 5 or more Children | 0 (0.0%) | 0 (0.0%) |
| Total | 14 (28.0%) | 24 (8.6%) |
Income Below Poverty Among Married-Couple vs Single-Parent Households in Harbour Heights
The poverty data for Harbour Heights shows that 69 of the married-couple family households (8.0%) and 38 of the single-parent households (11.5%) are living below the poverty level. Within the married-couple family households, those with 1 or 2 children have the highest poverty rate, with 22 households (10.1%) falling below the poverty line. Among the single-parent households, those with 3 or 4 children have the highest poverty rate, with 16 household (41.0%) living below poverty.
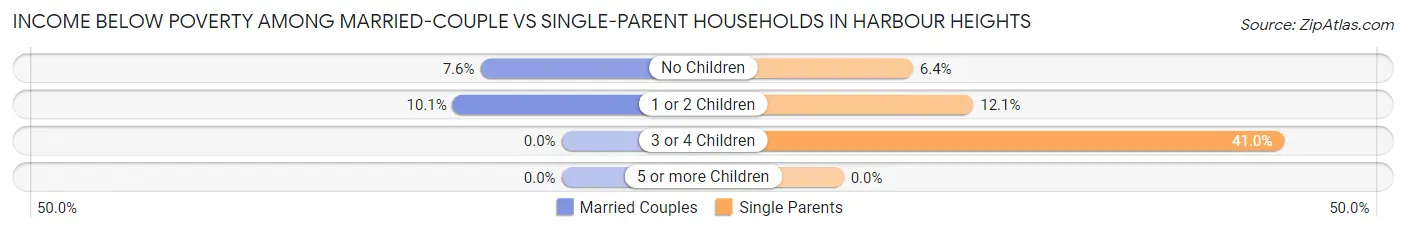
| Children | Married-Couple Families | Single-Parent Households |
| No Children | 47 (7.6%) | 15 (6.4%) |
| 1 or 2 Children | 22 (10.1%) | 7 (12.1%) |
| 3 or 4 Children | 0 (0.0%) | 16 (41.0%) |
| 5 or more Children | 0 (0.0%) | 0 (0.0%) |
| Total | 69 (8.0%) | 38 (11.5%) |
Race in Harbour Heights
The most populous races in Harbour Heights are White / Caucasian (3,216 | 77.6%), Black / African American (580 | 14.0%), and Hispanic or Latino (433 | 10.4%).
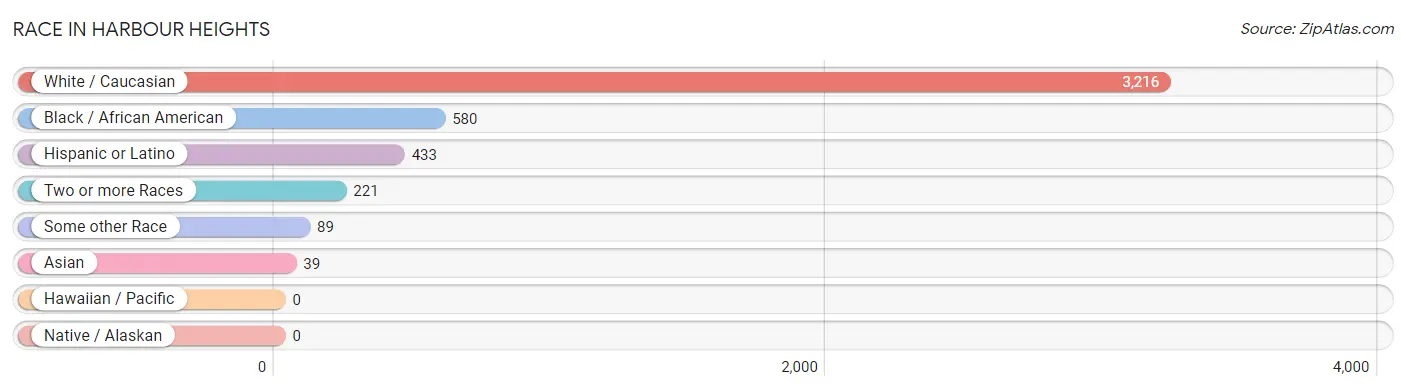
| Race | # Population | % Population |
| Asian | 39 | 0.9% |
| Black / African American | 580 | 14.0% |
| Hawaiian / Pacific | 0 | 0.0% |
| Hispanic or Latino | 433 | 10.4% |
| Native / Alaskan | 0 | 0.0% |
| White / Caucasian | 3,216 | 77.6% |
| Two or more Races | 221 | 5.3% |
| Some other Race | 89 | 2.1% |
| Total | 4,145 | 100.0% |
Ancestry in Harbour Heights
The most populous ancestries reported in Harbour Heights are American (887 | 21.4%), Italian (518 | 12.5%), English (458 | 11.1%), German (393 | 9.5%), and Irish (384 | 9.3%), together accounting for 63.7% of all Harbour Heights residents.
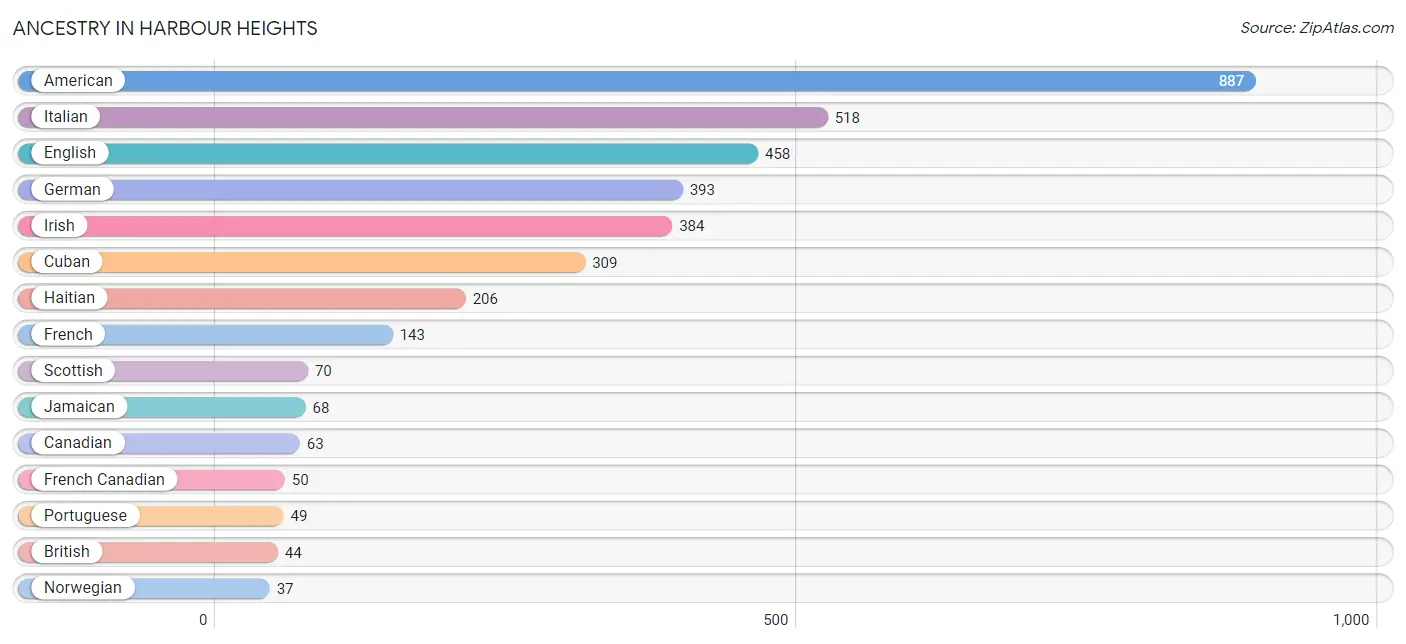
| Ancestry | # Population | % Population |
| American | 887 | 21.4% |
| Arab | 8 | 0.2% |
| Austrian | 8 | 0.2% |
| Belgian | 5 | 0.1% |
| British | 44 | 1.1% |
| Canadian | 63 | 1.5% |
| Cape Verdean | 7 | 0.2% |
| Central American | 24 | 0.6% |
| Chilean | 29 | 0.7% |
| Cuban | 309 | 7.4% |
| Czech | 7 | 0.2% |
| Dominican | 26 | 0.6% |
| Dutch | 32 | 0.8% |
| Eastern European | 20 | 0.5% |
| English | 458 | 11.1% |
| European | 27 | 0.6% |
| French | 143 | 3.5% |
| French Canadian | 50 | 1.2% |
| German | 393 | 9.5% |
| Greek | 8 | 0.2% |
| Guatemalan | 24 | 0.6% |
| Haitian | 206 | 5.0% |
| Indian (Asian) | 11 | 0.3% |
| Irish | 384 | 9.3% |
| Italian | 518 | 12.5% |
| Jamaican | 68 | 1.6% |
| Korean | 21 | 0.5% |
| Mexican | 21 | 0.5% |
| Norwegian | 37 | 0.9% |
| Polish | 15 | 0.4% |
| Portuguese | 49 | 1.2% |
| Puerto Rican | 24 | 0.6% |
| Russian | 20 | 0.5% |
| Scandinavian | 15 | 0.4% |
| Scotch-Irish | 7 | 0.2% |
| Scottish | 70 | 1.7% |
| Slovak | 6 | 0.1% |
| South American | 29 | 0.7% |
| Subsaharan African | 7 | 0.2% |
| Swedish | 20 | 0.5% |
| Swiss | 11 | 0.3% |
| Ukrainian | 14 | 0.3% |
| Welsh | 24 | 0.6% | View All 43 Rows |
Immigrants in Harbour Heights
The most numerous immigrant groups reported in Harbour Heights came from Europe (217 | 5.2%), Latin America (183 | 4.4%), Eastern Europe (170 | 4.1%), Ukraine (163 | 3.9%), and Caribbean (151 | 3.6%), together accounting for 21.3% of all Harbour Heights residents.
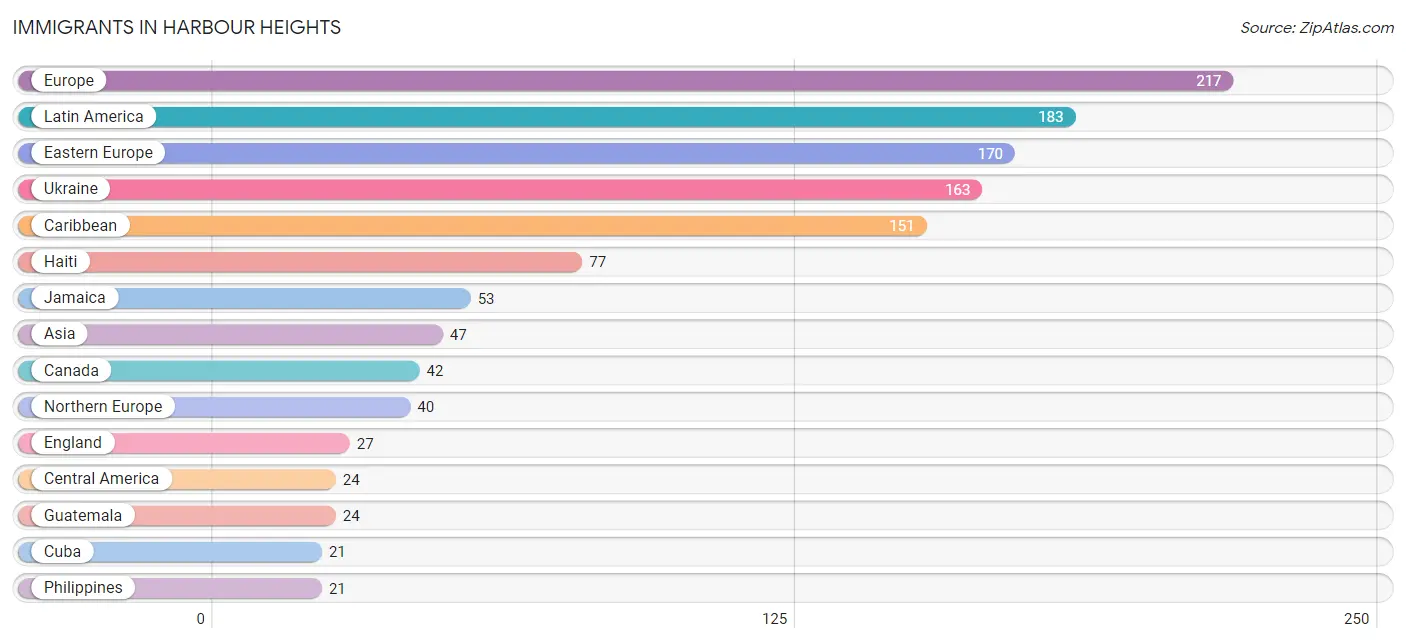
| Immigration Origin | # Population | % Population |
| Asia | 47 | 1.1% |
| Canada | 42 | 1.0% |
| Caribbean | 151 | 3.6% |
| Central America | 24 | 0.6% |
| Cuba | 21 | 0.5% |
| Czechoslovakia | 7 | 0.2% |
| Eastern Europe | 170 | 4.1% |
| England | 27 | 0.6% |
| Europe | 217 | 5.2% |
| Germany | 7 | 0.2% |
| Guatemala | 24 | 0.6% |
| Haiti | 77 | 1.9% |
| India | 7 | 0.2% |
| Jamaica | 53 | 1.3% |
| Latin America | 183 | 4.4% |
| Northern Europe | 40 | 1.0% |
| Pakistan | 11 | 0.3% |
| Philippines | 21 | 0.5% |
| Scotland | 8 | 0.2% |
| South America | 8 | 0.2% |
| South Central Asia | 18 | 0.4% |
| South Eastern Asia | 21 | 0.5% |
| Ukraine | 163 | 3.9% |
| Venezuela | 8 | 0.2% |
| Western Asia | 8 | 0.2% |
| Western Europe | 7 | 0.2% | View All 26 Rows |
Sex and Age in Harbour Heights
Sex and Age in Harbour Heights
The most populous age groups in Harbour Heights are 65 to 69 Years (355 | 15.9%) for men and 60 to 64 Years (293 | 15.3%) for women.
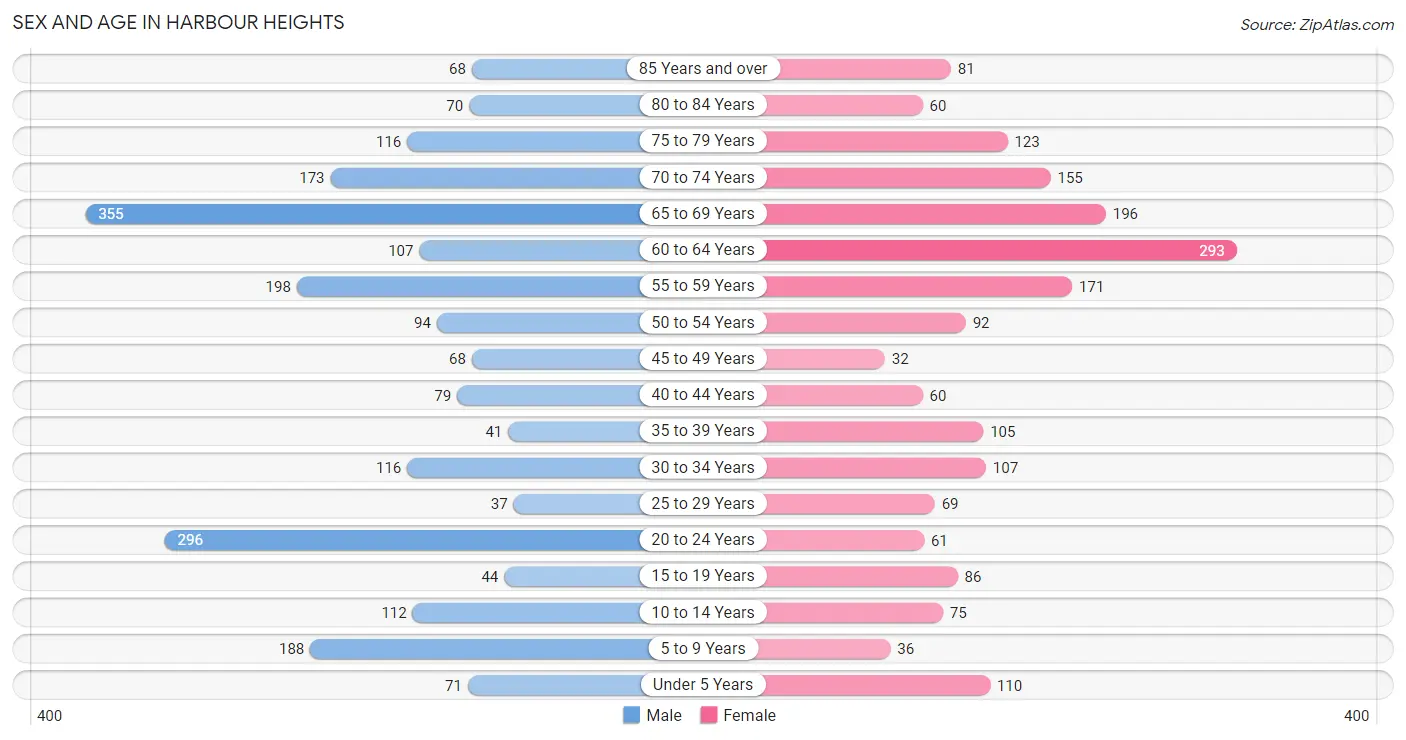
| Age Bracket | Male | Female |
| Under 5 Years | 71 (3.2%) | 110 (5.8%) |
| 5 to 9 Years | 188 (8.4%) | 36 (1.9%) |
| 10 to 14 Years | 112 (5.0%) | 75 (3.9%) |
| 15 to 19 Years | 44 (2.0%) | 86 (4.5%) |
| 20 to 24 Years | 296 (13.3%) | 61 (3.2%) |
| 25 to 29 Years | 37 (1.7%) | 69 (3.6%) |
| 30 to 34 Years | 116 (5.2%) | 107 (5.6%) |
| 35 to 39 Years | 41 (1.8%) | 105 (5.5%) |
| 40 to 44 Years | 79 (3.5%) | 60 (3.1%) |
| 45 to 49 Years | 68 (3.0%) | 32 (1.7%) |
| 50 to 54 Years | 94 (4.2%) | 92 (4.8%) |
| 55 to 59 Years | 198 (8.9%) | 171 (8.9%) |
| 60 to 64 Years | 107 (4.8%) | 293 (15.3%) |
| 65 to 69 Years | 355 (15.9%) | 196 (10.2%) |
| 70 to 74 Years | 173 (7.7%) | 155 (8.1%) |
| 75 to 79 Years | 116 (5.2%) | 123 (6.4%) |
| 80 to 84 Years | 70 (3.1%) | 60 (3.1%) |
| 85 Years and over | 68 (3.0%) | 81 (4.2%) |
| Total | 2,233 (100.0%) | 1,912 (100.0%) |
Families and Households in Harbour Heights
Median Family Size in Harbour Heights
The median family size in Harbour Heights is 2.76 persons per family, with single female/mother families (280 | 23.5%) accounting for the largest median family size of 2.88 persons per family. On the other hand, single male/father families (50 | 4.2%) represent the smallest median family size with 2.56 persons per family.
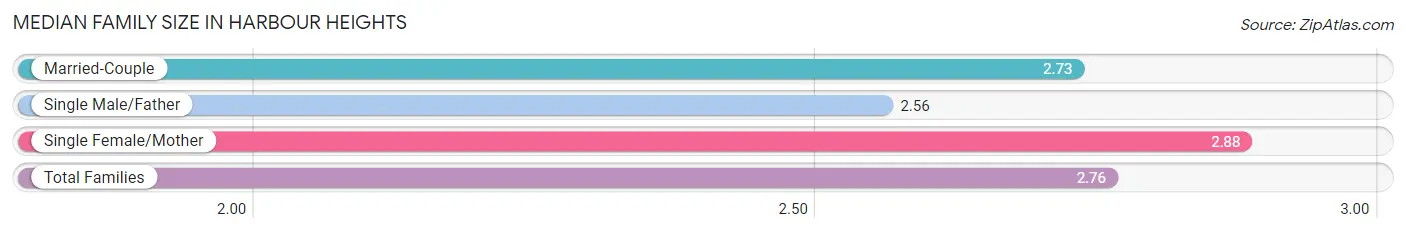
| Family Type | # Families | Family Size |
| Married-Couple | 862 (72.3%) | 2.73 |
| Single Male/Father | 50 (4.2%) | 2.56 |
| Single Female/Mother | 280 (23.5%) | 2.88 |
| Total Families | 1,192 (100.0%) | 2.76 |
Median Household Size in Harbour Heights
The median household size in Harbour Heights is 2.30 persons per household, with single female/mother households (280 | 15.5%) accounting for the largest median household size of 2.88 persons per household. non-family households (609 | 33.8%) represent the smallest median household size with 1.39 persons per household.
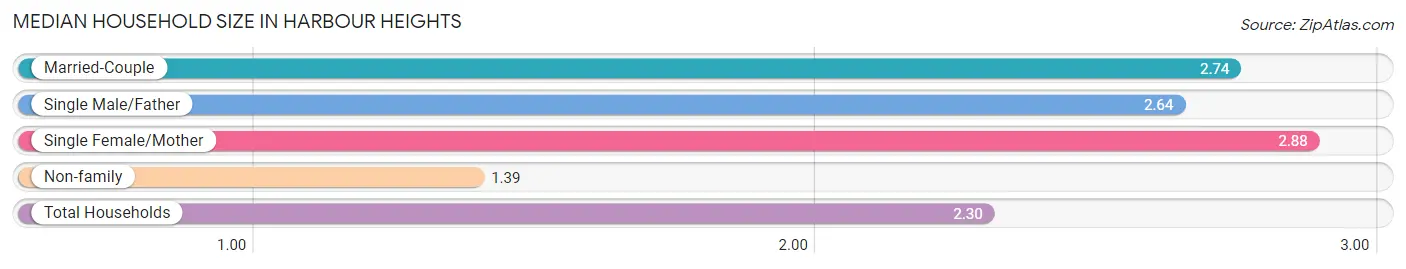
| Household Type | # Households | Household Size |
| Married-Couple | 862 (47.9%) | 2.74 |
| Single Male/Father | 50 (2.8%) | 2.64 |
| Single Female/Mother | 280 (15.5%) | 2.88 |
| Non-family | 609 (33.8%) | 1.39 |
| Total Households | 1,801 (100.0%) | 2.30 |
Household Size by Marriage Status in Harbour Heights
Out of a total of 1,801 households in Harbour Heights, 1,192 (66.2%) are family households, while 609 (33.8%) are nonfamily households. The most numerous type of family households are 2-person households, comprising 802, and the most common type of nonfamily households are 1-person households, comprising 422.
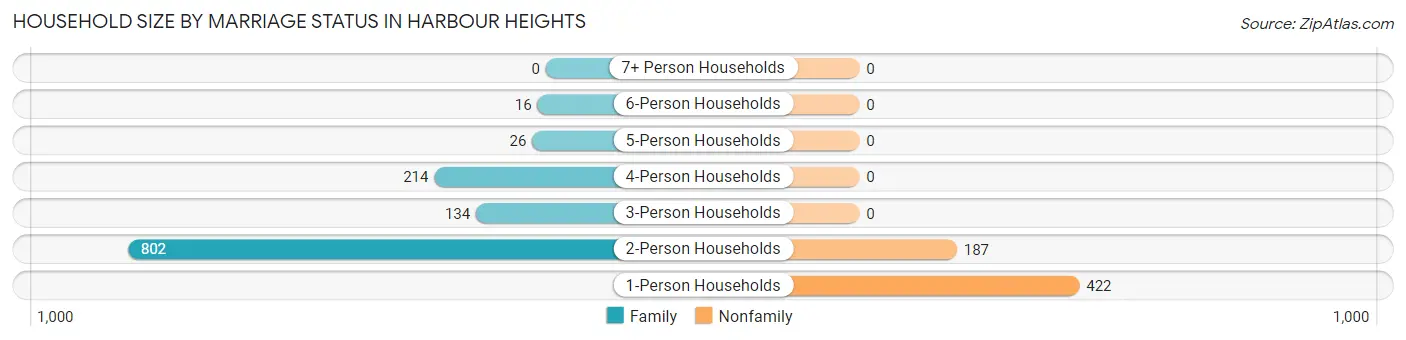
| Household Size | Family Households | Nonfamily Households |
| 1-Person Households | - | 422 (23.4%) |
| 2-Person Households | 802 (44.5%) | 187 (10.4%) |
| 3-Person Households | 134 (7.4%) | 0 (0.0%) |
| 4-Person Households | 214 (11.9%) | 0 (0.0%) |
| 5-Person Households | 26 (1.4%) | 0 (0.0%) |
| 6-Person Households | 16 (0.9%) | 0 (0.0%) |
| 7+ Person Households | 0 (0.0%) | 0 (0.0%) |
| Total | 1,192 (66.2%) | 609 (33.8%) |
Female Fertility in Harbour Heights
Fertility by Age in Harbour Heights
Average fertility rate in Harbour Heights is 143.0 births per 1,000 women. Women in the age bracket of 20 to 34 years have the highest fertility rate with 338.0 births per 1,000 women. Women in the age bracket of 20 to 34 years acount for 100.0% of all women with births.
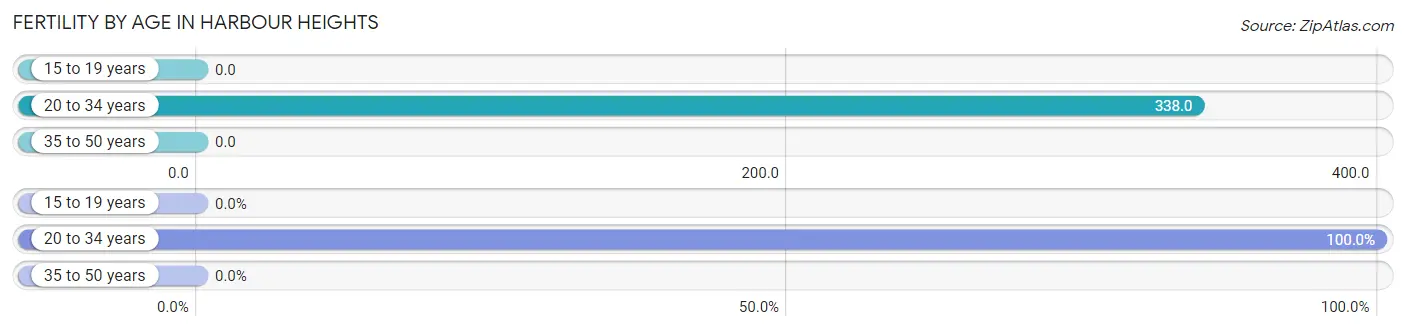
| Age Bracket | Women with Births | Births / 1,000 Women |
| 15 to 19 years | 0 (0.0%) | 0.0 |
| 20 to 34 years | 80 (100.0%) | 338.0 |
| 35 to 50 years | 0 (0.0%) | 0.0 |
| Total | 80 (100.0%) | 143.0 |
Fertility by Age by Marriage Status in Harbour Heights
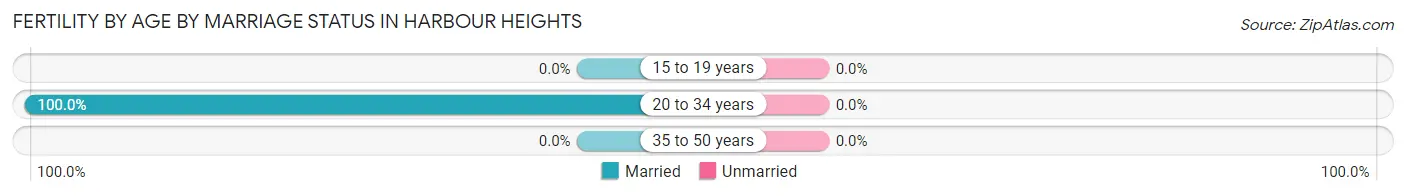
| Age Bracket | Married | Unmarried |
| 15 to 19 years | 0 (0.0%) | 0 (0.0%) |
| 20 to 34 years | 80 (100.0%) | 0 (0.0%) |
| 35 to 50 years | 0 (0.0%) | 0 (0.0%) |
| Total | 80 (100.0%) | 0 (0.0%) |
Fertility by Education in Harbour Heights
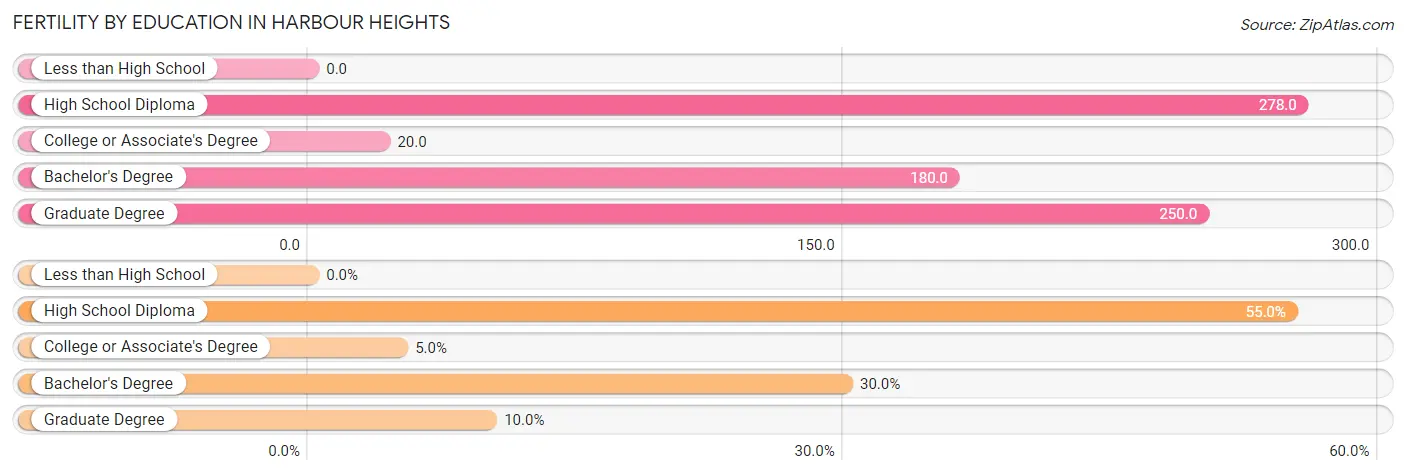
| Educational Attainment | Women with Births | Births / 1,000 Women |
| Less than High School | 0 (0.0%) | 0.0 |
| High School Diploma | 44 (55.0%) | 278.0 |
| College or Associate's Degree | 4 (5.0%) | 20.0 |
| Bachelor's Degree | 24 (30.0%) | 180.0 |
| Graduate Degree | 8 (10.0%) | 250.0 |
| Total | 80 (100.0%) | 143.0 |
Fertility by Education by Marriage Status in Harbour Heights
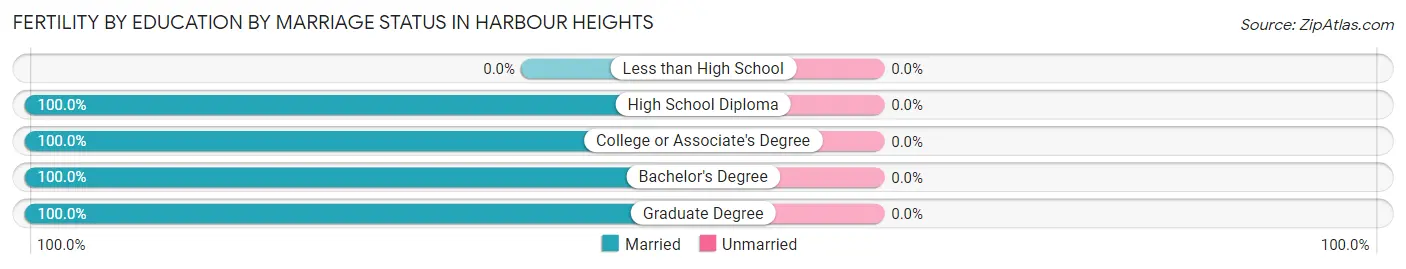
| Educational Attainment | Married | Unmarried |
| Less than High School | 0 (0.0%) | 0 (0.0%) |
| High School Diploma | 44 (100.0%) | 0 (0.0%) |
| College or Associate's Degree | 4 (100.0%) | 0 (0.0%) |
| Bachelor's Degree | 24 (100.0%) | 0 (0.0%) |
| Graduate Degree | 8 (100.0%) | 0 (0.0%) |
| Total | 80 (100.0%) | 0 (0.0%) |
Employment Characteristics in Harbour Heights
Employment by Class of Employer in Harbour Heights
Among the 1,566 employed individuals in Harbour Heights, private company employees (1,062 | 67.8%), local government employees (173 | 11.1%), and self-employed (incorporated) (106 | 6.8%) make up the most common classes of employment.
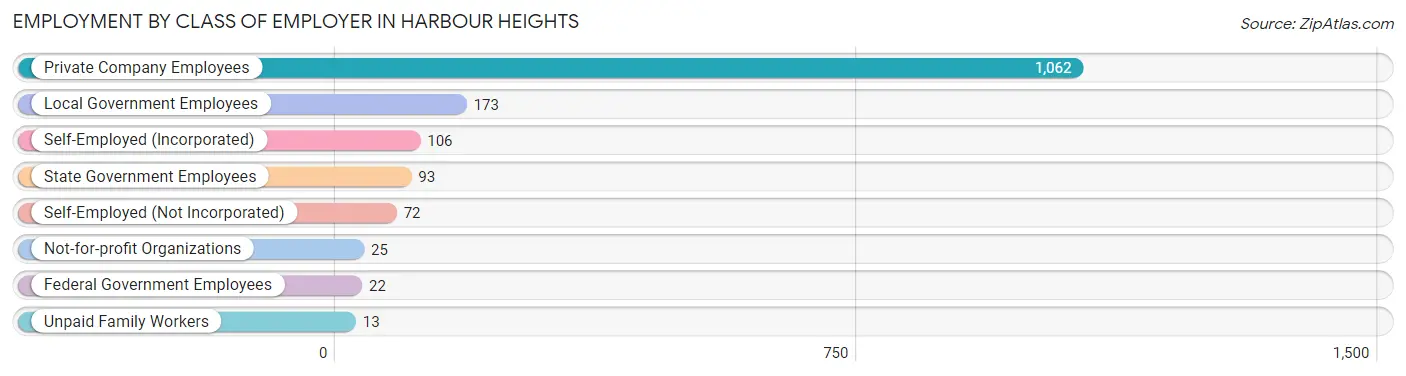
| Employer Class | # Employees | % Employees |
| Private Company Employees | 1,062 | 67.8% |
| Self-Employed (Incorporated) | 106 | 6.8% |
| Self-Employed (Not Incorporated) | 72 | 4.6% |
| Not-for-profit Organizations | 25 | 1.6% |
| Local Government Employees | 173 | 11.1% |
| State Government Employees | 93 | 5.9% |
| Federal Government Employees | 22 | 1.4% |
| Unpaid Family Workers | 13 | 0.8% |
| Total | 1,566 | 100.0% |
Employment Status by Age in Harbour Heights
According to the labor force statistics for Harbour Heights, out of the total population over 16 years of age (3,529), 54.2% or 1,913 individuals are in the labor force, with 16.9% or 323 of them unemployed. The age group with the highest labor force participation rate is 55 to 59 years, with 90.8% or 335 individuals in the labor force. Within the labor force, the 20 to 24 years age range has the highest percentage of unemployed individuals, with 75.3% or 223 of them being unemployed.
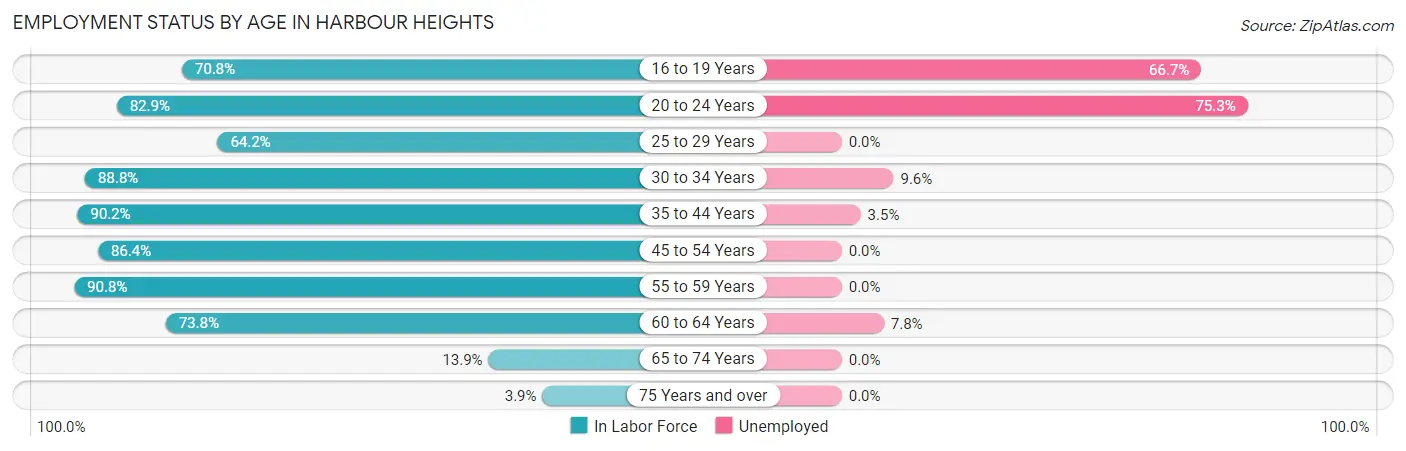
| Age Bracket | In Labor Force | Unemployed |
| 16 to 19 Years | 75 (70.8%) | 50 (66.7%) |
| 20 to 24 Years | 296 (82.9%) | 223 (75.3%) |
| 25 to 29 Years | 68 (64.2%) | 0 (0.0%) |
| 30 to 34 Years | 198 (88.8%) | 19 (9.6%) |
| 35 to 44 Years | 257 (90.2%) | 9 (3.5%) |
| 45 to 54 Years | 247 (86.4%) | 0 (0.0%) |
| 55 to 59 Years | 335 (90.8%) | 0 (0.0%) |
| 60 to 64 Years | 295 (73.8%) | 23 (7.8%) |
| 65 to 74 Years | 122 (13.9%) | 0 (0.0%) |
| 75 Years and over | 20 (3.9%) | 0 (0.0%) |
| Total | 1,913 (54.2%) | 323 (16.9%) |
Employment Status by Educational Attainment in Harbour Heights
According to labor force statistics for Harbour Heights, 83.9% of individuals (1,400) out of the total population between 25 and 64 years of age (1,669) are in the labor force, with 3.6% or 50 of them being unemployed. The group with the highest labor force participation rate are those with the educational attainment of high school diploma, with 86.5% or 411 individuals in the labor force. Within the labor force, individuals with less than high school education have the highest percentage of unemployment, with 45.7% or 16 of them being unemployed.
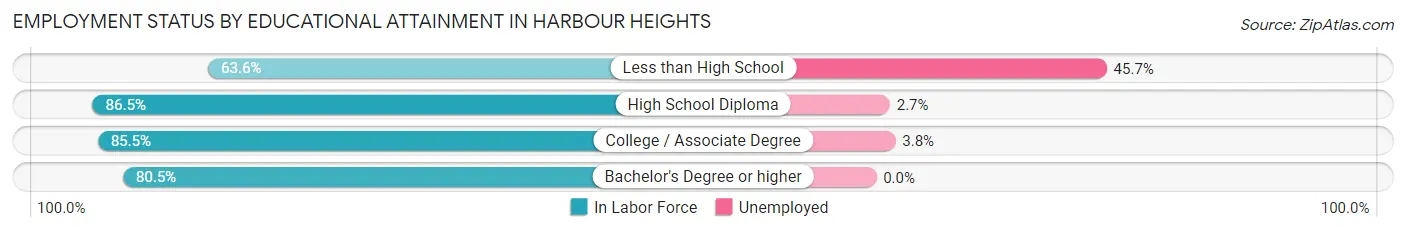
| Educational Attainment | In Labor Force | Unemployed |
| Less than High School | 35 (63.6%) | 25 (45.7%) |
| High School Diploma | 411 (86.5%) | 13 (2.7%) |
| College / Associate Degree | 637 (85.5%) | 28 (3.8%) |
| Bachelor's Degree or higher | 317 (80.5%) | 0 (0.0%) |
| Total | 1,400 (83.9%) | 60 (3.6%) |
Employment Occupations by Sex in Harbour Heights
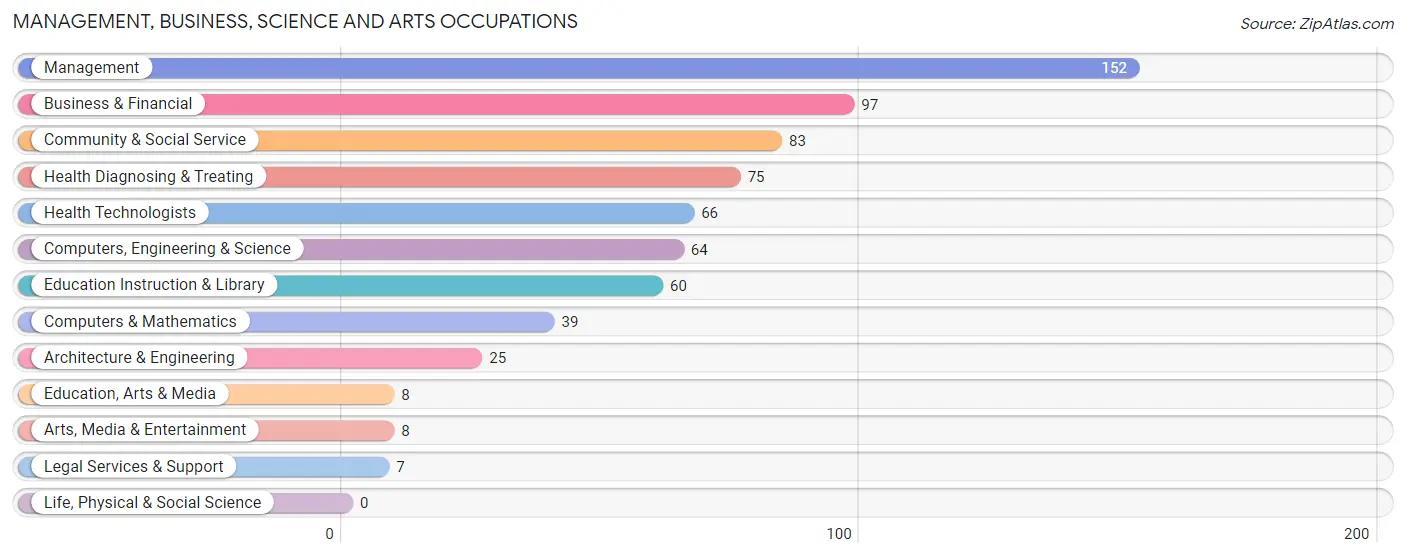
Management, Business, Science and Arts Occupations
The most common Management, Business, Science and Arts occupations in Harbour Heights are Management (152 | 9.6%), Business & Financial (97 | 6.1%), Community & Social Service (83 | 5.2%), Health Diagnosing & Treating (75 | 4.7%), and Health Technologists (66 | 4.2%).
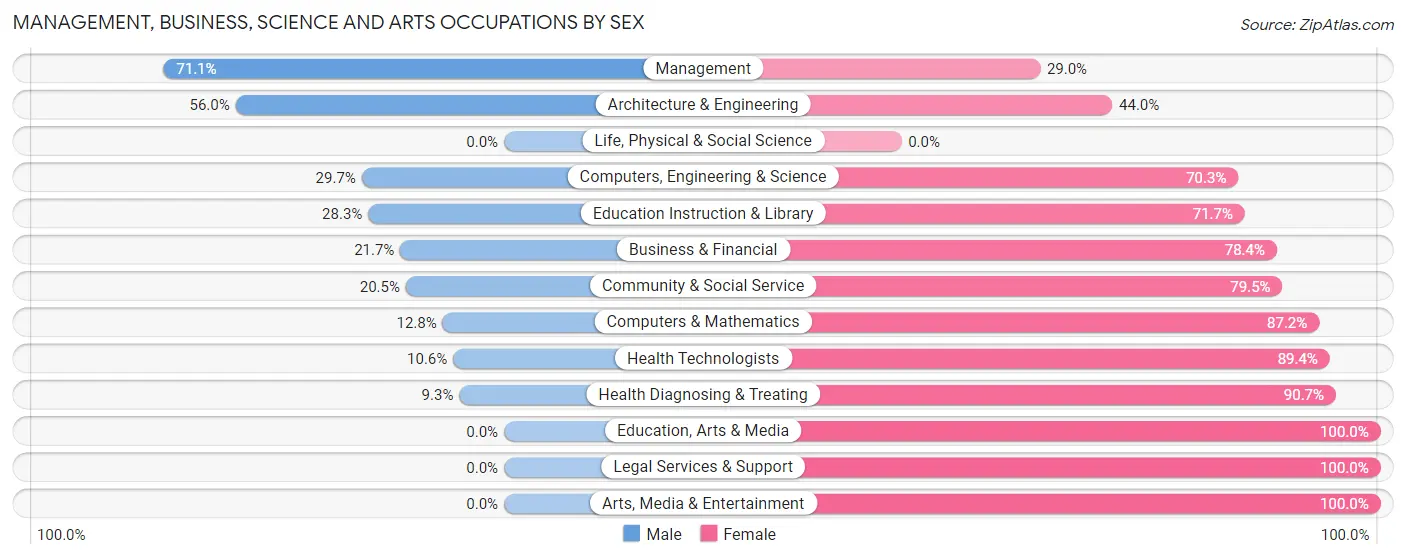
Management, Business, Science and Arts Occupations by Sex
Within the Management, Business, Science and Arts occupations in Harbour Heights, the most male-oriented occupations are Management (71.1%), Architecture & Engineering (56.0%), and Computers, Engineering & Science (29.7%), while the most female-oriented occupations are Education, Arts & Media (100.0%), Legal Services & Support (100.0%), and Arts, Media & Entertainment (100.0%).
| Occupation | Male | Female |
| Management | 108 (71.1%) | 44 (28.9%) |
| Business & Financial | 21 (21.6%) | 76 (78.3%) |
| Computers, Engineering & Science | 19 (29.7%) | 45 (70.3%) |
| Computers & Mathematics | 5 (12.8%) | 34 (87.2%) |
| Architecture & Engineering | 14 (56.0%) | 11 (44.0%) |
| Life, Physical & Social Science | 0 (0.0%) | 0 (0.0%) |
| Community & Social Service | 17 (20.5%) | 66 (79.5%) |
| Education, Arts & Media | 0 (0.0%) | 8 (100.0%) |
| Legal Services & Support | 0 (0.0%) | 7 (100.0%) |
| Education Instruction & Library | 17 (28.3%) | 43 (71.7%) |
| Arts, Media & Entertainment | 0 (0.0%) | 8 (100.0%) |
| Health Diagnosing & Treating | 7 (9.3%) | 68 (90.7%) |
| Health Technologists | 7 (10.6%) | 59 (89.4%) |
| Total (Category) | 172 (36.5%) | 299 (63.5%) |
| Total (Overall) | 756 (47.6%) | 833 (52.4%) |
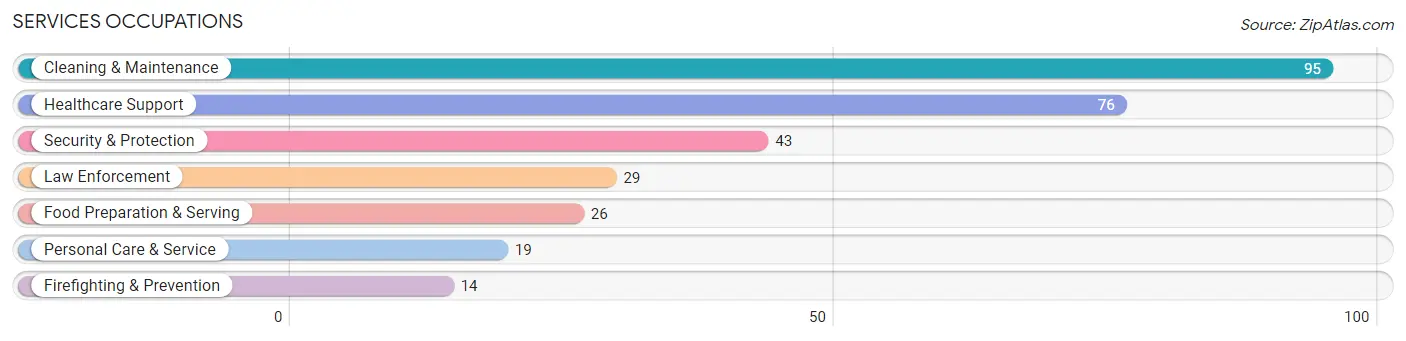
Services Occupations
The most common Services occupations in Harbour Heights are Cleaning & Maintenance (95 | 6.0%), Healthcare Support (76 | 4.8%), Security & Protection (43 | 2.7%), Law Enforcement (29 | 1.8%), and Food Preparation & Serving (26 | 1.6%).
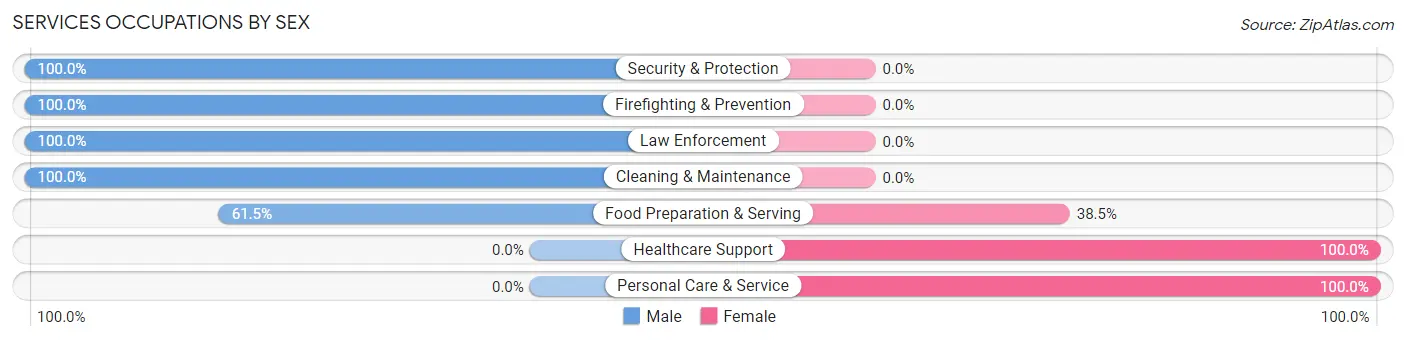
Services Occupations by Sex
Within the Services occupations in Harbour Heights, the most male-oriented occupations are Security & Protection (100.0%), Firefighting & Prevention (100.0%), and Law Enforcement (100.0%), while the most female-oriented occupations are Healthcare Support (100.0%), Personal Care & Service (100.0%), and Food Preparation & Serving (38.5%).
| Occupation | Male | Female |
| Healthcare Support | 0 (0.0%) | 76 (100.0%) |
| Security & Protection | 43 (100.0%) | 0 (0.0%) |
| Firefighting & Prevention | 14 (100.0%) | 0 (0.0%) |
| Law Enforcement | 29 (100.0%) | 0 (0.0%) |
| Food Preparation & Serving | 16 (61.5%) | 10 (38.5%) |
| Cleaning & Maintenance | 95 (100.0%) | 0 (0.0%) |
| Personal Care & Service | 0 (0.0%) | 19 (100.0%) |
| Total (Category) | 154 (59.5%) | 105 (40.5%) |
| Total (Overall) | 756 (47.6%) | 833 (52.4%) |
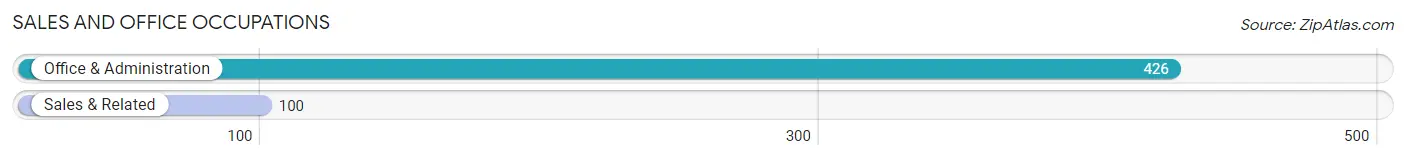
Sales and Office Occupations
The most common Sales and Office occupations in Harbour Heights are Office & Administration (426 | 26.8%), and Sales & Related (100 | 6.3%).
Sales and Office Occupations by Sex
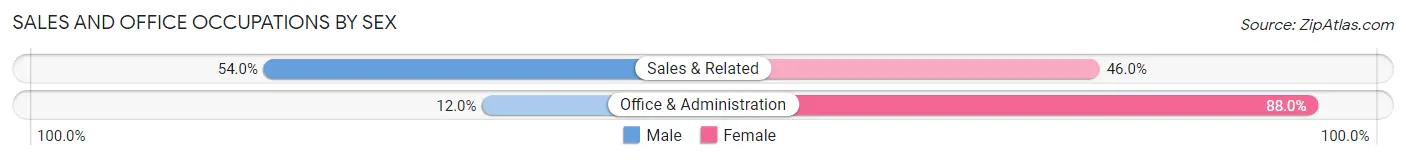
| Occupation | Male | Female |
| Sales & Related | 54 (54.0%) | 46 (46.0%) |
| Office & Administration | 51 (12.0%) | 375 (88.0%) |
| Total (Category) | 105 (20.0%) | 421 (80.0%) |
| Total (Overall) | 756 (47.6%) | 833 (52.4%) |
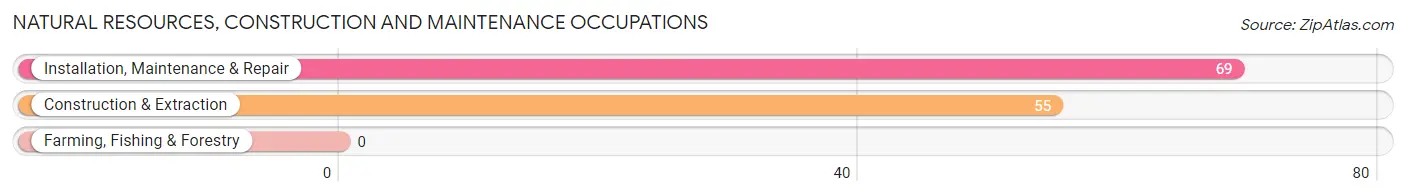
Natural Resources, Construction and Maintenance Occupations
The most common Natural Resources, Construction and Maintenance occupations in Harbour Heights are Installation, Maintenance & Repair (69 | 4.3%), and Construction & Extraction (55 | 3.5%).
Natural Resources, Construction and Maintenance Occupations by Sex
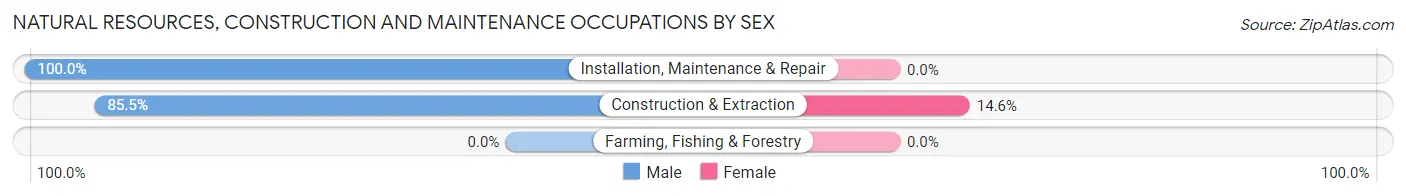
| Occupation | Male | Female |
| Farming, Fishing & Forestry | 0 (0.0%) | 0 (0.0%) |
| Construction & Extraction | 47 (85.5%) | 8 (14.5%) |
| Installation, Maintenance & Repair | 69 (100.0%) | 0 (0.0%) |
| Total (Category) | 116 (93.5%) | 8 (6.5%) |
| Total (Overall) | 756 (47.6%) | 833 (52.4%) |
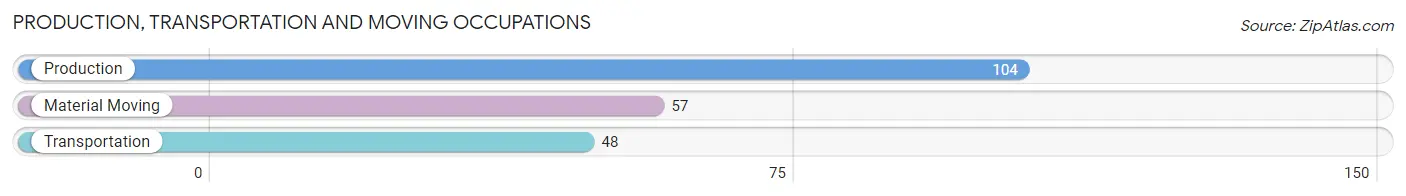
Production, Transportation and Moving Occupations
The most common Production, Transportation and Moving occupations in Harbour Heights are Production (104 | 6.5%), Material Moving (57 | 3.6%), and Transportation (48 | 3.0%).
Production, Transportation and Moving Occupations by Sex
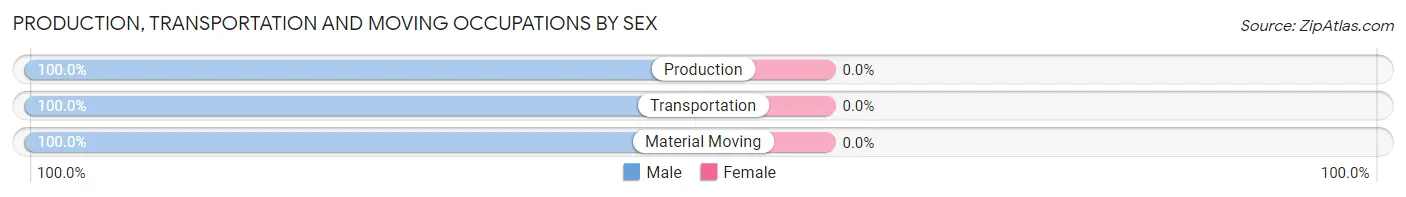
| Occupation | Male | Female |
| Production | 104 (100.0%) | 0 (0.0%) |
| Transportation | 48 (100.0%) | 0 (0.0%) |
| Material Moving | 57 (100.0%) | 0 (0.0%) |
| Total (Category) | 209 (100.0%) | 0 (0.0%) |
| Total (Overall) | 756 (47.6%) | 833 (52.4%) |
Employment Industries by Sex in Harbour Heights
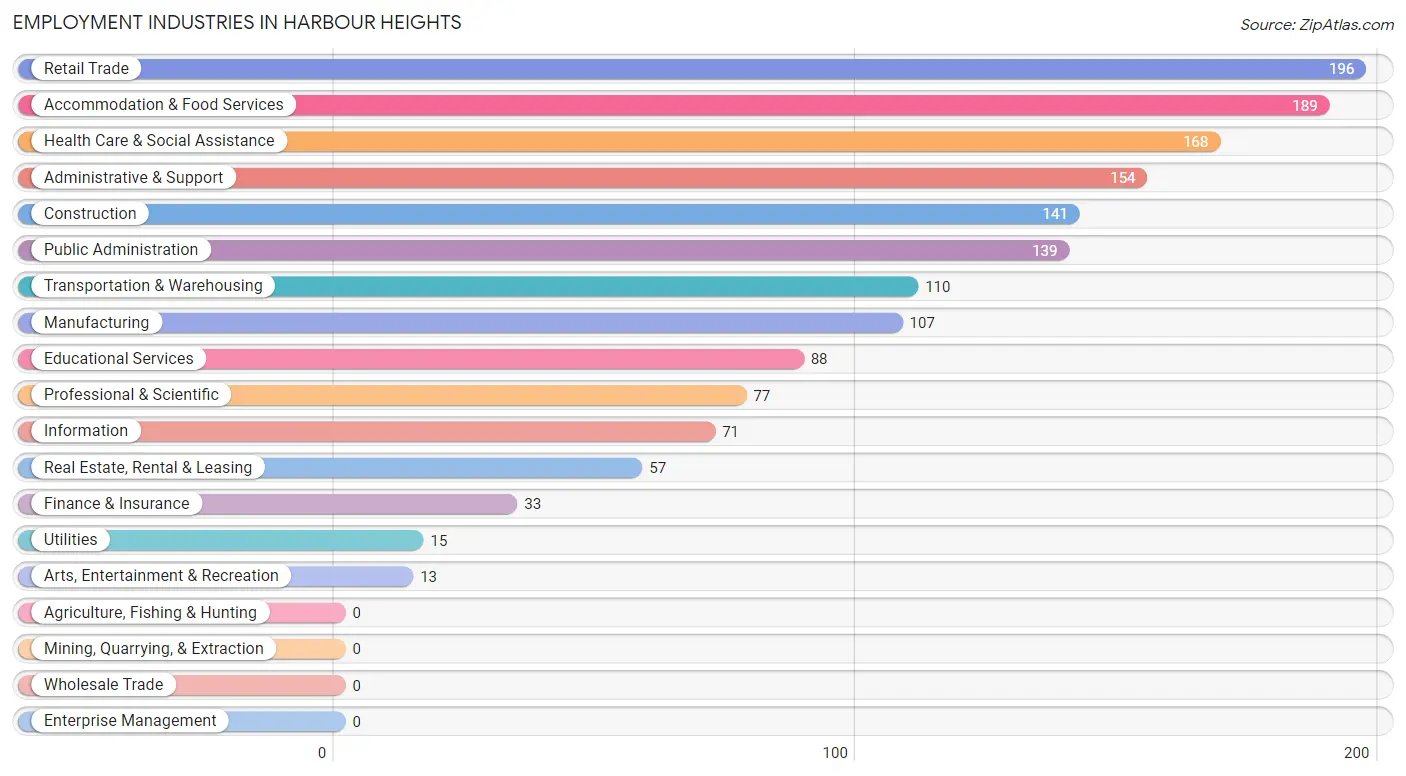
Employment Industries in Harbour Heights
The major employment industries in Harbour Heights include Retail Trade (196 | 12.3%), Accommodation & Food Services (189 | 11.9%), Health Care & Social Assistance (168 | 10.6%), Administrative & Support (154 | 9.7%), and Construction (141 | 8.9%).
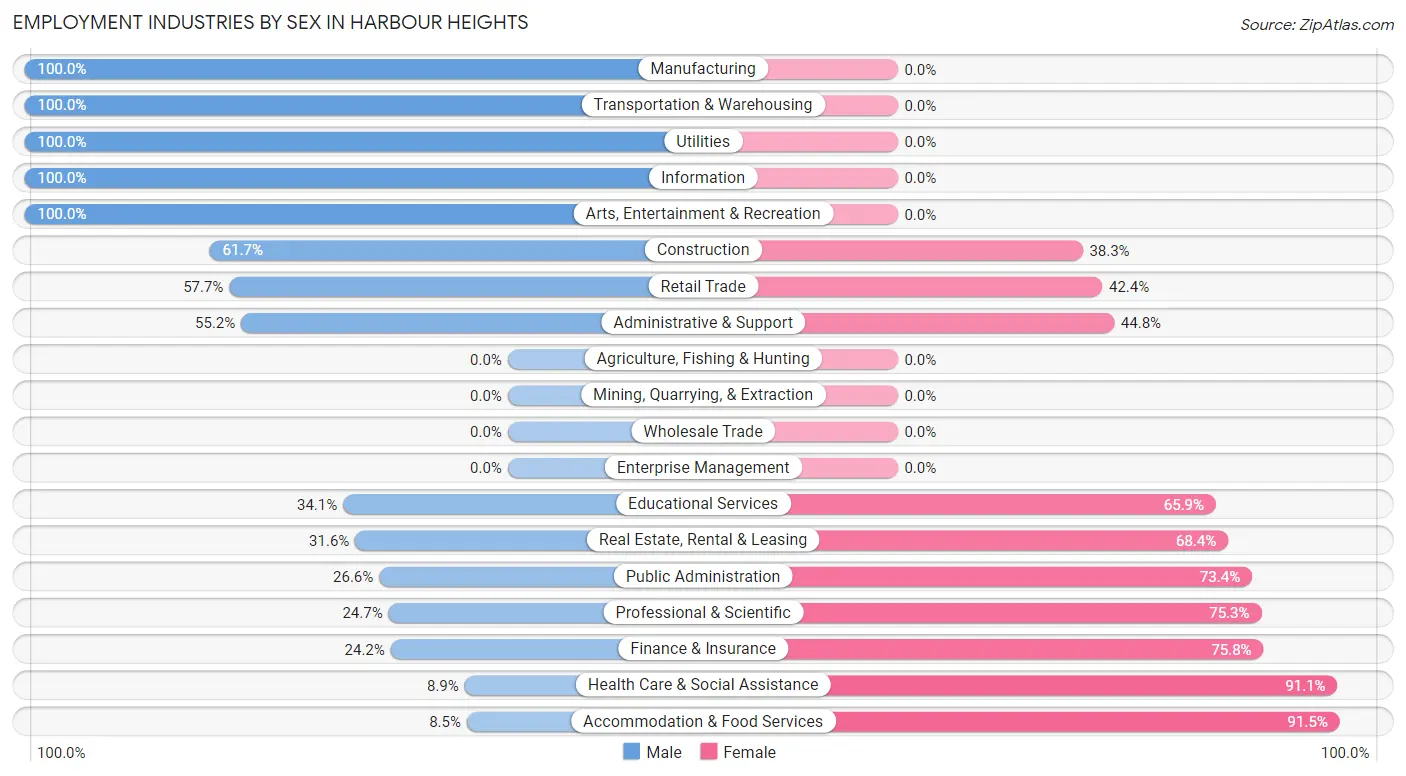
Employment Industries by Sex in Harbour Heights
The Harbour Heights industries that see more men than women are Manufacturing (100.0%), Transportation & Warehousing (100.0%), and Utilities (100.0%), whereas the industries that tend to have a higher number of women are Accommodation & Food Services (91.5%), Health Care & Social Assistance (91.1%), and Finance & Insurance (75.8%).
| Industry | Male | Female |
| Agriculture, Fishing & Hunting | 0 (0.0%) | 0 (0.0%) |
| Mining, Quarrying, & Extraction | 0 (0.0%) | 0 (0.0%) |
| Construction | 87 (61.7%) | 54 (38.3%) |
| Manufacturing | 107 (100.0%) | 0 (0.0%) |
| Wholesale Trade | 0 (0.0%) | 0 (0.0%) |
| Retail Trade | 113 (57.7%) | 83 (42.3%) |
| Transportation & Warehousing | 110 (100.0%) | 0 (0.0%) |
| Utilities | 15 (100.0%) | 0 (0.0%) |
| Information | 71 (100.0%) | 0 (0.0%) |
| Finance & Insurance | 8 (24.2%) | 25 (75.8%) |
| Real Estate, Rental & Leasing | 18 (31.6%) | 39 (68.4%) |
| Professional & Scientific | 19 (24.7%) | 58 (75.3%) |
| Enterprise Management | 0 (0.0%) | 0 (0.0%) |
| Administrative & Support | 85 (55.2%) | 69 (44.8%) |
| Educational Services | 30 (34.1%) | 58 (65.9%) |
| Health Care & Social Assistance | 15 (8.9%) | 153 (91.1%) |
| Arts, Entertainment & Recreation | 13 (100.0%) | 0 (0.0%) |
| Accommodation & Food Services | 16 (8.5%) | 173 (91.5%) |
| Public Administration | 37 (26.6%) | 102 (73.4%) |
| Total | 756 (47.6%) | 833 (52.4%) |
Education in Harbour Heights
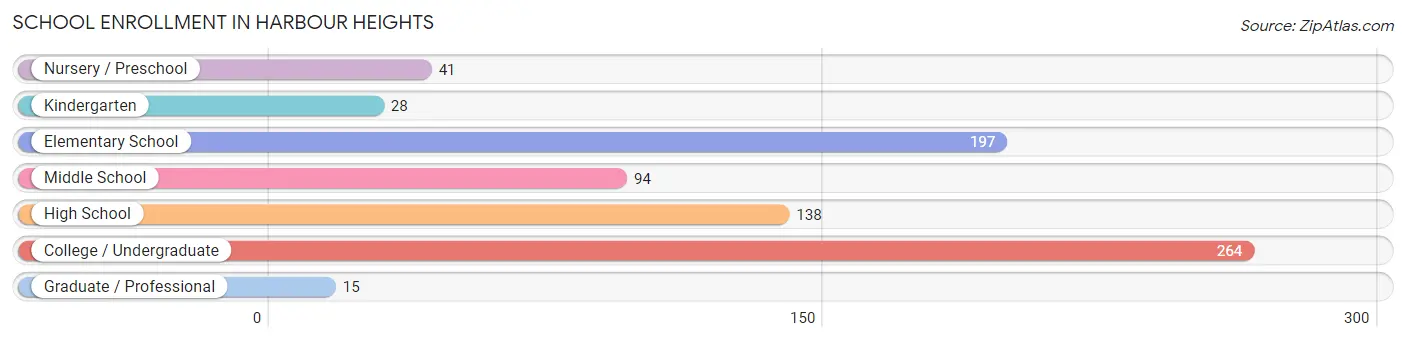
School Enrollment in Harbour Heights
The most common levels of schooling among the 777 students in Harbour Heights are college / undergraduate (264 | 34.0%), elementary school (197 | 25.4%), and high school (138 | 17.8%).
| School Level | # Students | % Students |
| Nursery / Preschool | 41 | 5.3% |
| Kindergarten | 28 | 3.6% |
| Elementary School | 197 | 25.4% |
| Middle School | 94 | 12.1% |
| High School | 138 | 17.8% |
| College / Undergraduate | 264 | 34.0% |
| Graduate / Professional | 15 | 1.9% |
| Total | 777 | 100.0% |
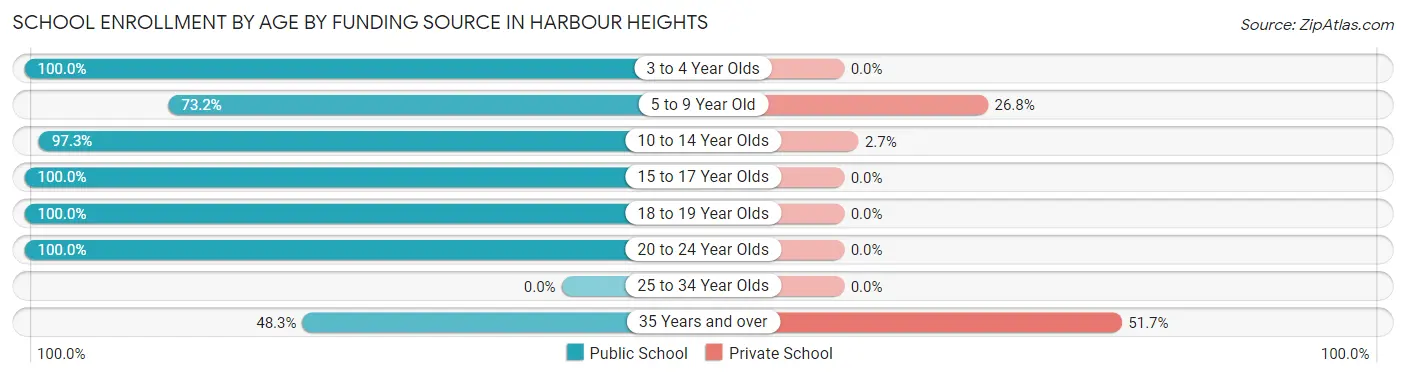
School Enrollment by Age by Funding Source in Harbour Heights
Out of a total of 777 students who are enrolled in schools in Harbour Heights, 80 (10.3%) attend a private institution, while the remaining 697 (89.7%) are enrolled in public schools. The age group of 35 years and over has the highest likelihood of being enrolled in private schools, with 15 (51.7% in the age bracket) enrolled. Conversely, the age group of 3 to 4 year olds has the lowest likelihood of being enrolled in a private school, with 9 (100.0% in the age bracket) attending a public institution.
| Age Bracket | Public School | Private School |
| 3 to 4 Year Olds | 9 (100.0%) | 0 (0.0%) |
| 5 to 9 Year Old | 164 (73.2%) | 60 (26.8%) |
| 10 to 14 Year Olds | 182 (97.3%) | 5 (2.7%) |
| 15 to 17 Year Olds | 69 (100.0%) | 0 (0.0%) |
| 18 to 19 Year Olds | 9 (100.0%) | 0 (0.0%) |
| 20 to 24 Year Olds | 250 (100.0%) | 0 (0.0%) |
| 25 to 34 Year Olds | 0 (0.0%) | 0 (0.0%) |
| 35 Years and over | 14 (48.3%) | 15 (51.7%) |
| Total | 697 (89.7%) | 80 (10.3%) |
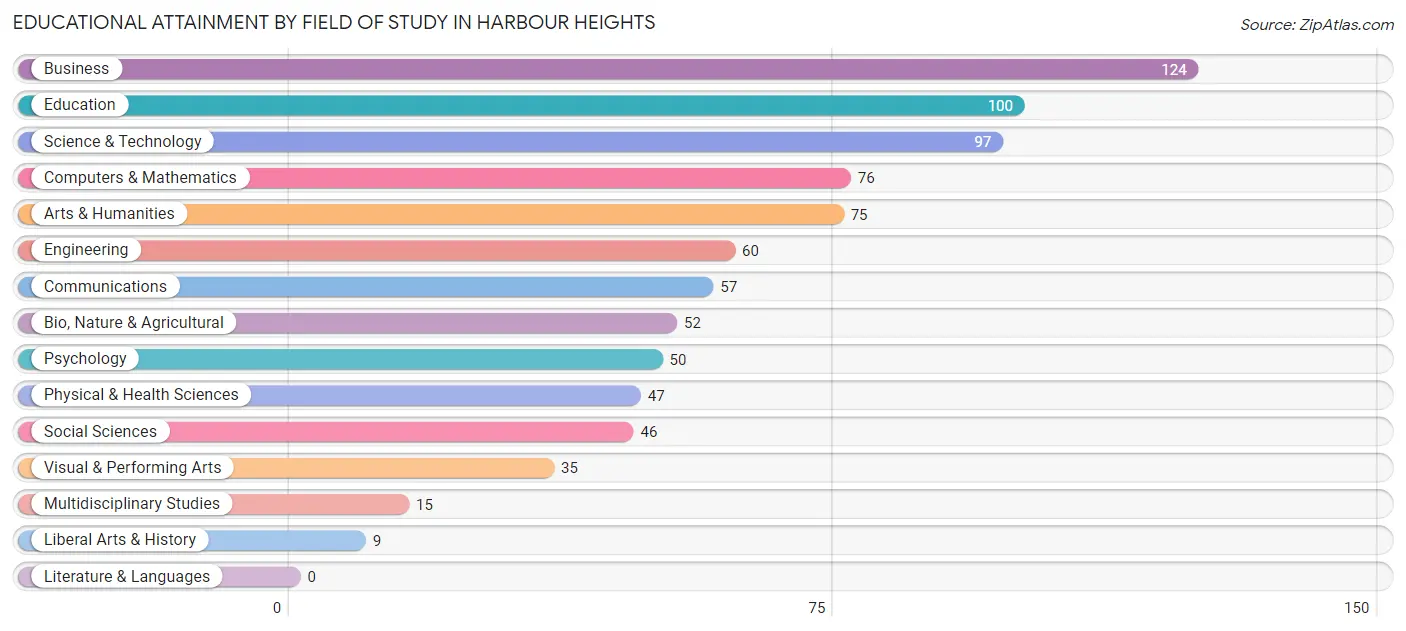
Educational Attainment by Field of Study in Harbour Heights
Business (124 | 14.7%), education (100 | 11.9%), science & technology (97 | 11.5%), computers & mathematics (76 | 9.0%), and arts & humanities (75 | 8.9%) are the most common fields of study among 843 individuals in Harbour Heights who have obtained a bachelor's degree or higher.
| Field of Study | # Graduates | % Graduates |
| Computers & Mathematics | 76 | 9.0% |
| Bio, Nature & Agricultural | 52 | 6.2% |
| Physical & Health Sciences | 47 | 5.6% |
| Psychology | 50 | 5.9% |
| Social Sciences | 46 | 5.5% |
| Engineering | 60 | 7.1% |
| Multidisciplinary Studies | 15 | 1.8% |
| Science & Technology | 97 | 11.5% |
| Business | 124 | 14.7% |
| Education | 100 | 11.9% |
| Literature & Languages | 0 | 0.0% |
| Liberal Arts & History | 9 | 1.1% |
| Visual & Performing Arts | 35 | 4.2% |
| Communications | 57 | 6.8% |
| Arts & Humanities | 75 | 8.9% |
| Total | 843 | 100.0% |
Transportation & Commute in Harbour Heights
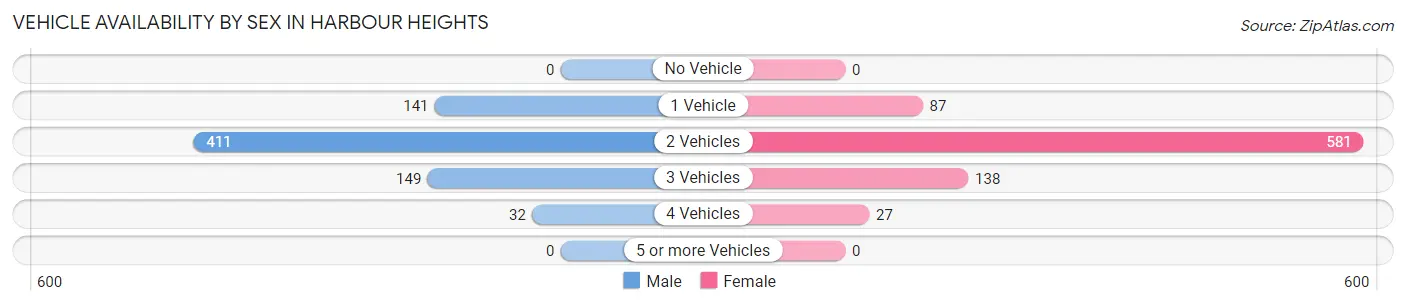
Vehicle Availability by Sex in Harbour Heights
The most prevalent vehicle ownership categories in Harbour Heights are males with 2 vehicles (411, accounting for 56.1%) and females with 2 vehicles (581, making up 49.3%).
| Vehicles Available | Male | Female |
| No Vehicle | 0 (0.0%) | 0 (0.0%) |
| 1 Vehicle | 141 (19.2%) | 87 (10.4%) |
| 2 Vehicles | 411 (56.1%) | 581 (69.8%) |
| 3 Vehicles | 149 (20.3%) | 138 (16.6%) |
| 4 Vehicles | 32 (4.4%) | 27 (3.2%) |
| 5 or more Vehicles | 0 (0.0%) | 0 (0.0%) |
| Total | 733 (100.0%) | 833 (100.0%) |
Commute Time in Harbour Heights
The most frequently occuring commute durations in Harbour Heights are 20 to 24 minutes (264 commuters, 18.9%), 15 to 19 minutes (258 commuters, 18.4%), and 10 to 14 minutes (226 commuters, 16.2%).
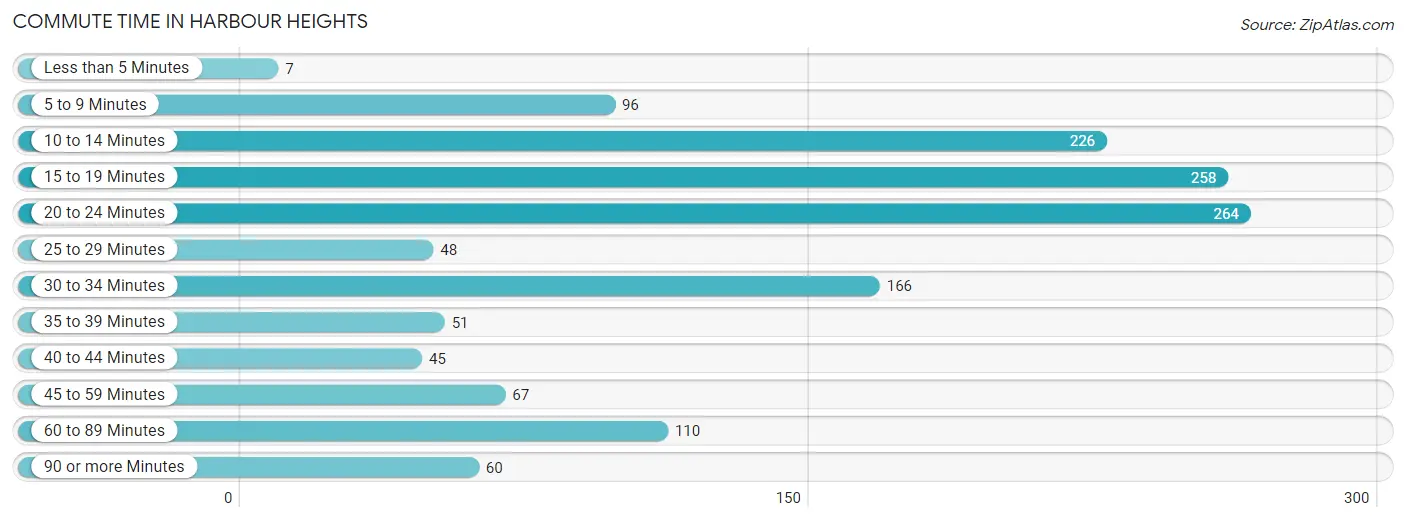
| Commute Time | # Commuters | % Commuters |
| Less than 5 Minutes | 7 | 0.5% |
| 5 to 9 Minutes | 96 | 6.9% |
| 10 to 14 Minutes | 226 | 16.2% |
| 15 to 19 Minutes | 258 | 18.4% |
| 20 to 24 Minutes | 264 | 18.9% |
| 25 to 29 Minutes | 48 | 3.4% |
| 30 to 34 Minutes | 166 | 11.9% |
| 35 to 39 Minutes | 51 | 3.6% |
| 40 to 44 Minutes | 45 | 3.2% |
| 45 to 59 Minutes | 67 | 4.8% |
| 60 to 89 Minutes | 110 | 7.9% |
| 90 or more Minutes | 60 | 4.3% |
Commute Time by Sex in Harbour Heights
The most common commute times in Harbour Heights are 15 to 19 minutes (174 commuters, 26.0%) for males and 20 to 24 minutes (216 commuters, 29.6%) for females.
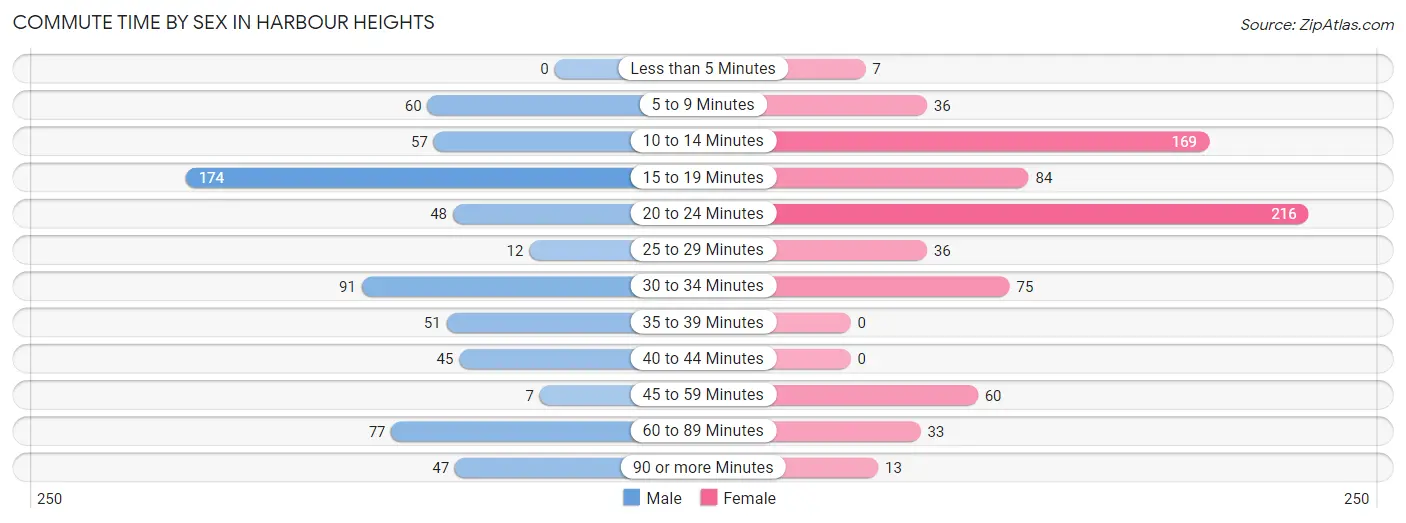
| Commute Time | Male | Female |
| Less than 5 Minutes | 0 (0.0%) | 7 (1.0%) |
| 5 to 9 Minutes | 60 (9.0%) | 36 (4.9%) |
| 10 to 14 Minutes | 57 (8.5%) | 169 (23.2%) |
| 15 to 19 Minutes | 174 (26.0%) | 84 (11.5%) |
| 20 to 24 Minutes | 48 (7.2%) | 216 (29.6%) |
| 25 to 29 Minutes | 12 (1.8%) | 36 (4.9%) |
| 30 to 34 Minutes | 91 (13.6%) | 75 (10.3%) |
| 35 to 39 Minutes | 51 (7.6%) | 0 (0.0%) |
| 40 to 44 Minutes | 45 (6.7%) | 0 (0.0%) |
| 45 to 59 Minutes | 7 (1.1%) | 60 (8.2%) |
| 60 to 89 Minutes | 77 (11.5%) | 33 (4.5%) |
| 90 or more Minutes | 47 (7.0%) | 13 (1.8%) |
Time of Departure to Work by Sex in Harbour Heights
The most frequent times of departure to work in Harbour Heights are 12:00 AM to 4:59 AM (144, 21.5%) for males and 8:00 AM to 8:29 AM (243, 33.3%) for females.
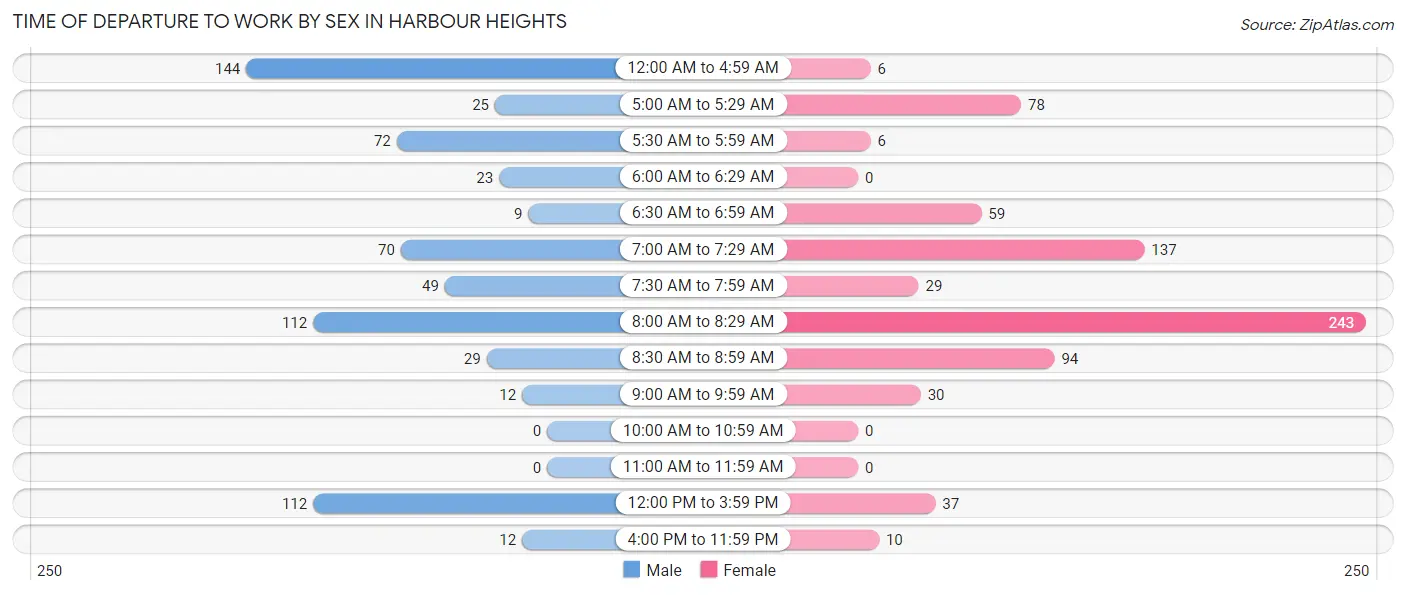
| Time of Departure | Male | Female |
| 12:00 AM to 4:59 AM | 144 (21.5%) | 6 (0.8%) |
| 5:00 AM to 5:29 AM | 25 (3.7%) | 78 (10.7%) |
| 5:30 AM to 5:59 AM | 72 (10.8%) | 6 (0.8%) |
| 6:00 AM to 6:29 AM | 23 (3.4%) | 0 (0.0%) |
| 6:30 AM to 6:59 AM | 9 (1.3%) | 59 (8.1%) |
| 7:00 AM to 7:29 AM | 70 (10.5%) | 137 (18.8%) |
| 7:30 AM to 7:59 AM | 49 (7.3%) | 29 (4.0%) |
| 8:00 AM to 8:29 AM | 112 (16.7%) | 243 (33.3%) |
| 8:30 AM to 8:59 AM | 29 (4.3%) | 94 (12.9%) |
| 9:00 AM to 9:59 AM | 12 (1.8%) | 30 (4.1%) |
| 10:00 AM to 10:59 AM | 0 (0.0%) | 0 (0.0%) |
| 11:00 AM to 11:59 AM | 0 (0.0%) | 0 (0.0%) |
| 12:00 PM to 3:59 PM | 112 (16.7%) | 37 (5.1%) |
| 4:00 PM to 11:59 PM | 12 (1.8%) | 10 (1.4%) |
| Total | 669 (100.0%) | 729 (100.0%) |
Housing Occupancy in Harbour Heights
Occupancy by Ownership in Harbour Heights
Of the total 1,801 dwellings in Harbour Heights, owner-occupied units account for 1,434 (79.6%), while renter-occupied units make up 367 (20.4%).
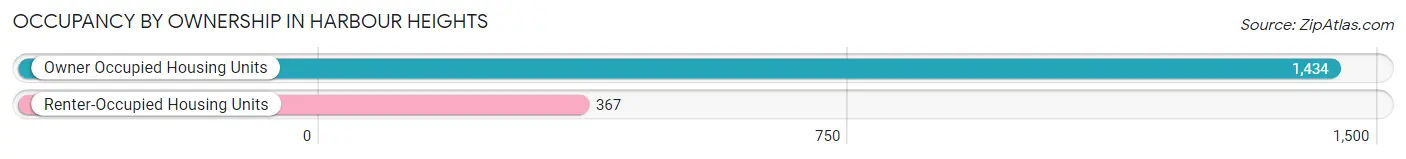
| Occupancy | # Housing Units | % Housing Units |
| Owner Occupied Housing Units | 1,434 | 79.6% |
| Renter-Occupied Housing Units | 367 | 20.4% |
| Total Occupied Housing Units | 1,801 | 100.0% |
Occupancy by Household Size in Harbour Heights
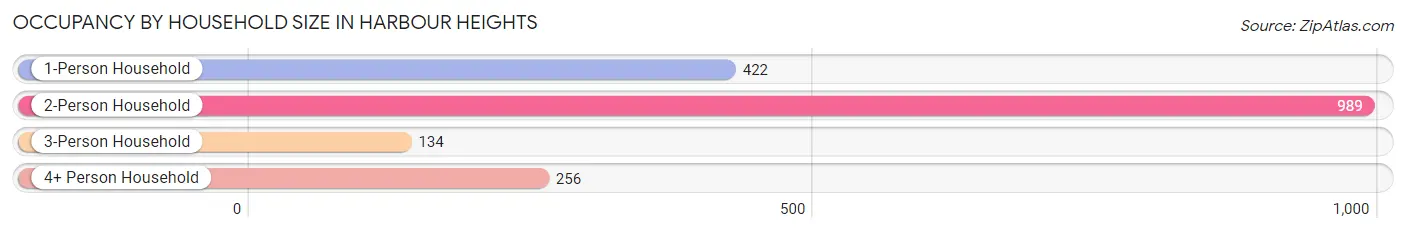
| Household Size | # Housing Units | % Housing Units |
| 1-Person Household | 422 | 23.4% |
| 2-Person Household | 989 | 54.9% |
| 3-Person Household | 134 | 7.4% |
| 4+ Person Household | 256 | 14.2% |
| Total Housing Units | 1,801 | 100.0% |
Occupancy by Ownership by Household Size in Harbour Heights
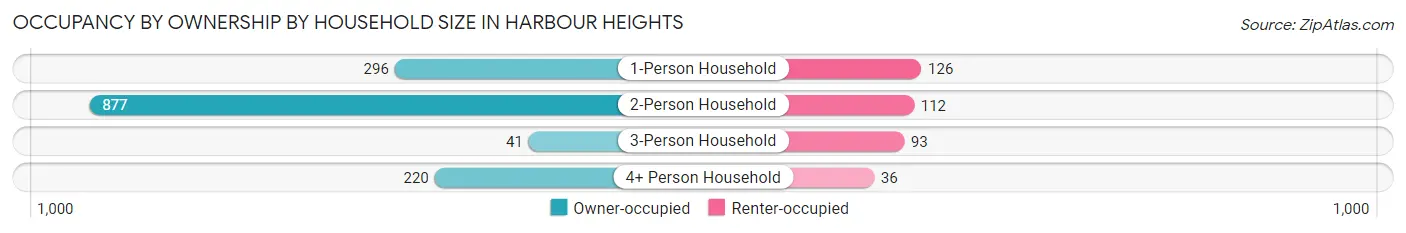
| Household Size | Owner-occupied | Renter-occupied |
| 1-Person Household | 296 (70.1%) | 126 (29.9%) |
| 2-Person Household | 877 (88.7%) | 112 (11.3%) |
| 3-Person Household | 41 (30.6%) | 93 (69.4%) |
| 4+ Person Household | 220 (85.9%) | 36 (14.1%) |
| Total Housing Units | 1,434 (79.6%) | 367 (20.4%) |
Occupancy by Educational Attainment in Harbour Heights
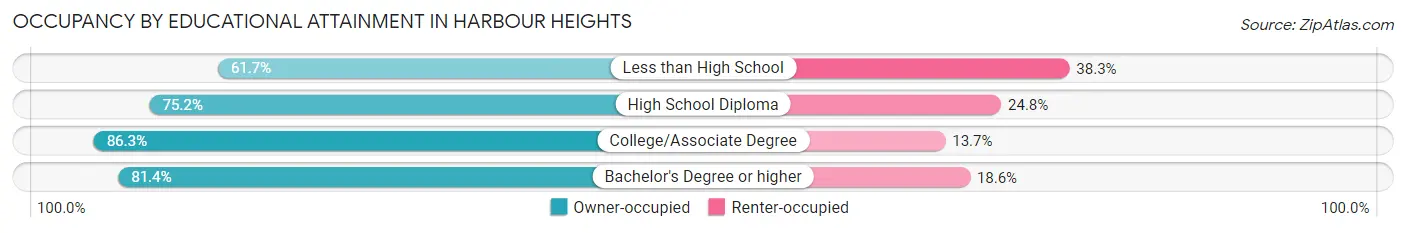
| Household Size | Owner-occupied | Renter-occupied |
| Less than High School | 124 (61.7%) | 77 (38.3%) |
| High School Diploma | 334 (75.2%) | 110 (24.8%) |
| College/Associate Degree | 617 (86.3%) | 98 (13.7%) |
| Bachelor's Degree or higher | 359 (81.4%) | 82 (18.6%) |
Occupancy by Age of Householder in Harbour Heights
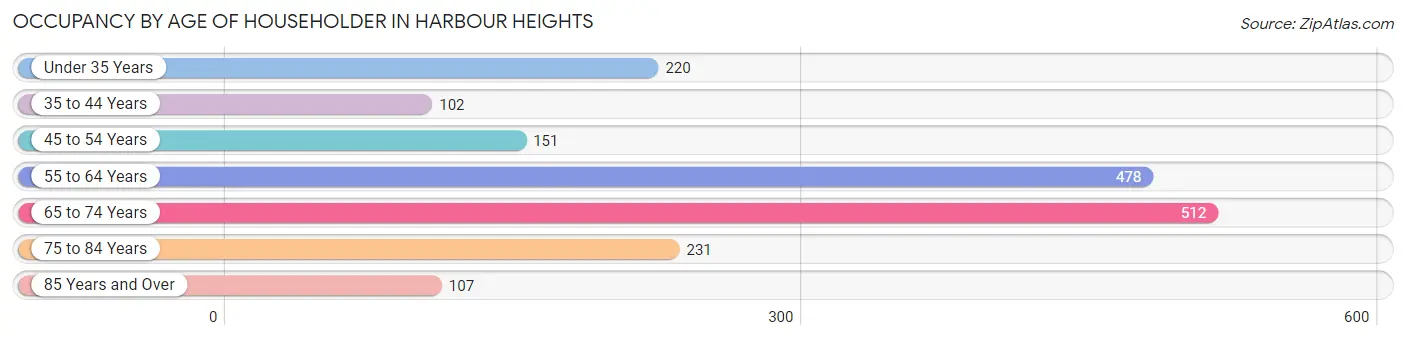
| Age Bracket | # Households | % Households |
| Under 35 Years | 220 | 12.2% |
| 35 to 44 Years | 102 | 5.7% |
| 45 to 54 Years | 151 | 8.4% |
| 55 to 64 Years | 478 | 26.5% |
| 65 to 74 Years | 512 | 28.4% |
| 75 to 84 Years | 231 | 12.8% |
| 85 Years and Over | 107 | 5.9% |
| Total | 1,801 | 100.0% |
Housing Finances in Harbour Heights
Median Income by Occupancy in Harbour Heights
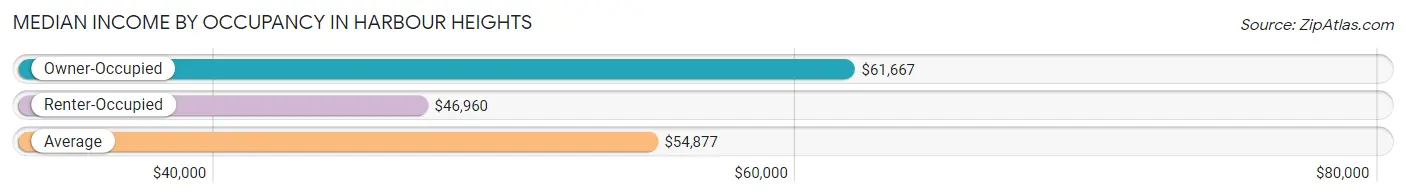
| Occupancy Type | # Households | Median Income |
| Owner-Occupied | 1,434 (79.6%) | $61,667 |
| Renter-Occupied | 367 (20.4%) | $46,960 |
| Average | 1,801 (100.0%) | $54,877 |
Occupancy by Householder Income Bracket in Harbour Heights
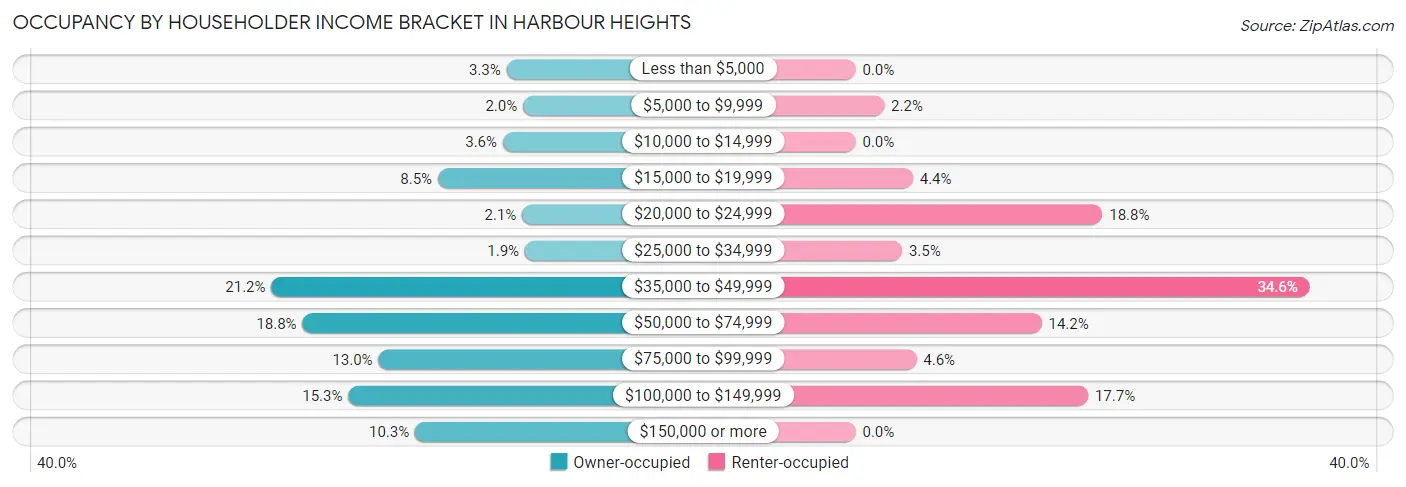
| Income Bracket | Owner-occupied | Renter-occupied |
| Less than $5,000 | 47 (3.3%) | 0 (0.0%) |
| $5,000 to $9,999 | 29 (2.0%) | 8 (2.2%) |
| $10,000 to $14,999 | 51 (3.6%) | 0 (0.0%) |
| $15,000 to $19,999 | 122 (8.5%) | 16 (4.4%) |
| $20,000 to $24,999 | 30 (2.1%) | 69 (18.8%) |
| $25,000 to $34,999 | 27 (1.9%) | 13 (3.5%) |
| $35,000 to $49,999 | 304 (21.2%) | 127 (34.6%) |
| $50,000 to $74,999 | 270 (18.8%) | 52 (14.2%) |
| $75,000 to $99,999 | 187 (13.0%) | 17 (4.6%) |
| $100,000 to $149,999 | 220 (15.3%) | 65 (17.7%) |
| $150,000 or more | 147 (10.2%) | 0 (0.0%) |
| Total | 1,434 (100.0%) | 367 (100.0%) |
Monthly Housing Cost Tiers in Harbour Heights
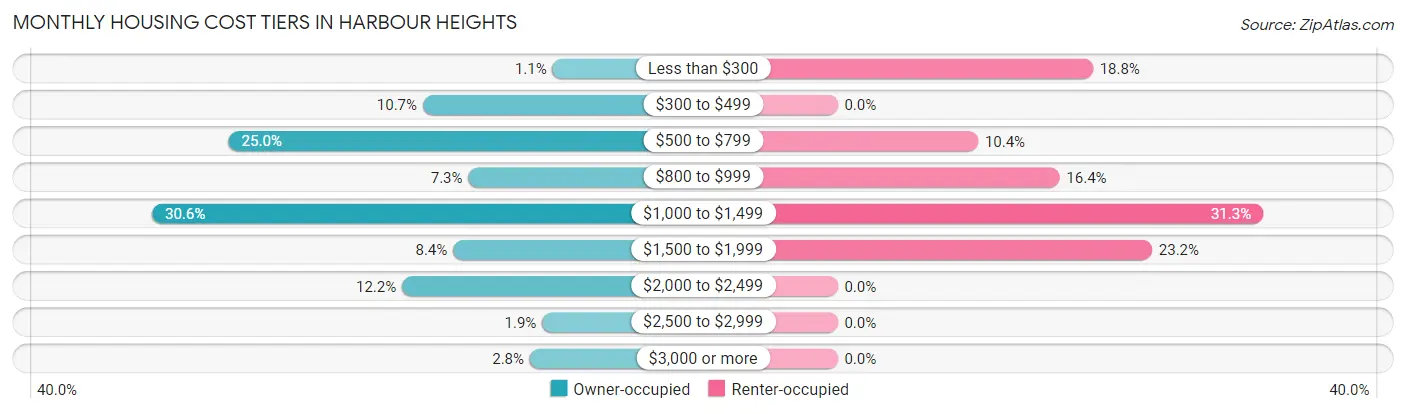
| Monthly Cost | Owner-occupied | Renter-occupied |
| Less than $300 | 16 (1.1%) | 69 (18.8%) |
| $300 to $499 | 153 (10.7%) | 0 (0.0%) |
| $500 to $799 | 358 (25.0%) | 38 (10.3%) |
| $800 to $999 | 105 (7.3%) | 60 (16.4%) |
| $1,000 to $1,499 | 439 (30.6%) | 115 (31.3%) |
| $1,500 to $1,999 | 121 (8.4%) | 85 (23.2%) |
| $2,000 to $2,499 | 175 (12.2%) | 0 (0.0%) |
| $2,500 to $2,999 | 27 (1.9%) | 0 (0.0%) |
| $3,000 or more | 40 (2.8%) | 0 (0.0%) |
| Total | 1,434 (100.0%) | 367 (100.0%) |
Physical Housing Characteristics in Harbour Heights
Housing Structures in Harbour Heights
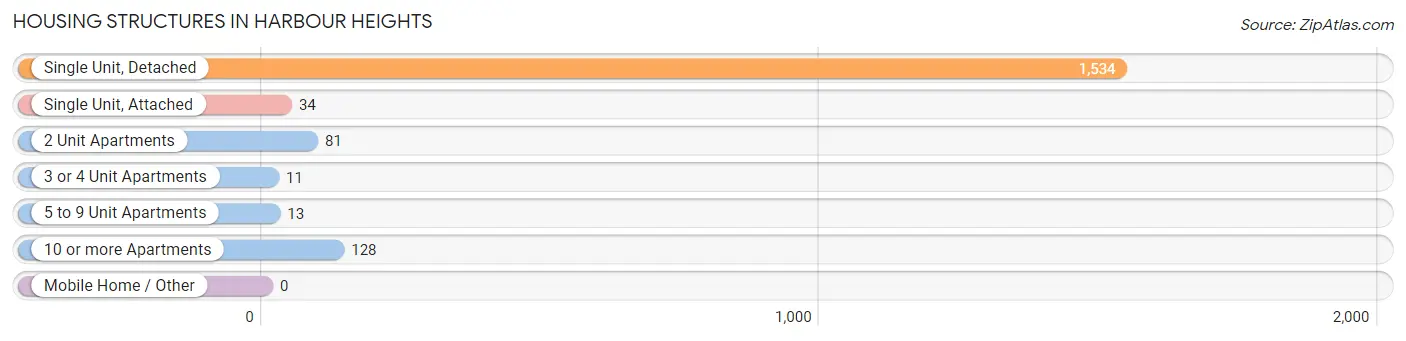
| Structure Type | # Housing Units | % Housing Units |
| Single Unit, Detached | 1,534 | 85.2% |
| Single Unit, Attached | 34 | 1.9% |
| 2 Unit Apartments | 81 | 4.5% |
| 3 or 4 Unit Apartments | 11 | 0.6% |
| 5 to 9 Unit Apartments | 13 | 0.7% |
| 10 or more Apartments | 128 | 7.1% |
| Mobile Home / Other | 0 | 0.0% |
| Total | 1,801 | 100.0% |
Housing Structures by Occupancy in Harbour Heights
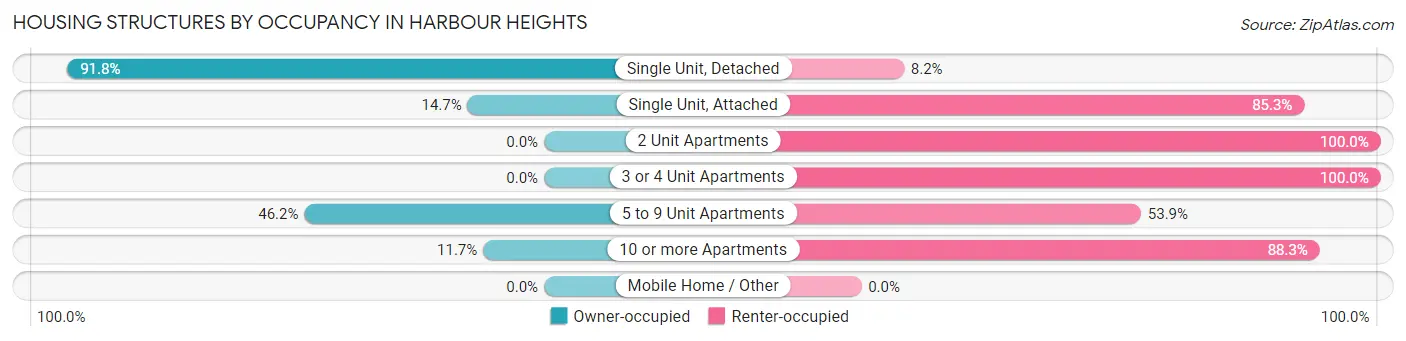
| Structure Type | Owner-occupied | Renter-occupied |
| Single Unit, Detached | 1,408 (91.8%) | 126 (8.2%) |
| Single Unit, Attached | 5 (14.7%) | 29 (85.3%) |
| 2 Unit Apartments | 0 (0.0%) | 81 (100.0%) |
| 3 or 4 Unit Apartments | 0 (0.0%) | 11 (100.0%) |
| 5 to 9 Unit Apartments | 6 (46.2%) | 7 (53.8%) |
| 10 or more Apartments | 15 (11.7%) | 113 (88.3%) |
| Mobile Home / Other | 0 (0.0%) | 0 (0.0%) |
| Total | 1,434 (79.6%) | 367 (20.4%) |
Housing Structures by Number of Rooms in Harbour Heights
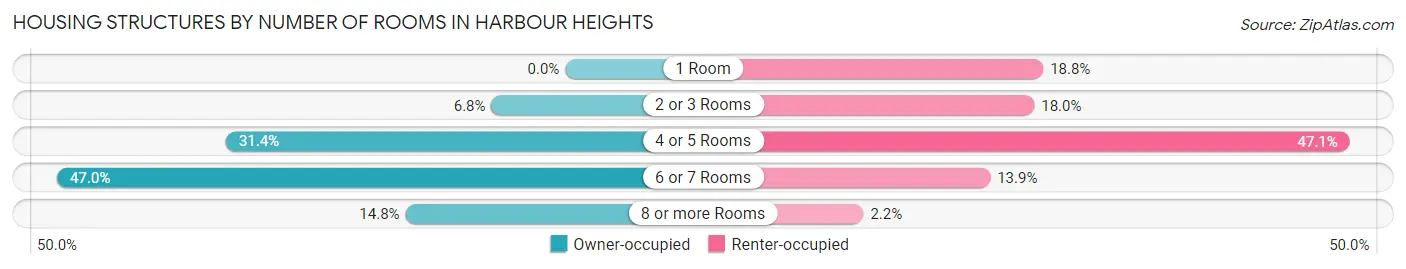
| Number of Rooms | Owner-occupied | Renter-occupied |
| 1 Room | 0 (0.0%) | 69 (18.8%) |
| 2 or 3 Rooms | 98 (6.8%) | 66 (18.0%) |
| 4 or 5 Rooms | 450 (31.4%) | 173 (47.1%) |
| 6 or 7 Rooms | 674 (47.0%) | 51 (13.9%) |
| 8 or more Rooms | 212 (14.8%) | 8 (2.2%) |
| Total | 1,434 (100.0%) | 367 (100.0%) |
Housing Structure by Heating Type in Harbour Heights
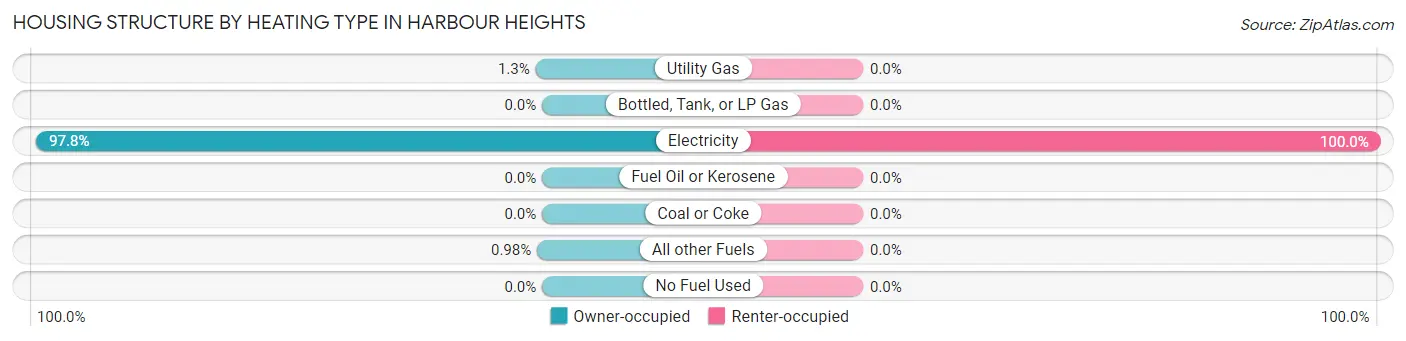
| Heating Type | Owner-occupied | Renter-occupied |
| Utility Gas | 18 (1.3%) | 0 (0.0%) |
| Bottled, Tank, or LP Gas | 0 (0.0%) | 0 (0.0%) |
| Electricity | 1,402 (97.8%) | 367 (100.0%) |
| Fuel Oil or Kerosene | 0 (0.0%) | 0 (0.0%) |
| Coal or Coke | 0 (0.0%) | 0 (0.0%) |
| All other Fuels | 14 (1.0%) | 0 (0.0%) |
| No Fuel Used | 0 (0.0%) | 0 (0.0%) |
| Total | 1,434 (100.0%) | 367 (100.0%) |
Household Vehicle Usage in Harbour Heights
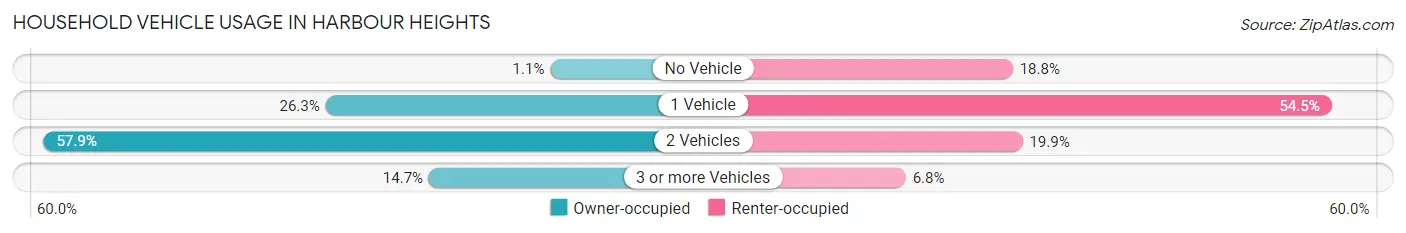
| Vehicles per Household | Owner-occupied | Renter-occupied |
| No Vehicle | 16 (1.1%) | 69 (18.8%) |
| 1 Vehicle | 377 (26.3%) | 200 (54.5%) |
| 2 Vehicles | 830 (57.9%) | 73 (19.9%) |
| 3 or more Vehicles | 211 (14.7%) | 25 (6.8%) |
| Total | 1,434 (100.0%) | 367 (100.0%) |
Real Estate & Mortgages in Harbour Heights
Real Estate and Mortgage Overview in Harbour Heights
| Characteristic | Without Mortgage | With Mortgage |
| Housing Units | 618 | 816 |
| Median Property Value | $305,500 | $282,000 |
| Median Household Income | $46,800 | $100 |
| Monthly Housing Costs | $639 | $40 |
| Real Estate Taxes | $2,534 | $0 |
Property Value by Mortgage Status in Harbour Heights
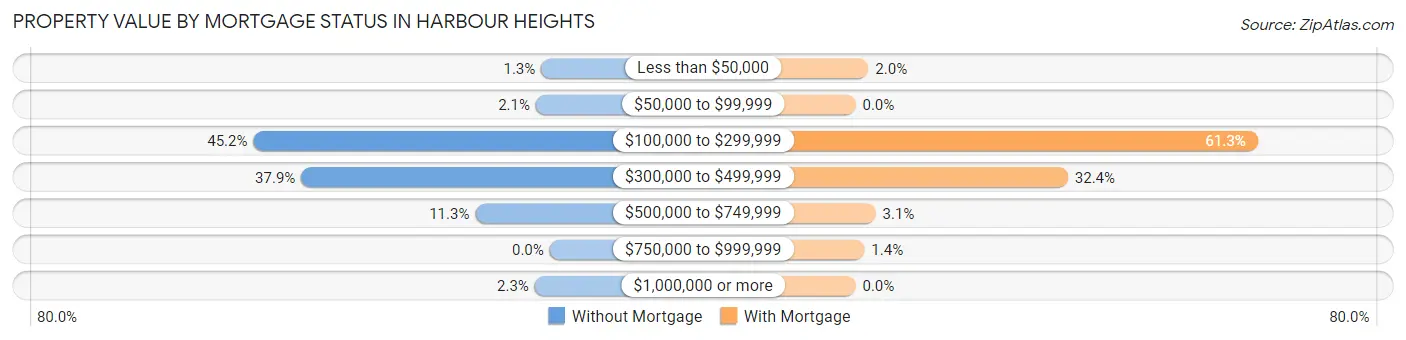
| Property Value | Without Mortgage | With Mortgage |
| Less than $50,000 | 8 (1.3%) | 16 (2.0%) |
| $50,000 to $99,999 | 13 (2.1%) | 0 (0.0%) |
| $100,000 to $299,999 | 279 (45.2%) | 500 (61.3%) |
| $300,000 to $499,999 | 234 (37.9%) | 264 (32.4%) |
| $500,000 to $749,999 | 70 (11.3%) | 25 (3.1%) |
| $750,000 to $999,999 | 0 (0.0%) | 11 (1.3%) |
| $1,000,000 or more | 14 (2.3%) | 0 (0.0%) |
| Total | 618 (100.0%) | 816 (100.0%) |
Household Income by Mortgage Status in Harbour Heights
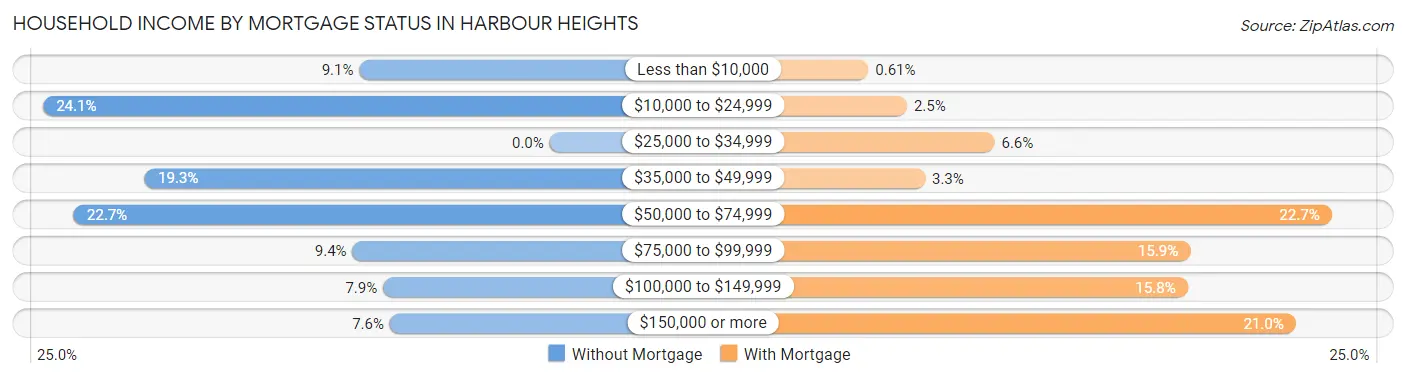
| Household Income | Without Mortgage | With Mortgage |
| Less than $10,000 | 56 (9.1%) | 5 (0.6%) |
| $10,000 to $24,999 | 149 (24.1%) | 20 (2.5%) |
| $25,000 to $34,999 | 0 (0.0%) | 54 (6.6%) |
| $35,000 to $49,999 | 119 (19.3%) | 27 (3.3%) |
| $50,000 to $74,999 | 140 (22.7%) | 185 (22.7%) |
| $75,000 to $99,999 | 58 (9.4%) | 130 (15.9%) |
| $100,000 to $149,999 | 49 (7.9%) | 129 (15.8%) |
| $150,000 or more | 47 (7.6%) | 171 (21.0%) |
| Total | 618 (100.0%) | 816 (100.0%) |
Property Value to Household Income Ratio in Harbour Heights
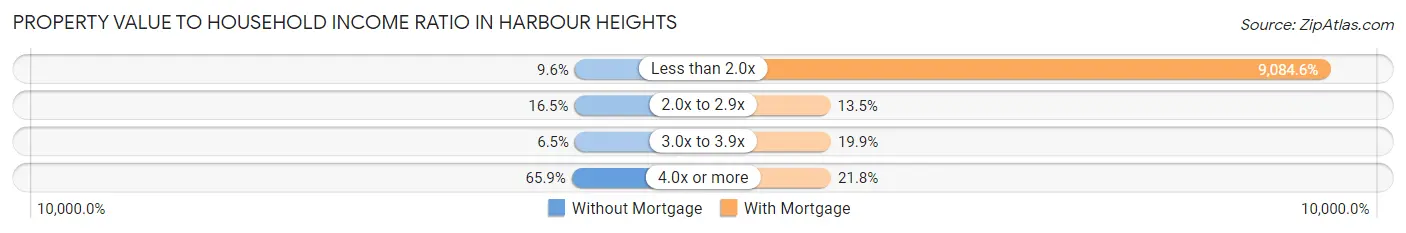
| Value-to-Income Ratio | Without Mortgage | With Mortgage |
| Less than 2.0x | 59 (9.6%) | 74,130 (9,084.6%) |
| 2.0x to 2.9x | 102 (16.5%) | 110 (13.5%) |
| 3.0x to 3.9x | 40 (6.5%) | 162 (19.9%) |
| 4.0x or more | 407 (65.9%) | 178 (21.8%) |
| Total | 618 (100.0%) | 816 (100.0%) |
Real Estate Taxes by Mortgage Status in Harbour Heights
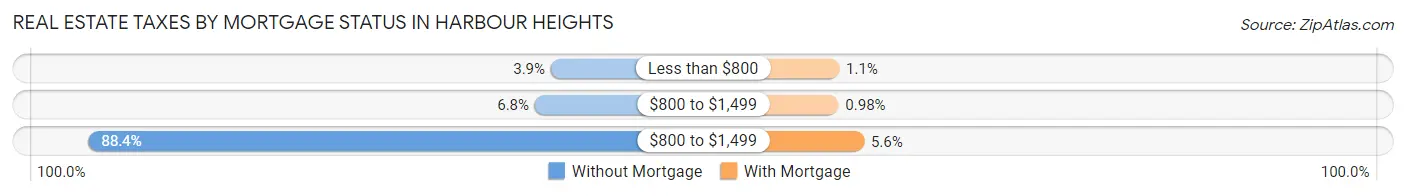
| Property Taxes | Without Mortgage | With Mortgage |
| Less than $800 | 24 (3.9%) | 9 (1.1%) |
| $800 to $1,499 | 42 (6.8%) | 8 (1.0%) |
| $800 to $1,499 | 546 (88.3%) | 46 (5.6%) |
| Total | 618 (100.0%) | 816 (100.0%) |
Health & Disability in Harbour Heights
Health Insurance Coverage by Age in Harbour Heights
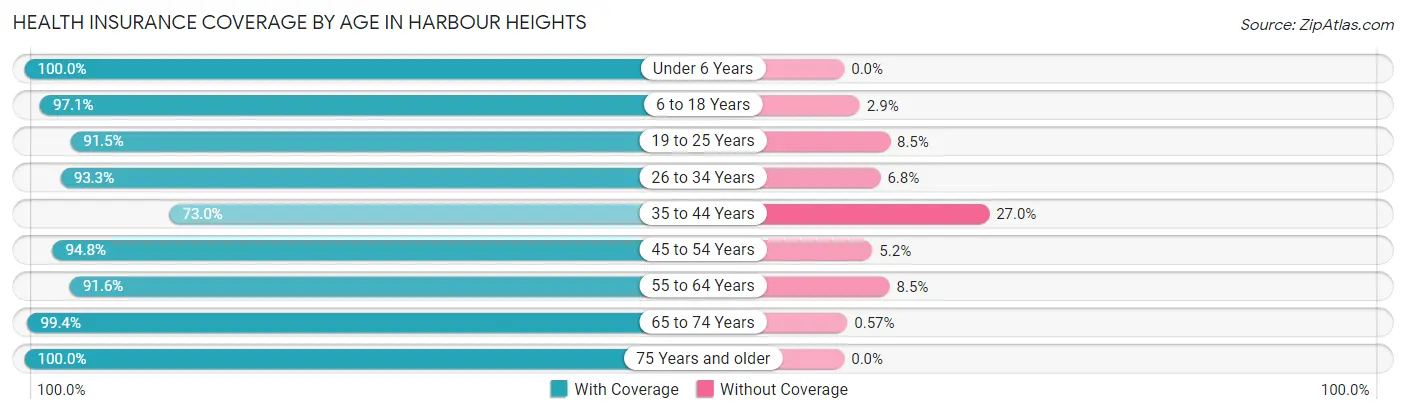
| Age Bracket | With Coverage | Without Coverage |
| Under 6 Years | 241 (100.0%) | 0 (0.0%) |
| 6 to 18 Years | 467 (97.1%) | 14 (2.9%) |
| 19 to 25 Years | 343 (91.5%) | 32 (8.5%) |
| 26 to 34 Years | 290 (93.2%) | 21 (6.8%) |
| 35 to 44 Years | 208 (73.0%) | 77 (27.0%) |
| 45 to 54 Years | 271 (94.8%) | 15 (5.2%) |
| 55 to 64 Years | 704 (91.5%) | 65 (8.5%) |
| 65 to 74 Years | 874 (99.4%) | 5 (0.6%) |
| 75 Years and older | 518 (100.0%) | 0 (0.0%) |
| Total | 3,916 (94.5%) | 229 (5.5%) |
Health Insurance Coverage by Citizenship Status in Harbour Heights
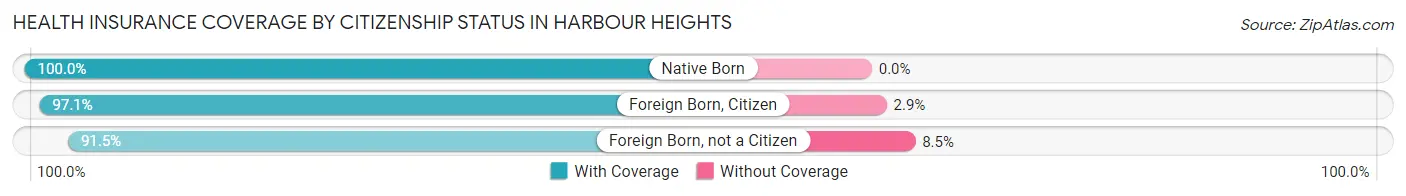
| Citizenship Status | With Coverage | Without Coverage |
| Native Born | 241 (100.0%) | 0 (0.0%) |
| Foreign Born, Citizen | 467 (97.1%) | 14 (2.9%) |
| Foreign Born, not a Citizen | 343 (91.5%) | 32 (8.5%) |
Health Insurance Coverage by Household Income in Harbour Heights
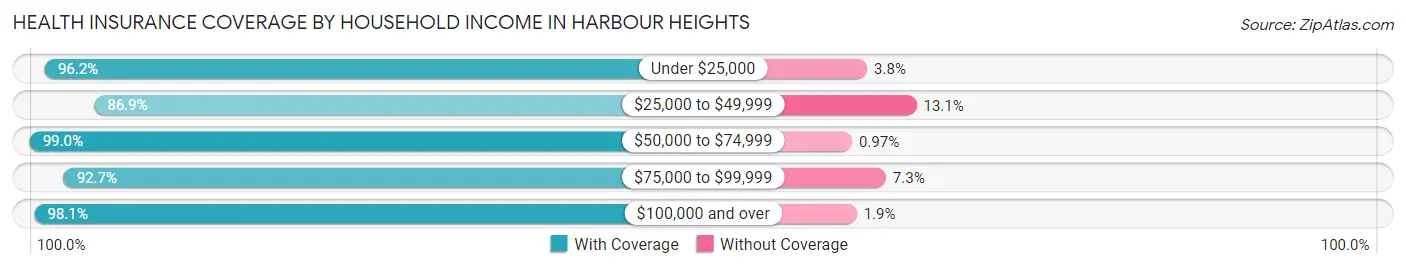
| Household Income | With Coverage | Without Coverage |
| Under $25,000 | 604 (96.2%) | 24 (3.8%) |
| $25,000 to $49,999 | 932 (86.9%) | 140 (13.1%) |
| $50,000 to $74,999 | 819 (99.0%) | 8 (1.0%) |
| $75,000 to $99,999 | 455 (92.7%) | 36 (7.3%) |
| $100,000 and over | 1,106 (98.1%) | 21 (1.9%) |
Public vs Private Health Insurance Coverage by Age in Harbour Heights
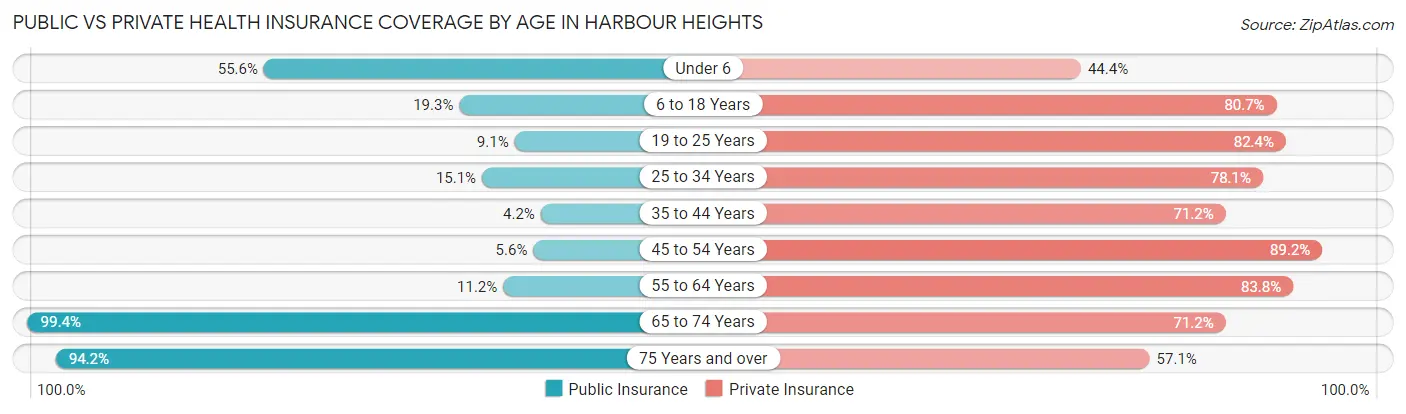
| Age Bracket | Public Insurance | Private Insurance |
| Under 6 | 134 (55.6%) | 107 (44.4%) |
| 6 to 18 Years | 93 (19.3%) | 388 (80.7%) |
| 19 to 25 Years | 34 (9.1%) | 309 (82.4%) |
| 25 to 34 Years | 47 (15.1%) | 243 (78.1%) |
| 35 to 44 Years | 12 (4.2%) | 203 (71.2%) |
| 45 to 54 Years | 16 (5.6%) | 255 (89.2%) |
| 55 to 64 Years | 86 (11.2%) | 644 (83.8%) |
| 65 to 74 Years | 874 (99.4%) | 626 (71.2%) |
| 75 Years and over | 488 (94.2%) | 296 (57.1%) |
| Total | 1,784 (43.0%) | 3,071 (74.1%) |
Disability Status by Sex by Age in Harbour Heights
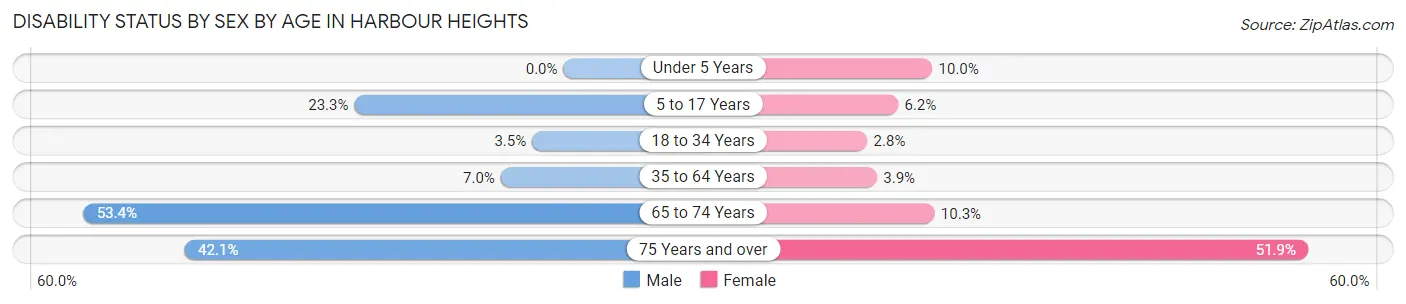
| Age Bracket | Male | Female |
| Under 5 Years | 0 (0.0%) | 11 (10.0%) |
| 5 to 17 Years | 78 (23.3%) | 9 (6.2%) |
| 18 to 34 Years | 16 (3.5%) | 8 (2.8%) |
| 35 to 64 Years | 41 (7.0%) | 29 (3.8%) |
| 65 to 74 Years | 282 (53.4%) | 36 (10.3%) |
| 75 Years and over | 107 (42.1%) | 137 (51.9%) |
Disability Class by Sex by Age in Harbour Heights
Disability Class: Hearing Difficulty
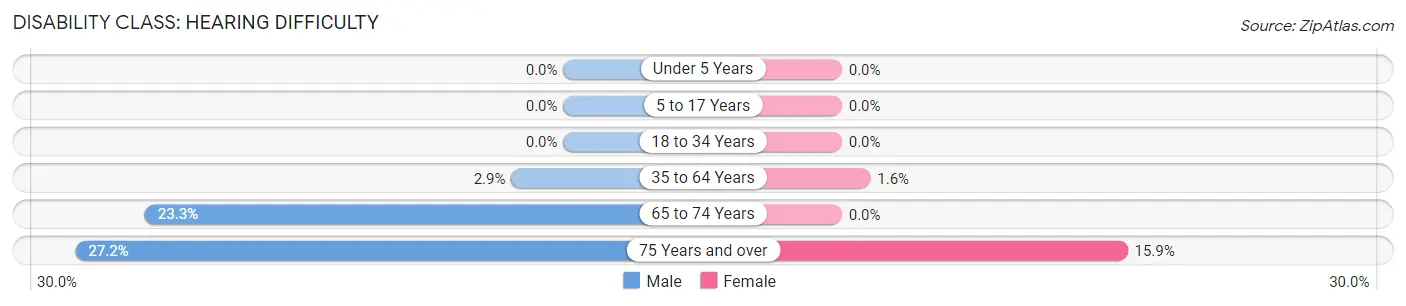
| Age Bracket | Male | Female |
| Under 5 Years | 0 (0.0%) | 0 (0.0%) |
| 5 to 17 Years | 0 (0.0%) | 0 (0.0%) |
| 18 to 34 Years | 0 (0.0%) | 0 (0.0%) |
| 35 to 64 Years | 17 (2.9%) | 12 (1.6%) |
| 65 to 74 Years | 123 (23.3%) | 0 (0.0%) |
| 75 Years and over | 69 (27.2%) | 42 (15.9%) |
Disability Class: Vision Difficulty
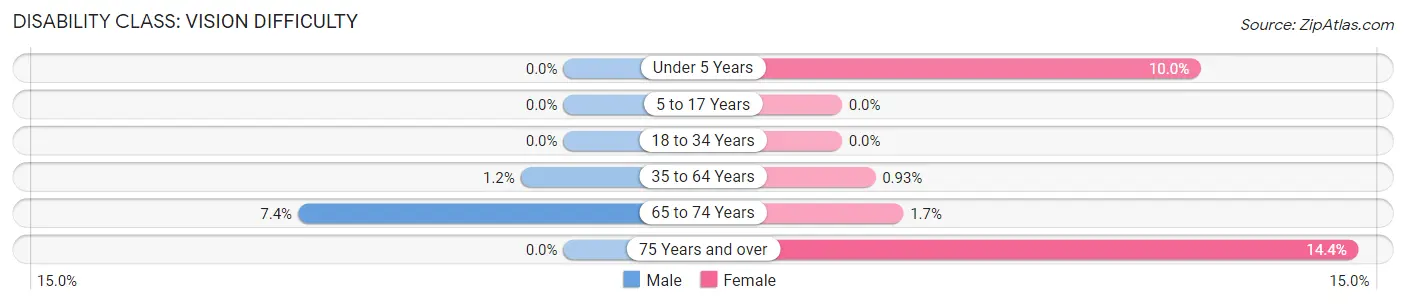
| Age Bracket | Male | Female |
| Under 5 Years | 0 (0.0%) | 11 (10.0%) |
| 5 to 17 Years | 0 (0.0%) | 0 (0.0%) |
| 18 to 34 Years | 0 (0.0%) | 0 (0.0%) |
| 35 to 64 Years | 7 (1.2%) | 7 (0.9%) |
| 65 to 74 Years | 39 (7.4%) | 6 (1.7%) |
| 75 Years and over | 0 (0.0%) | 38 (14.4%) |
Disability Class: Cognitive Difficulty
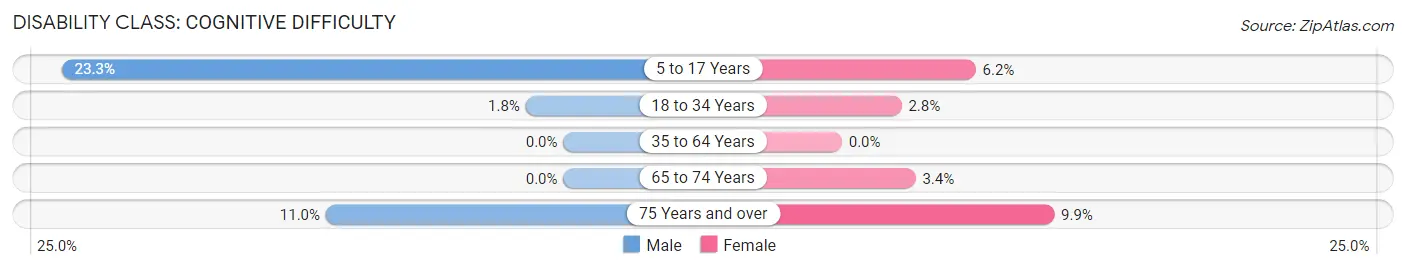
| Age Bracket | Male | Female |
| 5 to 17 Years | 78 (23.3%) | 9 (6.2%) |
| 18 to 34 Years | 8 (1.8%) | 8 (2.8%) |
| 35 to 64 Years | 0 (0.0%) | 0 (0.0%) |
| 65 to 74 Years | 0 (0.0%) | 12 (3.4%) |
| 75 Years and over | 28 (11.0%) | 26 (9.9%) |
Disability Class: Ambulatory Difficulty
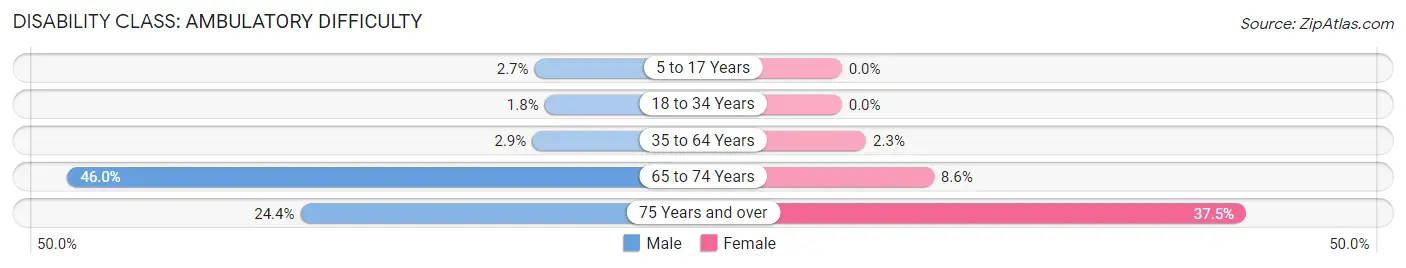
| Age Bracket | Male | Female |
| 5 to 17 Years | 9 (2.7%) | 0 (0.0%) |
| 18 to 34 Years | 8 (1.8%) | 0 (0.0%) |
| 35 to 64 Years | 17 (2.9%) | 17 (2.3%) |
| 65 to 74 Years | 243 (46.0%) | 30 (8.6%) |
| 75 Years and over | 62 (24.4%) | 99 (37.5%) |
Disability Class: Self-Care Difficulty
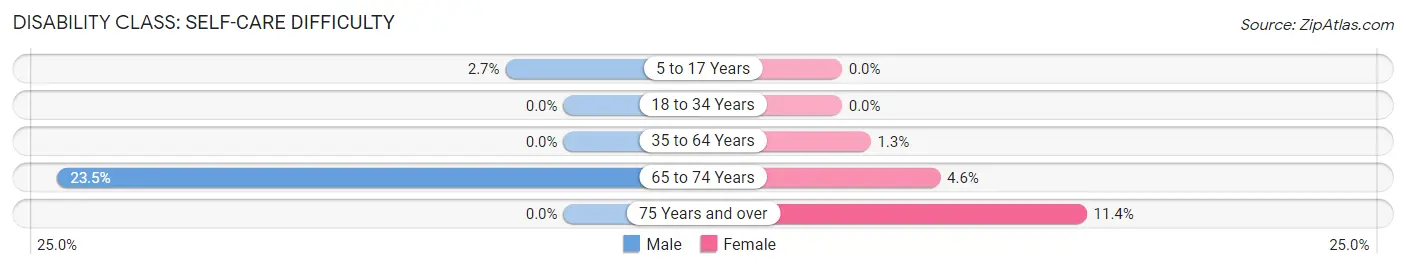
| Age Bracket | Male | Female |
| 5 to 17 Years | 9 (2.7%) | 0 (0.0%) |
| 18 to 34 Years | 0 (0.0%) | 0 (0.0%) |
| 35 to 64 Years | 0 (0.0%) | 10 (1.3%) |
| 65 to 74 Years | 124 (23.5%) | 16 (4.6%) |
| 75 Years and over | 0 (0.0%) | 30 (11.4%) |
Technology Access in Harbour Heights
Computing Device Access in Harbour Heights
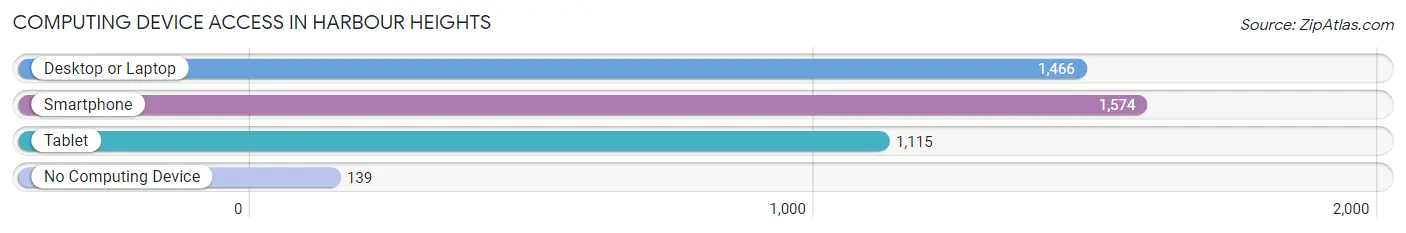
| Device Type | # Households | % Households |
| Desktop or Laptop | 1,466 | 81.4% |
| Smartphone | 1,574 | 87.4% |
| Tablet | 1,115 | 61.9% |
| No Computing Device | 139 | 7.7% |
| Total | 1,801 | 100.0% |
Internet Access in Harbour Heights
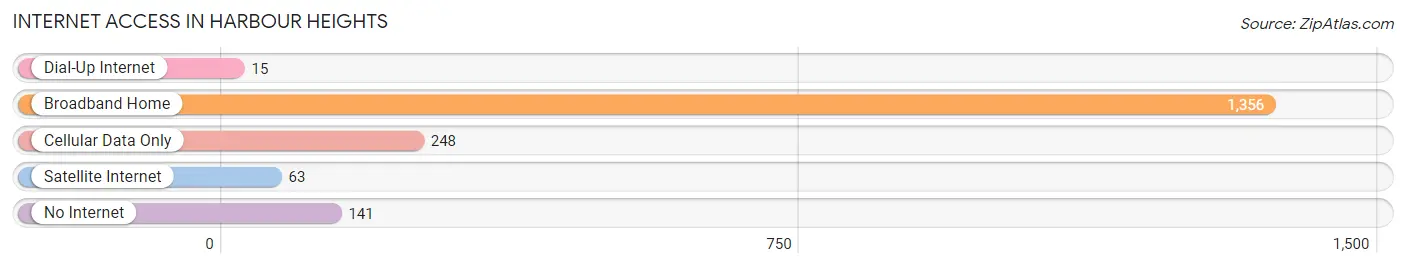
| Internet Type | # Households | % Households |
| Dial-Up Internet | 15 | 0.8% |
| Broadband Home | 1,356 | 75.3% |
| Cellular Data Only | 248 | 13.8% |
| Satellite Internet | 63 | 3.5% |
| No Internet | 141 | 7.8% |
| Total | 1,801 | 100.0% |
Harbour Heights Summary
Harbour Heights is a small unincorporated community located in Charlotte County, Florida, United States. It is situated on the Peace River, just south of the Charlotte Harbor Estuary. The community is part of the Punta Gorda Metropolitan Statistical Area.
History
Harbour Heights was first settled in the late 1800s by a group of fishermen and farmers. The area was originally known as "Fisherman's Point" and was a popular spot for fishing and hunting. In the early 1900s, the area was renamed "Harbour Heights" and the first post office was established in 1921.
The community grew slowly over the years, but it wasn't until the 1950s that it began to experience significant growth. This was due to the construction of the Peace River Bridge, which connected Harbour Heights to the mainland. The bridge allowed for easier access to the area and made it a popular destination for tourists and retirees.
Geography
Harbour Heights is located in Charlotte County, Florida, on the Peace River. It is situated just south of the Charlotte Harbor Estuary. The community is bordered by the Peace River to the east, the Charlotte Harbor Estuary to the south, and the Myakka River to the west.
The area is mostly flat, with some low hills and ridges. The soil is mostly sandy and loamy, with some areas of clay. The climate is subtropical, with hot, humid summers and mild winters.
Economy
The economy of Harbour Heights is largely based on tourism and retirement. The area is home to several resorts and retirement communities, as well as a number of marinas and boat ramps. Fishing and boating are popular activities in the area, and there are several charter fishing companies that operate out of Harbour Heights.
The area is also home to a number of small businesses, including restaurants, convenience stores, and gift shops. There are also several art galleries and antique stores in the area.
Demographics
As of the 2010 census, the population of Harbour Heights was 2,845. The racial makeup of the community was 94.3% White, 2.2% African American, 0.7% Native American, 0.7% Asian, 0.2% Pacific Islander, and 1.1% from other races. Hispanic or Latino of any race were 4.2% of the population.
The median household income in Harbour Heights was $41,944, and the median family income was $48,958. The per capita income was $21,945. About 8.3% of families and 10.2% of the population were below the poverty line, including 14.2% of those under age 18 and 5.2% of those age 65 or over.
Common Questions
What is Per Capita Income in Harbour Heights?
Per Capita income in Harbour Heights is $34,401.
What is the Median Family Income in Harbour Heights?
Median Family Income in Harbour Heights is $71,106.
What is the Median Household income in Harbour Heights?
Median Household Income in Harbour Heights is $54,877.
What is Income or Wage Gap in Harbour Heights?
Income or Wage Gap in Harbour Heights is 18.4%.
Women in Harbour Heights earn 81.6 cents for every dollar earned by a man.
What is Inequality or Gini Index in Harbour Heights?
Inequality or Gini Index in Harbour Heights is 0.44.
What is the Total Population of Harbour Heights?
Total Population of Harbour Heights is 4,145.
What is the Total Male Population of Harbour Heights?
Total Male Population of Harbour Heights is 2,233.
What is the Total Female Population of Harbour Heights?
Total Female Population of Harbour Heights is 1,912.
What is the Ratio of Males per 100 Females in Harbour Heights?
There are 116.79 Males per 100 Females in Harbour Heights.
What is the Ratio of Females per 100 Males in Harbour Heights?
There are 85.62 Females per 100 Males in Harbour Heights.
What is the Median Population Age in Harbour Heights?
Median Population Age in Harbour Heights is 55.6 Years.
What is the Average Family Size in Harbour Heights
Average Family Size in Harbour Heights is 2.8 People.
What is the Average Household Size in Harbour Heights
Average Household Size in Harbour Heights is 2.3 People.
How Large is the Labor Force in Harbour Heights?
There are 1,913 People in the Labor Forcein in Harbour Heights.
What is the Percentage of People in the Labor Force in Harbour Heights?
54.2% of People are in the Labor Force in Harbour Heights.
What is the Unemployment Rate in Harbour Heights?
Unemployment Rate in Harbour Heights is 16.9%.