Butler Beach, FL Map & Demographics
Butler Beach Map
Butler Beach Overview
$58,790
PER CAPITA INCOME
$115,368
AVG FAMILY INCOME
$83,661
AVG HOUSEHOLD INCOME
35.3%
WAGE / INCOME GAP [ % ]
64.7¢/ $1
WAGE / INCOME GAP [ $ ]
0.42
INEQUALITY / GINI INDEX
4,831
TOTAL POPULATION
2,296
MALE POPULATION
2,535
FEMALE POPULATION
90.57
MALES / 100 FEMALES
110.41
FEMALES / 100 MALES
60.7
MEDIAN AGE
2.4
AVG FAMILY SIZE
1.9
AVG HOUSEHOLD SIZE
2,290
LABOR FORCE [ PEOPLE ]
49.8%
PERCENT IN LABOR FORCE
6.3%
UNEMPLOYMENT RATE
Income in Butler Beach
Income Overview in Butler Beach
Per Capita Income in Butler Beach is $58,790, while median incomes of families and households are $115,368 and $83,661 respectively.
| Characteristic | Number | Measure |
| Per Capita Income | 4,831 | $58,790 |
| Median Family Income | 1,553 | $115,368 |
| Mean Family Income | 1,553 | $137,604 |
| Median Household Income | 2,524 | $83,661 |
| Mean Household Income | 2,524 | $110,389 |
| Income Deficit | 1,553 | $0 |
| Wage / Income Gap (%) | 4,831 | 35.35% |
| Wage / Income Gap ($) | 4,831 | 64.65¢ per $1 |
| Gini / Inequality Index | 4,831 | 0.42 |
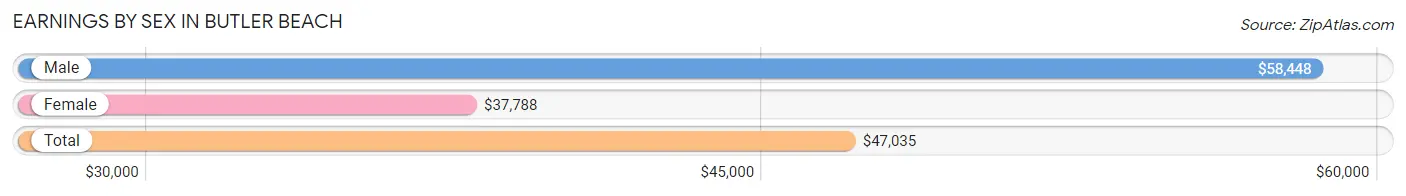
Earnings by Sex in Butler Beach
Average Earnings in Butler Beach are $47,035, $58,448 for men and $37,788 for women, a difference of 35.3%.
| Sex | Number | Average Earnings |
| Male | 1,282 (54.4%) | $58,448 |
| Female | 1,075 (45.6%) | $37,788 |
| Total | 2,357 (100.0%) | $47,035 |
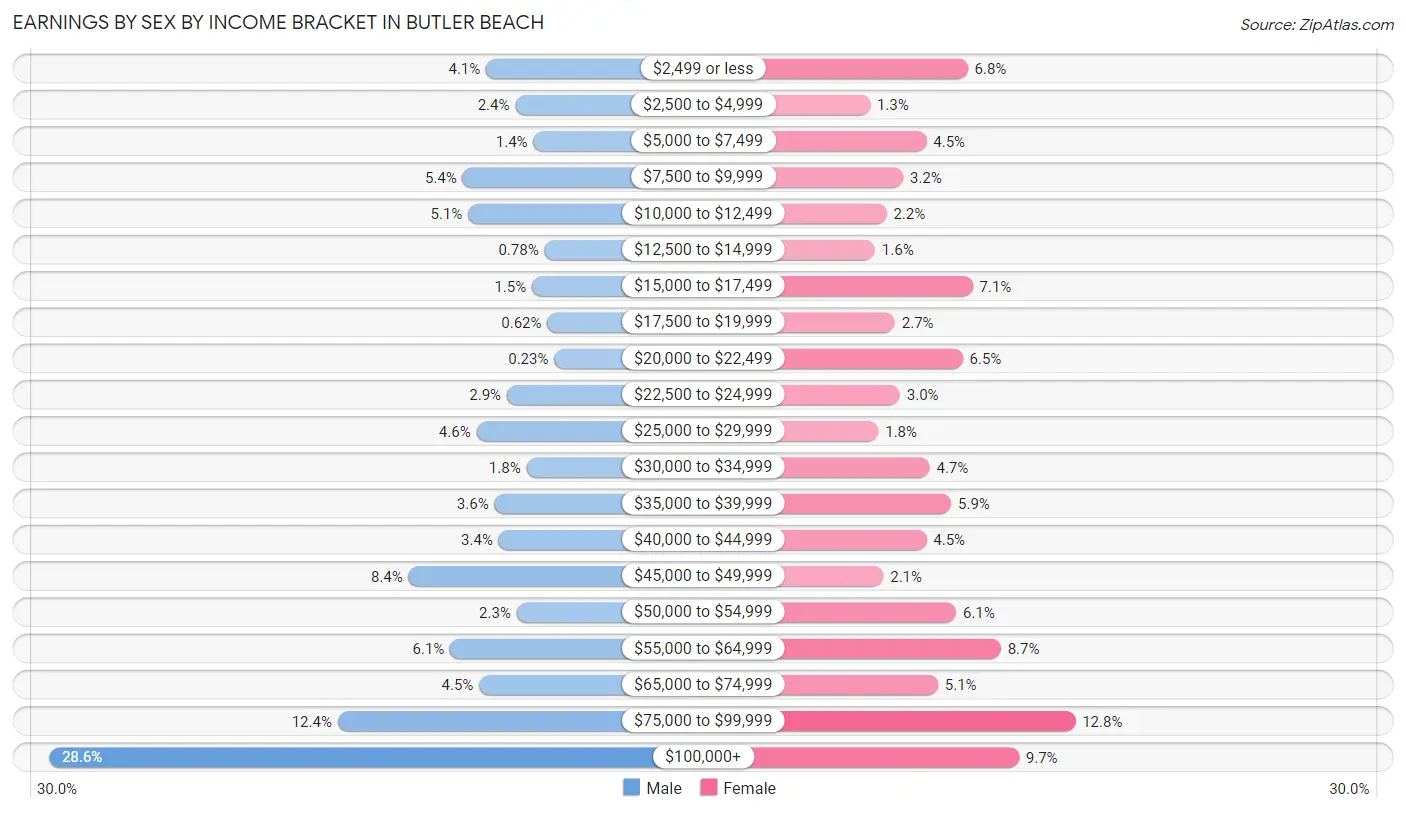
Earnings by Sex by Income Bracket in Butler Beach
The most common earnings brackets in Butler Beach are $100,000+ for men (367 | 28.6%) and $75,000 to $99,999 for women (138 | 12.8%).
| Income | Male | Female |
| $2,499 or less | 52 (4.1%) | 73 (6.8%) |
| $2,500 to $4,999 | 31 (2.4%) | 14 (1.3%) |
| $5,000 to $7,499 | 18 (1.4%) | 48 (4.5%) |
| $7,500 to $9,999 | 69 (5.4%) | 34 (3.2%) |
| $10,000 to $12,499 | 65 (5.1%) | 24 (2.2%) |
| $12,500 to $14,999 | 10 (0.8%) | 17 (1.6%) |
| $15,000 to $17,499 | 19 (1.5%) | 76 (7.1%) |
| $17,500 to $19,999 | 8 (0.6%) | 29 (2.7%) |
| $20,000 to $22,499 | 3 (0.2%) | 70 (6.5%) |
| $22,500 to $24,999 | 37 (2.9%) | 32 (3.0%) |
| $25,000 to $29,999 | 59 (4.6%) | 19 (1.8%) |
| $30,000 to $34,999 | 23 (1.8%) | 50 (4.6%) |
| $35,000 to $39,999 | 46 (3.6%) | 63 (5.9%) |
| $40,000 to $44,999 | 43 (3.4%) | 48 (4.5%) |
| $45,000 to $49,999 | 108 (8.4%) | 22 (2.1%) |
| $50,000 to $54,999 | 30 (2.3%) | 66 (6.1%) |
| $55,000 to $64,999 | 78 (6.1%) | 93 (8.6%) |
| $65,000 to $74,999 | 57 (4.4%) | 55 (5.1%) |
| $75,000 to $99,999 | 159 (12.4%) | 138 (12.8%) |
| $100,000+ | 367 (28.6%) | 104 (9.7%) |
| Total | 1,282 (100.0%) | 1,075 (100.0%) |
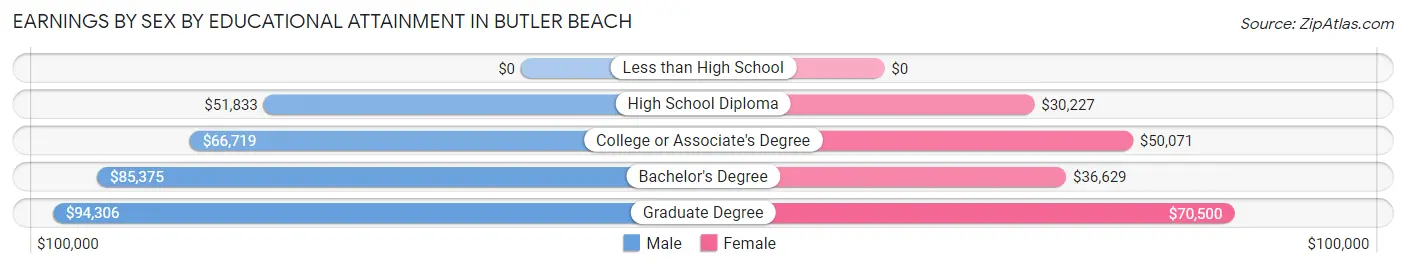
Earnings by Sex by Educational Attainment in Butler Beach
Average earnings in Butler Beach are $70,809 for men and $42,939 for women, a difference of 39.4%. Men with an educational attainment of graduate degree enjoy the highest average annual earnings of $94,306, while those with high school diploma education earn the least with $51,833. Women with an educational attainment of graduate degree earn the most with the average annual earnings of $70,500, while those with high school diploma education have the smallest earnings of $30,227.
| Educational Attainment | Male Income | Female Income |
| Less than High School | - | - |
| High School Diploma | $51,833 | $30,227 |
| College or Associate's Degree | $66,719 | $50,071 |
| Bachelor's Degree | $85,375 | $36,629 |
| Graduate Degree | $94,306 | $70,500 |
| Total | $70,809 | $42,939 |
Family Income in Butler Beach
Family Income Brackets in Butler Beach
According to the Butler Beach family income data, there are 339 families falling into the $100,000 to $149,999 income range, which is the most common income bracket and makes up 21.8% of all families.
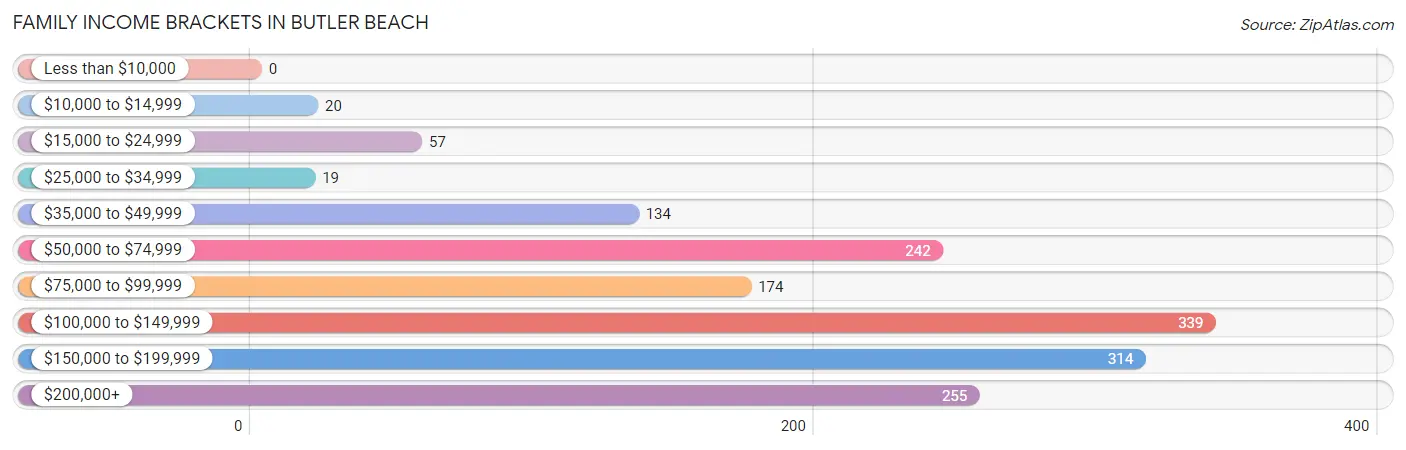
| Income Bracket | # Families | % Families |
| Less than $10,000 | 0 | 0.0% |
| $10,000 to $14,999 | 20 | 1.3% |
| $15,000 to $24,999 | 57 | 3.7% |
| $25,000 to $34,999 | 19 | 1.2% |
| $35,000 to $49,999 | 134 | 8.6% |
| $50,000 to $74,999 | 242 | 15.6% |
| $75,000 to $99,999 | 174 | 11.2% |
| $100,000 to $149,999 | 339 | 21.8% |
| $150,000 to $199,999 | 314 | 20.2% |
| $200,000+ | 255 | 16.4% |
Family Income by Famaliy Size in Butler Beach
4-person families (53 | 3.4%) account for the highest median family income in Butler Beach with $144,306 per family, while 2-person families (1,263 | 81.3%) have the highest median income of $56,101 per family member.
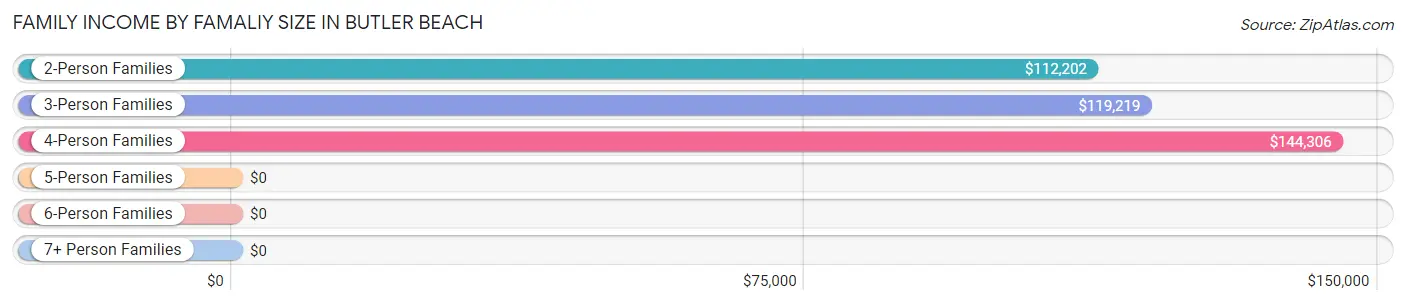
| Income Bracket | # Families | Median Income |
| 2-Person Families | 1,263 (81.3%) | $112,202 |
| 3-Person Families | 211 (13.6%) | $119,219 |
| 4-Person Families | 53 (3.4%) | $144,306 |
| 5-Person Families | 0 (0.0%) | $0 |
| 6-Person Families | 26 (1.7%) | $0 |
| 7+ Person Families | 0 (0.0%) | $0 |
| Total | 1,553 (100.0%) | $115,368 |
Family Income by Number of Earners in Butler Beach
The median family income in Butler Beach is $115,368, with families comprising 3+ earners (110) having the highest median family income of $181,522, while families with 1 earner (477) have the lowest median family income of $71,813, accounting for 7.1% and 30.7% of families, respectively.
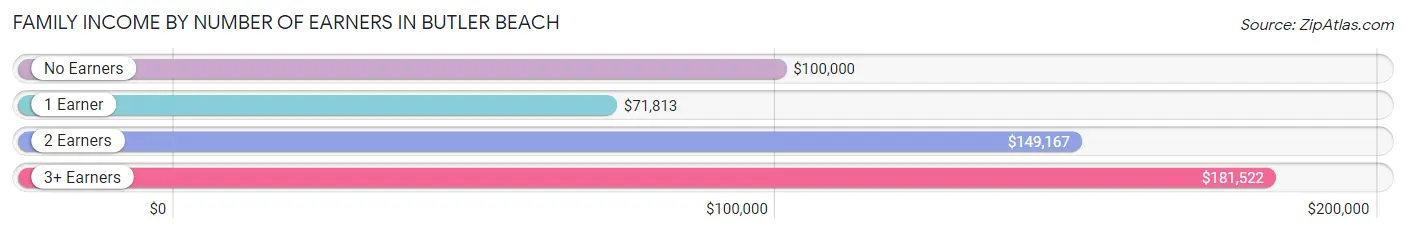
| Number of Earners | # Families | Median Income |
| No Earners | 474 (30.5%) | $100,000 |
| 1 Earner | 477 (30.7%) | $71,813 |
| 2 Earners | 492 (31.7%) | $149,167 |
| 3+ Earners | 110 (7.1%) | $181,522 |
| Total | 1,553 (100.0%) | $115,368 |
Household Income in Butler Beach
Household Income Brackets in Butler Beach
With 429 households falling in the category, the $100,000 to $149,999 income range is the most frequent in Butler Beach, accounting for 17.0% of all households. In contrast, only 61 households (2.4%) fall into the $10,000 to $14,999 income bracket, making it the least populous group.
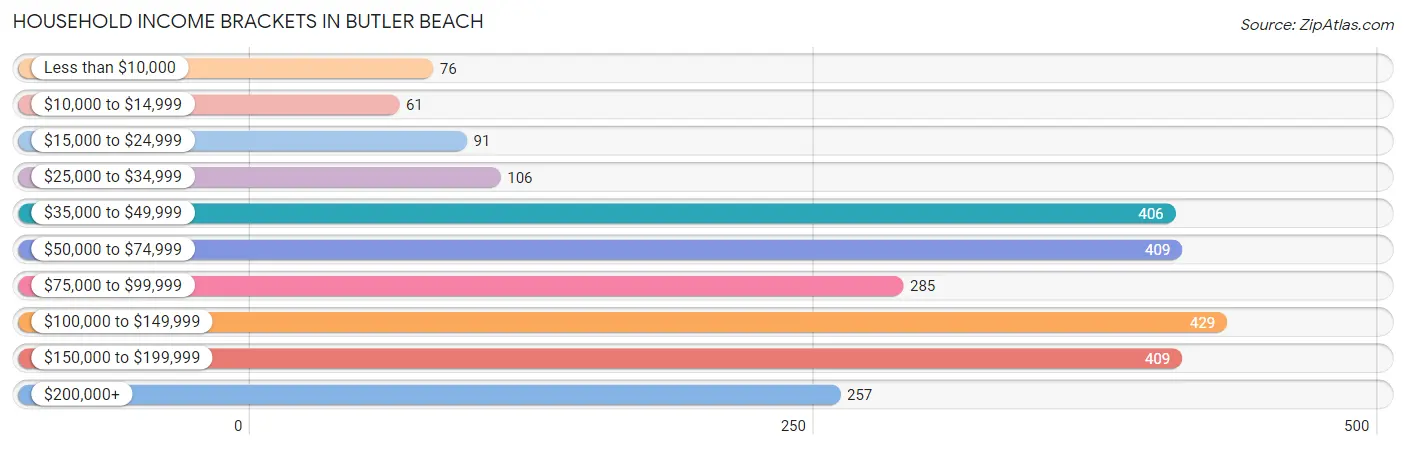
| Income Bracket | # Households | % Households |
| Less than $10,000 | 76 | 3.0% |
| $10,000 to $14,999 | 61 | 2.4% |
| $15,000 to $24,999 | 91 | 3.6% |
| $25,000 to $34,999 | 106 | 4.2% |
| $35,000 to $49,999 | 406 | 16.1% |
| $50,000 to $74,999 | 409 | 16.2% |
| $75,000 to $99,999 | 285 | 11.3% |
| $100,000 to $149,999 | 429 | 17.0% |
| $150,000 to $199,999 | 409 | 16.2% |
| $200,000+ | 257 | 10.2% |
Household Income by Householder Age in Butler Beach
The median household income in Butler Beach is $83,661, with the highest median household income of $98,047 found in the 45 to 64 years age bracket for the primary householder. A total of 955 households (37.8%) fall into this category. Meanwhile, the 15 to 24 years age bracket for the primary householder has the lowest median household income of $70,898, with 91 households (3.6%) in this group.
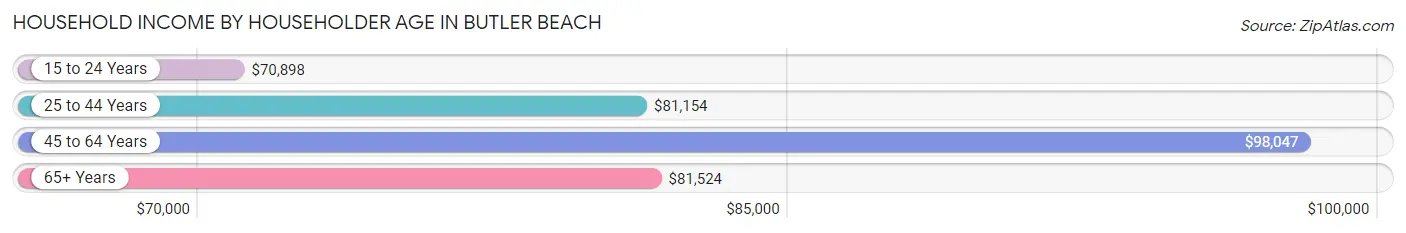
| Income Bracket | # Households | Median Income |
| 15 to 24 Years | 91 (3.6%) | $70,898 |
| 25 to 44 Years | 284 (11.3%) | $81,154 |
| 45 to 64 Years | 955 (37.8%) | $98,047 |
| 65+ Years | 1,194 (47.3%) | $81,524 |
| Total | 2,524 (100.0%) | $83,661 |
Poverty in Butler Beach
Income Below Poverty by Sex and Age in Butler Beach
With 10.2% poverty level for males and 5.7% for females among the residents of Butler Beach, 12 to 14 year old males and 25 to 34 year old females are the most vulnerable to poverty, with 10 males (100.0%) and 39 females (41.0%) in their respective age groups living below the poverty level.
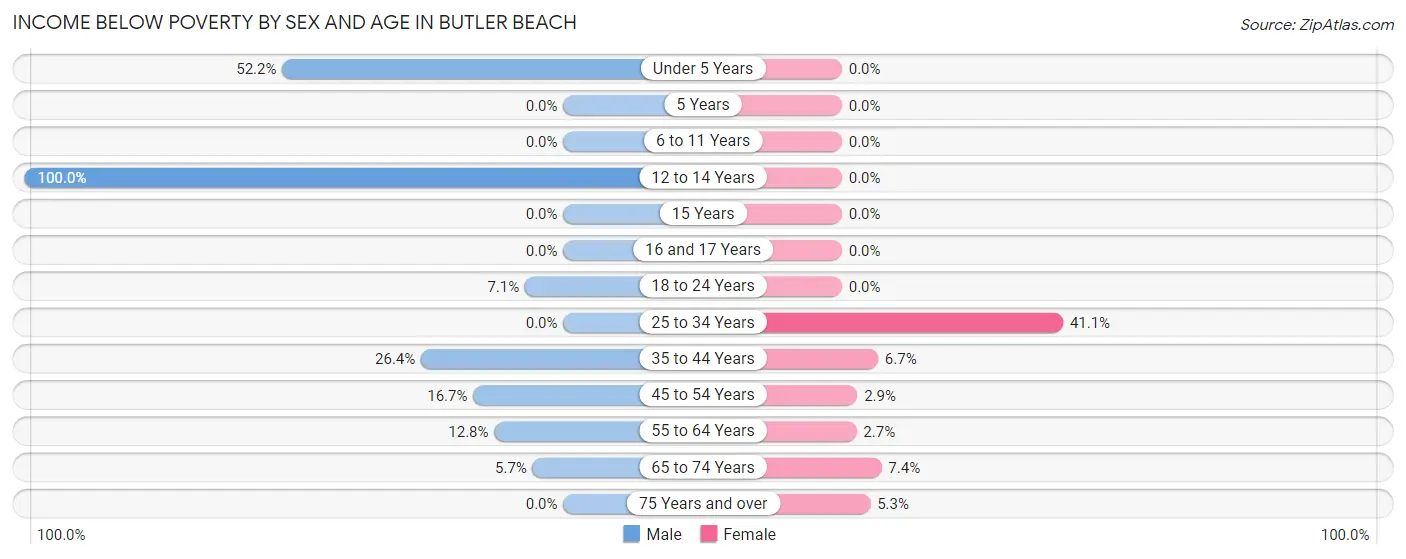
| Age Bracket | Male | Female |
| Under 5 Years | 12 (52.2%) | 0 (0.0%) |
| 5 Years | 0 (0.0%) | 0 (0.0%) |
| 6 to 11 Years | 0 (0.0%) | 0 (0.0%) |
| 12 to 14 Years | 10 (100.0%) | 0 (0.0%) |
| 15 Years | 0 (0.0%) | 0 (0.0%) |
| 16 and 17 Years | 0 (0.0%) | 0 (0.0%) |
| 18 to 24 Years | 14 (7.1%) | 0 (0.0%) |
| 25 to 34 Years | 0 (0.0%) | 39 (41.0%) |
| 35 to 44 Years | 47 (26.4%) | 14 (6.7%) |
| 45 to 54 Years | 51 (16.7%) | 6 (2.9%) |
| 55 to 64 Years | 62 (12.8%) | 20 (2.7%) |
| 65 to 74 Years | 37 (5.7%) | 48 (7.3%) |
| 75 Years and over | 0 (0.0%) | 17 (5.3%) |
| Total | 233 (10.2%) | 144 (5.7%) |
Income Above Poverty by Sex and Age in Butler Beach
According to the poverty statistics in Butler Beach, males aged 5 years and females aged under 5 years are the age groups that are most secure financially, with 100.0% of males and 100.0% of females in these age groups living above the poverty line.
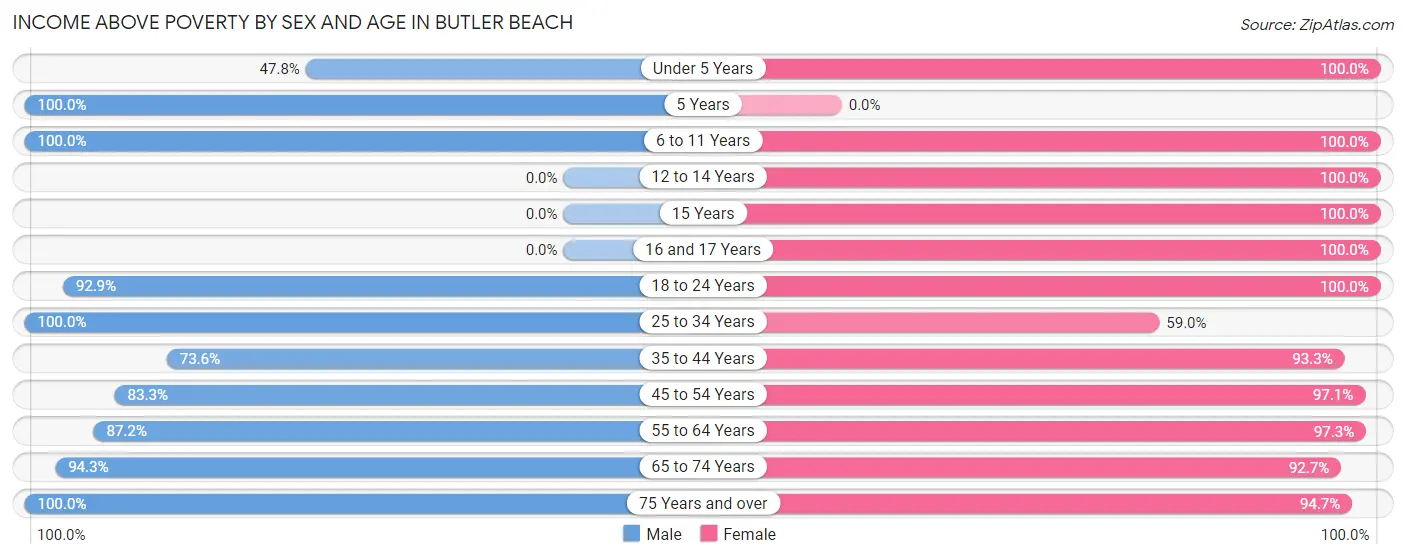
| Age Bracket | Male | Female |
| Under 5 Years | 11 (47.8%) | 47 (100.0%) |
| 5 Years | 13 (100.0%) | 0 (0.0%) |
| 6 to 11 Years | 23 (100.0%) | 82 (100.0%) |
| 12 to 14 Years | 0 (0.0%) | 23 (100.0%) |
| 15 Years | 0 (0.0%) | 11 (100.0%) |
| 16 and 17 Years | 0 (0.0%) | 31 (100.0%) |
| 18 to 24 Years | 183 (92.9%) | 114 (100.0%) |
| 25 to 34 Years | 117 (100.0%) | 56 (59.0%) |
| 35 to 44 Years | 131 (73.6%) | 195 (93.3%) |
| 45 to 54 Years | 254 (83.3%) | 203 (97.1%) |
| 55 to 64 Years | 422 (87.2%) | 719 (97.3%) |
| 65 to 74 Years | 613 (94.3%) | 605 (92.6%) |
| 75 Years and over | 296 (100.0%) | 305 (94.7%) |
| Total | 2,063 (89.8%) | 2,391 (94.3%) |
Income Below Poverty Among Married-Couple Families in Butler Beach
The poverty statistics for married-couple families in Butler Beach show that 3.7% or 54 of the total 1,449 families live below the poverty line. Families with no children have the highest poverty rate of 4.0%, comprising of 54 families. On the other hand, families with 1 or 2 children have the lowest poverty rate of 0.0%, which includes 0 families.
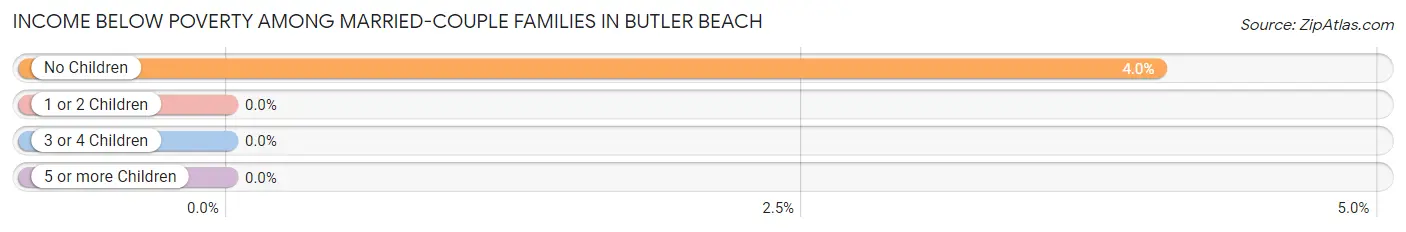
| Children | Above Poverty | Below Poverty |
| No Children | 1,283 (96.0%) | 54 (4.0%) |
| 1 or 2 Children | 86 (100.0%) | 0 (0.0%) |
| 3 or 4 Children | 26 (100.0%) | 0 (0.0%) |
| 5 or more Children | 0 (0.0%) | 0 (0.0%) |
| Total | 1,395 (96.3%) | 54 (3.7%) |
Income Below Poverty Among Single-Parent Households in Butler Beach
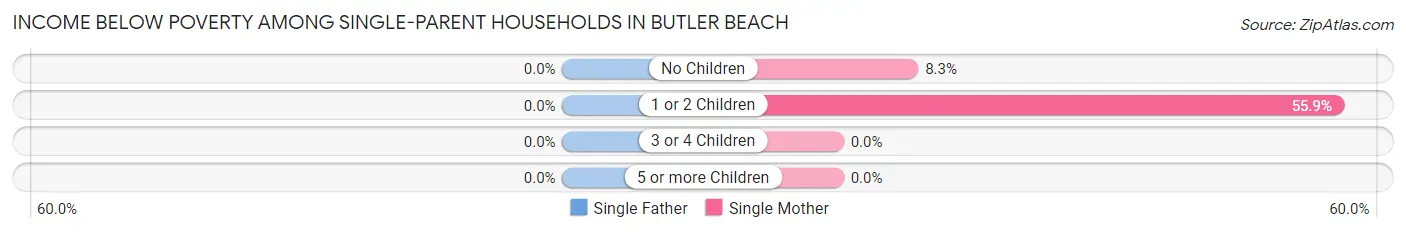
| Children | Single Father | Single Mother |
| No Children | 0 (0.0%) | 5 (8.3%) |
| 1 or 2 Children | 0 (0.0%) | 19 (55.9%) |
| 3 or 4 Children | 0 (0.0%) | 0 (0.0%) |
| 5 or more Children | 0 (0.0%) | 0 (0.0%) |
| Total | 0 (0.0%) | 24 (25.5%) |
Income Below Poverty Among Married-Couple vs Single-Parent Households in Butler Beach
The poverty data for Butler Beach shows that 54 of the married-couple family households (3.7%) and 24 of the single-parent households (23.1%) are living below the poverty level. Within the married-couple family households, those with no children have the highest poverty rate, with 54 households (4.0%) falling below the poverty line. Among the single-parent households, those with 1 or 2 children have the highest poverty rate, with 19 household (55.9%) living below poverty.
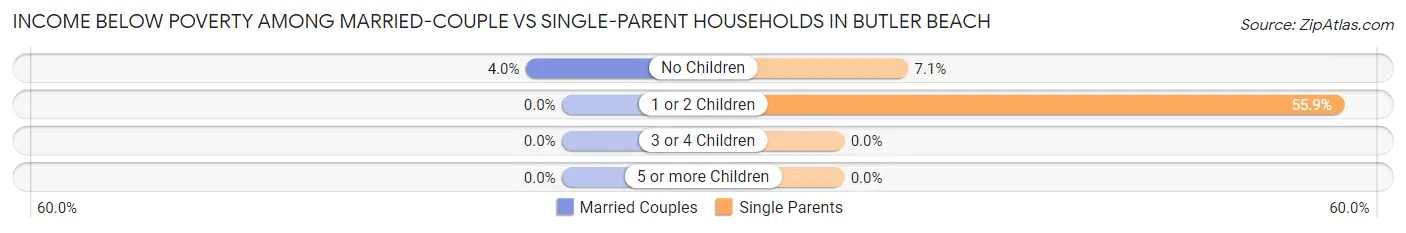
| Children | Married-Couple Families | Single-Parent Households |
| No Children | 54 (4.0%) | 5 (7.1%) |
| 1 or 2 Children | 0 (0.0%) | 19 (55.9%) |
| 3 or 4 Children | 0 (0.0%) | 0 (0.0%) |
| 5 or more Children | 0 (0.0%) | 0 (0.0%) |
| Total | 54 (3.7%) | 24 (23.1%) |
Race in Butler Beach
The most populous races in Butler Beach are White / Caucasian (4,597 | 95.2%), Hispanic or Latino (214 | 4.4%), and Two or more Races (115 | 2.4%).
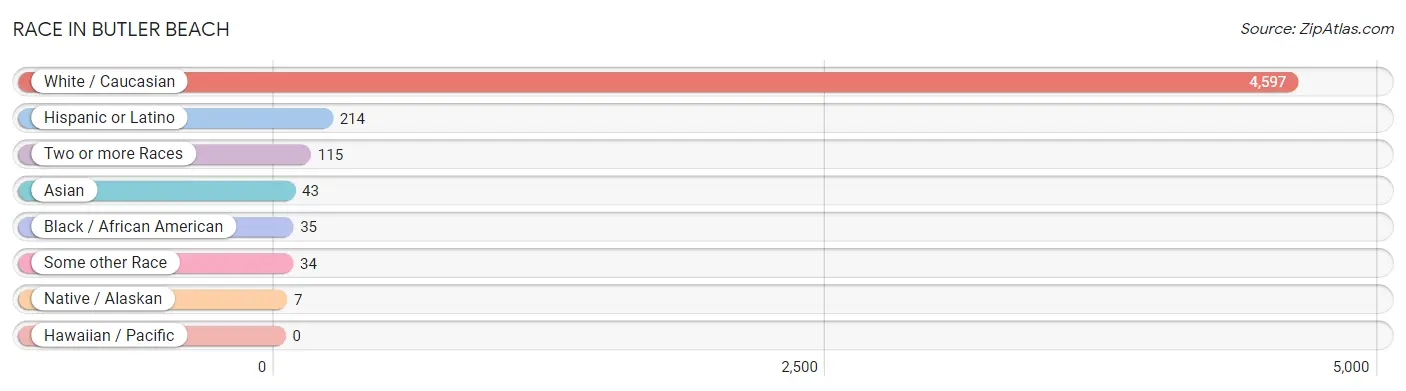
| Race | # Population | % Population |
| Asian | 43 | 0.9% |
| Black / African American | 35 | 0.7% |
| Hawaiian / Pacific | 0 | 0.0% |
| Hispanic or Latino | 214 | 4.4% |
| Native / Alaskan | 7 | 0.1% |
| White / Caucasian | 4,597 | 95.2% |
| Two or more Races | 115 | 2.4% |
| Some other Race | 34 | 0.7% |
| Total | 4,831 | 100.0% |
Ancestry in Butler Beach
The most populous ancestries reported in Butler Beach are English (1,048 | 21.7%), Irish (609 | 12.6%), American (543 | 11.2%), German (531 | 11.0%), and Italian (417 | 8.6%), together accounting for 65.2% of all Butler Beach residents.
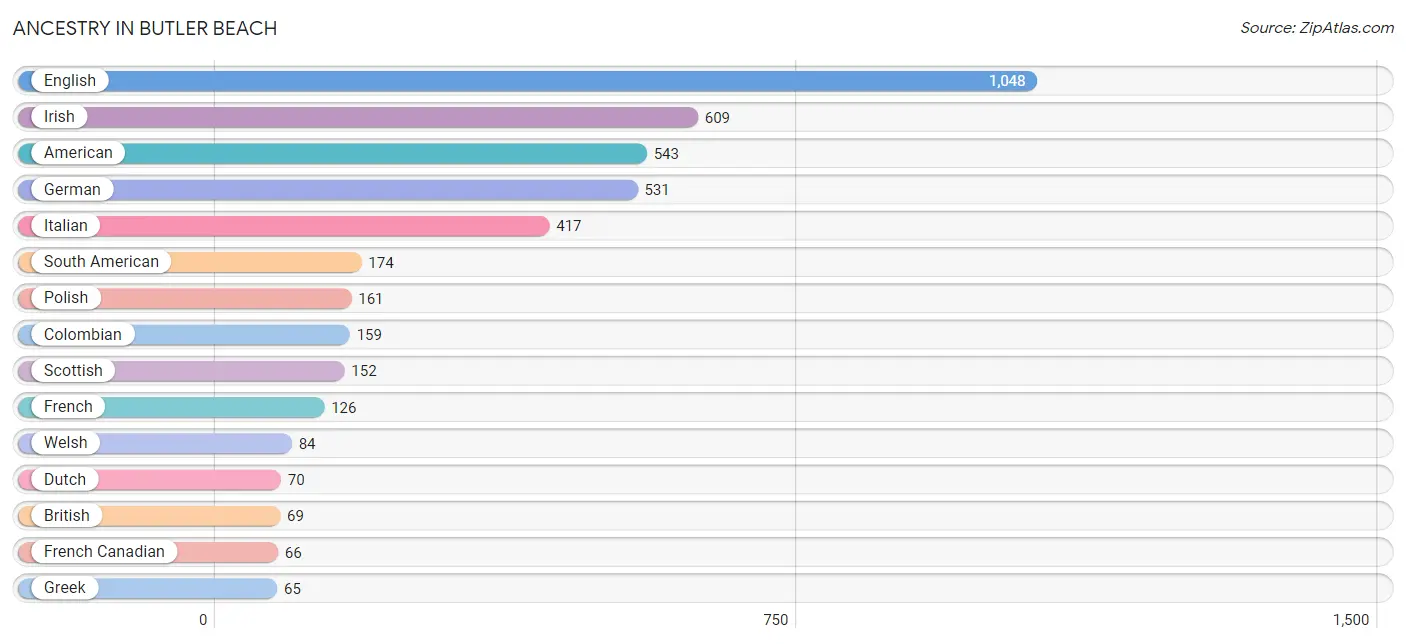
| Ancestry | # Population | % Population |
| American | 543 | 11.2% |
| Apache | 5 | 0.1% |
| Arab | 19 | 0.4% |
| Argentinean | 15 | 0.3% |
| Australian | 9 | 0.2% |
| Austrian | 18 | 0.4% |
| Bangladeshi | 14 | 0.3% |
| Bhutanese | 3 | 0.1% |
| Brazilian | 47 | 1.0% |
| British | 69 | 1.4% |
| Burmese | 3 | 0.1% |
| Canadian | 25 | 0.5% |
| Central American | 25 | 0.5% |
| Cherokee | 25 | 0.5% |
| Colombian | 159 | 3.3% |
| Costa Rican | 20 | 0.4% |
| Czech | 21 | 0.4% |
| Czechoslovakian | 37 | 0.8% |
| Danish | 9 | 0.2% |
| Dutch | 70 | 1.5% |
| Eastern European | 28 | 0.6% |
| English | 1,048 | 21.7% |
| European | 19 | 0.4% |
| Finnish | 20 | 0.4% |
| French | 126 | 2.6% |
| French Canadian | 66 | 1.4% |
| German | 531 | 11.0% |
| Greek | 65 | 1.3% |
| Guatemalan | 5 | 0.1% |
| Hungarian | 45 | 0.9% |
| Indian (Asian) | 23 | 0.5% |
| Irish | 609 | 12.6% |
| Italian | 417 | 8.6% |
| Lebanese | 10 | 0.2% |
| Lithuanian | 22 | 0.5% |
| Mexican | 7 | 0.1% |
| Northern European | 2 | 0.0% |
| Norwegian | 58 | 1.2% |
| Polish | 161 | 3.3% |
| Scandinavian | 8 | 0.2% |
| Scotch-Irish | 61 | 1.3% |
| Scottish | 152 | 3.2% |
| Sioux | 11 | 0.2% |
| Slovak | 29 | 0.6% |
| South American | 174 | 3.6% |
| Spaniard | 8 | 0.2% |
| Swedish | 21 | 0.4% |
| Ukrainian | 30 | 0.6% |
| Welsh | 84 | 1.7% | View All 49 Rows |
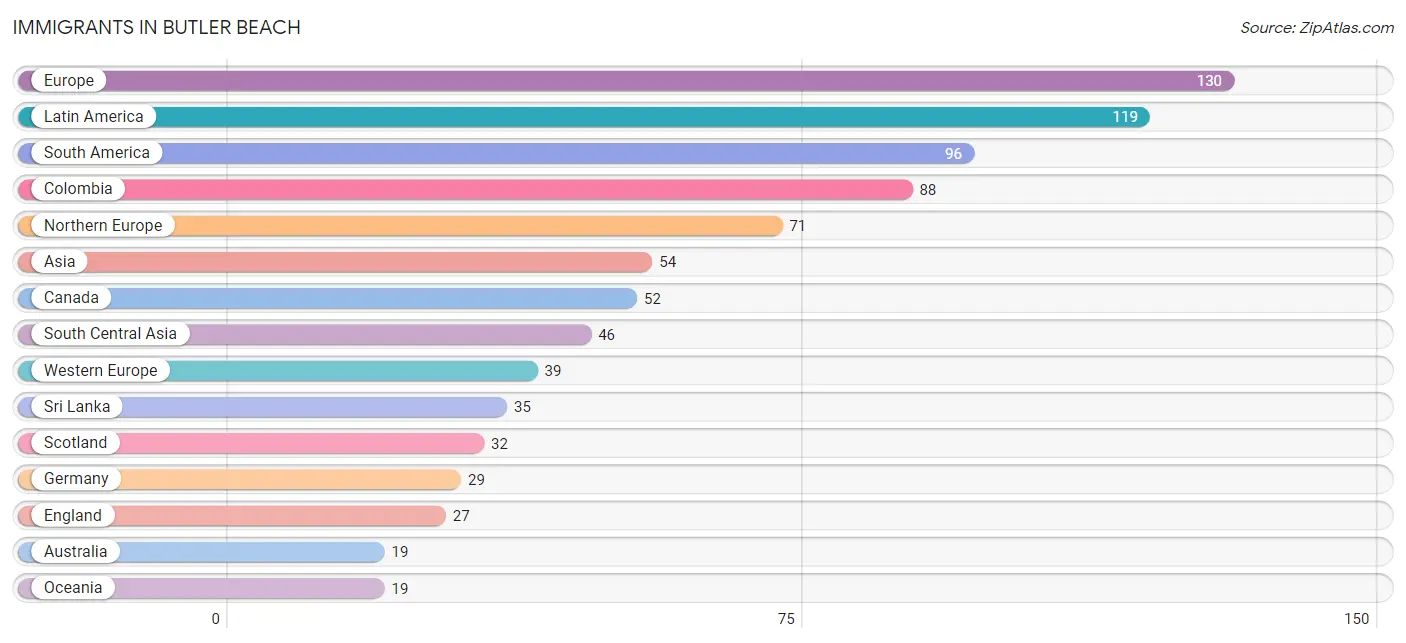
Immigrants in Butler Beach
The most numerous immigrant groups reported in Butler Beach came from Europe (130 | 2.7%), Latin America (119 | 2.5%), South America (96 | 2.0%), Colombia (88 | 1.8%), and Northern Europe (71 | 1.5%), together accounting for 10.4% of all Butler Beach residents.
| Immigration Origin | # Population | % Population |
| Africa | 9 | 0.2% |
| Asia | 54 | 1.1% |
| Australia | 19 | 0.4% |
| Austria | 10 | 0.2% |
| Barbados | 10 | 0.2% |
| Brazil | 8 | 0.2% |
| Bulgaria | 12 | 0.3% |
| Canada | 52 | 1.1% |
| Caribbean | 10 | 0.2% |
| Central America | 13 | 0.3% |
| China | 8 | 0.2% |
| Colombia | 88 | 1.8% |
| Costa Rica | 8 | 0.2% |
| Eastern Asia | 8 | 0.2% |
| Eastern Europe | 12 | 0.3% |
| England | 27 | 0.6% |
| Europe | 130 | 2.7% |
| Germany | 29 | 0.6% |
| India | 11 | 0.2% |
| Italy | 8 | 0.2% |
| Latin America | 119 | 2.5% |
| Mexico | 5 | 0.1% |
| Morocco | 9 | 0.2% |
| Northern Africa | 9 | 0.2% |
| Northern Europe | 71 | 1.5% |
| Oceania | 19 | 0.4% |
| Scotland | 32 | 0.7% |
| South America | 96 | 2.0% |
| South Central Asia | 46 | 0.9% |
| Southern Europe | 8 | 0.2% |
| Sri Lanka | 35 | 0.7% |
| Western Europe | 39 | 0.8% | View All 32 Rows |
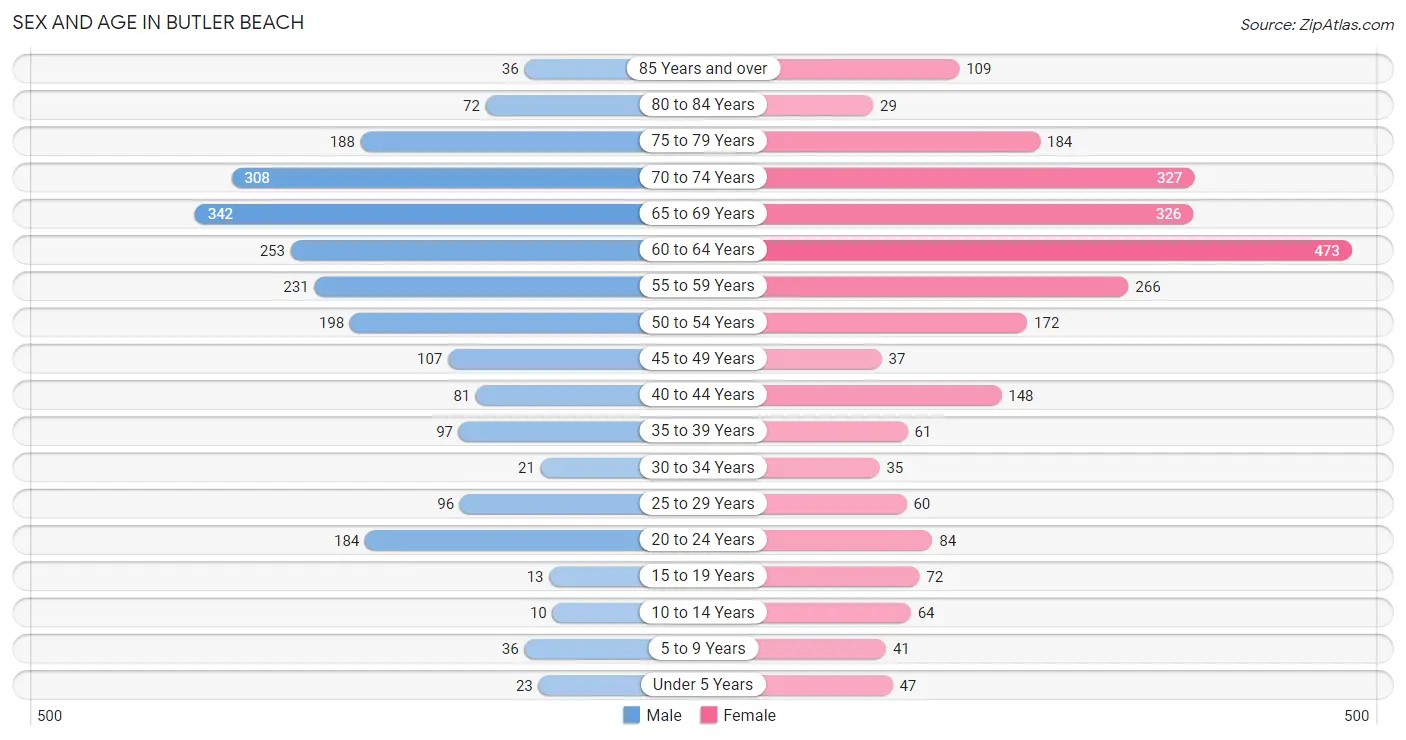
Sex and Age in Butler Beach
Sex and Age in Butler Beach
The most populous age groups in Butler Beach are 65 to 69 Years (342 | 14.9%) for men and 60 to 64 Years (473 | 18.7%) for women.
| Age Bracket | Male | Female |
| Under 5 Years | 23 (1.0%) | 47 (1.8%) |
| 5 to 9 Years | 36 (1.6%) | 41 (1.6%) |
| 10 to 14 Years | 10 (0.4%) | 64 (2.5%) |
| 15 to 19 Years | 13 (0.6%) | 72 (2.8%) |
| 20 to 24 Years | 184 (8.0%) | 84 (3.3%) |
| 25 to 29 Years | 96 (4.2%) | 60 (2.4%) |
| 30 to 34 Years | 21 (0.9%) | 35 (1.4%) |
| 35 to 39 Years | 97 (4.2%) | 61 (2.4%) |
| 40 to 44 Years | 81 (3.5%) | 148 (5.8%) |
| 45 to 49 Years | 107 (4.7%) | 37 (1.5%) |
| 50 to 54 Years | 198 (8.6%) | 172 (6.8%) |
| 55 to 59 Years | 231 (10.1%) | 266 (10.5%) |
| 60 to 64 Years | 253 (11.0%) | 473 (18.7%) |
| 65 to 69 Years | 342 (14.9%) | 326 (12.9%) |
| 70 to 74 Years | 308 (13.4%) | 327 (12.9%) |
| 75 to 79 Years | 188 (8.2%) | 184 (7.3%) |
| 80 to 84 Years | 72 (3.1%) | 29 (1.1%) |
| 85 Years and over | 36 (1.6%) | 109 (4.3%) |
| Total | 2,296 (100.0%) | 2,535 (100.0%) |
Families and Households in Butler Beach
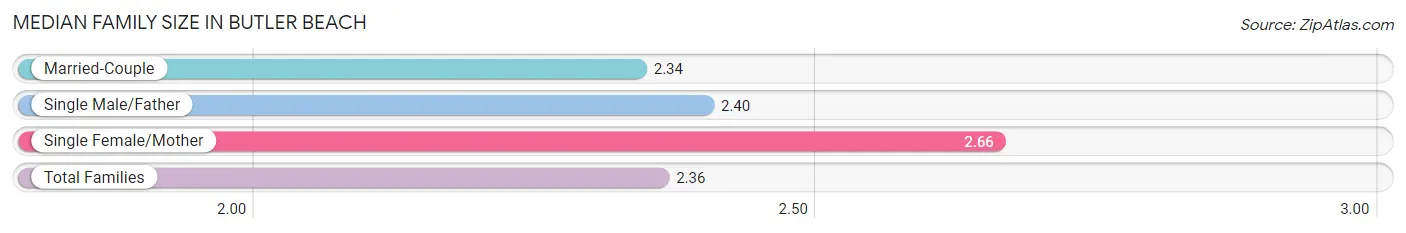
Median Family Size in Butler Beach
The median family size in Butler Beach is 2.36 persons per family, with single female/mother families (94 | 6.0%) accounting for the largest median family size of 2.66 persons per family. On the other hand, married-couple families (1,449 | 93.3%) represent the smallest median family size with 2.34 persons per family.
| Family Type | # Families | Family Size |
| Married-Couple | 1,449 (93.3%) | 2.34 |
| Single Male/Father | 10 (0.6%) | 2.40 |
| Single Female/Mother | 94 (6.0%) | 2.66 |
| Total Families | 1,553 (100.0%) | 2.36 |
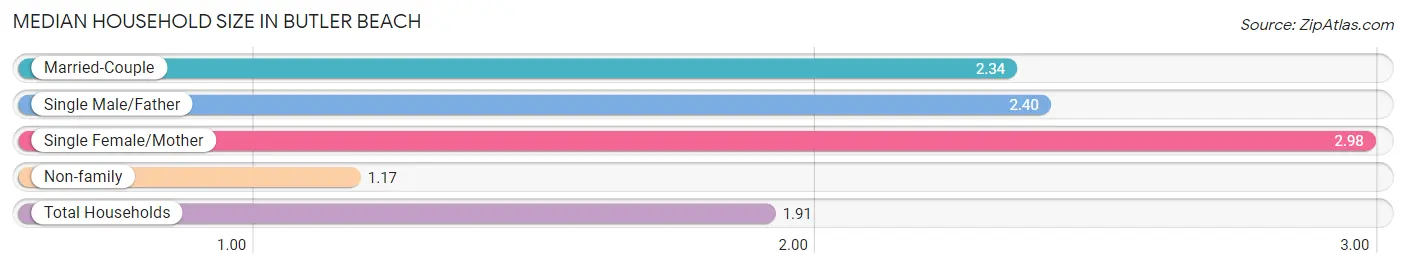
Median Household Size in Butler Beach
The median household size in Butler Beach is 1.91 persons per household, with single female/mother households (94 | 3.7%) accounting for the largest median household size of 2.98 persons per household. non-family households (971 | 38.5%) represent the smallest median household size with 1.17 persons per household.
| Household Type | # Households | Household Size |
| Married-Couple | 1,449 (57.4%) | 2.34 |
| Single Male/Father | 10 (0.4%) | 2.40 |
| Single Female/Mother | 94 (3.7%) | 2.98 |
| Non-family | 971 (38.5%) | 1.17 |
| Total Households | 2,524 (100.0%) | 1.91 |
Household Size by Marriage Status in Butler Beach
Out of a total of 2,524 households in Butler Beach, 1,553 (61.5%) are family households, while 971 (38.5%) are nonfamily households. The most numerous type of family households are 2-person households, comprising 1,254, and the most common type of nonfamily households are 1-person households, comprising 876.
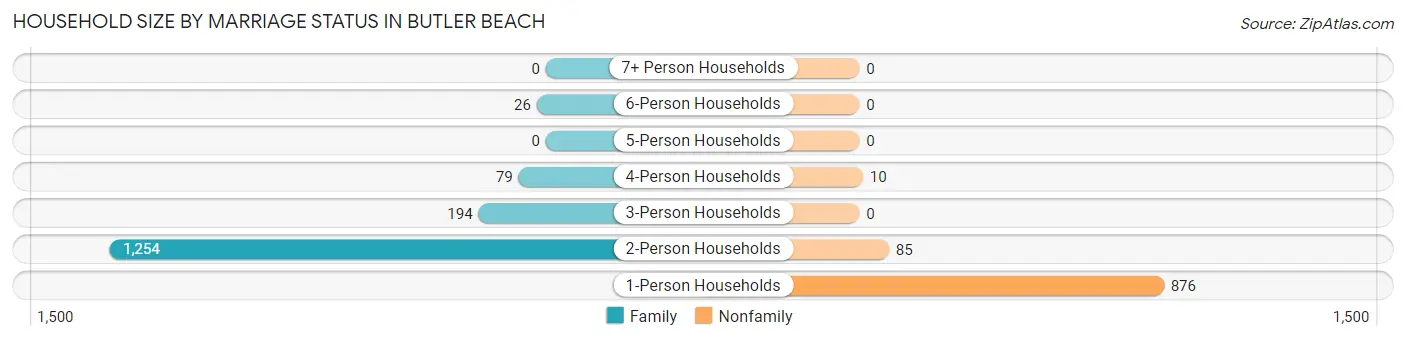
| Household Size | Family Households | Nonfamily Households |
| 1-Person Households | - | 876 (34.7%) |
| 2-Person Households | 1,254 (49.7%) | 85 (3.4%) |
| 3-Person Households | 194 (7.7%) | 0 (0.0%) |
| 4-Person Households | 79 (3.1%) | 10 (0.4%) |
| 5-Person Households | 0 (0.0%) | 0 (0.0%) |
| 6-Person Households | 26 (1.0%) | 0 (0.0%) |
| 7+ Person Households | 0 (0.0%) | 0 (0.0%) |
| Total | 1,553 (61.5%) | 971 (38.5%) |
Female Fertility in Butler Beach
Fertility by Age in Butler Beach
Average fertility rate in Butler Beach is 23.0 births per 1,000 women. Women in the age bracket of 20 to 34 years have the highest fertility rate with 73.0 births per 1,000 women. Women in the age bracket of 20 to 34 years acount for 100.0% of all women with births.
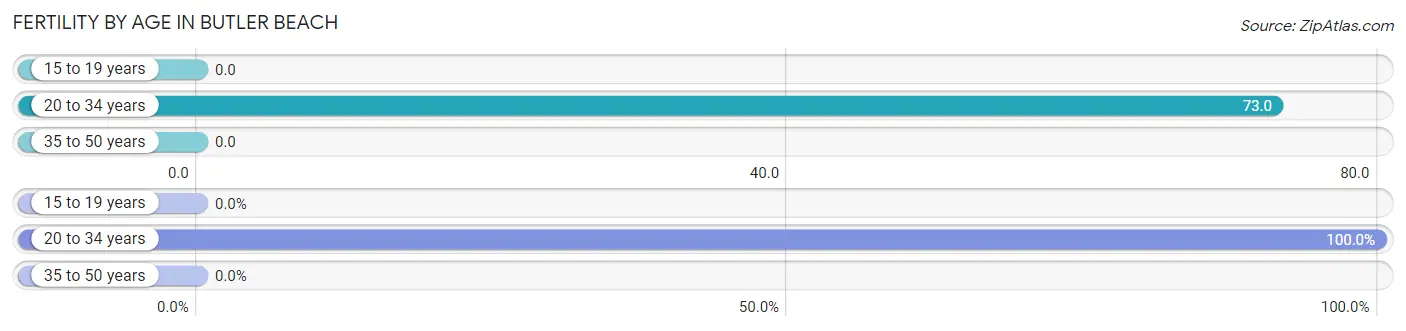
| Age Bracket | Women with Births | Births / 1,000 Women |
| 15 to 19 years | 0 (0.0%) | 0.0 |
| 20 to 34 years | 13 (100.0%) | 73.0 |
| 35 to 50 years | 0 (0.0%) | 0.0 |
| Total | 13 (100.0%) | 23.0 |
Fertility by Age by Marriage Status in Butler Beach
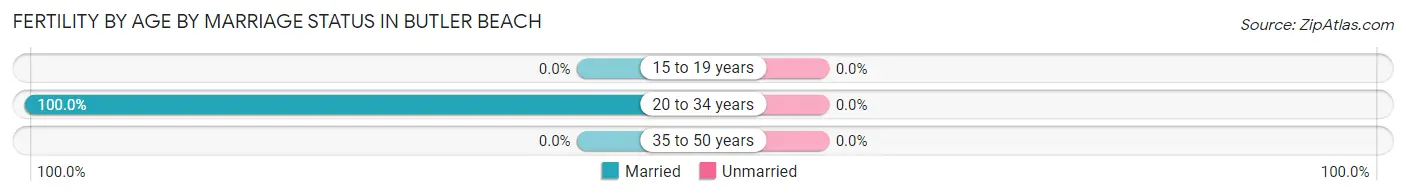
| Age Bracket | Married | Unmarried |
| 15 to 19 years | 0 (0.0%) | 0 (0.0%) |
| 20 to 34 years | 13 (100.0%) | 0 (0.0%) |
| 35 to 50 years | 0 (0.0%) | 0 (0.0%) |
| Total | 13 (100.0%) | 0 (0.0%) |
Fertility by Education in Butler Beach
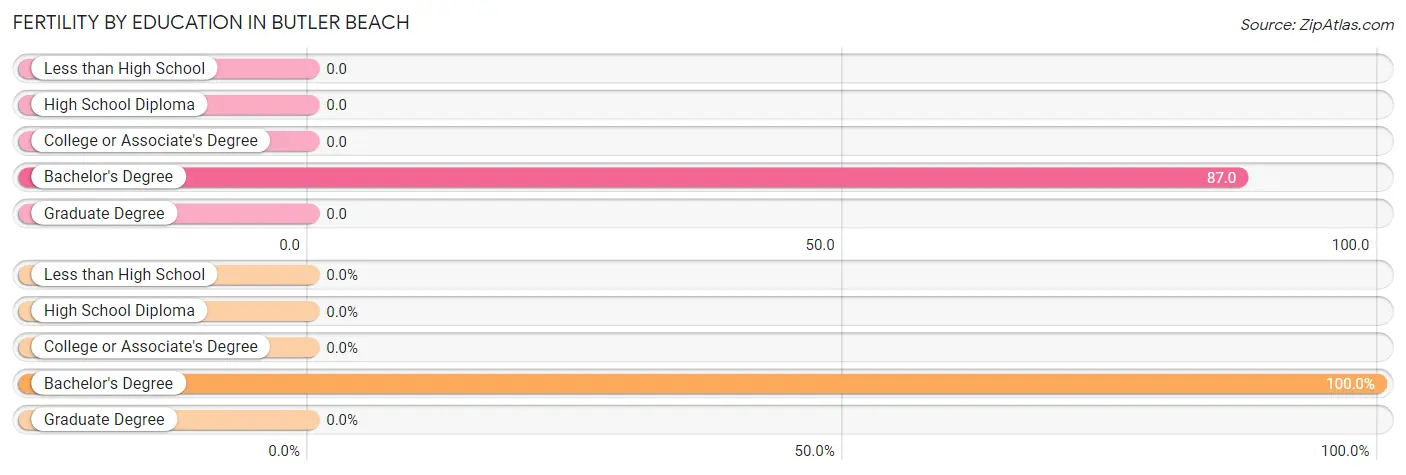
| Educational Attainment | Women with Births | Births / 1,000 Women |
| Less than High School | 0 (0.0%) | 0.0 |
| High School Diploma | 0 (0.0%) | 0.0 |
| College or Associate's Degree | 0 (0.0%) | 0.0 |
| Bachelor's Degree | 13 (100.0%) | 87.0 |
| Graduate Degree | 0 (0.0%) | 0.0 |
| Total | 13 (100.0%) | 23.0 |
Fertility by Education by Marriage Status in Butler Beach
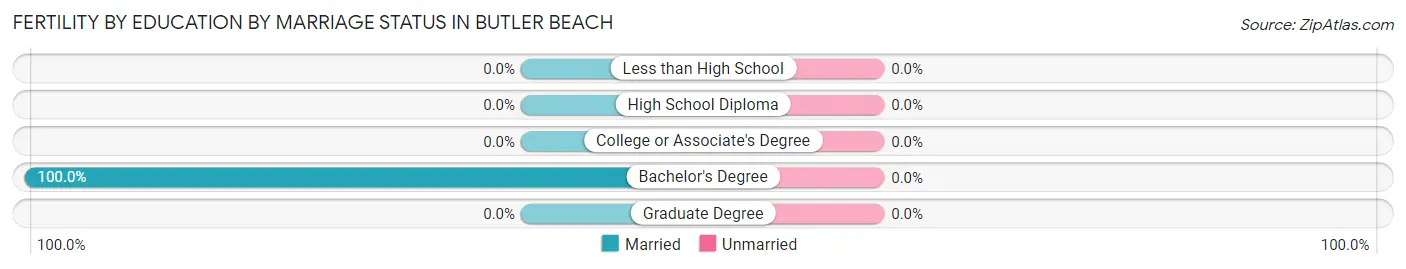
| Educational Attainment | Married | Unmarried |
| Less than High School | 0 (0.0%) | 0 (0.0%) |
| High School Diploma | 0 (0.0%) | 0 (0.0%) |
| College or Associate's Degree | 0 (0.0%) | 0 (0.0%) |
| Bachelor's Degree | 13 (100.0%) | 0 (0.0%) |
| Graduate Degree | 0 (0.0%) | 0 (0.0%) |
| Total | 13 (100.0%) | 0 (0.0%) |
Employment Characteristics in Butler Beach
Employment by Class of Employer in Butler Beach
Among the 2,110 employed individuals in Butler Beach, private company employees (1,316 | 62.4%), self-employed (incorporated) (274 | 13.0%), and self-employed (not incorporated) (194 | 9.2%) make up the most common classes of employment.
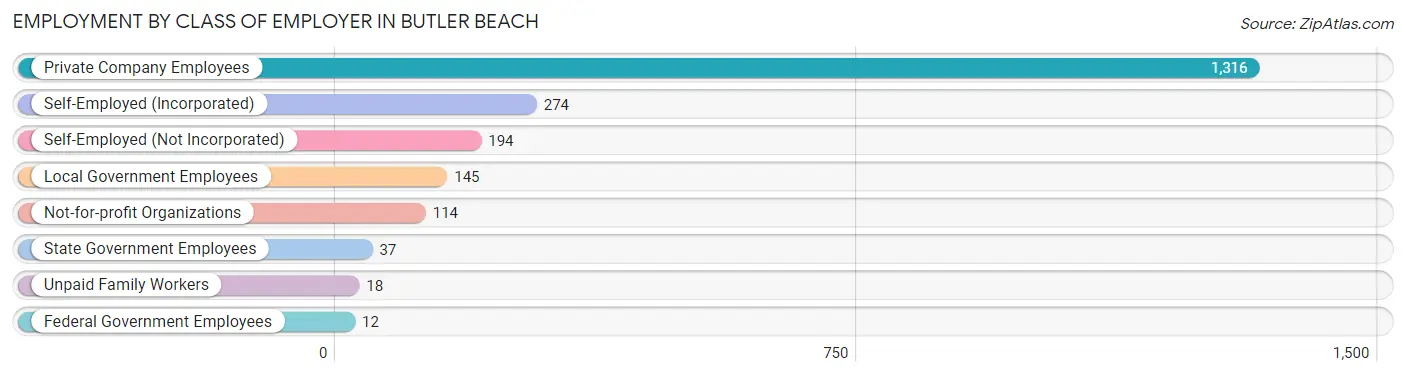
| Employer Class | # Employees | % Employees |
| Private Company Employees | 1,316 | 62.4% |
| Self-Employed (Incorporated) | 274 | 13.0% |
| Self-Employed (Not Incorporated) | 194 | 9.2% |
| Not-for-profit Organizations | 114 | 5.4% |
| Local Government Employees | 145 | 6.9% |
| State Government Employees | 37 | 1.8% |
| Federal Government Employees | 12 | 0.6% |
| Unpaid Family Workers | 18 | 0.9% |
| Total | 2,110 | 100.0% |
Employment Status by Age in Butler Beach
According to the labor force statistics for Butler Beach, out of the total population over 16 years of age (4,599), 49.8% or 2,290 individuals are in the labor force, with 6.3% or 144 of them unemployed. The age group with the highest labor force participation rate is 25 to 29 years, with 100.0% or 156 individuals in the labor force. Within the labor force, the 20 to 24 years age range has the highest percentage of unemployed individuals, with 29.5% or 71 of them being unemployed.
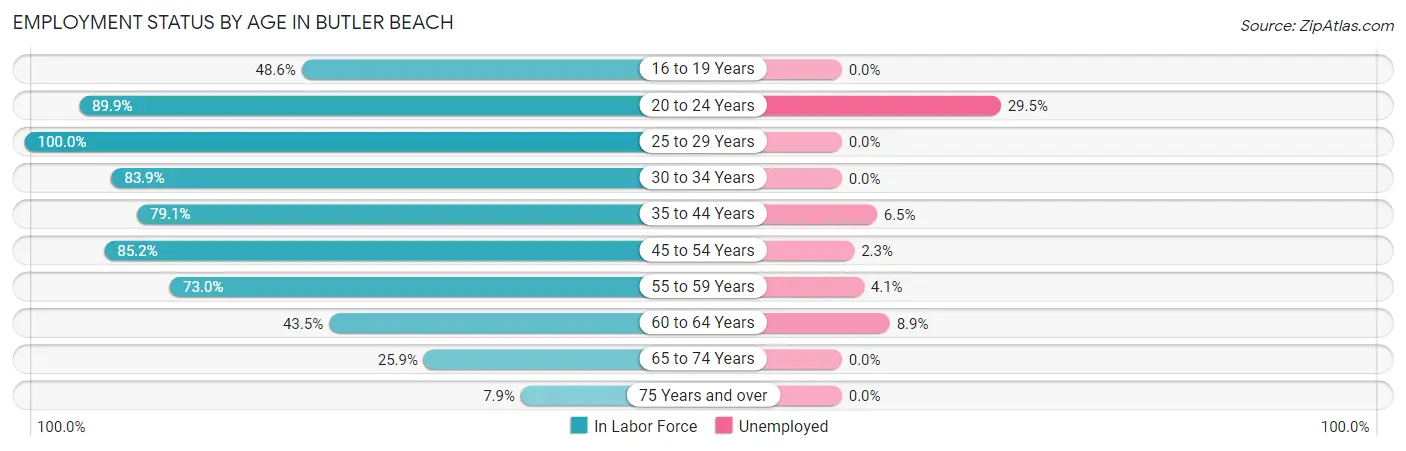
| Age Bracket | In Labor Force | Unemployed |
| 16 to 19 Years | 36 (48.6%) | 0 (0.0%) |
| 20 to 24 Years | 241 (89.9%) | 71 (29.5%) |
| 25 to 29 Years | 156 (100.0%) | 0 (0.0%) |
| 30 to 34 Years | 47 (83.9%) | 0 (0.0%) |
| 35 to 44 Years | 306 (79.1%) | 20 (6.5%) |
| 45 to 54 Years | 438 (85.2%) | 10 (2.3%) |
| 55 to 59 Years | 363 (73.0%) | 15 (4.1%) |
| 60 to 64 Years | 316 (43.5%) | 28 (8.9%) |
| 65 to 74 Years | 337 (25.9%) | 0 (0.0%) |
| 75 Years and over | 49 (7.9%) | 0 (0.0%) |
| Total | 2,290 (49.8%) | 144 (6.3%) |
Employment Status by Educational Attainment in Butler Beach
According to labor force statistics for Butler Beach, 69.6% of individuals (1,626) out of the total population between 25 and 64 years of age (2,336) are in the labor force, with 4.5% or 73 of them being unemployed. The group with the highest labor force participation rate are those with the educational attainment of less than high school, with 81.1% or 43 individuals in the labor force. Within the labor force, individuals with college / associate degree education have the highest percentage of unemployment, with 9.0% or 45 of them being unemployed.
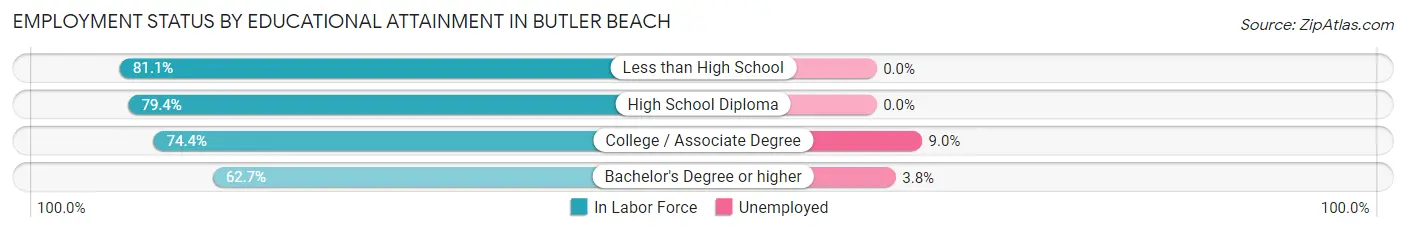
| Educational Attainment | In Labor Force | Unemployed |
| Less than High School | 43 (81.1%) | 0 (0.0%) |
| High School Diploma | 350 (79.4%) | 0 (0.0%) |
| College / Associate Degree | 498 (74.4%) | 60 (9.0%) |
| Bachelor's Degree or higher | 735 (62.7%) | 45 (3.8%) |
| Total | 1,626 (69.6%) | 105 (4.5%) |
Employment Occupations by Sex in Butler Beach
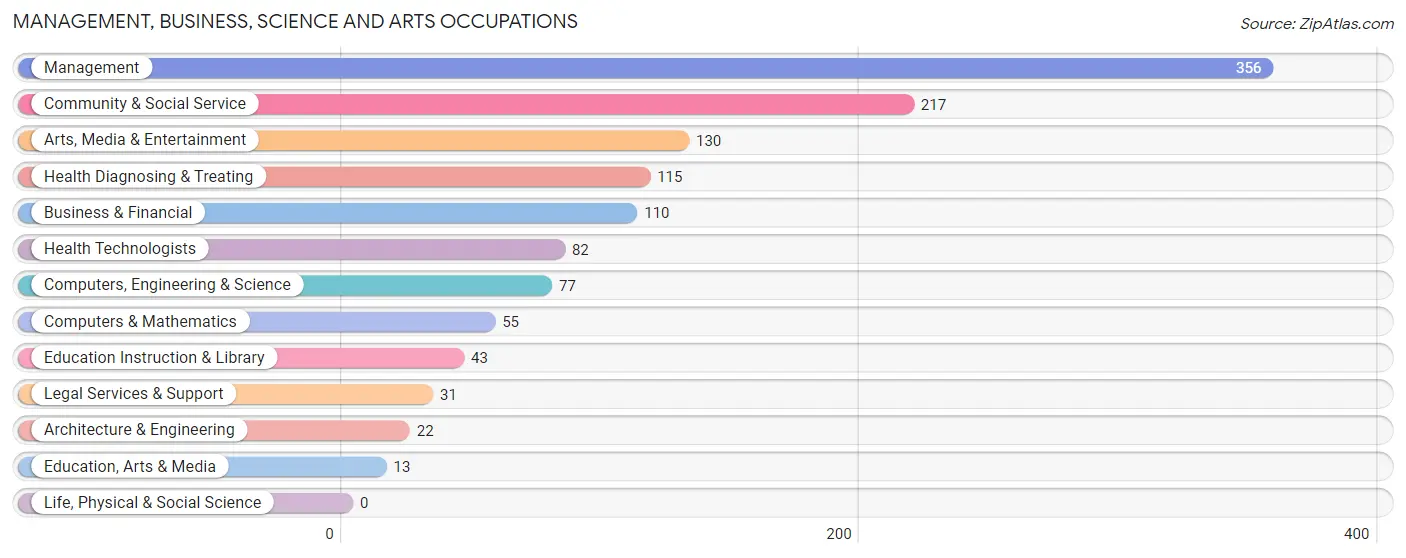
Management, Business, Science and Arts Occupations
The most common Management, Business, Science and Arts occupations in Butler Beach are Management (356 | 16.6%), Community & Social Service (217 | 10.1%), Arts, Media & Entertainment (130 | 6.1%), Health Diagnosing & Treating (115 | 5.4%), and Business & Financial (110 | 5.1%).
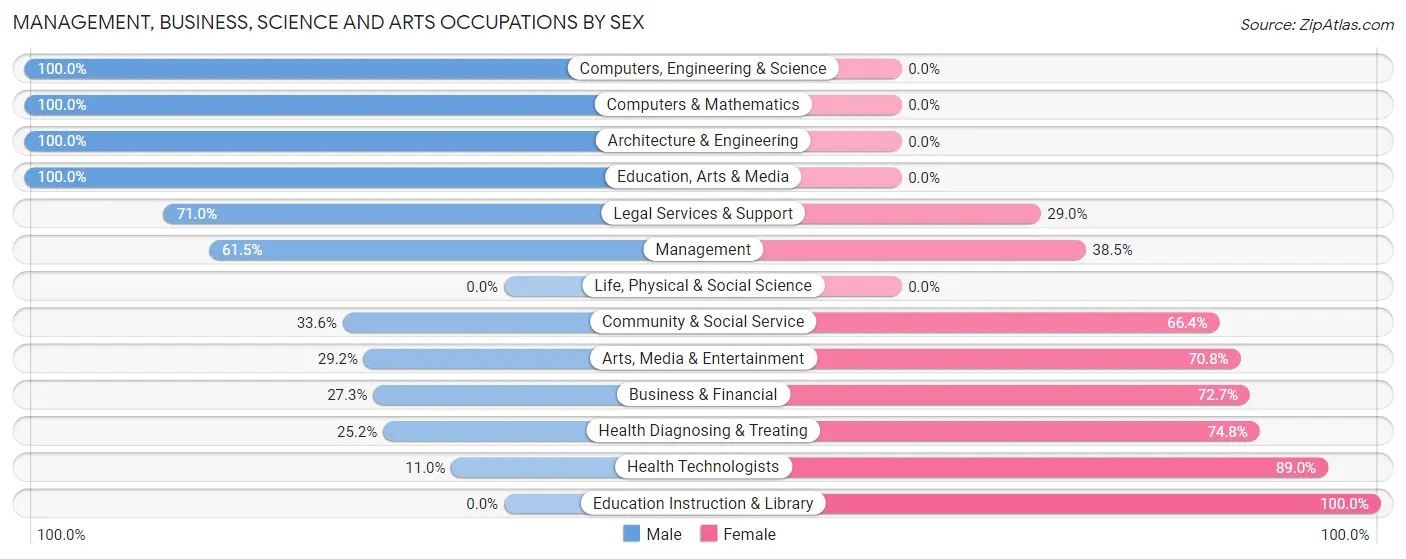
Management, Business, Science and Arts Occupations by Sex
Within the Management, Business, Science and Arts occupations in Butler Beach, the most male-oriented occupations are Computers, Engineering & Science (100.0%), Computers & Mathematics (100.0%), and Architecture & Engineering (100.0%), while the most female-oriented occupations are Education Instruction & Library (100.0%), Health Technologists (89.0%), and Health Diagnosing & Treating (74.8%).
| Occupation | Male | Female |
| Management | 219 (61.5%) | 137 (38.5%) |
| Business & Financial | 30 (27.3%) | 80 (72.7%) |
| Computers, Engineering & Science | 77 (100.0%) | 0 (0.0%) |
| Computers & Mathematics | 55 (100.0%) | 0 (0.0%) |
| Architecture & Engineering | 22 (100.0%) | 0 (0.0%) |
| Life, Physical & Social Science | 0 (0.0%) | 0 (0.0%) |
| Community & Social Service | 73 (33.6%) | 144 (66.4%) |
| Education, Arts & Media | 13 (100.0%) | 0 (0.0%) |
| Legal Services & Support | 22 (71.0%) | 9 (29.0%) |
| Education Instruction & Library | 0 (0.0%) | 43 (100.0%) |
| Arts, Media & Entertainment | 38 (29.2%) | 92 (70.8%) |
| Health Diagnosing & Treating | 29 (25.2%) | 86 (74.8%) |
| Health Technologists | 9 (11.0%) | 73 (89.0%) |
| Total (Category) | 428 (48.9%) | 447 (51.1%) |
| Total (Overall) | 1,191 (55.5%) | 955 (44.5%) |
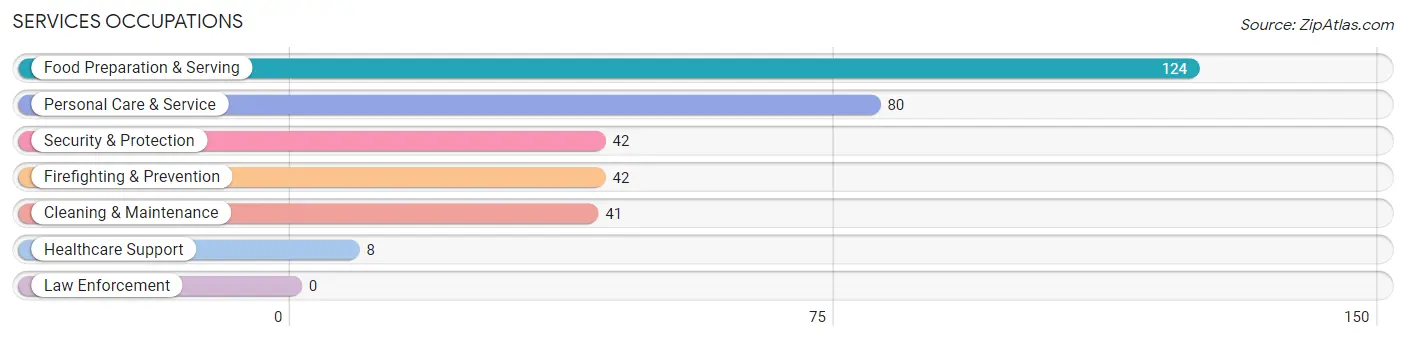
Services Occupations
The most common Services occupations in Butler Beach are Food Preparation & Serving (124 | 5.8%), Personal Care & Service (80 | 3.7%), Security & Protection (42 | 2.0%), Firefighting & Prevention (42 | 2.0%), and Cleaning & Maintenance (41 | 1.9%).
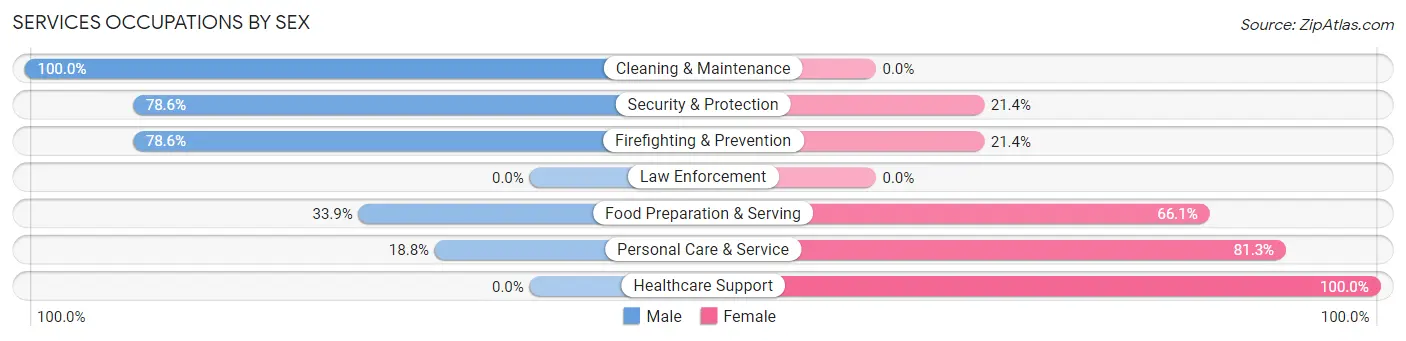
Services Occupations by Sex
Within the Services occupations in Butler Beach, the most male-oriented occupations are Cleaning & Maintenance (100.0%), Security & Protection (78.6%), and Firefighting & Prevention (78.6%), while the most female-oriented occupations are Healthcare Support (100.0%), Personal Care & Service (81.2%), and Food Preparation & Serving (66.1%).
| Occupation | Male | Female |
| Healthcare Support | 0 (0.0%) | 8 (100.0%) |
| Security & Protection | 33 (78.6%) | 9 (21.4%) |
| Firefighting & Prevention | 33 (78.6%) | 9 (21.4%) |
| Law Enforcement | 0 (0.0%) | 0 (0.0%) |
| Food Preparation & Serving | 42 (33.9%) | 82 (66.1%) |
| Cleaning & Maintenance | 41 (100.0%) | 0 (0.0%) |
| Personal Care & Service | 15 (18.8%) | 65 (81.2%) |
| Total (Category) | 131 (44.4%) | 164 (55.6%) |
| Total (Overall) | 1,191 (55.5%) | 955 (44.5%) |
Sales and Office Occupations
The most common Sales and Office occupations in Butler Beach are Sales & Related (484 | 22.6%), and Office & Administration (127 | 5.9%).
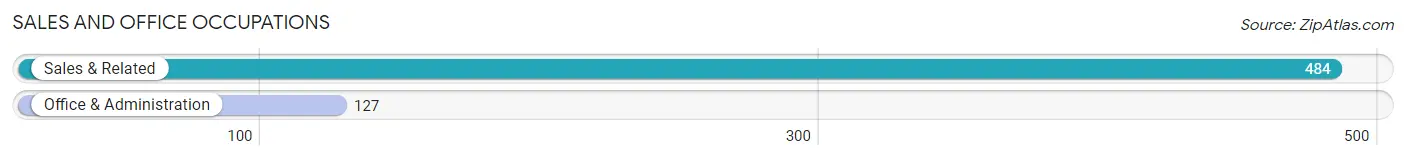
Sales and Office Occupations by Sex
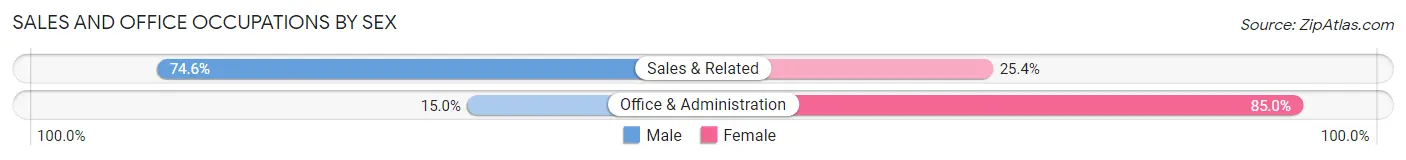
| Occupation | Male | Female |
| Sales & Related | 361 (74.6%) | 123 (25.4%) |
| Office & Administration | 19 (15.0%) | 108 (85.0%) |
| Total (Category) | 380 (62.2%) | 231 (37.8%) |
| Total (Overall) | 1,191 (55.5%) | 955 (44.5%) |
Natural Resources, Construction and Maintenance Occupations
The most common Natural Resources, Construction and Maintenance occupations in Butler Beach are Construction & Extraction (65 | 3.0%), and Installation, Maintenance & Repair (45 | 2.1%).
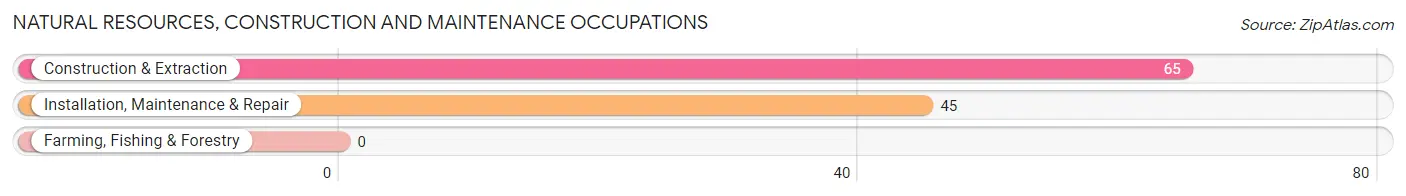
Natural Resources, Construction and Maintenance Occupations by Sex
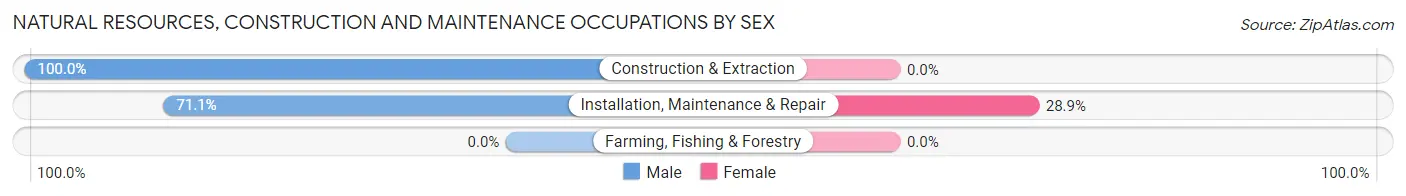
| Occupation | Male | Female |
| Farming, Fishing & Forestry | 0 (0.0%) | 0 (0.0%) |
| Construction & Extraction | 65 (100.0%) | 0 (0.0%) |
| Installation, Maintenance & Repair | 32 (71.1%) | 13 (28.9%) |
| Total (Category) | 97 (88.2%) | 13 (11.8%) |
| Total (Overall) | 1,191 (55.5%) | 955 (44.5%) |
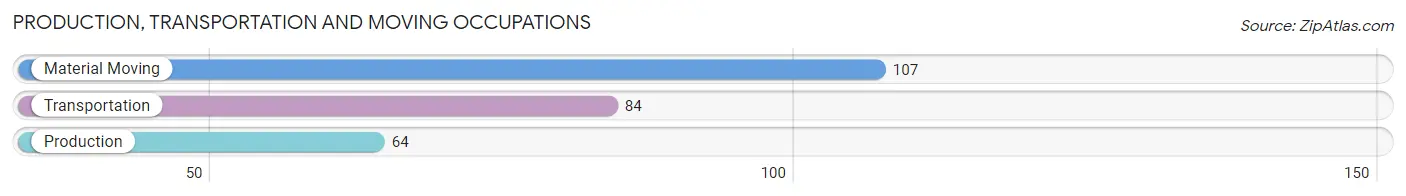
Production, Transportation and Moving Occupations
The most common Production, Transportation and Moving occupations in Butler Beach are Material Moving (107 | 5.0%), Transportation (84 | 3.9%), and Production (64 | 3.0%).
Production, Transportation and Moving Occupations by Sex
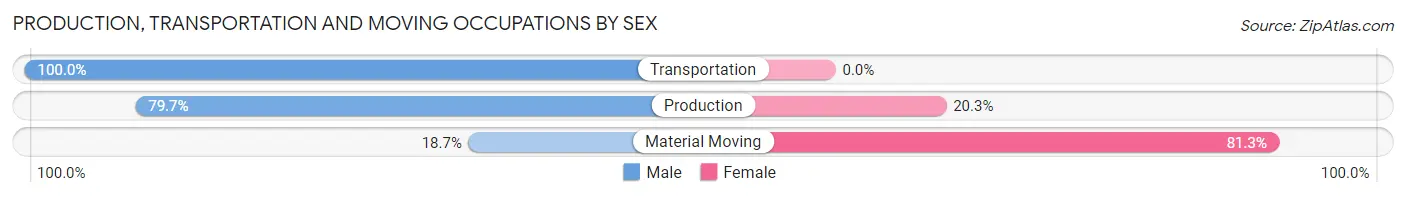
| Occupation | Male | Female |
| Production | 51 (79.7%) | 13 (20.3%) |
| Transportation | 84 (100.0%) | 0 (0.0%) |
| Material Moving | 20 (18.7%) | 87 (81.3%) |
| Total (Category) | 155 (60.8%) | 100 (39.2%) |
| Total (Overall) | 1,191 (55.5%) | 955 (44.5%) |
Employment Industries by Sex in Butler Beach
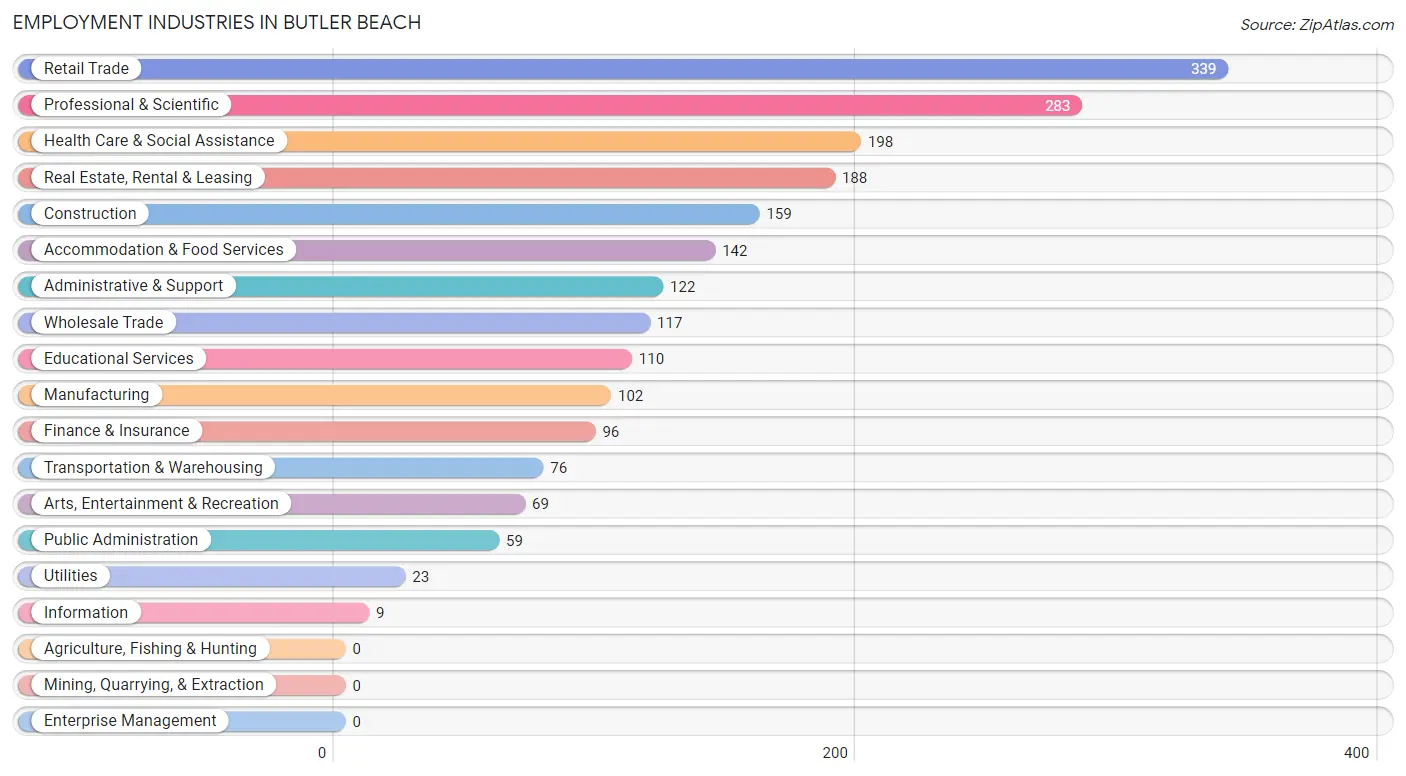
Employment Industries in Butler Beach
The major employment industries in Butler Beach include Retail Trade (339 | 15.8%), Professional & Scientific (283 | 13.2%), Health Care & Social Assistance (198 | 9.2%), Real Estate, Rental & Leasing (188 | 8.8%), and Construction (159 | 7.4%).
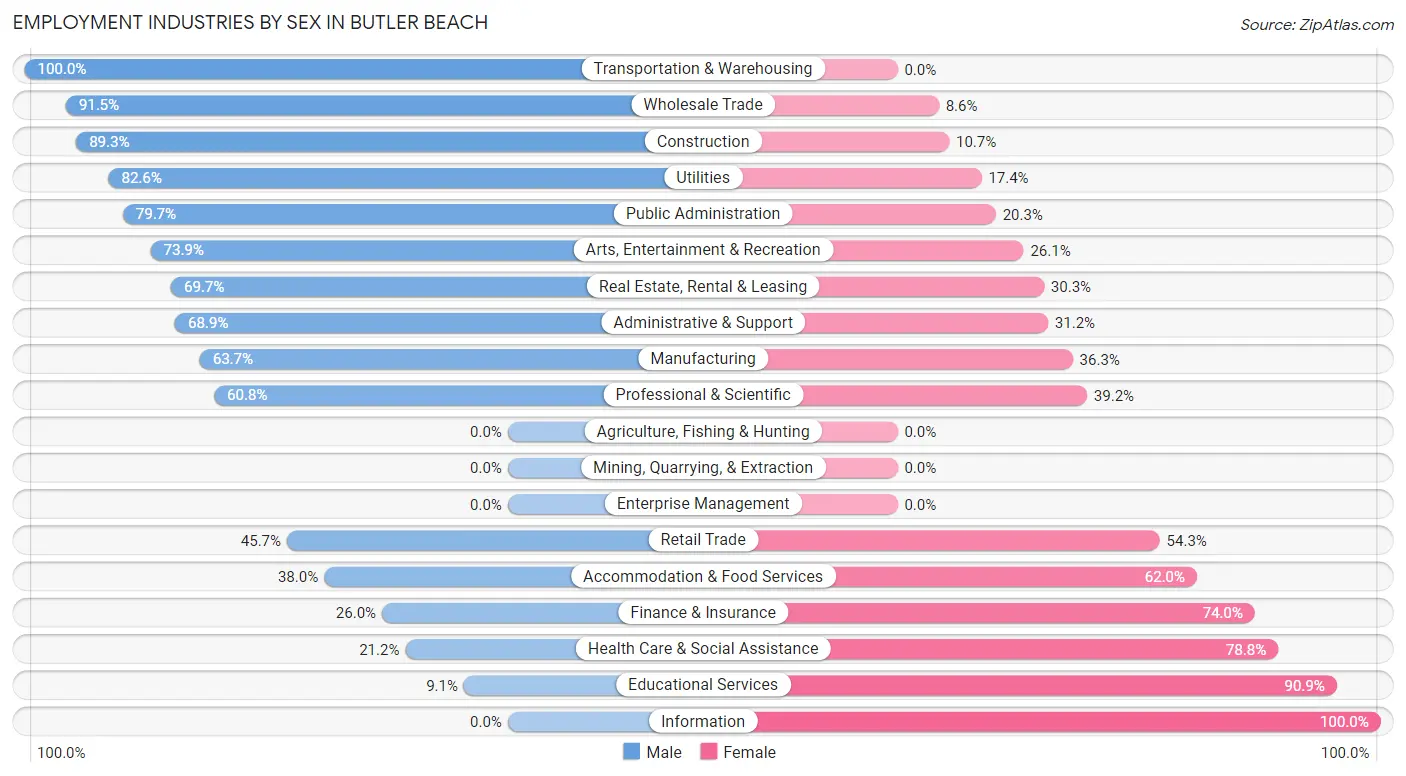
Employment Industries by Sex in Butler Beach
The Butler Beach industries that see more men than women are Transportation & Warehousing (100.0%), Wholesale Trade (91.4%), and Construction (89.3%), whereas the industries that tend to have a higher number of women are Information (100.0%), Educational Services (90.9%), and Health Care & Social Assistance (78.8%).
| Industry | Male | Female |
| Agriculture, Fishing & Hunting | 0 (0.0%) | 0 (0.0%) |
| Mining, Quarrying, & Extraction | 0 (0.0%) | 0 (0.0%) |
| Construction | 142 (89.3%) | 17 (10.7%) |
| Manufacturing | 65 (63.7%) | 37 (36.3%) |
| Wholesale Trade | 107 (91.4%) | 10 (8.6%) |
| Retail Trade | 155 (45.7%) | 184 (54.3%) |
| Transportation & Warehousing | 76 (100.0%) | 0 (0.0%) |
| Utilities | 19 (82.6%) | 4 (17.4%) |
| Information | 0 (0.0%) | 9 (100.0%) |
| Finance & Insurance | 25 (26.0%) | 71 (74.0%) |
| Real Estate, Rental & Leasing | 131 (69.7%) | 57 (30.3%) |
| Professional & Scientific | 172 (60.8%) | 111 (39.2%) |
| Enterprise Management | 0 (0.0%) | 0 (0.0%) |
| Administrative & Support | 84 (68.9%) | 38 (31.1%) |
| Educational Services | 10 (9.1%) | 100 (90.9%) |
| Health Care & Social Assistance | 42 (21.2%) | 156 (78.8%) |
| Arts, Entertainment & Recreation | 51 (73.9%) | 18 (26.1%) |
| Accommodation & Food Services | 54 (38.0%) | 88 (62.0%) |
| Public Administration | 47 (79.7%) | 12 (20.3%) |
| Total | 1,191 (55.5%) | 955 (44.5%) |
Education in Butler Beach
School Enrollment in Butler Beach
The most common levels of schooling among the 452 students in Butler Beach are college / undergraduate (190 | 42.0%), high school (82 | 18.1%), and middle school (64 | 14.2%).
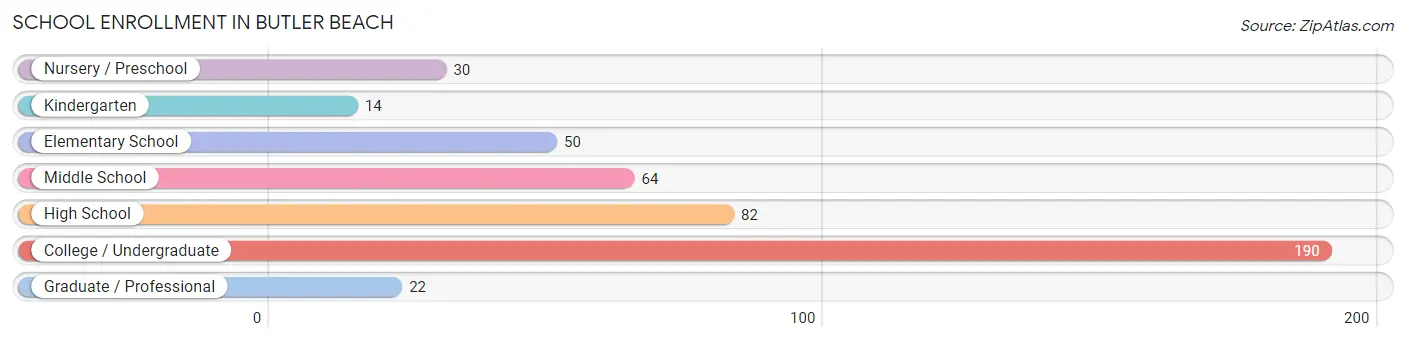
| School Level | # Students | % Students |
| Nursery / Preschool | 30 | 6.6% |
| Kindergarten | 14 | 3.1% |
| Elementary School | 50 | 11.1% |
| Middle School | 64 | 14.2% |
| High School | 82 | 18.1% |
| College / Undergraduate | 190 | 42.0% |
| Graduate / Professional | 22 | 4.9% |
| Total | 452 | 100.0% |
School Enrollment by Age by Funding Source in Butler Beach
Out of a total of 452 students who are enrolled in schools in Butler Beach, 91 (20.1%) attend a private institution, while the remaining 361 (79.9%) are enrolled in public schools. The age group of 18 to 19 year olds has the highest likelihood of being enrolled in private schools, with 16 (53.3% in the age bracket) enrolled. Conversely, the age group of 3 to 4 year olds has the lowest likelihood of being enrolled in a private school, with 17 (100.0% in the age bracket) attending a public institution.
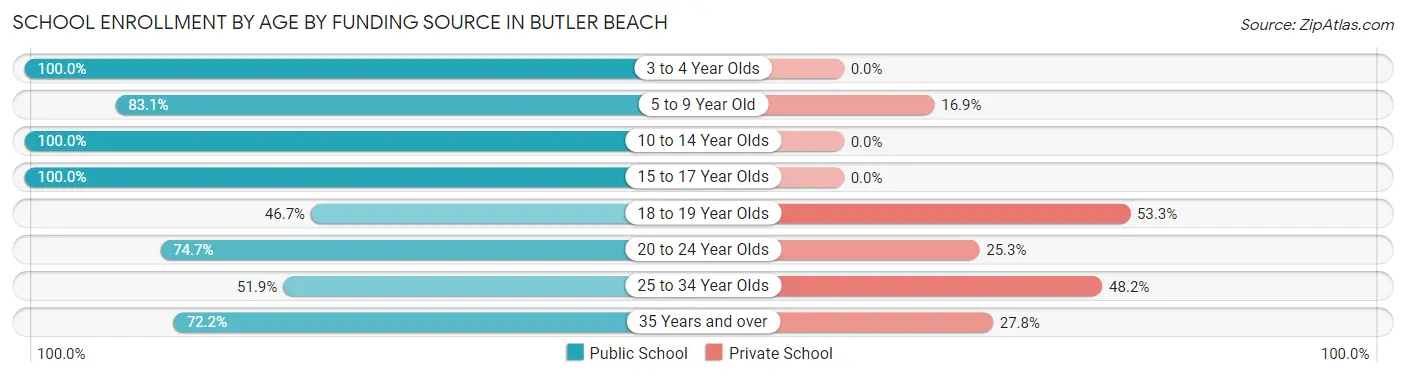
| Age Bracket | Public School | Private School |
| 3 to 4 Year Olds | 17 (100.0%) | 0 (0.0%) |
| 5 to 9 Year Old | 64 (83.1%) | 13 (16.9%) |
| 10 to 14 Year Olds | 74 (100.0%) | 0 (0.0%) |
| 15 to 17 Year Olds | 42 (100.0%) | 0 (0.0%) |
| 18 to 19 Year Olds | 14 (46.7%) | 16 (53.3%) |
| 20 to 24 Year Olds | 71 (74.7%) | 24 (25.3%) |
| 25 to 34 Year Olds | 14 (51.8%) | 13 (48.1%) |
| 35 Years and over | 65 (72.2%) | 25 (27.8%) |
| Total | 361 (79.9%) | 91 (20.1%) |
Educational Attainment by Field of Study in Butler Beach
Business (511 | 22.0%), education (431 | 18.6%), science & technology (243 | 10.5%), social sciences (191 | 8.2%), and literature & languages (154 | 6.6%) are the most common fields of study among 2,322 individuals in Butler Beach who have obtained a bachelor's degree or higher.
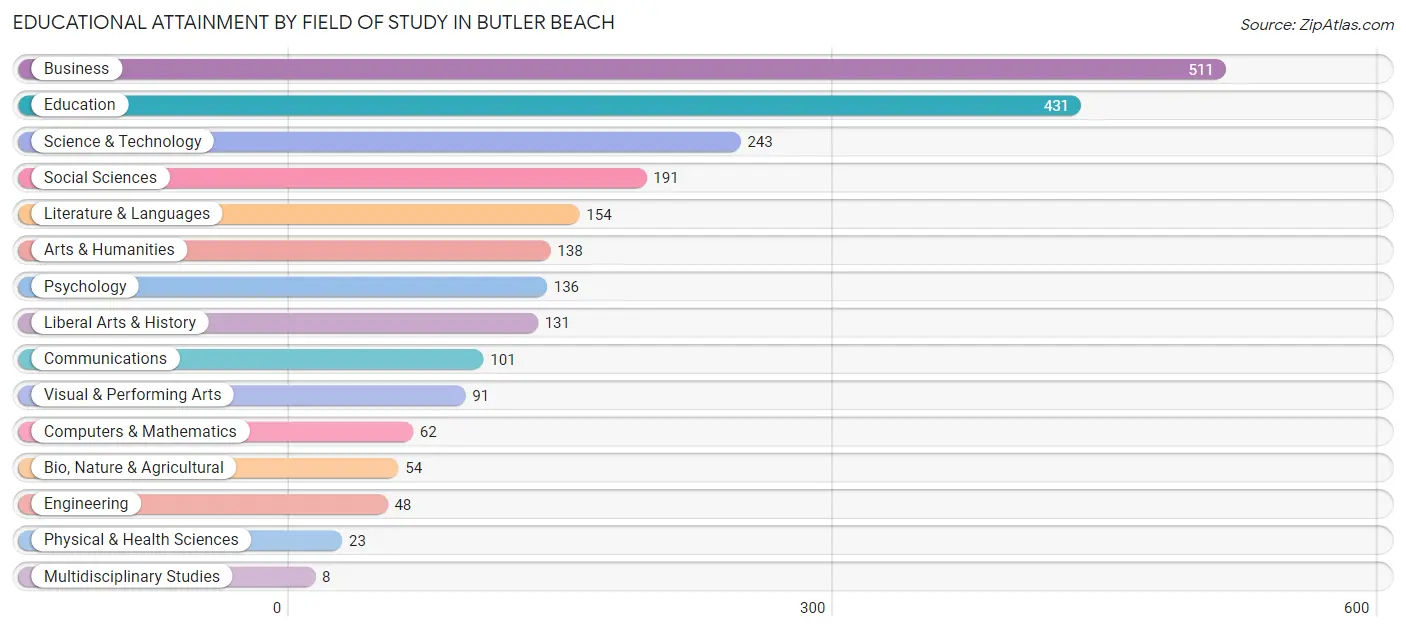
| Field of Study | # Graduates | % Graduates |
| Computers & Mathematics | 62 | 2.7% |
| Bio, Nature & Agricultural | 54 | 2.3% |
| Physical & Health Sciences | 23 | 1.0% |
| Psychology | 136 | 5.9% |
| Social Sciences | 191 | 8.2% |
| Engineering | 48 | 2.1% |
| Multidisciplinary Studies | 8 | 0.3% |
| Science & Technology | 243 | 10.5% |
| Business | 511 | 22.0% |
| Education | 431 | 18.6% |
| Literature & Languages | 154 | 6.6% |
| Liberal Arts & History | 131 | 5.6% |
| Visual & Performing Arts | 91 | 3.9% |
| Communications | 101 | 4.3% |
| Arts & Humanities | 138 | 5.9% |
| Total | 2,322 | 100.0% |
Transportation & Commute in Butler Beach
Vehicle Availability by Sex in Butler Beach
The most prevalent vehicle ownership categories in Butler Beach are males with 2 vehicles (596, accounting for 50.0%) and females with 2 vehicles (330, making up 64.8%).
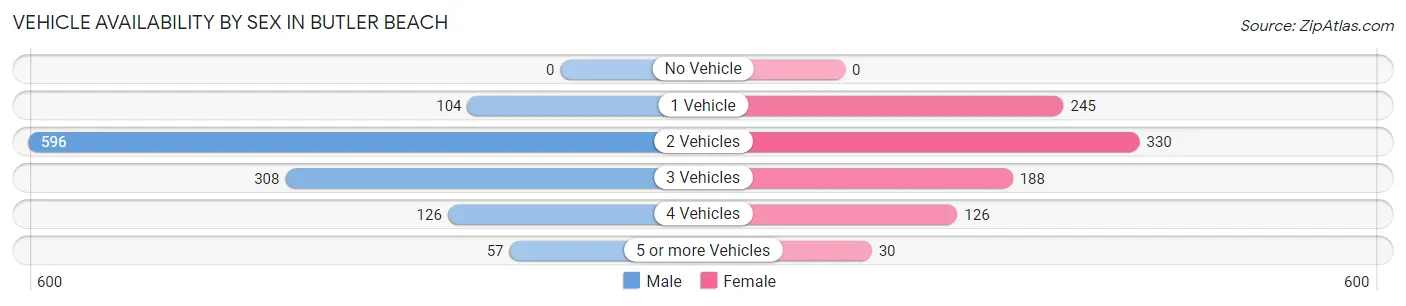
| Vehicles Available | Male | Female |
| No Vehicle | 0 (0.0%) | 0 (0.0%) |
| 1 Vehicle | 104 (8.7%) | 245 (26.7%) |
| 2 Vehicles | 596 (50.0%) | 330 (35.9%) |
| 3 Vehicles | 308 (25.9%) | 188 (20.5%) |
| 4 Vehicles | 126 (10.6%) | 126 (13.7%) |
| 5 or more Vehicles | 57 (4.8%) | 30 (3.3%) |
| Total | 1,191 (100.0%) | 919 (100.0%) |
Commute Time in Butler Beach
The most frequently occuring commute durations in Butler Beach are 15 to 19 minutes (309 commuters, 19.6%), 20 to 24 minutes (272 commuters, 17.2%), and 10 to 14 minutes (248 commuters, 15.7%).
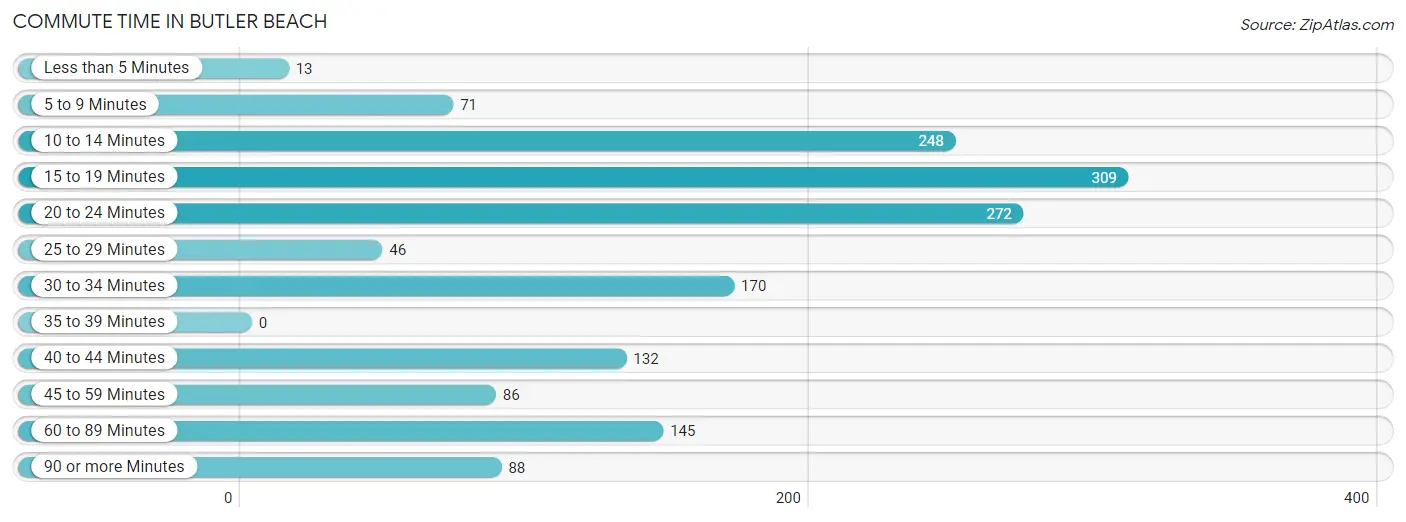
| Commute Time | # Commuters | % Commuters |
| Less than 5 Minutes | 13 | 0.8% |
| 5 to 9 Minutes | 71 | 4.5% |
| 10 to 14 Minutes | 248 | 15.7% |
| 15 to 19 Minutes | 309 | 19.6% |
| 20 to 24 Minutes | 272 | 17.2% |
| 25 to 29 Minutes | 46 | 2.9% |
| 30 to 34 Minutes | 170 | 10.8% |
| 35 to 39 Minutes | 0 | 0.0% |
| 40 to 44 Minutes | 132 | 8.4% |
| 45 to 59 Minutes | 86 | 5.4% |
| 60 to 89 Minutes | 145 | 9.2% |
| 90 or more Minutes | 88 | 5.6% |
Commute Time by Sex in Butler Beach
The most common commute times in Butler Beach are 10 to 14 minutes (170 commuters, 18.8%) for males and 15 to 19 minutes (190 commuters, 28.1%) for females.
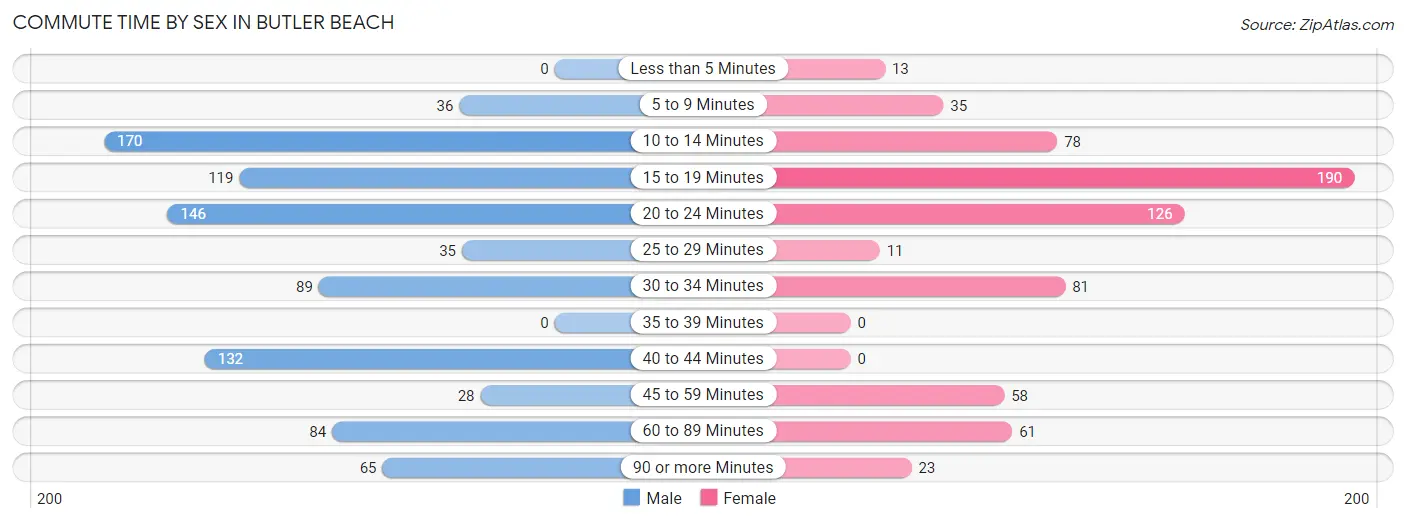
| Commute Time | Male | Female |
| Less than 5 Minutes | 0 (0.0%) | 13 (1.9%) |
| 5 to 9 Minutes | 36 (4.0%) | 35 (5.2%) |
| 10 to 14 Minutes | 170 (18.8%) | 78 (11.5%) |
| 15 to 19 Minutes | 119 (13.2%) | 190 (28.1%) |
| 20 to 24 Minutes | 146 (16.2%) | 126 (18.6%) |
| 25 to 29 Minutes | 35 (3.9%) | 11 (1.6%) |
| 30 to 34 Minutes | 89 (9.9%) | 81 (12.0%) |
| 35 to 39 Minutes | 0 (0.0%) | 0 (0.0%) |
| 40 to 44 Minutes | 132 (14.6%) | 0 (0.0%) |
| 45 to 59 Minutes | 28 (3.1%) | 58 (8.6%) |
| 60 to 89 Minutes | 84 (9.3%) | 61 (9.0%) |
| 90 or more Minutes | 65 (7.2%) | 23 (3.4%) |
Time of Departure to Work by Sex in Butler Beach
The most frequent times of departure to work in Butler Beach are 7:00 AM to 7:29 AM (165, 18.2%) for males and 7:00 AM to 7:29 AM (151, 22.3%) for females.
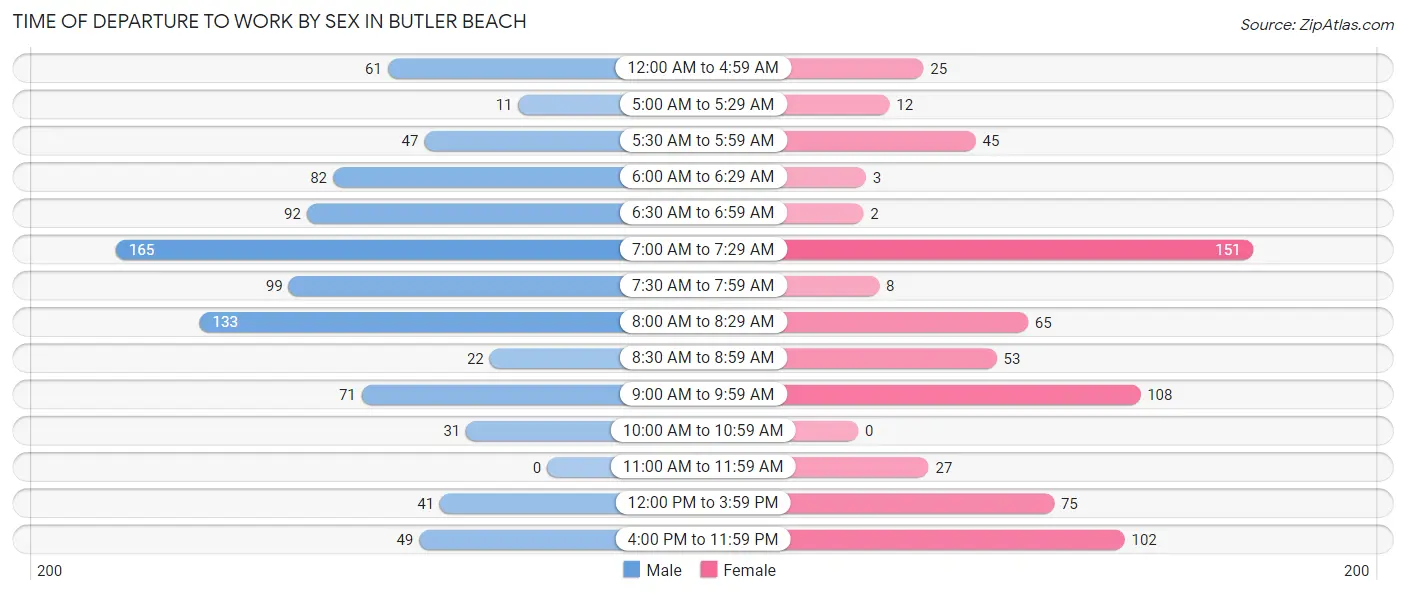
| Time of Departure | Male | Female |
| 12:00 AM to 4:59 AM | 61 (6.8%) | 25 (3.7%) |
| 5:00 AM to 5:29 AM | 11 (1.2%) | 12 (1.8%) |
| 5:30 AM to 5:59 AM | 47 (5.2%) | 45 (6.7%) |
| 6:00 AM to 6:29 AM | 82 (9.1%) | 3 (0.4%) |
| 6:30 AM to 6:59 AM | 92 (10.2%) | 2 (0.3%) |
| 7:00 AM to 7:29 AM | 165 (18.2%) | 151 (22.3%) |
| 7:30 AM to 7:59 AM | 99 (11.0%) | 8 (1.2%) |
| 8:00 AM to 8:29 AM | 133 (14.7%) | 65 (9.6%) |
| 8:30 AM to 8:59 AM | 22 (2.4%) | 53 (7.8%) |
| 9:00 AM to 9:59 AM | 71 (7.9%) | 108 (16.0%) |
| 10:00 AM to 10:59 AM | 31 (3.4%) | 0 (0.0%) |
| 11:00 AM to 11:59 AM | 0 (0.0%) | 27 (4.0%) |
| 12:00 PM to 3:59 PM | 41 (4.5%) | 75 (11.1%) |
| 4:00 PM to 11:59 PM | 49 (5.4%) | 102 (15.1%) |
| Total | 904 (100.0%) | 676 (100.0%) |
Housing Occupancy in Butler Beach
Occupancy by Ownership in Butler Beach
Of the total 2,524 dwellings in Butler Beach, owner-occupied units account for 2,203 (87.3%), while renter-occupied units make up 321 (12.7%).
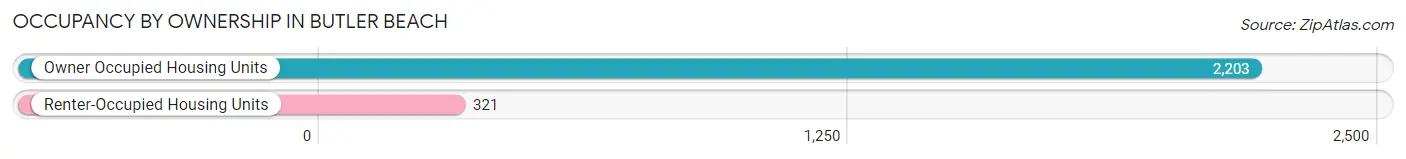
| Occupancy | # Housing Units | % Housing Units |
| Owner Occupied Housing Units | 2,203 | 87.3% |
| Renter-Occupied Housing Units | 321 | 12.7% |
| Total Occupied Housing Units | 2,524 | 100.0% |
Occupancy by Household Size in Butler Beach
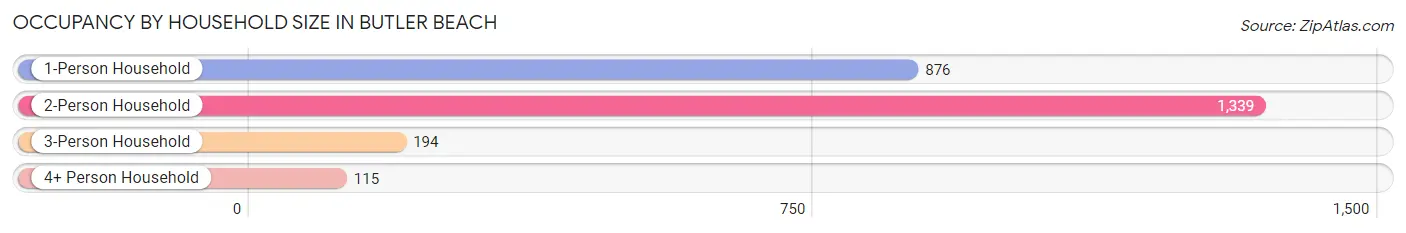
| Household Size | # Housing Units | % Housing Units |
| 1-Person Household | 876 | 34.7% |
| 2-Person Household | 1,339 | 53.0% |
| 3-Person Household | 194 | 7.7% |
| 4+ Person Household | 115 | 4.6% |
| Total Housing Units | 2,524 | 100.0% |
Occupancy by Ownership by Household Size in Butler Beach
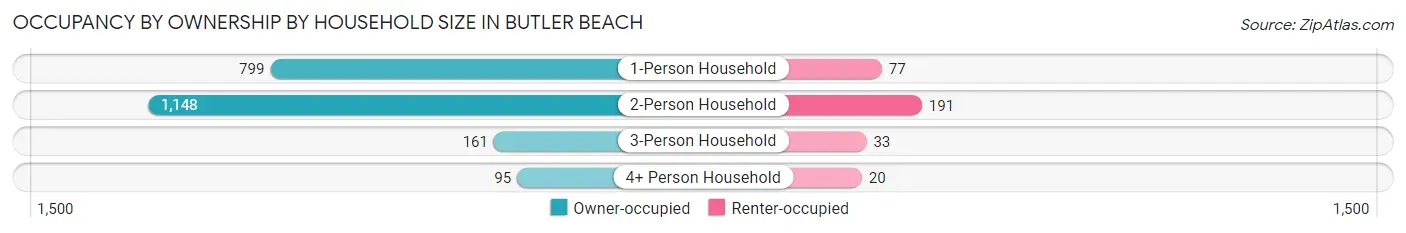
| Household Size | Owner-occupied | Renter-occupied |
| 1-Person Household | 799 (91.2%) | 77 (8.8%) |
| 2-Person Household | 1,148 (85.7%) | 191 (14.3%) |
| 3-Person Household | 161 (83.0%) | 33 (17.0%) |
| 4+ Person Household | 95 (82.6%) | 20 (17.4%) |
| Total Housing Units | 2,203 (87.3%) | 321 (12.7%) |
Occupancy by Educational Attainment in Butler Beach
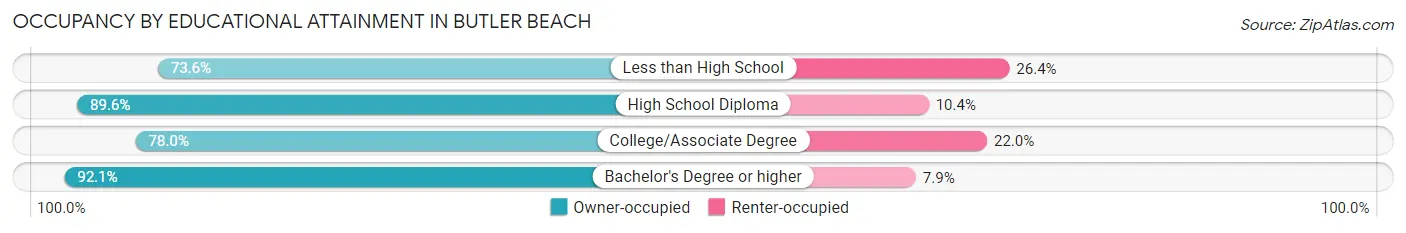
| Household Size | Owner-occupied | Renter-occupied |
| Less than High School | 39 (73.6%) | 14 (26.4%) |
| High School Diploma | 361 (89.6%) | 42 (10.4%) |
| College/Associate Degree | 564 (78.0%) | 159 (22.0%) |
| Bachelor's Degree or higher | 1,239 (92.1%) | 106 (7.9%) |
Occupancy by Age of Householder in Butler Beach
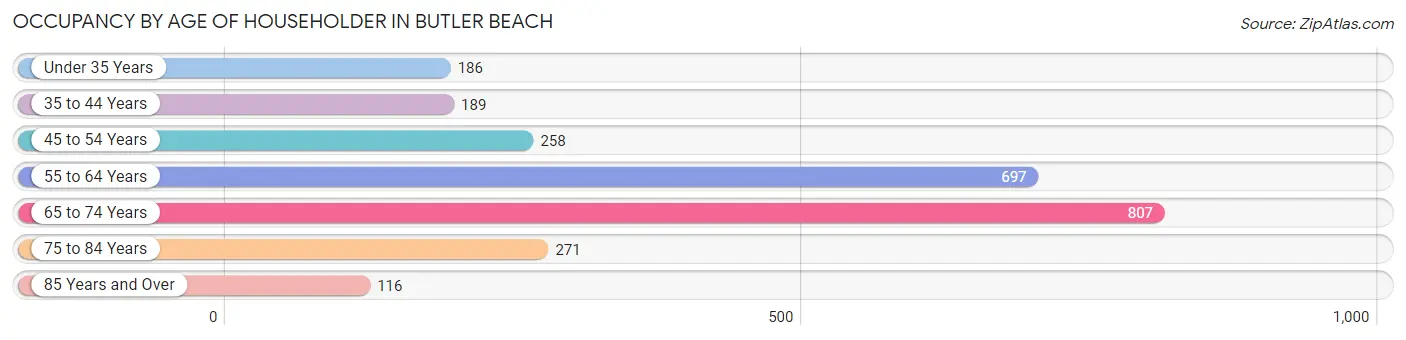
| Age Bracket | # Households | % Households |
| Under 35 Years | 186 | 7.4% |
| 35 to 44 Years | 189 | 7.5% |
| 45 to 54 Years | 258 | 10.2% |
| 55 to 64 Years | 697 | 27.6% |
| 65 to 74 Years | 807 | 32.0% |
| 75 to 84 Years | 271 | 10.7% |
| 85 Years and Over | 116 | 4.6% |
| Total | 2,524 | 100.0% |
Housing Finances in Butler Beach
Median Income by Occupancy in Butler Beach
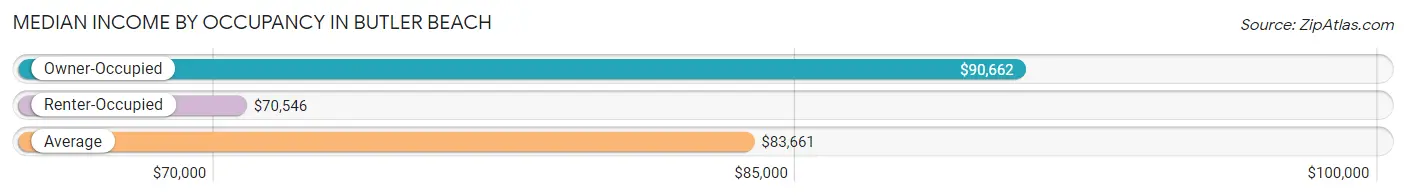
| Occupancy Type | # Households | Median Income |
| Owner-Occupied | 2,203 (87.3%) | $90,662 |
| Renter-Occupied | 321 (12.7%) | $70,546 |
| Average | 2,524 (100.0%) | $83,661 |
Occupancy by Householder Income Bracket in Butler Beach
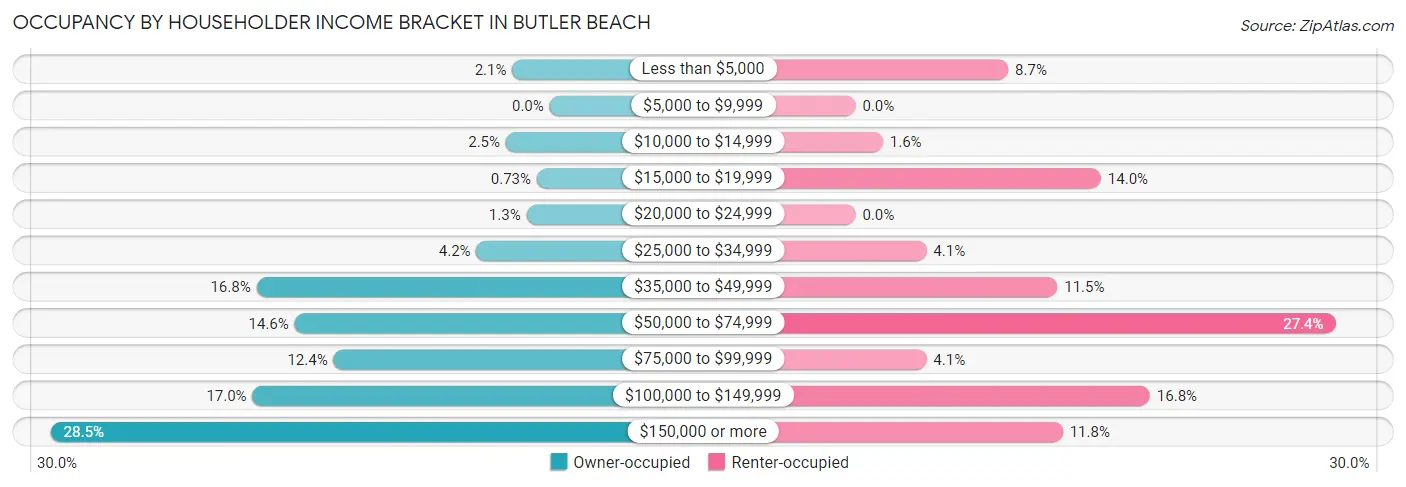
| Income Bracket | Owner-occupied | Renter-occupied |
| Less than $5,000 | 47 (2.1%) | 28 (8.7%) |
| $5,000 to $9,999 | 0 (0.0%) | 0 (0.0%) |
| $10,000 to $14,999 | 55 (2.5%) | 5 (1.6%) |
| $15,000 to $19,999 | 16 (0.7%) | 45 (14.0%) |
| $20,000 to $24,999 | 29 (1.3%) | 0 (0.0%) |
| $25,000 to $34,999 | 92 (4.2%) | 13 (4.1%) |
| $35,000 to $49,999 | 369 (16.8%) | 37 (11.5%) |
| $50,000 to $74,999 | 321 (14.6%) | 88 (27.4%) |
| $75,000 to $99,999 | 272 (12.3%) | 13 (4.1%) |
| $100,000 to $149,999 | 374 (17.0%) | 54 (16.8%) |
| $150,000 or more | 628 (28.5%) | 38 (11.8%) |
| Total | 2,203 (100.0%) | 321 (100.0%) |
Monthly Housing Cost Tiers in Butler Beach
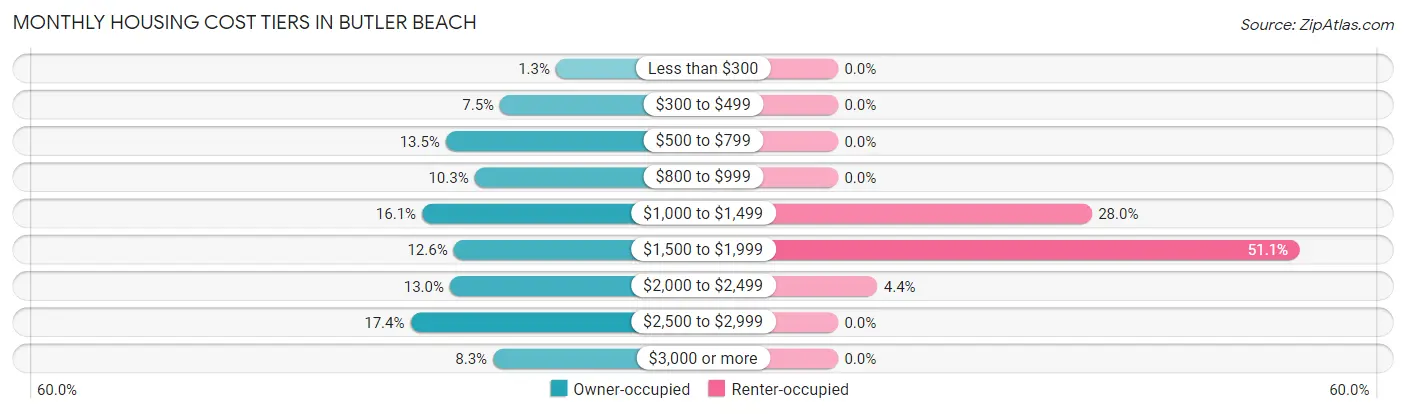
| Monthly Cost | Owner-occupied | Renter-occupied |
| Less than $300 | 29 (1.3%) | 0 (0.0%) |
| $300 to $499 | 165 (7.5%) | 0 (0.0%) |
| $500 to $799 | 297 (13.5%) | 0 (0.0%) |
| $800 to $999 | 227 (10.3%) | 0 (0.0%) |
| $1,000 to $1,499 | 355 (16.1%) | 90 (28.0%) |
| $1,500 to $1,999 | 278 (12.6%) | 164 (51.1%) |
| $2,000 to $2,499 | 287 (13.0%) | 14 (4.4%) |
| $2,500 to $2,999 | 383 (17.4%) | 0 (0.0%) |
| $3,000 or more | 182 (8.3%) | 0 (0.0%) |
| Total | 2,203 (100.0%) | 321 (100.0%) |
Physical Housing Characteristics in Butler Beach
Housing Structures in Butler Beach
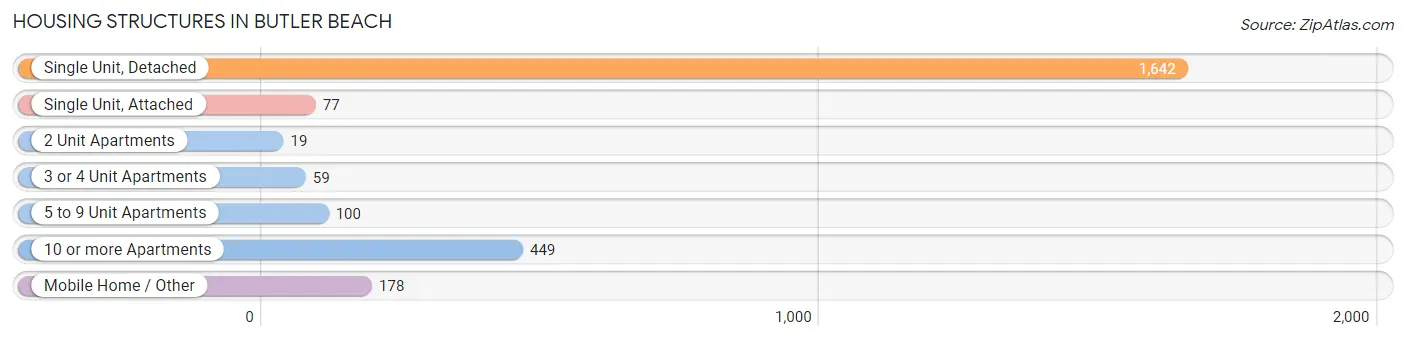
| Structure Type | # Housing Units | % Housing Units |
| Single Unit, Detached | 1,642 | 65.1% |
| Single Unit, Attached | 77 | 3.0% |
| 2 Unit Apartments | 19 | 0.7% |
| 3 or 4 Unit Apartments | 59 | 2.3% |
| 5 to 9 Unit Apartments | 100 | 4.0% |
| 10 or more Apartments | 449 | 17.8% |
| Mobile Home / Other | 178 | 7.0% |
| Total | 2,524 | 100.0% |
Housing Structures by Occupancy in Butler Beach
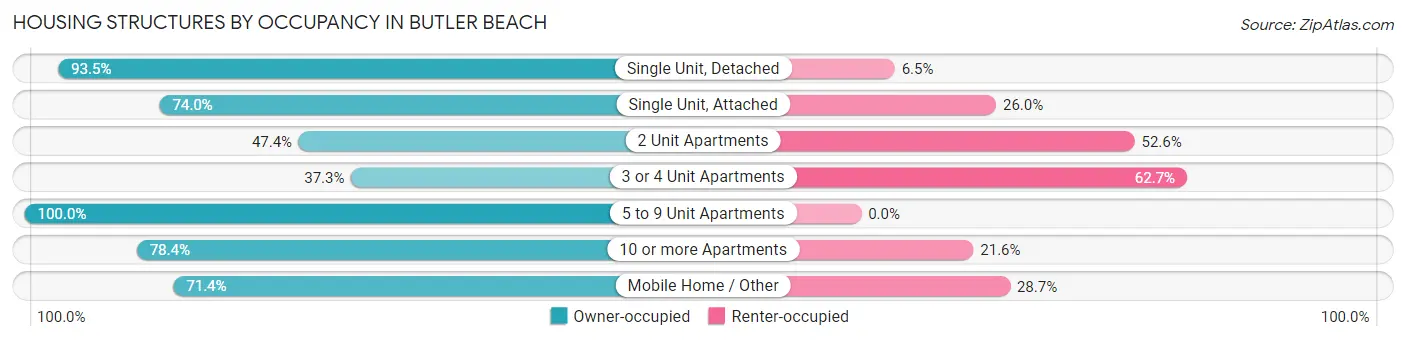
| Structure Type | Owner-occupied | Renter-occupied |
| Single Unit, Detached | 1,536 (93.5%) | 106 (6.5%) |
| Single Unit, Attached | 57 (74.0%) | 20 (26.0%) |
| 2 Unit Apartments | 9 (47.4%) | 10 (52.6%) |
| 3 or 4 Unit Apartments | 22 (37.3%) | 37 (62.7%) |
| 5 to 9 Unit Apartments | 100 (100.0%) | 0 (0.0%) |
| 10 or more Apartments | 352 (78.4%) | 97 (21.6%) |
| Mobile Home / Other | 127 (71.4%) | 51 (28.6%) |
| Total | 2,203 (87.3%) | 321 (12.7%) |
Housing Structures by Number of Rooms in Butler Beach
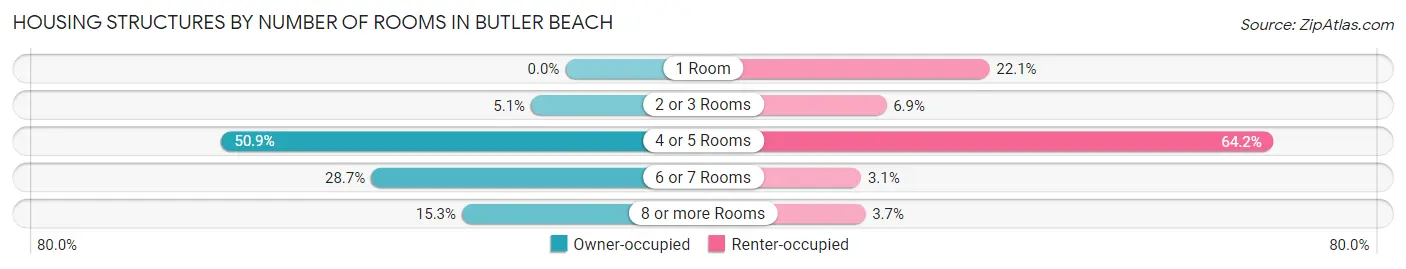
| Number of Rooms | Owner-occupied | Renter-occupied |
| 1 Room | 0 (0.0%) | 71 (22.1%) |
| 2 or 3 Rooms | 112 (5.1%) | 22 (6.9%) |
| 4 or 5 Rooms | 1,121 (50.9%) | 206 (64.2%) |
| 6 or 7 Rooms | 633 (28.7%) | 10 (3.1%) |
| 8 or more Rooms | 337 (15.3%) | 12 (3.7%) |
| Total | 2,203 (100.0%) | 321 (100.0%) |
Housing Structure by Heating Type in Butler Beach
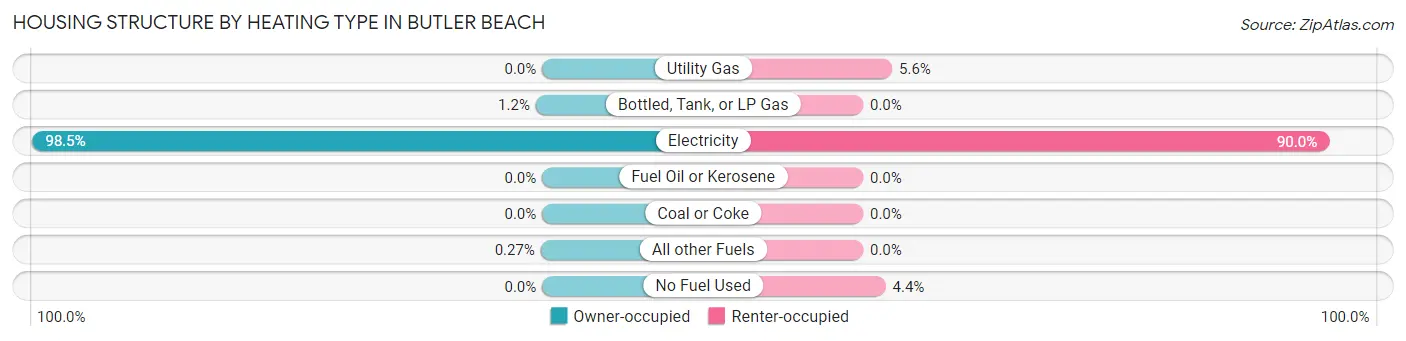
| Heating Type | Owner-occupied | Renter-occupied |
| Utility Gas | 0 (0.0%) | 18 (5.6%) |
| Bottled, Tank, or LP Gas | 27 (1.2%) | 0 (0.0%) |
| Electricity | 2,170 (98.5%) | 289 (90.0%) |
| Fuel Oil or Kerosene | 0 (0.0%) | 0 (0.0%) |
| Coal or Coke | 0 (0.0%) | 0 (0.0%) |
| All other Fuels | 6 (0.3%) | 0 (0.0%) |
| No Fuel Used | 0 (0.0%) | 14 (4.4%) |
| Total | 2,203 (100.0%) | 321 (100.0%) |
Household Vehicle Usage in Butler Beach
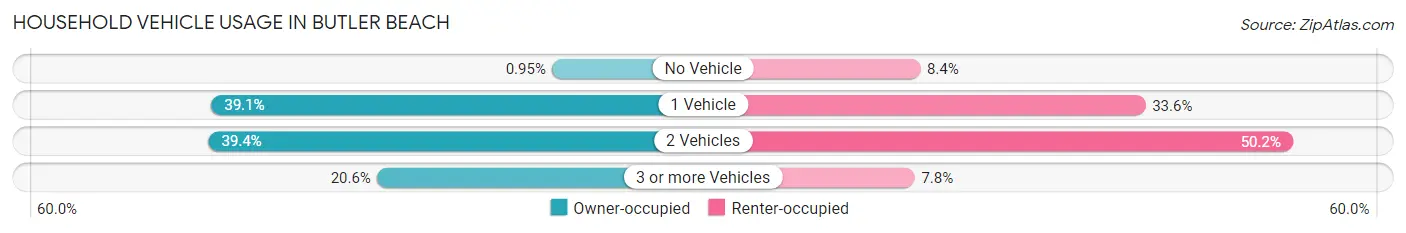
| Vehicles per Household | Owner-occupied | Renter-occupied |
| No Vehicle | 21 (0.9%) | 27 (8.4%) |
| 1 Vehicle | 861 (39.1%) | 108 (33.6%) |
| 2 Vehicles | 868 (39.4%) | 161 (50.2%) |
| 3 or more Vehicles | 453 (20.6%) | 25 (7.8%) |
| Total | 2,203 (100.0%) | 321 (100.0%) |
Real Estate & Mortgages in Butler Beach
Real Estate and Mortgage Overview in Butler Beach
| Characteristic | Without Mortgage | With Mortgage |
| Housing Units | 1,018 | 1,185 |
| Median Property Value | $421,800 | $459,300 |
| Median Household Income | $71,802 | $409 |
| Monthly Housing Costs | $815 | $182 |
| Real Estate Taxes | $3,153 | $0 |
Property Value by Mortgage Status in Butler Beach
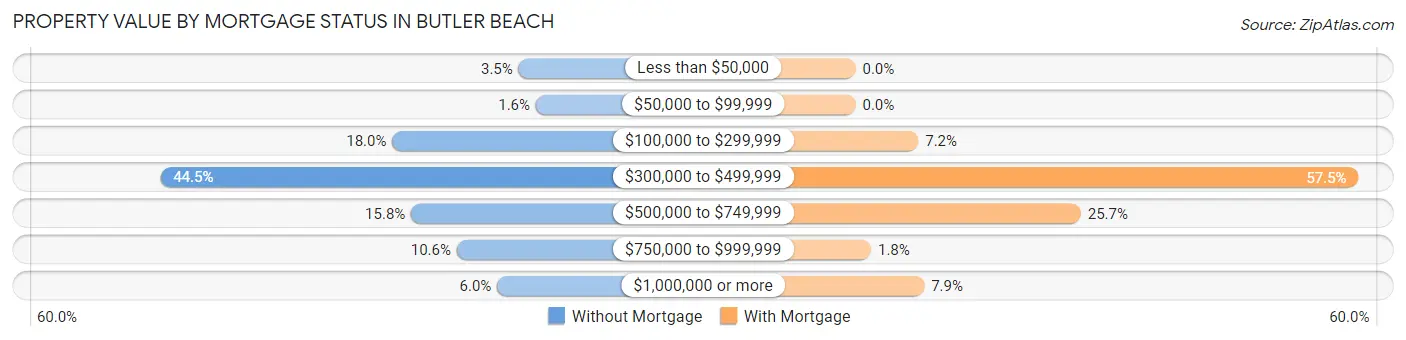
| Property Value | Without Mortgage | With Mortgage |
| Less than $50,000 | 36 (3.5%) | 0 (0.0%) |
| $50,000 to $99,999 | 16 (1.6%) | 0 (0.0%) |
| $100,000 to $299,999 | 183 (18.0%) | 85 (7.2%) |
| $300,000 to $499,999 | 453 (44.5%) | 681 (57.5%) |
| $500,000 to $749,999 | 161 (15.8%) | 305 (25.7%) |
| $750,000 to $999,999 | 108 (10.6%) | 21 (1.8%) |
| $1,000,000 or more | 61 (6.0%) | 93 (7.9%) |
| Total | 1,018 (100.0%) | 1,185 (100.0%) |
Household Income by Mortgage Status in Butler Beach
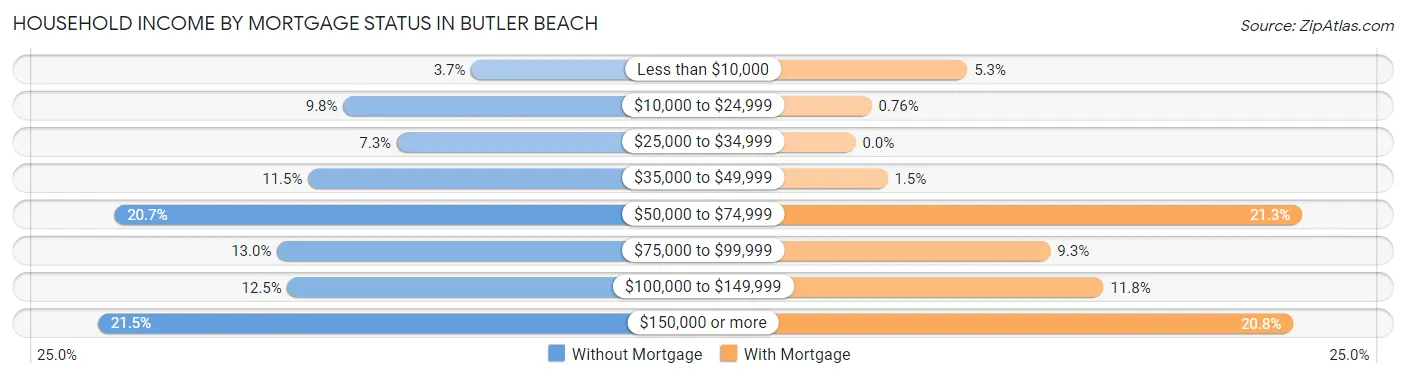
| Household Income | Without Mortgage | With Mortgage |
| Less than $10,000 | 38 (3.7%) | 63 (5.3%) |
| $10,000 to $24,999 | 100 (9.8%) | 9 (0.8%) |
| $25,000 to $34,999 | 74 (7.3%) | 0 (0.0%) |
| $35,000 to $49,999 | 117 (11.5%) | 18 (1.5%) |
| $50,000 to $74,999 | 211 (20.7%) | 252 (21.3%) |
| $75,000 to $99,999 | 132 (13.0%) | 110 (9.3%) |
| $100,000 to $149,999 | 127 (12.5%) | 140 (11.8%) |
| $150,000 or more | 219 (21.5%) | 247 (20.8%) |
| Total | 1,018 (100.0%) | 1,185 (100.0%) |
Property Value to Household Income Ratio in Butler Beach
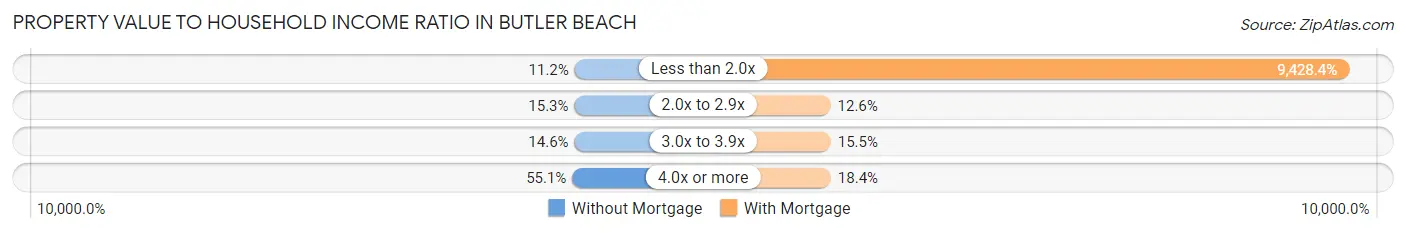
| Value-to-Income Ratio | Without Mortgage | With Mortgage |
| Less than 2.0x | 114 (11.2%) | 111,726 (9,428.4%) |
| 2.0x to 2.9x | 156 (15.3%) | 149 (12.6%) |
| 3.0x to 3.9x | 149 (14.6%) | 184 (15.5%) |
| 4.0x or more | 561 (55.1%) | 218 (18.4%) |
| Total | 1,018 (100.0%) | 1,185 (100.0%) |
Real Estate Taxes by Mortgage Status in Butler Beach
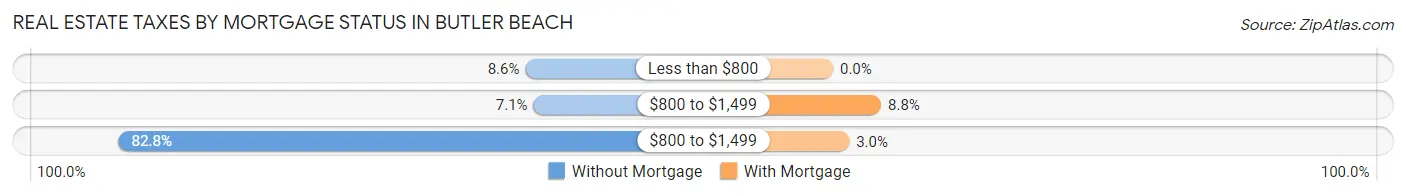
| Property Taxes | Without Mortgage | With Mortgage |
| Less than $800 | 87 (8.6%) | 0 (0.0%) |
| $800 to $1,499 | 72 (7.1%) | 104 (8.8%) |
| $800 to $1,499 | 843 (82.8%) | 35 (2.9%) |
| Total | 1,018 (100.0%) | 1,185 (100.0%) |
Health & Disability in Butler Beach
Health Insurance Coverage by Age in Butler Beach
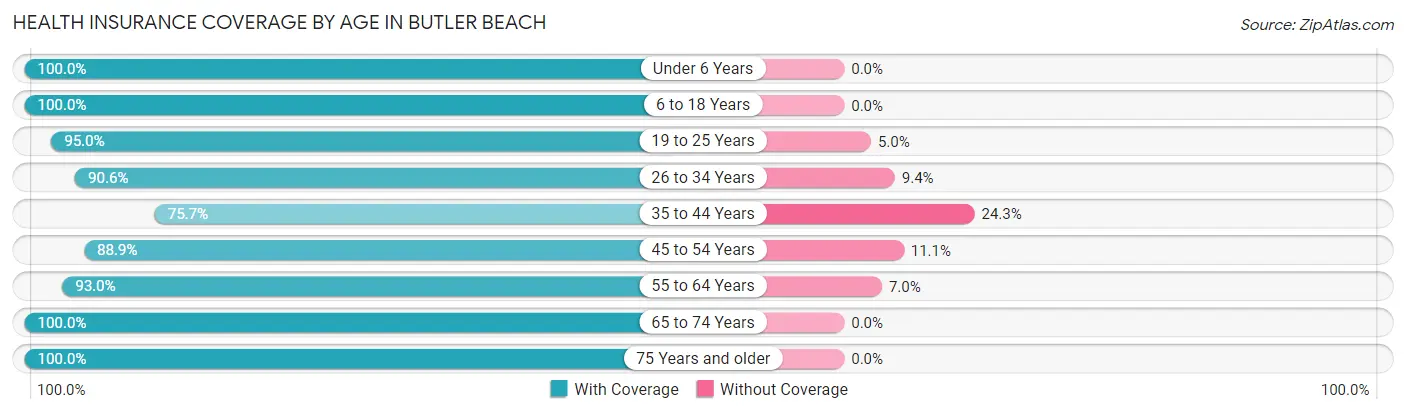
| Age Bracket | With Coverage | Without Coverage |
| Under 6 Years | 83 (100.0%) | 0 (0.0%) |
| 6 to 18 Years | 210 (100.0%) | 0 (0.0%) |
| 19 to 25 Years | 267 (95.0%) | 14 (5.0%) |
| 26 to 34 Years | 192 (90.6%) | 20 (9.4%) |
| 35 to 44 Years | 293 (75.7%) | 94 (24.3%) |
| 45 to 54 Years | 457 (88.9%) | 57 (11.1%) |
| 55 to 64 Years | 1,137 (93.0%) | 86 (7.0%) |
| 65 to 74 Years | 1,303 (100.0%) | 0 (0.0%) |
| 75 Years and older | 618 (100.0%) | 0 (0.0%) |
| Total | 4,560 (94.4%) | 271 (5.6%) |
Health Insurance Coverage by Citizenship Status in Butler Beach

| Citizenship Status | With Coverage | Without Coverage |
| Native Born | 83 (100.0%) | 0 (0.0%) |
| Foreign Born, Citizen | 210 (100.0%) | 0 (0.0%) |
| Foreign Born, not a Citizen | 267 (95.0%) | 14 (5.0%) |
Health Insurance Coverage by Household Income in Butler Beach
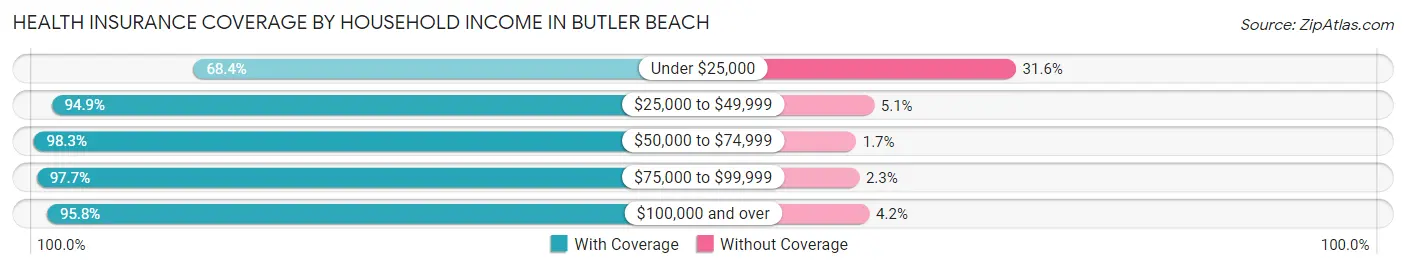
| Household Income | With Coverage | Without Coverage |
| Under $25,000 | 229 (68.4%) | 106 (31.6%) |
| $25,000 to $49,999 | 656 (94.9%) | 35 (5.1%) |
| $50,000 to $74,999 | 760 (98.3%) | 13 (1.7%) |
| $75,000 to $99,999 | 515 (97.7%) | 12 (2.3%) |
| $100,000 and over | 2,400 (95.8%) | 105 (4.2%) |
Public vs Private Health Insurance Coverage by Age in Butler Beach
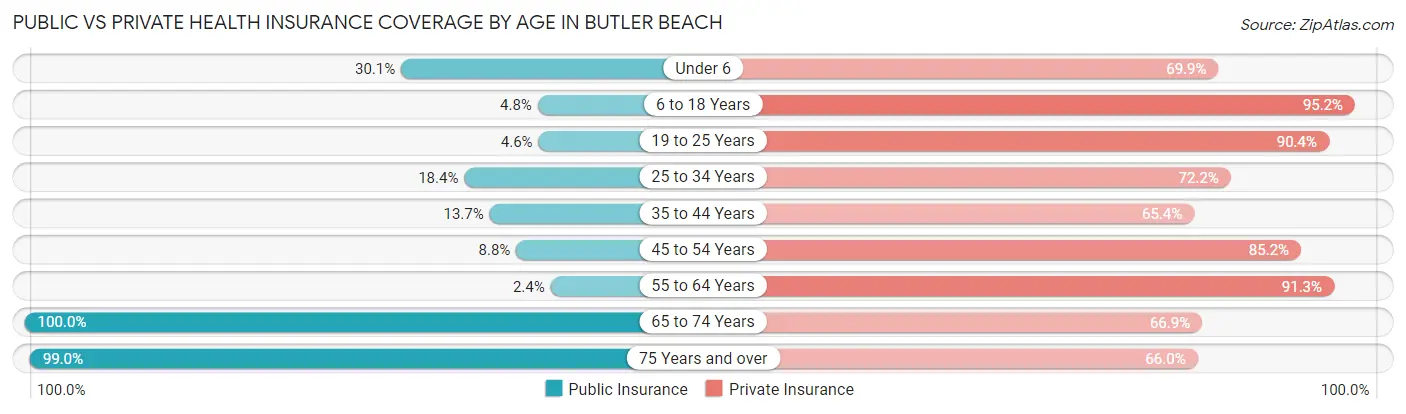
| Age Bracket | Public Insurance | Private Insurance |
| Under 6 | 25 (30.1%) | 58 (69.9%) |
| 6 to 18 Years | 10 (4.8%) | 200 (95.2%) |
| 19 to 25 Years | 13 (4.6%) | 254 (90.4%) |
| 25 to 34 Years | 39 (18.4%) | 153 (72.2%) |
| 35 to 44 Years | 53 (13.7%) | 253 (65.4%) |
| 45 to 54 Years | 45 (8.7%) | 438 (85.2%) |
| 55 to 64 Years | 29 (2.4%) | 1,117 (91.3%) |
| 65 to 74 Years | 1,303 (100.0%) | 871 (66.8%) |
| 75 Years and over | 612 (99.0%) | 408 (66.0%) |
| Total | 2,129 (44.1%) | 3,752 (77.7%) |
Disability Status by Sex by Age in Butler Beach
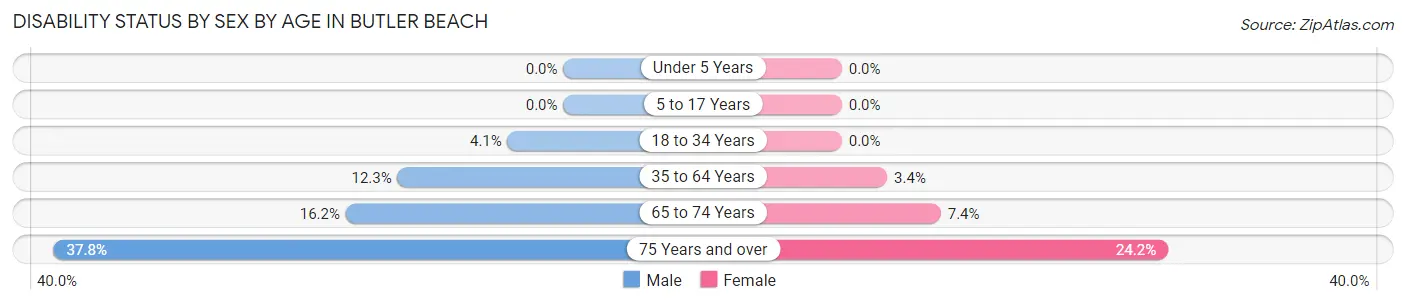
| Age Bracket | Male | Female |
| Under 5 Years | 0 (0.0%) | 0 (0.0%) |
| 5 to 17 Years | 0 (0.0%) | 0 (0.0%) |
| 18 to 34 Years | 13 (4.1%) | 0 (0.0%) |
| 35 to 64 Years | 119 (12.3%) | 39 (3.4%) |
| 65 to 74 Years | 105 (16.2%) | 48 (7.3%) |
| 75 Years and over | 112 (37.8%) | 78 (24.2%) |
Disability Class by Sex by Age in Butler Beach
Disability Class: Hearing Difficulty
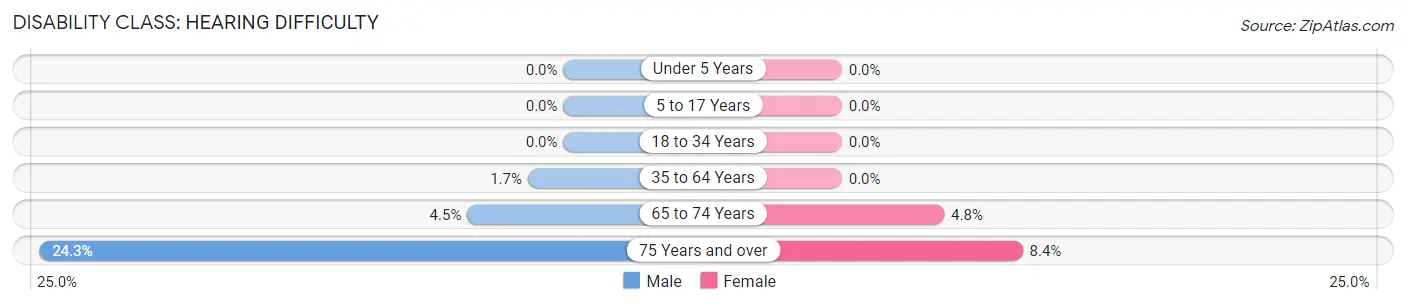
| Age Bracket | Male | Female |
| Under 5 Years | 0 (0.0%) | 0 (0.0%) |
| 5 to 17 Years | 0 (0.0%) | 0 (0.0%) |
| 18 to 34 Years | 0 (0.0%) | 0 (0.0%) |
| 35 to 64 Years | 16 (1.7%) | 0 (0.0%) |
| 65 to 74 Years | 29 (4.5%) | 31 (4.8%) |
| 75 Years and over | 72 (24.3%) | 27 (8.4%) |
Disability Class: Vision Difficulty
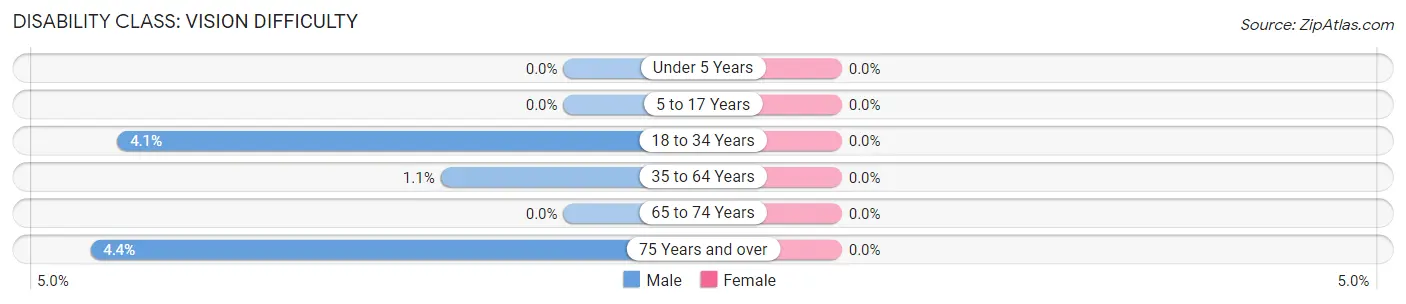
| Age Bracket | Male | Female |
| Under 5 Years | 0 (0.0%) | 0 (0.0%) |
| 5 to 17 Years | 0 (0.0%) | 0 (0.0%) |
| 18 to 34 Years | 13 (4.1%) | 0 (0.0%) |
| 35 to 64 Years | 11 (1.1%) | 0 (0.0%) |
| 65 to 74 Years | 0 (0.0%) | 0 (0.0%) |
| 75 Years and over | 13 (4.4%) | 0 (0.0%) |
Disability Class: Cognitive Difficulty
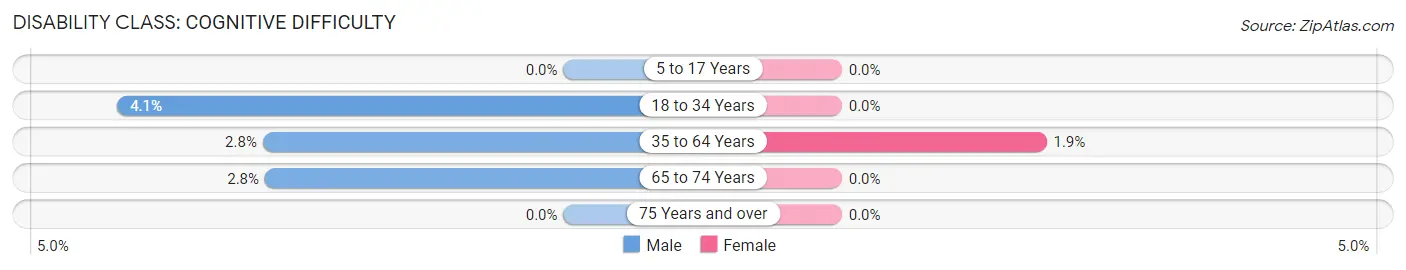
| Age Bracket | Male | Female |
| 5 to 17 Years | 0 (0.0%) | 0 (0.0%) |
| 18 to 34 Years | 13 (4.1%) | 0 (0.0%) |
| 35 to 64 Years | 27 (2.8%) | 22 (1.9%) |
| 65 to 74 Years | 18 (2.8%) | 0 (0.0%) |
| 75 Years and over | 0 (0.0%) | 0 (0.0%) |
Disability Class: Ambulatory Difficulty
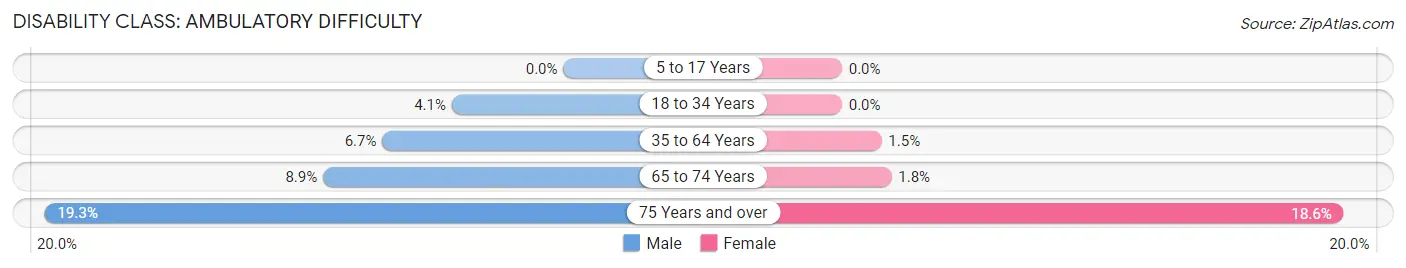
| Age Bracket | Male | Female |
| 5 to 17 Years | 0 (0.0%) | 0 (0.0%) |
| 18 to 34 Years | 13 (4.1%) | 0 (0.0%) |
| 35 to 64 Years | 65 (6.7%) | 17 (1.5%) |
| 65 to 74 Years | 58 (8.9%) | 12 (1.8%) |
| 75 Years and over | 57 (19.3%) | 60 (18.6%) |
Disability Class: Self-Care Difficulty
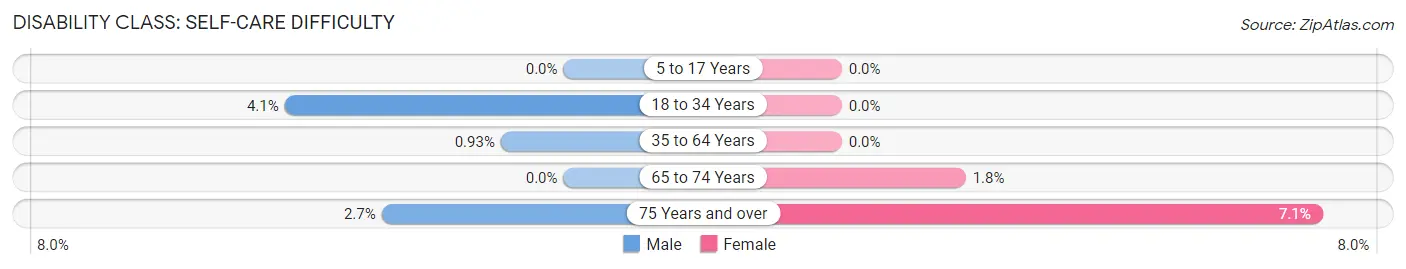
| Age Bracket | Male | Female |
| 5 to 17 Years | 0 (0.0%) | 0 (0.0%) |
| 18 to 34 Years | 13 (4.1%) | 0 (0.0%) |
| 35 to 64 Years | 9 (0.9%) | 0 (0.0%) |
| 65 to 74 Years | 0 (0.0%) | 12 (1.8%) |
| 75 Years and over | 8 (2.7%) | 23 (7.1%) |
Technology Access in Butler Beach
Computing Device Access in Butler Beach
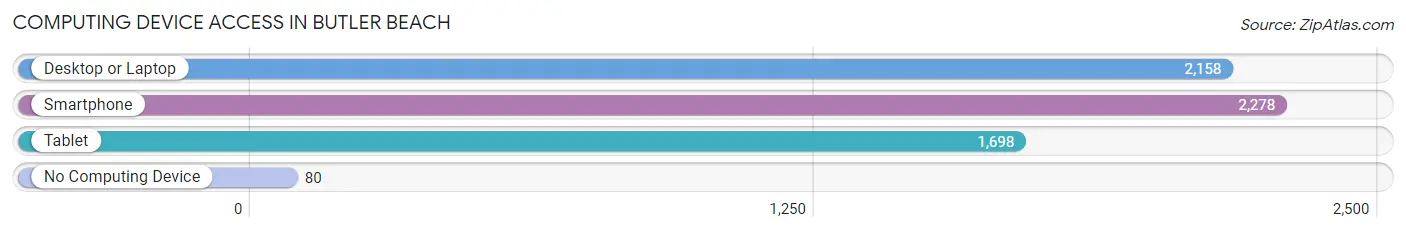
| Device Type | # Households | % Households |
| Desktop or Laptop | 2,158 | 85.5% |
| Smartphone | 2,278 | 90.2% |
| Tablet | 1,698 | 67.3% |
| No Computing Device | 80 | 3.2% |
| Total | 2,524 | 100.0% |
Internet Access in Butler Beach
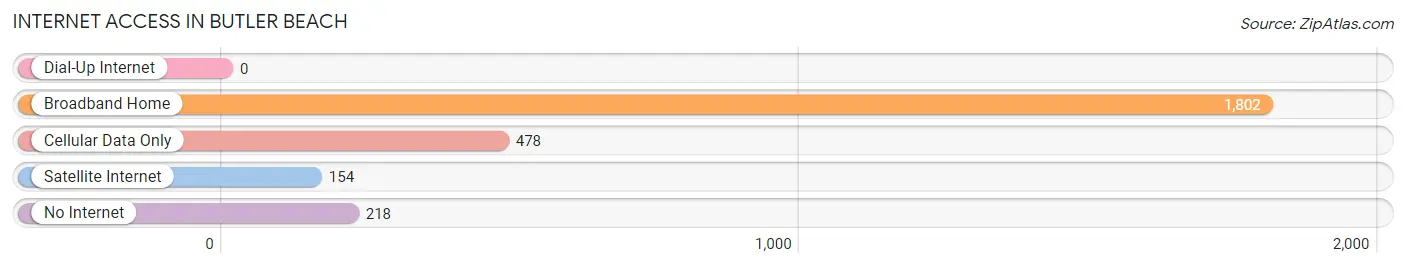
| Internet Type | # Households | % Households |
| Dial-Up Internet | 0 | 0.0% |
| Broadband Home | 1,802 | 71.4% |
| Cellular Data Only | 478 | 18.9% |
| Satellite Internet | 154 | 6.1% |
| No Internet | 218 | 8.6% |
| Total | 2,524 | 100.0% |
Butler Beach Summary
Butler Beach is a small beach community located in St. Johns County, Florida. It is situated on the Atlantic Ocean, just south of St. Augustine Beach and north of Vilano Beach. The community is part of the St. Augustine metropolitan area and is home to approximately 1,000 people.
History
Butler Beach was originally inhabited by the Timucua Indians, who lived in the area for centuries before the arrival of Europeans. The first Europeans to settle in the area were Spanish explorers, who arrived in the late 1500s. The area was part of the Spanish colony of Florida until 1821, when it became part of the United States.
In the late 1800s, the area was developed as a resort community. The first hotel was built in 1887, and the area quickly became a popular destination for tourists. The area was named after the Butler family, who owned much of the land in the area.
In the early 1900s, the area was home to a thriving fishing industry. The area was also home to a number of resorts, including the Butler Beach Hotel, which was built in 1912. The hotel was destroyed by a hurricane in 1921, but was rebuilt in 1924.
In the 1950s, the area began to decline as a tourist destination. The area was hit hard by the Great Depression and World War II, and many of the resorts and businesses closed. In the 1960s, the area began to experience a resurgence as a residential community. The area was incorporated as a town in 1965, and the population has grown steadily since then.
Geography
Butler Beach is located in St. Johns County, Florida, on the Atlantic Ocean. The community is situated on a barrier island, which is separated from the mainland by the Intracoastal Waterway. The area is bordered by Vilano Beach to the south and St. Augustine Beach to the north.
The area is characterized by its white sand beaches and lush vegetation. The area is home to a variety of wildlife, including sea turtles, dolphins, and a variety of birds. The area is also home to a number of parks and nature preserves, including the Anastasia State Park and the Guana Tolomato Matanzas National Estuarine Research Reserve.
Economy
The economy of Butler Beach is largely based on tourism. The area is home to a number of hotels, restaurants, and other businesses catering to tourists. The area is also home to a number of fishing charters, which offer deep sea fishing trips.
The area is also home to a number of small businesses, including retail stores, art galleries, and other services. The area is also home to a number of real estate companies, which specialize in beachfront properties.
Demographics
As of the 2010 census, the population of Butler Beach was 1,000. The population is largely white (90.2%), with a small percentage of African Americans (3.2%) and Hispanics (2.2%). The median household income is $50,000, and the median home value is $250,000. The area is largely residential, with a small number of businesses.
Common Questions
What is Per Capita Income in Butler Beach?
Per Capita income in Butler Beach is $58,790.
What is the Median Family Income in Butler Beach?
Median Family Income in Butler Beach is $115,368.
What is the Median Household income in Butler Beach?
Median Household Income in Butler Beach is $83,661.
What is Income or Wage Gap in Butler Beach?
Income or Wage Gap in Butler Beach is 35.3%.
Women in Butler Beach earn 64.7 cents for every dollar earned by a man.
What is Inequality or Gini Index in Butler Beach?
Inequality or Gini Index in Butler Beach is 0.42.
What is the Total Population of Butler Beach?
Total Population of Butler Beach is 4,831.
What is the Total Male Population of Butler Beach?
Total Male Population of Butler Beach is 2,296.
What is the Total Female Population of Butler Beach?
Total Female Population of Butler Beach is 2,535.
What is the Ratio of Males per 100 Females in Butler Beach?
There are 90.57 Males per 100 Females in Butler Beach.
What is the Ratio of Females per 100 Males in Butler Beach?
There are 110.41 Females per 100 Males in Butler Beach.
What is the Median Population Age in Butler Beach?
Median Population Age in Butler Beach is 60.7 Years.
What is the Average Family Size in Butler Beach
Average Family Size in Butler Beach is 2.4 People.
What is the Average Household Size in Butler Beach
Average Household Size in Butler Beach is 1.9 People.
How Large is the Labor Force in Butler Beach?
There are 2,290 People in the Labor Forcein in Butler Beach.
What is the Percentage of People in the Labor Force in Butler Beach?
49.8% of People are in the Labor Force in Butler Beach.
What is the Unemployment Rate in Butler Beach?
Unemployment Rate in Butler Beach is 6.3%.