Flagler Estates, FL Map & Demographics
Flagler Estates Map
Flagler Estates Overview
$29,058
PER CAPITA INCOME
$71,135
AVG FAMILY INCOME
$59,875
AVG HOUSEHOLD INCOME
0.44
INEQUALITY / GINI INDEX
3,608
TOTAL POPULATION
1,874
MALE POPULATION
1,734
FEMALE POPULATION
108.07
MALES / 100 FEMALES
92.53
FEMALES / 100 MALES
36.1
MEDIAN AGE
3.0
AVG FAMILY SIZE
2.5
AVG HOUSEHOLD SIZE
1,671
LABOR FORCE [ PEOPLE ]
62.3%
PERCENT IN LABOR FORCE
6.6%
UNEMPLOYMENT RATE
Income in Flagler Estates
Income Overview in Flagler Estates
Per Capita Income in Flagler Estates is $29,058, while median incomes of families and households are $71,135 and $59,875 respectively.
| Characteristic | Number | Measure |
| Per Capita Income | 3,608 | $29,058 |
| Median Family Income | 951 | $71,135 |
| Mean Family Income | 951 | $84,729 |
| Median Household Income | 1,439 | $59,875 |
| Mean Household Income | 1,439 | $74,563 |
| Income Deficit | 951 | $0 |
| Wage / Income Gap (%) | 3,608 | 0.00% |
| Wage / Income Gap ($) | 3,608 | 100.00¢ per $1 |
| Gini / Inequality Index | 3,608 | 0.44 |
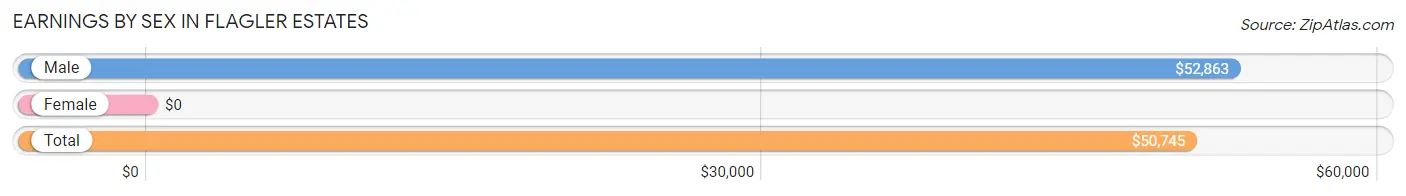
Earnings by Sex in Flagler Estates
| Sex | Number | Average Earnings |
| Male | 1,031 (59.6%) | $52,863 |
| Female | 700 (40.4%) | $0 |
| Total | 1,731 (100.0%) | $50,745 |
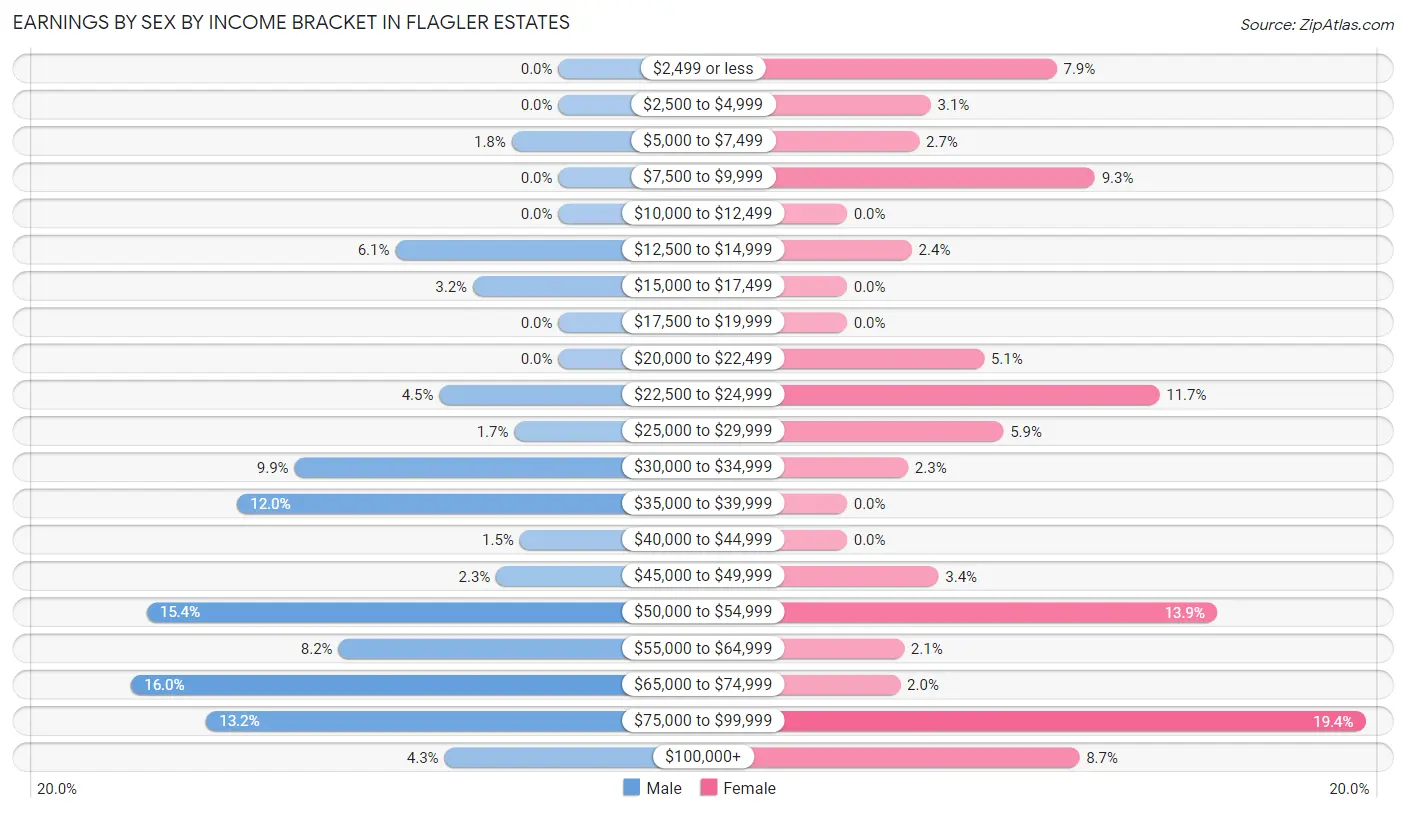
Earnings by Sex by Income Bracket in Flagler Estates
The most common earnings brackets in Flagler Estates are $65,000 to $74,999 for men (165 | 16.0%) and $75,000 to $99,999 for women (136 | 19.4%).
| Income | Male | Female |
| $2,499 or less | 0 (0.0%) | 55 (7.9%) |
| $2,500 to $4,999 | 0 (0.0%) | 22 (3.1%) |
| $5,000 to $7,499 | 18 (1.8%) | 19 (2.7%) |
| $7,500 to $9,999 | 0 (0.0%) | 65 (9.3%) |
| $10,000 to $12,499 | 0 (0.0%) | 0 (0.0%) |
| $12,500 to $14,999 | 63 (6.1%) | 17 (2.4%) |
| $15,000 to $17,499 | 33 (3.2%) | 0 (0.0%) |
| $17,500 to $19,999 | 0 (0.0%) | 0 (0.0%) |
| $20,000 to $22,499 | 0 (0.0%) | 36 (5.1%) |
| $22,500 to $24,999 | 46 (4.5%) | 82 (11.7%) |
| $25,000 to $29,999 | 17 (1.7%) | 41 (5.9%) |
| $30,000 to $34,999 | 102 (9.9%) | 16 (2.3%) |
| $35,000 to $39,999 | 124 (12.0%) | 0 (0.0%) |
| $40,000 to $44,999 | 15 (1.5%) | 0 (0.0%) |
| $45,000 to $49,999 | 24 (2.3%) | 24 (3.4%) |
| $50,000 to $54,999 | 159 (15.4%) | 97 (13.9%) |
| $55,000 to $64,999 | 85 (8.2%) | 15 (2.1%) |
| $65,000 to $74,999 | 165 (16.0%) | 14 (2.0%) |
| $75,000 to $99,999 | 136 (13.2%) | 136 (19.4%) |
| $100,000+ | 44 (4.3%) | 61 (8.7%) |
| Total | 1,031 (100.0%) | 700 (100.0%) |
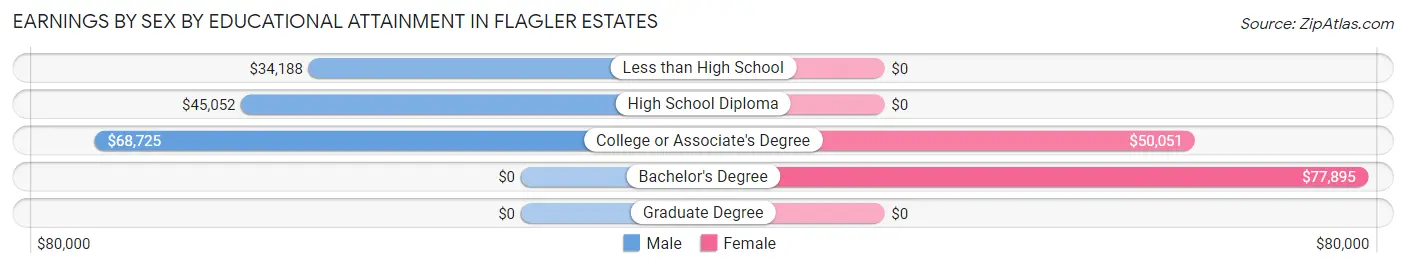
Earnings by Sex by Educational Attainment in Flagler Estates
Average earnings in Flagler Estates are $52,863 for men and $50,116 for women, a difference of 5.2%. Men with an educational attainment of college or associate's degree enjoy the highest average annual earnings of $68,725, while those with less than high school education earn the least with $34,188. Women with an educational attainment of bachelor's degree earn the most with the average annual earnings of $77,895, while those with college or associate's degree education have the smallest earnings of $50,051.
| Educational Attainment | Male Income | Female Income |
| Less than High School | $34,188 | $0 |
| High School Diploma | $45,052 | $0 |
| College or Associate's Degree | $68,725 | $50,051 |
| Bachelor's Degree | - | - |
| Graduate Degree | - | - |
| Total | $52,863 | $50,116 |
Family Income in Flagler Estates
Family Income Brackets in Flagler Estates
According to the Flagler Estates family income data, there are 256 families falling into the $50,000 to $74,999 income range, which is the most common income bracket and makes up 26.9% of all families. Conversely, the $10,000 to $14,999 income bracket is the least frequent group with only 15 families (1.6%) belonging to this category.
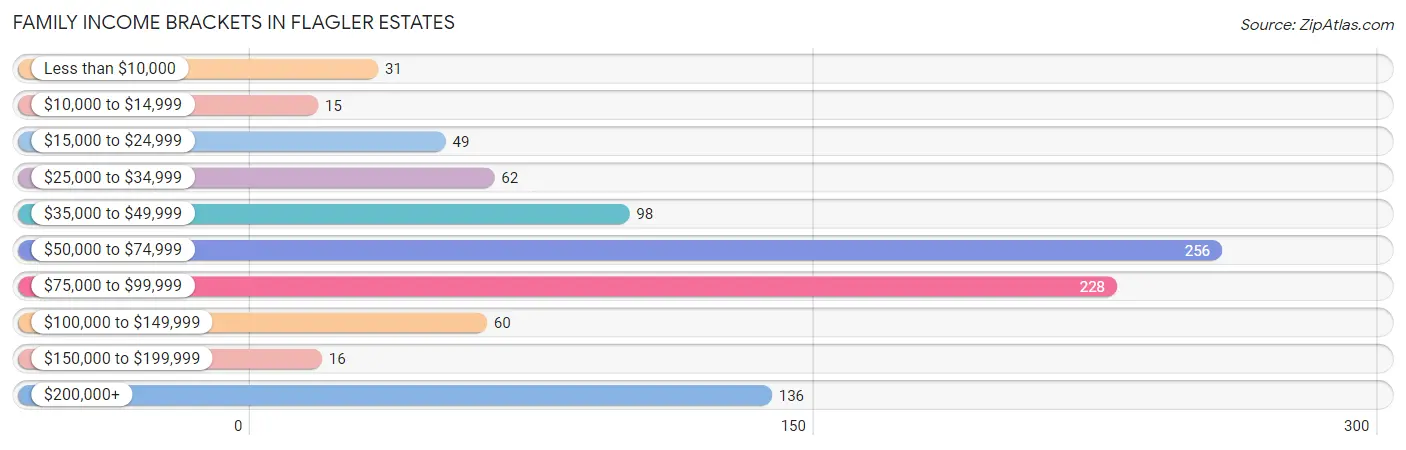
| Income Bracket | # Families | % Families |
| Less than $10,000 | 31 | 3.3% |
| $10,000 to $14,999 | 15 | 1.6% |
| $15,000 to $24,999 | 49 | 5.2% |
| $25,000 to $34,999 | 62 | 6.5% |
| $35,000 to $49,999 | 98 | 10.3% |
| $50,000 to $74,999 | 256 | 26.9% |
| $75,000 to $99,999 | 228 | 24.0% |
| $100,000 to $149,999 | 60 | 6.3% |
| $150,000 to $199,999 | 16 | 1.7% |
| $200,000+ | 136 | 14.3% |
Family Income by Famaliy Size in Flagler Estates
5-person families (110 | 11.6%) account for the highest median family income in Flagler Estates with $71,538 per family, while 2-person families (387 | 40.7%) have the highest median income of $31,530 per family member.
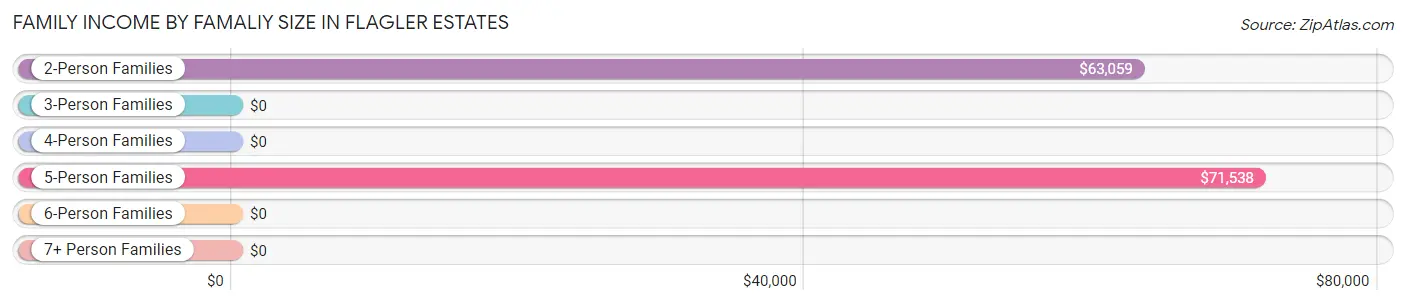
| Income Bracket | # Families | Median Income |
| 2-Person Families | 387 (40.7%) | $63,059 |
| 3-Person Families | 304 (32.0%) | $0 |
| 4-Person Families | 136 (14.3%) | $0 |
| 5-Person Families | 110 (11.6%) | $71,538 |
| 6-Person Families | 14 (1.5%) | $0 |
| 7+ Person Families | 0 (0.0%) | $0 |
| Total | 951 (100.0%) | $71,135 |
Family Income by Number of Earners in Flagler Estates
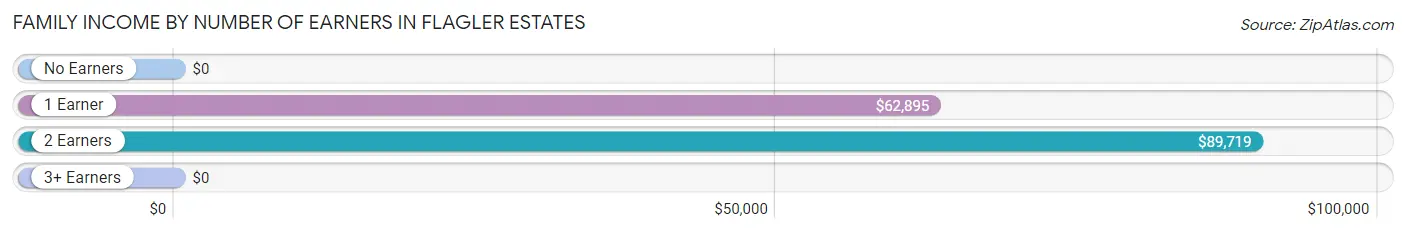
| Number of Earners | # Families | Median Income |
| No Earners | 153 (16.1%) | $0 |
| 1 Earner | 224 (23.5%) | $62,895 |
| 2 Earners | 544 (57.2%) | $89,719 |
| 3+ Earners | 30 (3.2%) | $0 |
| Total | 951 (100.0%) | $71,135 |
Household Income in Flagler Estates
Household Income Brackets in Flagler Estates
With 327 households falling in the category, the $75,000 to $99,999 income range is the most frequent in Flagler Estates, accounting for 22.7% of all households. In contrast, only 16 households (1.1%) fall into the $150,000 to $199,999 income bracket, making it the least populous group.
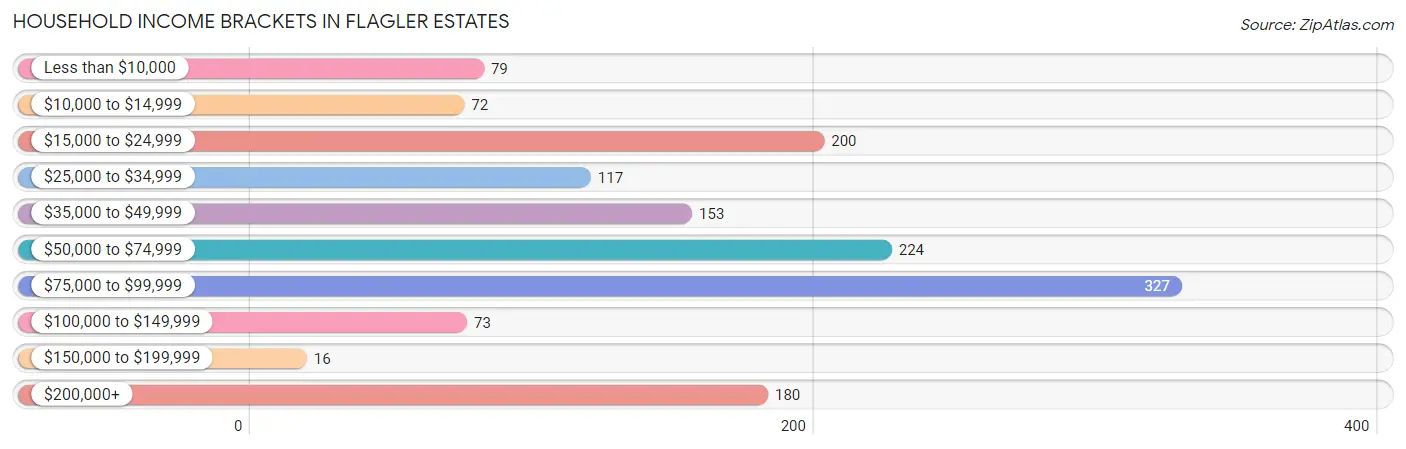
| Income Bracket | # Households | % Households |
| Less than $10,000 | 79 | 5.5% |
| $10,000 to $14,999 | 72 | 5.0% |
| $15,000 to $24,999 | 200 | 13.9% |
| $25,000 to $34,999 | 117 | 8.1% |
| $35,000 to $49,999 | 153 | 10.6% |
| $50,000 to $74,999 | 224 | 15.6% |
| $75,000 to $99,999 | 327 | 22.7% |
| $100,000 to $149,999 | 73 | 5.1% |
| $150,000 to $199,999 | 16 | 1.1% |
| $200,000+ | 180 | 12.5% |
Household Income by Householder Age in Flagler Estates
The median household income in Flagler Estates is $59,875, with the highest median household income of $71,577 found in the 25 to 44 years age bracket for the primary householder. A total of 686 households (47.7%) fall into this category. Meanwhile, the 15 to 24 years age bracket for the primary householder has the lowest median household income of $0, with 22 households (1.5%) in this group.
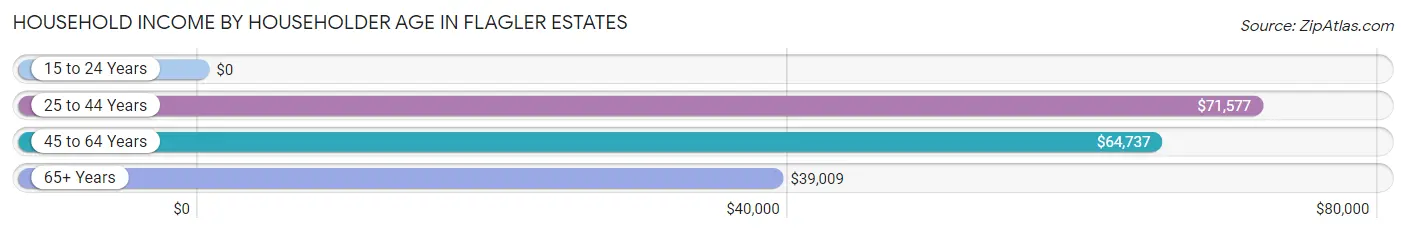
| Income Bracket | # Households | Median Income |
| 15 to 24 Years | 22 (1.5%) | $0 |
| 25 to 44 Years | 686 (47.7%) | $71,577 |
| 45 to 64 Years | 544 (37.8%) | $64,737 |
| 65+ Years | 187 (13.0%) | $39,009 |
| Total | 1,439 (100.0%) | $59,875 |
Poverty in Flagler Estates
Income Below Poverty by Sex and Age in Flagler Estates
With 11.0% poverty level for males and 21.4% for females among the residents of Flagler Estates, 16 and 17 year old males and 55 to 64 year old females are the most vulnerable to poverty, with 55 males (63.9%) and 76 females (42.5%) in their respective age groups living below the poverty level.
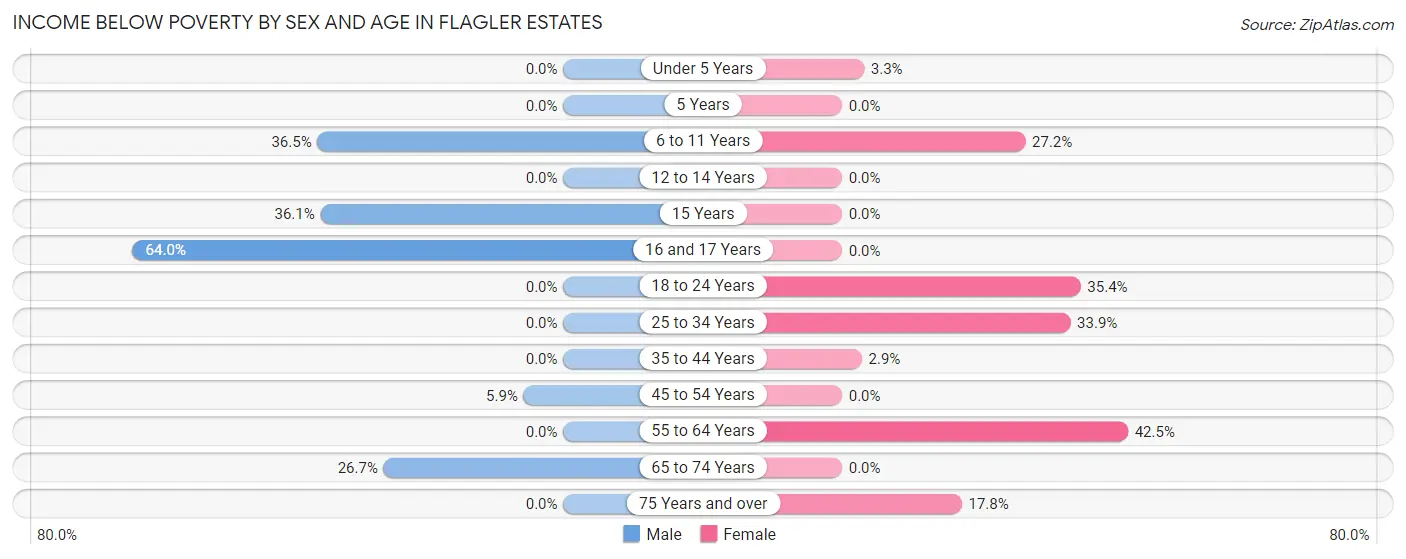
| Age Bracket | Male | Female |
| Under 5 Years | 0 (0.0%) | 2 (3.3%) |
| 5 Years | 0 (0.0%) | 0 (0.0%) |
| 6 to 11 Years | 69 (36.5%) | 89 (27.2%) |
| 12 to 14 Years | 0 (0.0%) | 0 (0.0%) |
| 15 Years | 31 (36.0%) | 0 (0.0%) |
| 16 and 17 Years | 55 (63.9%) | 0 (0.0%) |
| 18 to 24 Years | 0 (0.0%) | 45 (35.4%) |
| 25 to 34 Years | 0 (0.0%) | 137 (33.9%) |
| 35 to 44 Years | 0 (0.0%) | 7 (2.9%) |
| 45 to 54 Years | 15 (5.9%) | 0 (0.0%) |
| 55 to 64 Years | 0 (0.0%) | 76 (42.5%) |
| 65 to 74 Years | 36 (26.7%) | 0 (0.0%) |
| 75 Years and over | 0 (0.0%) | 16 (17.8%) |
| Total | 206 (11.0%) | 372 (21.4%) |
Income Above Poverty by Sex and Age in Flagler Estates
According to the poverty statistics in Flagler Estates, males aged 5 years and females aged 5 years are the age groups that are most secure financially, with 100.0% of males and 100.0% of females in these age groups living above the poverty line.
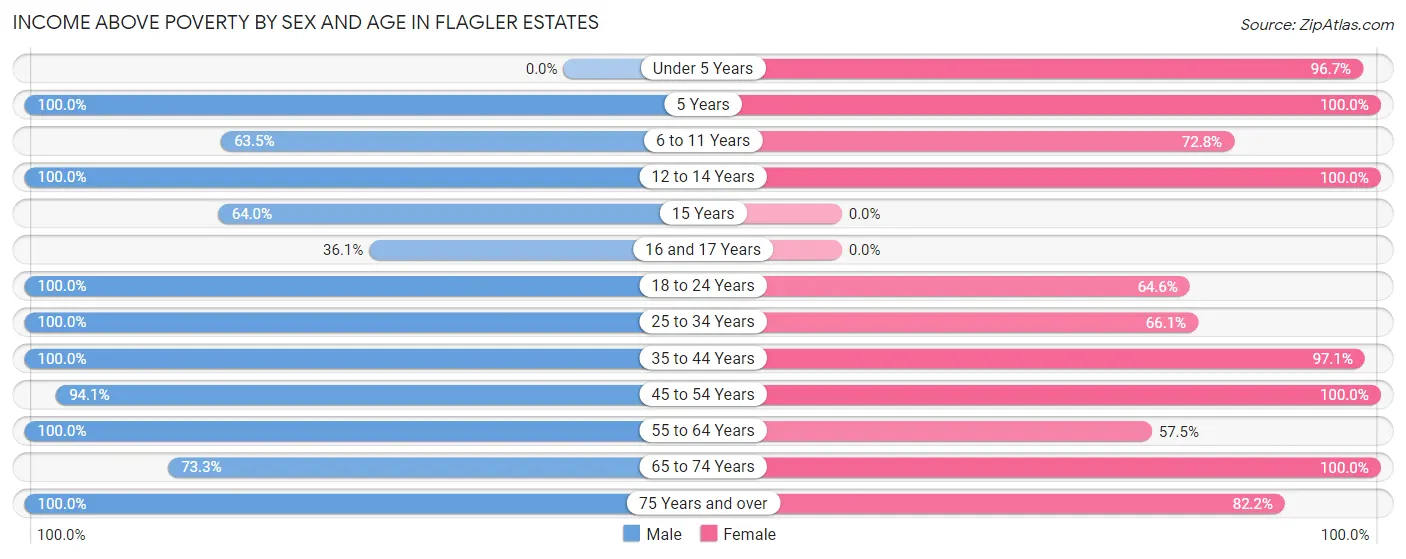
| Age Bracket | Male | Female |
| Under 5 Years | 0 (0.0%) | 59 (96.7%) |
| 5 Years | 63 (100.0%) | 14 (100.0%) |
| 6 to 11 Years | 120 (63.5%) | 238 (72.8%) |
| 12 to 14 Years | 177 (100.0%) | 9 (100.0%) |
| 15 Years | 55 (63.9%) | 0 (0.0%) |
| 16 and 17 Years | 31 (36.0%) | 0 (0.0%) |
| 18 to 24 Years | 18 (100.0%) | 82 (64.6%) |
| 25 to 34 Years | 231 (100.0%) | 267 (66.1%) |
| 35 to 44 Years | 329 (100.0%) | 231 (97.1%) |
| 45 to 54 Years | 240 (94.1%) | 178 (100.0%) |
| 55 to 64 Years | 278 (100.0%) | 103 (57.5%) |
| 65 to 74 Years | 99 (73.3%) | 107 (100.0%) |
| 75 Years and over | 27 (100.0%) | 74 (82.2%) |
| Total | 1,668 (89.0%) | 1,362 (78.5%) |
Income Below Poverty Among Married-Couple Families in Flagler Estates
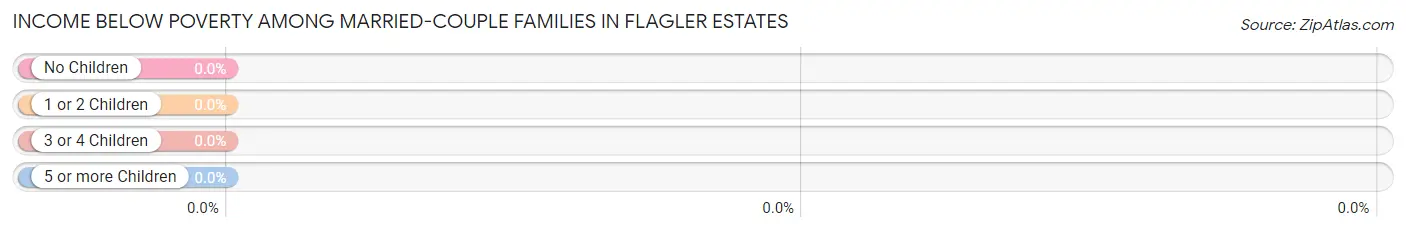
| Children | Above Poverty | Below Poverty |
| No Children | 297 (100.0%) | 0 (0.0%) |
| 1 or 2 Children | 305 (100.0%) | 0 (0.0%) |
| 3 or 4 Children | 79 (100.0%) | 0 (0.0%) |
| 5 or more Children | 0 (0.0%) | 0 (0.0%) |
| Total | 681 (100.0%) | 0 (0.0%) |
Income Below Poverty Among Single-Parent Households in Flagler Estates
According to the poverty data in Flagler Estates, 18.3% or 15 single-father households and 42.5% or 80 single-mother households are living below the poverty line. Among single-father households, those with 3 or 4 children have the highest poverty rate, with 15 households (100.0%) experiencing poverty. Likewise, among single-mother households, those with 1 or 2 children have the highest poverty rate, with 80 households (55.6%) falling below the poverty line.
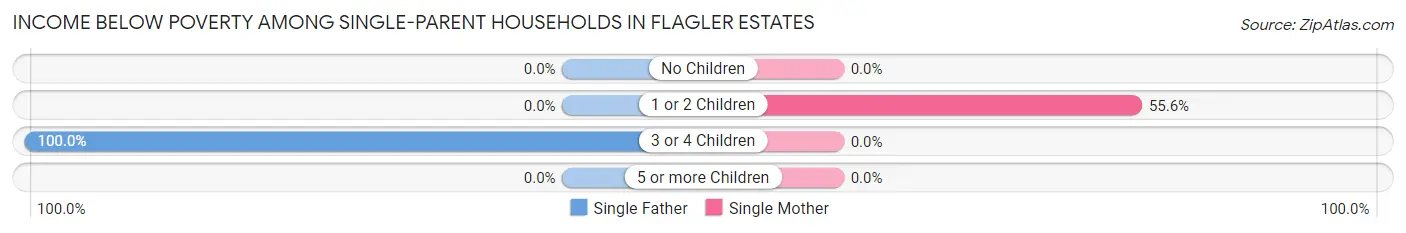
| Children | Single Father | Single Mother |
| No Children | 0 (0.0%) | 0 (0.0%) |
| 1 or 2 Children | 0 (0.0%) | 80 (55.6%) |
| 3 or 4 Children | 15 (100.0%) | 0 (0.0%) |
| 5 or more Children | 0 (0.0%) | 0 (0.0%) |
| Total | 15 (18.3%) | 80 (42.5%) |
Income Below Poverty Among Married-Couple vs Single-Parent Households in Flagler Estates
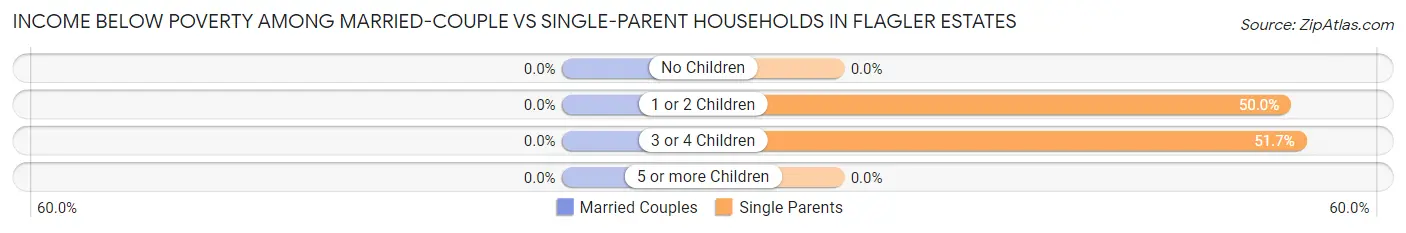
| Children | Married-Couple Families | Single-Parent Households |
| No Children | 0 (0.0%) | 0 (0.0%) |
| 1 or 2 Children | 0 (0.0%) | 80 (50.0%) |
| 3 or 4 Children | 0 (0.0%) | 15 (51.7%) |
| 5 or more Children | 0 (0.0%) | 0 (0.0%) |
| Total | 0 (0.0%) | 95 (35.2%) |
Race in Flagler Estates
The most populous races in Flagler Estates are White / Caucasian (2,858 | 79.2%), Two or more Races (541 | 15.0%), and Hispanic or Latino (261 | 7.2%).
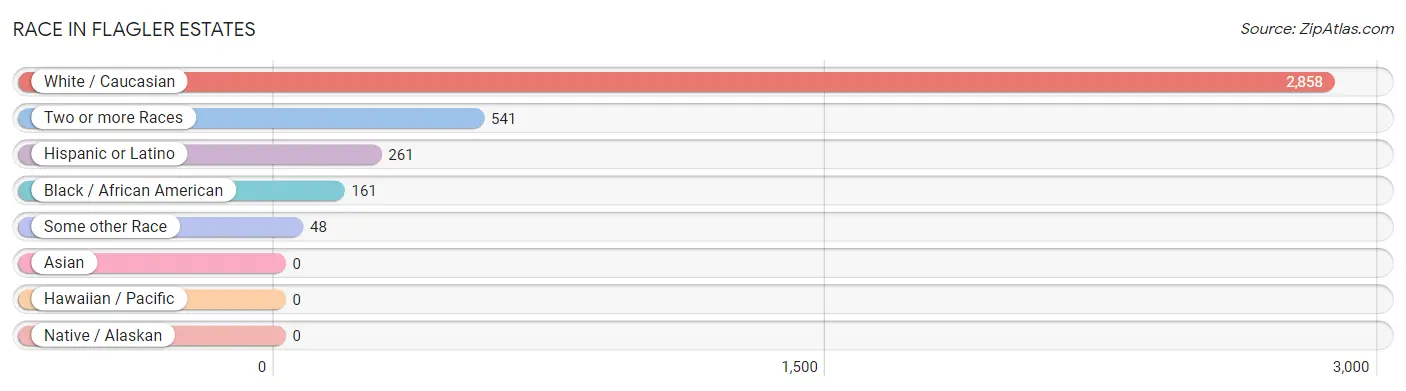
| Race | # Population | % Population |
| Asian | 0 | 0.0% |
| Black / African American | 161 | 4.5% |
| Hawaiian / Pacific | 0 | 0.0% |
| Hispanic or Latino | 261 | 7.2% |
| Native / Alaskan | 0 | 0.0% |
| White / Caucasian | 2,858 | 79.2% |
| Two or more Races | 541 | 15.0% |
| Some other Race | 48 | 1.3% |
| Total | 3,608 | 100.0% |
Ancestry in Flagler Estates
The most populous ancestries reported in Flagler Estates are English (853 | 23.6%), Irish (538 | 14.9%), American (477 | 13.2%), German (271 | 7.5%), and Mexican (213 | 5.9%), together accounting for 65.2% of all Flagler Estates residents.
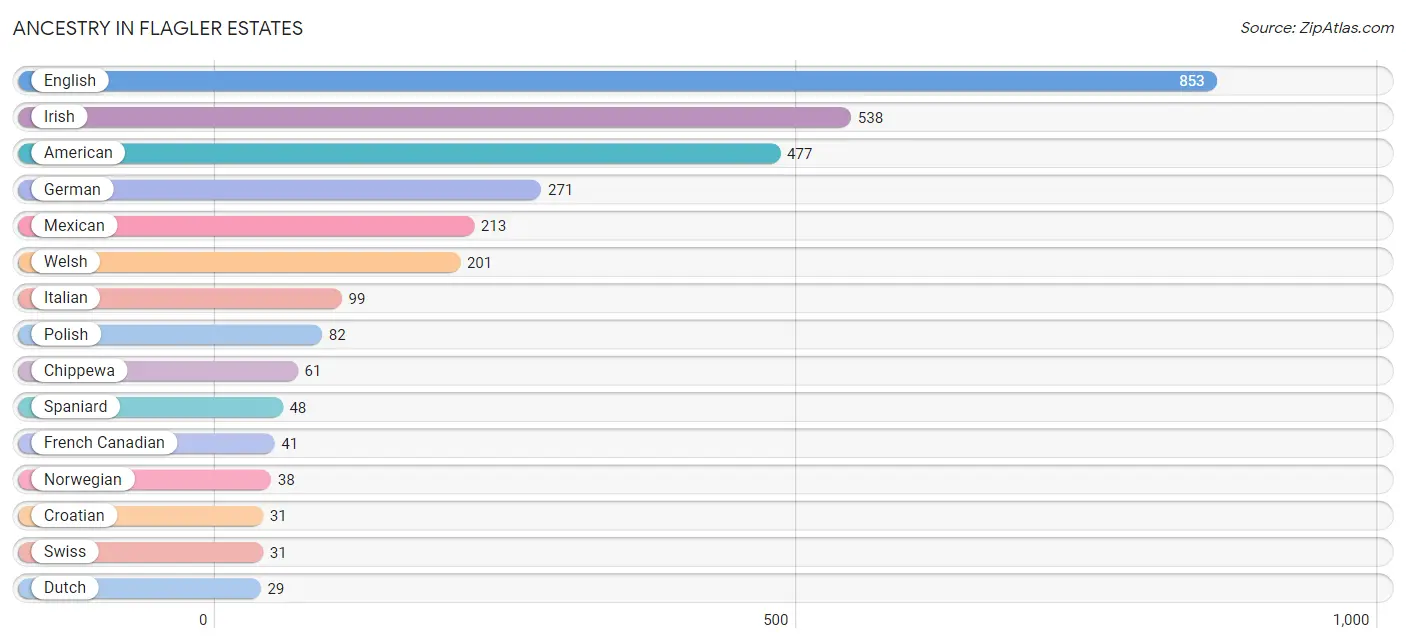
| Ancestry | # Population | % Population |
| American | 477 | 13.2% |
| Austrian | 10 | 0.3% |
| British | 6 | 0.2% |
| Chippewa | 61 | 1.7% |
| Croatian | 31 | 0.9% |
| Danish | 17 | 0.5% |
| Dutch | 29 | 0.8% |
| English | 853 | 23.6% |
| Finnish | 13 | 0.4% |
| French | 21 | 0.6% |
| French Canadian | 41 | 1.1% |
| German | 271 | 7.5% |
| Irish | 538 | 14.9% |
| Italian | 99 | 2.7% |
| Mexican | 213 | 5.9% |
| Northern European | 13 | 0.4% |
| Norwegian | 38 | 1.1% |
| Polish | 82 | 2.3% |
| Scotch-Irish | 29 | 0.8% |
| Scottish | 14 | 0.4% |
| Seminole | 18 | 0.5% |
| Spaniard | 48 | 1.3% |
| Swedish | 12 | 0.3% |
| Swiss | 31 | 0.9% |
| Welsh | 201 | 5.6% | View All 25 Rows |
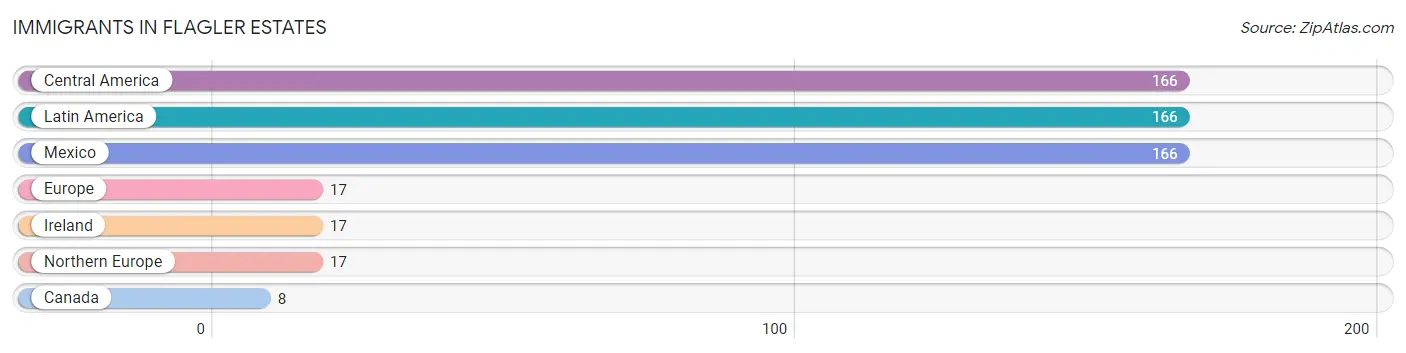
Immigrants in Flagler Estates
The most numerous immigrant groups reported in Flagler Estates came from Central America (166 | 4.6%), Latin America (166 | 4.6%), Mexico (166 | 4.6%), Europe (17 | 0.5%), and Ireland (17 | 0.5%), together accounting for 14.7% of all Flagler Estates residents.
| Immigration Origin | # Population | % Population |
| Canada | 8 | 0.2% |
| Central America | 166 | 4.6% |
| Europe | 17 | 0.5% |
| Ireland | 17 | 0.5% |
| Latin America | 166 | 4.6% |
| Mexico | 166 | 4.6% |
| Northern Europe | 17 | 0.5% | View All 7 Rows |
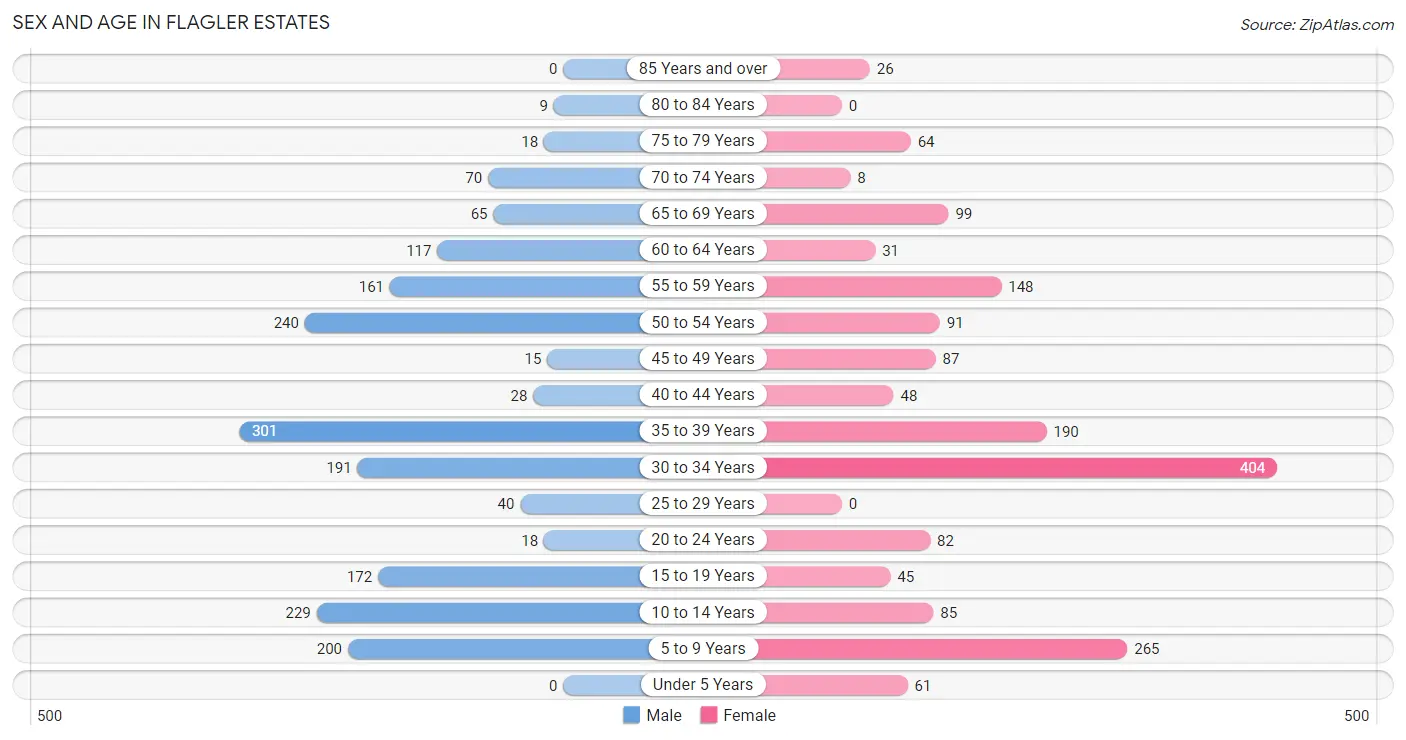
Sex and Age in Flagler Estates
Sex and Age in Flagler Estates
The most populous age groups in Flagler Estates are 35 to 39 Years (301 | 16.1%) for men and 30 to 34 Years (404 | 23.3%) for women.
| Age Bracket | Male | Female |
| Under 5 Years | 0 (0.0%) | 61 (3.5%) |
| 5 to 9 Years | 200 (10.7%) | 265 (15.3%) |
| 10 to 14 Years | 229 (12.2%) | 85 (4.9%) |
| 15 to 19 Years | 172 (9.2%) | 45 (2.6%) |
| 20 to 24 Years | 18 (1.0%) | 82 (4.7%) |
| 25 to 29 Years | 40 (2.1%) | 0 (0.0%) |
| 30 to 34 Years | 191 (10.2%) | 404 (23.3%) |
| 35 to 39 Years | 301 (16.1%) | 190 (11.0%) |
| 40 to 44 Years | 28 (1.5%) | 48 (2.8%) |
| 45 to 49 Years | 15 (0.8%) | 87 (5.0%) |
| 50 to 54 Years | 240 (12.8%) | 91 (5.2%) |
| 55 to 59 Years | 161 (8.6%) | 148 (8.5%) |
| 60 to 64 Years | 117 (6.2%) | 31 (1.8%) |
| 65 to 69 Years | 65 (3.5%) | 99 (5.7%) |
| 70 to 74 Years | 70 (3.7%) | 8 (0.5%) |
| 75 to 79 Years | 18 (1.0%) | 64 (3.7%) |
| 80 to 84 Years | 9 (0.5%) | 0 (0.0%) |
| 85 Years and over | 0 (0.0%) | 26 (1.5%) |
| Total | 1,874 (100.0%) | 1,734 (100.0%) |
Families and Households in Flagler Estates
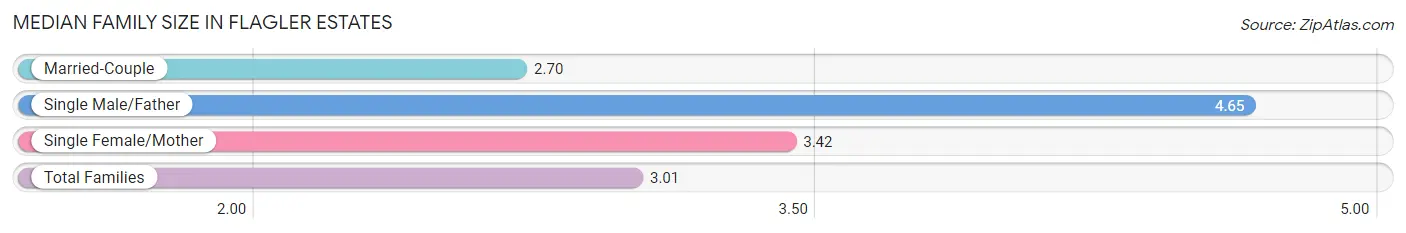
Median Family Size in Flagler Estates
The median family size in Flagler Estates is 3.01 persons per family, with single male/father families (82 | 8.6%) accounting for the largest median family size of 4.65 persons per family. On the other hand, married-couple families (681 | 71.6%) represent the smallest median family size with 2.70 persons per family.
| Family Type | # Families | Family Size |
| Married-Couple | 681 (71.6%) | 2.70 |
| Single Male/Father | 82 (8.6%) | 4.65 |
| Single Female/Mother | 188 (19.8%) | 3.42 |
| Total Families | 951 (100.0%) | 3.01 |
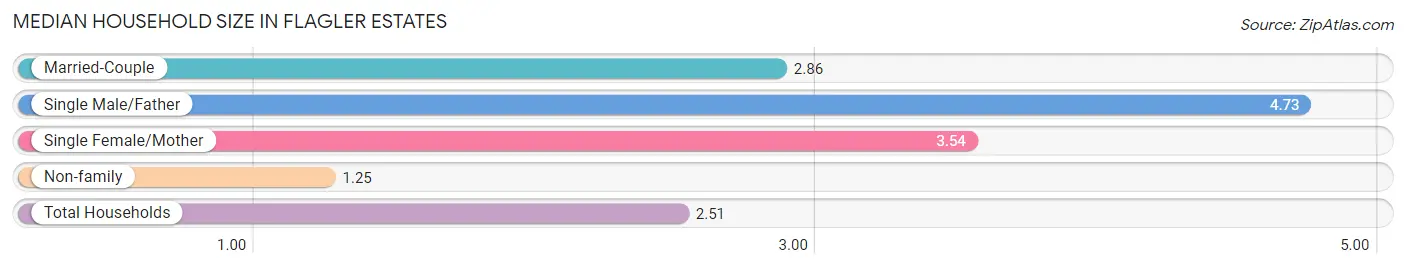
Median Household Size in Flagler Estates
The median household size in Flagler Estates is 2.51 persons per household, with single male/father households (82 | 5.7%) accounting for the largest median household size of 4.73 persons per household. non-family households (488 | 33.9%) represent the smallest median household size with 1.25 persons per household.
| Household Type | # Households | Household Size |
| Married-Couple | 681 (47.3%) | 2.86 |
| Single Male/Father | 82 (5.7%) | 4.73 |
| Single Female/Mother | 188 (13.1%) | 3.54 |
| Non-family | 488 (33.9%) | 1.25 |
| Total Households | 1,439 (100.0%) | 2.51 |
Household Size by Marriage Status in Flagler Estates
Out of a total of 1,439 households in Flagler Estates, 951 (66.1%) are family households, while 488 (33.9%) are nonfamily households. The most numerous type of family households are 3-person households, comprising 317, and the most common type of nonfamily households are 1-person households, comprising 384.
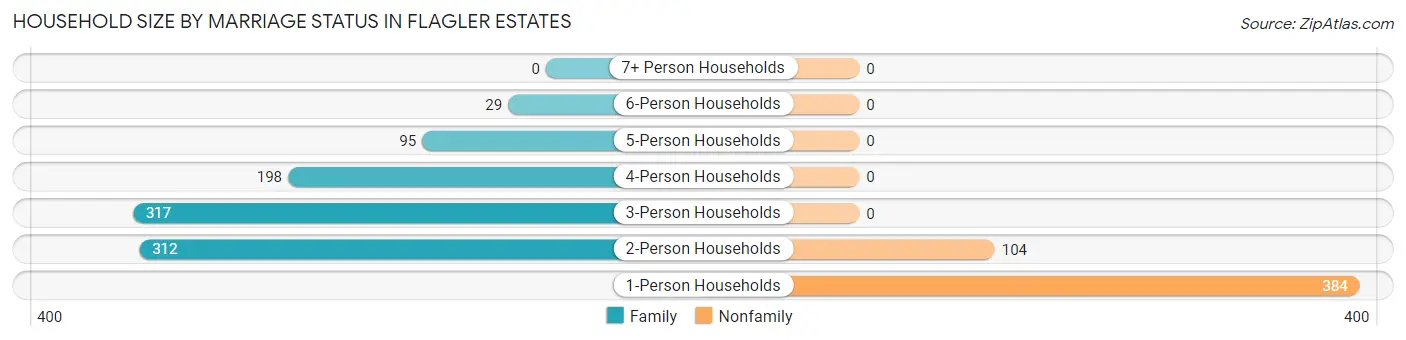
| Household Size | Family Households | Nonfamily Households |
| 1-Person Households | - | 384 (26.7%) |
| 2-Person Households | 312 (21.7%) | 104 (7.2%) |
| 3-Person Households | 317 (22.0%) | 0 (0.0%) |
| 4-Person Households | 198 (13.8%) | 0 (0.0%) |
| 5-Person Households | 95 (6.6%) | 0 (0.0%) |
| 6-Person Households | 29 (2.0%) | 0 (0.0%) |
| 7+ Person Households | 0 (0.0%) | 0 (0.0%) |
| Total | 951 (66.1%) | 488 (33.9%) |
Female Fertility in Flagler Estates
Fertility by Age in Flagler Estates
Average fertility rate in Flagler Estates is 22.0 births per 1,000 women. Women in the age bracket of 20 to 34 years have the highest fertility rate with 39.0 births per 1,000 women. Women in the age bracket of 20 to 34 years acount for 100.0% of all women with births.
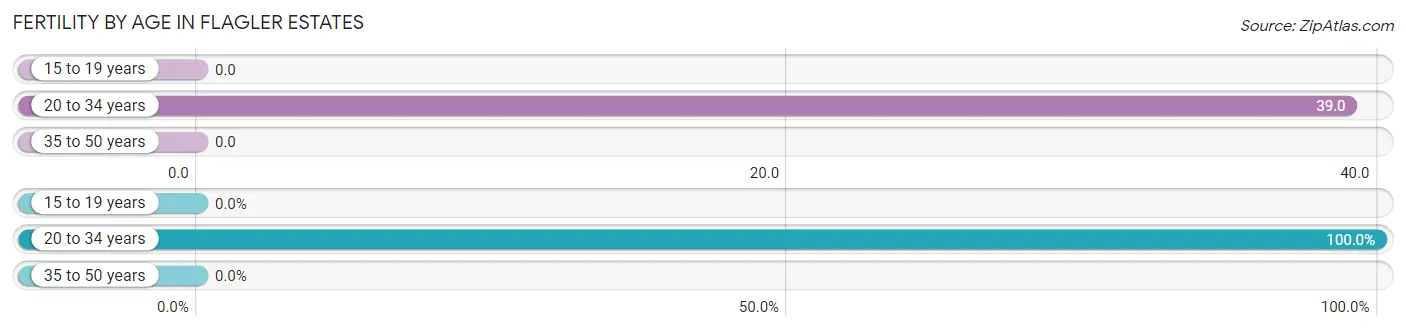
| Age Bracket | Women with Births | Births / 1,000 Women |
| 15 to 19 years | 0 (0.0%) | 0.0 |
| 20 to 34 years | 19 (100.0%) | 39.0 |
| 35 to 50 years | 0 (0.0%) | 0.0 |
| Total | 19 (100.0%) | 22.0 |
Fertility by Age by Marriage Status in Flagler Estates
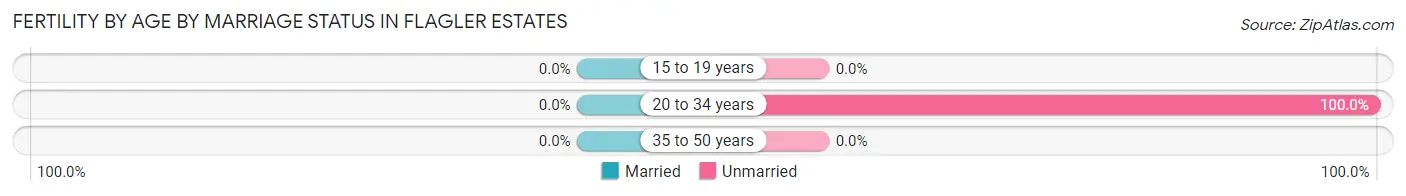
| Age Bracket | Married | Unmarried |
| 15 to 19 years | 0 (0.0%) | 0 (0.0%) |
| 20 to 34 years | 0 (0.0%) | 19 (100.0%) |
| 35 to 50 years | 0 (0.0%) | 0 (0.0%) |
| Total | 0 (0.0%) | 19 (100.0%) |
Fertility by Education in Flagler Estates
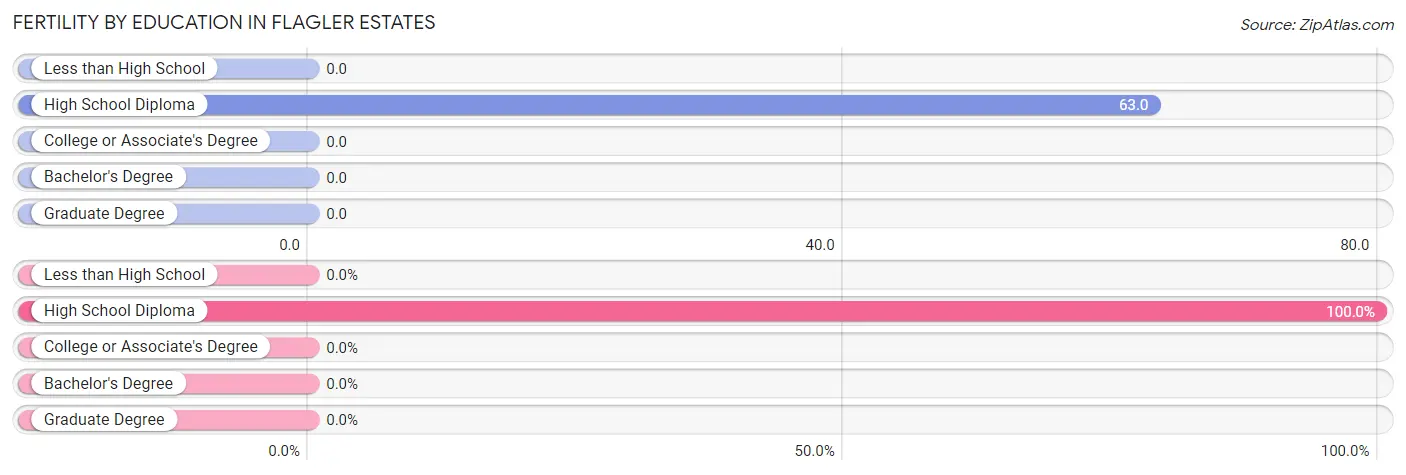
| Educational Attainment | Women with Births | Births / 1,000 Women |
| Less than High School | 0 (0.0%) | 0.0 |
| High School Diploma | 19 (100.0%) | 63.0 |
| College or Associate's Degree | 0 (0.0%) | 0.0 |
| Bachelor's Degree | 0 (0.0%) | 0.0 |
| Graduate Degree | 0 (0.0%) | 0.0 |
| Total | 19 (100.0%) | 22.0 |
Fertility by Education by Marriage Status in Flagler Estates
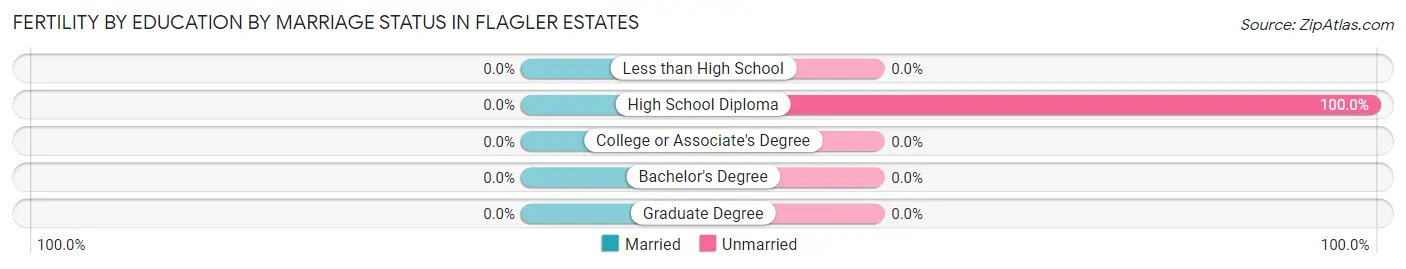
| Educational Attainment | Married | Unmarried |
| Less than High School | 0 (0.0%) | 0 (0.0%) |
| High School Diploma | 0 (0.0%) | 19 (100.0%) |
| College or Associate's Degree | 0 (0.0%) | 0 (0.0%) |
| Bachelor's Degree | 0 (0.0%) | 0 (0.0%) |
| Graduate Degree | 0 (0.0%) | 0 (0.0%) |
| Total | 0 (0.0%) | 19 (100.0%) |
Employment Characteristics in Flagler Estates
Employment by Class of Employer in Flagler Estates
Among the 1,560 employed individuals in Flagler Estates, private company employees (1,153 | 73.9%), self-employed (incorporated) (145 | 9.3%), and local government employees (143 | 9.2%) make up the most common classes of employment.
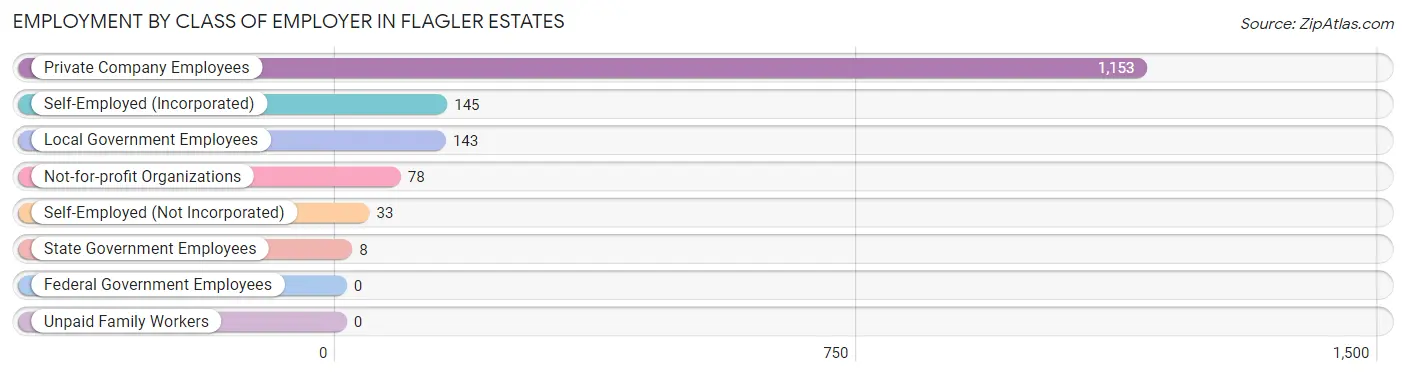
| Employer Class | # Employees | % Employees |
| Private Company Employees | 1,153 | 73.9% |
| Self-Employed (Incorporated) | 145 | 9.3% |
| Self-Employed (Not Incorporated) | 33 | 2.1% |
| Not-for-profit Organizations | 78 | 5.0% |
| Local Government Employees | 143 | 9.2% |
| State Government Employees | 8 | 0.5% |
| Federal Government Employees | 0 | 0.0% |
| Unpaid Family Workers | 0 | 0.0% |
| Total | 1,560 | 100.0% |
Employment Status by Age in Flagler Estates
According to the labor force statistics for Flagler Estates, out of the total population over 16 years of age (2,682), 62.3% or 1,671 individuals are in the labor force, with 6.6% or 110 of them unemployed. The age group with the highest labor force participation rate is 25 to 29 years, with 100.0% or 40 individuals in the labor force. Within the labor force, the 20 to 24 years age range has the highest percentage of unemployed individuals, with 29.0% or 18 of them being unemployed.
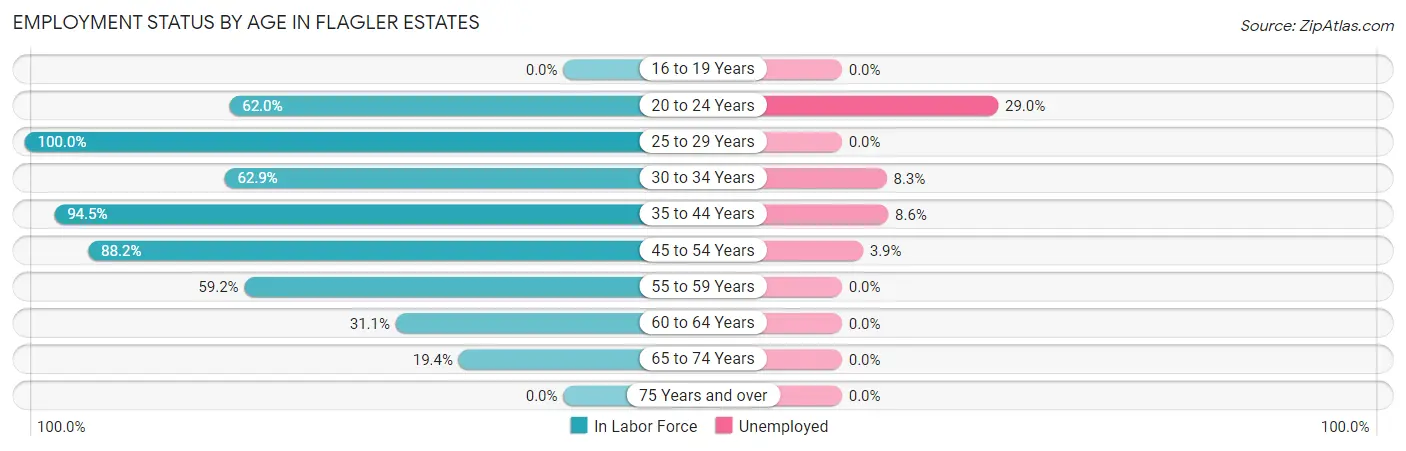
| Age Bracket | In Labor Force | Unemployed |
| 16 to 19 Years | 0 (0.0%) | 0 (0.0%) |
| 20 to 24 Years | 62 (62.0%) | 18 (29.0%) |
| 25 to 29 Years | 40 (100.0%) | 0 (0.0%) |
| 30 to 34 Years | 374 (62.9%) | 31 (8.3%) |
| 35 to 44 Years | 536 (94.5%) | 46 (8.6%) |
| 45 to 54 Years | 382 (88.2%) | 15 (3.9%) |
| 55 to 59 Years | 183 (59.2%) | 0 (0.0%) |
| 60 to 64 Years | 46 (31.1%) | 0 (0.0%) |
| 65 to 74 Years | 47 (19.4%) | 0 (0.0%) |
| 75 Years and over | 0 (0.0%) | 0 (0.0%) |
| Total | 1,671 (62.3%) | 110 (6.6%) |
Employment Status by Educational Attainment in Flagler Estates
According to labor force statistics for Flagler Estates, 74.6% of individuals (1,561) out of the total population between 25 and 64 years of age (2,092) are in the labor force, with 5.9% or 92 of them being unemployed. The group with the highest labor force participation rate are those with the educational attainment of bachelor's degree or higher, with 82.0% or 250 individuals in the labor force. Within the labor force, individuals with less than high school education have the highest percentage of unemployment, with 21.1% or 46 of them being unemployed.
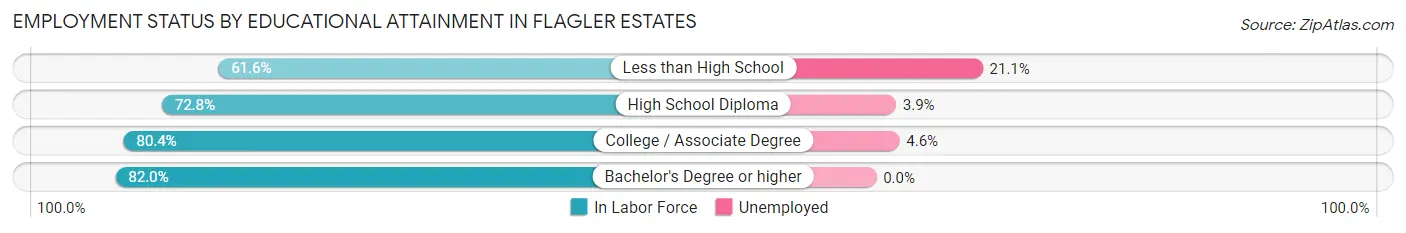
| Educational Attainment | In Labor Force | Unemployed |
| Less than High School | 218 (61.6%) | 75 (21.1%) |
| High School Diploma | 568 (72.8%) | 30 (3.9%) |
| College / Associate Degree | 525 (80.4%) | 30 (4.6%) |
| Bachelor's Degree or higher | 250 (82.0%) | 0 (0.0%) |
| Total | 1,561 (74.6%) | 123 (5.9%) |
Employment Occupations by Sex in Flagler Estates
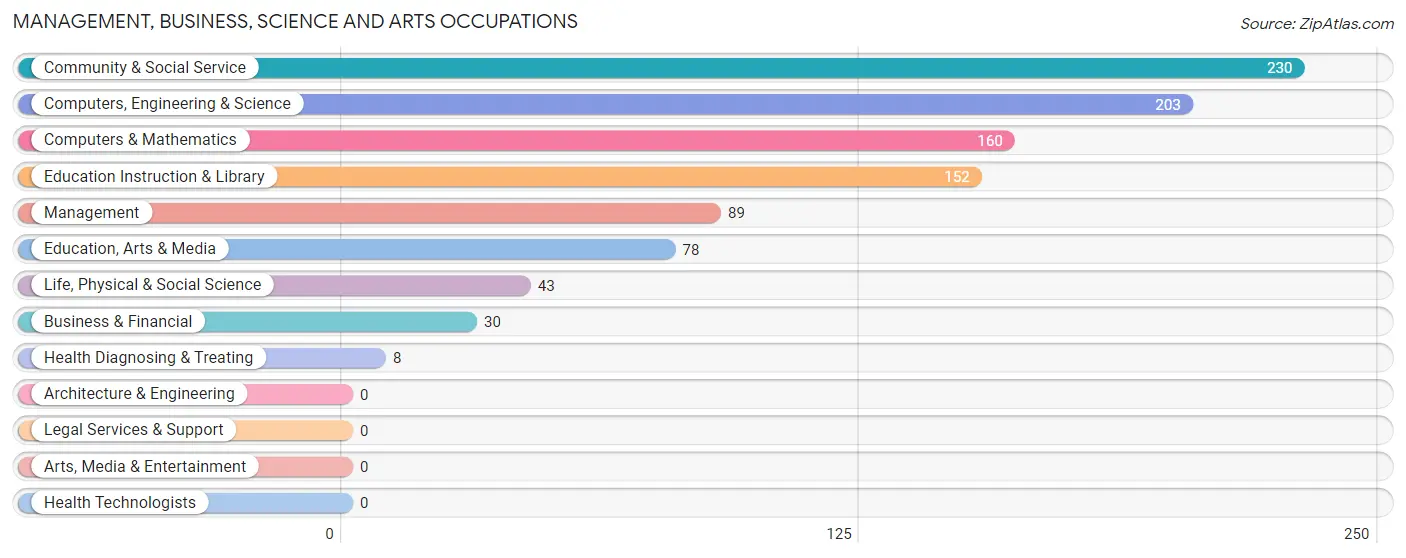
Management, Business, Science and Arts Occupations
The most common Management, Business, Science and Arts occupations in Flagler Estates are Community & Social Service (230 | 14.7%), Computers, Engineering & Science (203 | 13.0%), Computers & Mathematics (160 | 10.3%), Education Instruction & Library (152 | 9.7%), and Management (89 | 5.7%).
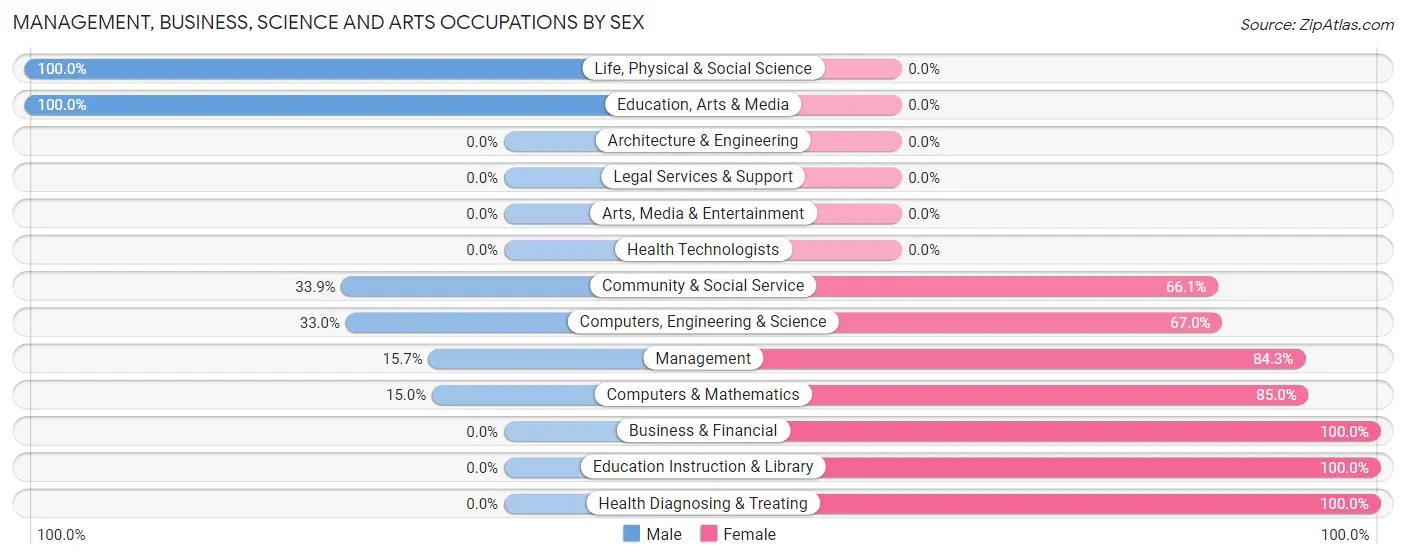
Management, Business, Science and Arts Occupations by Sex
Within the Management, Business, Science and Arts occupations in Flagler Estates, the most male-oriented occupations are Life, Physical & Social Science (100.0%), Education, Arts & Media (100.0%), and Community & Social Service (33.9%), while the most female-oriented occupations are Business & Financial (100.0%), Education Instruction & Library (100.0%), and Health Diagnosing & Treating (100.0%).
| Occupation | Male | Female |
| Management | 14 (15.7%) | 75 (84.3%) |
| Business & Financial | 0 (0.0%) | 30 (100.0%) |
| Computers, Engineering & Science | 67 (33.0%) | 136 (67.0%) |
| Computers & Mathematics | 24 (15.0%) | 136 (85.0%) |
| Architecture & Engineering | 0 (0.0%) | 0 (0.0%) |
| Life, Physical & Social Science | 43 (100.0%) | 0 (0.0%) |
| Community & Social Service | 78 (33.9%) | 152 (66.1%) |
| Education, Arts & Media | 78 (100.0%) | 0 (0.0%) |
| Legal Services & Support | 0 (0.0%) | 0 (0.0%) |
| Education Instruction & Library | 0 (0.0%) | 152 (100.0%) |
| Arts, Media & Entertainment | 0 (0.0%) | 0 (0.0%) |
| Health Diagnosing & Treating | 0 (0.0%) | 8 (100.0%) |
| Health Technologists | 0 (0.0%) | 0 (0.0%) |
| Total (Category) | 159 (28.4%) | 401 (71.6%) |
| Total (Overall) | 934 (59.9%) | 626 (40.1%) |
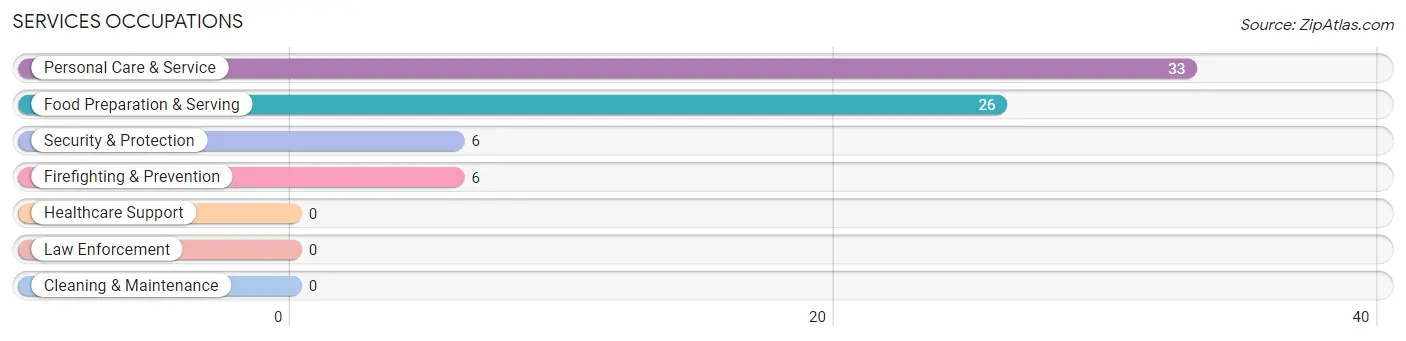
Services Occupations
The most common Services occupations in Flagler Estates are Personal Care & Service (33 | 2.1%), Food Preparation & Serving (26 | 1.7%), Security & Protection (6 | 0.4%), and Firefighting & Prevention (6 | 0.4%).
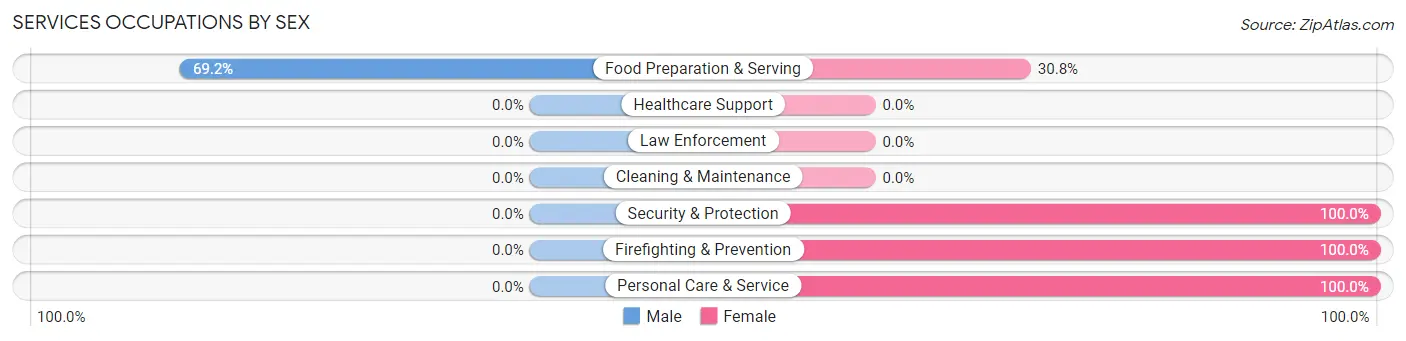
Services Occupations by Sex
| Occupation | Male | Female |
| Healthcare Support | 0 (0.0%) | 0 (0.0%) |
| Security & Protection | 0 (0.0%) | 6 (100.0%) |
| Firefighting & Prevention | 0 (0.0%) | 6 (100.0%) |
| Law Enforcement | 0 (0.0%) | 0 (0.0%) |
| Food Preparation & Serving | 18 (69.2%) | 8 (30.8%) |
| Cleaning & Maintenance | 0 (0.0%) | 0 (0.0%) |
| Personal Care & Service | 0 (0.0%) | 33 (100.0%) |
| Total (Category) | 18 (27.7%) | 47 (72.3%) |
| Total (Overall) | 934 (59.9%) | 626 (40.1%) |
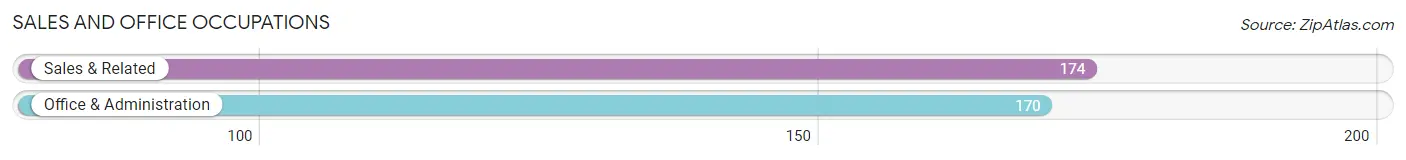
Sales and Office Occupations
The most common Sales and Office occupations in Flagler Estates are Sales & Related (174 | 11.2%), and Office & Administration (170 | 10.9%).
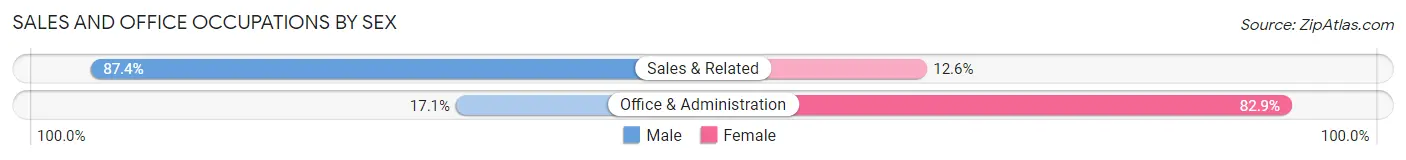
Sales and Office Occupations by Sex
| Occupation | Male | Female |
| Sales & Related | 152 (87.4%) | 22 (12.6%) |
| Office & Administration | 29 (17.1%) | 141 (82.9%) |
| Total (Category) | 181 (52.6%) | 163 (47.4%) |
| Total (Overall) | 934 (59.9%) | 626 (40.1%) |
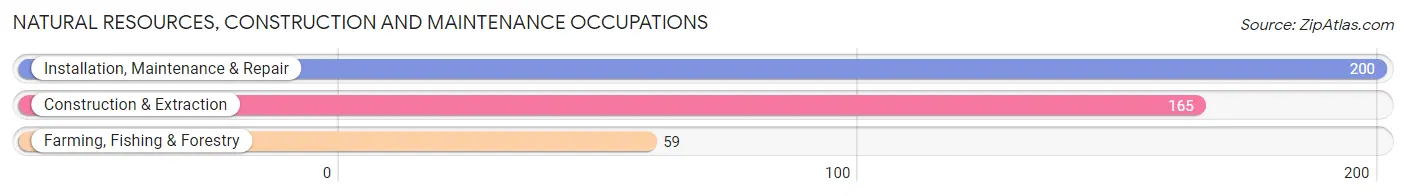
Natural Resources, Construction and Maintenance Occupations
The most common Natural Resources, Construction and Maintenance occupations in Flagler Estates are Installation, Maintenance & Repair (200 | 12.8%), Construction & Extraction (165 | 10.6%), and Farming, Fishing & Forestry (59 | 3.8%).
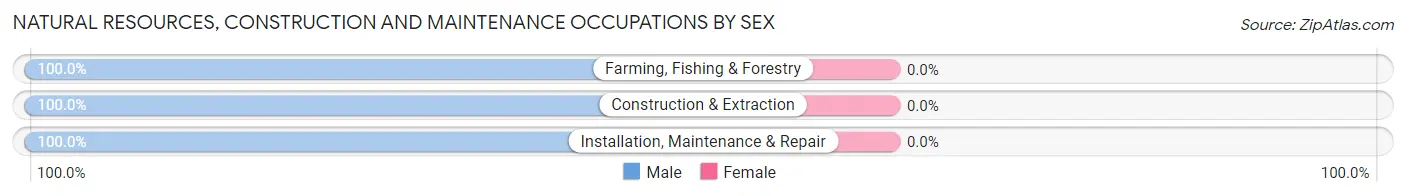
Natural Resources, Construction and Maintenance Occupations by Sex
| Occupation | Male | Female |
| Farming, Fishing & Forestry | 59 (100.0%) | 0 (0.0%) |
| Construction & Extraction | 165 (100.0%) | 0 (0.0%) |
| Installation, Maintenance & Repair | 200 (100.0%) | 0 (0.0%) |
| Total (Category) | 424 (100.0%) | 0 (0.0%) |
| Total (Overall) | 934 (59.9%) | 626 (40.1%) |
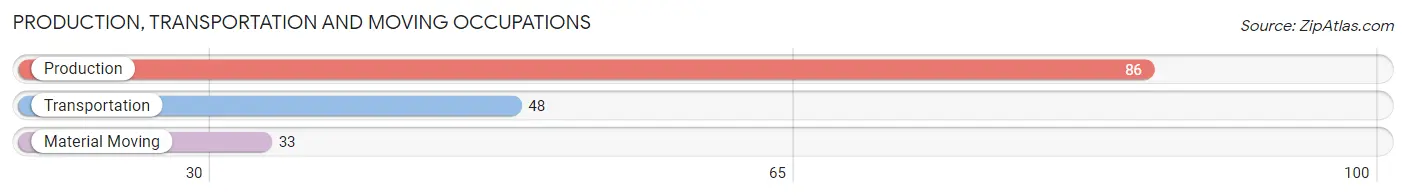
Production, Transportation and Moving Occupations
The most common Production, Transportation and Moving occupations in Flagler Estates are Production (86 | 5.5%), Transportation (48 | 3.1%), and Material Moving (33 | 2.1%).
Production, Transportation and Moving Occupations by Sex
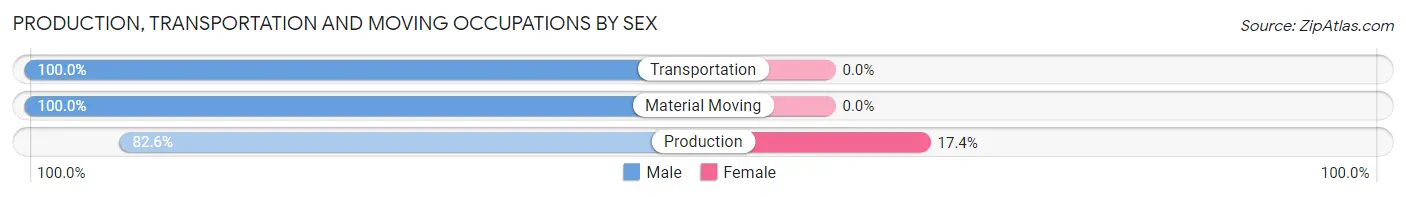
| Occupation | Male | Female |
| Production | 71 (82.6%) | 15 (17.4%) |
| Transportation | 48 (100.0%) | 0 (0.0%) |
| Material Moving | 33 (100.0%) | 0 (0.0%) |
| Total (Category) | 152 (91.0%) | 15 (9.0%) |
| Total (Overall) | 934 (59.9%) | 626 (40.1%) |
Employment Industries by Sex in Flagler Estates
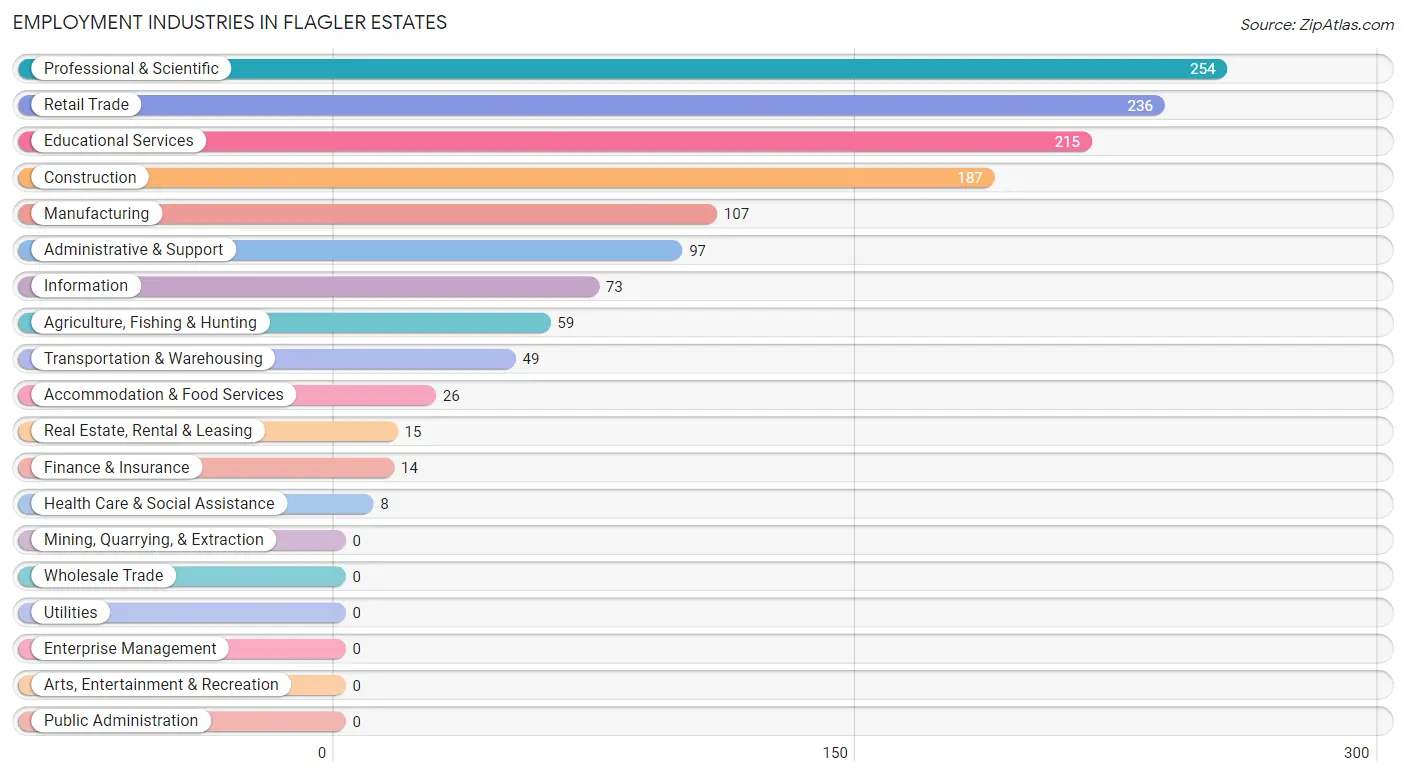
Employment Industries in Flagler Estates
The major employment industries in Flagler Estates include Professional & Scientific (254 | 16.3%), Retail Trade (236 | 15.1%), Educational Services (215 | 13.8%), Construction (187 | 12.0%), and Manufacturing (107 | 6.9%).
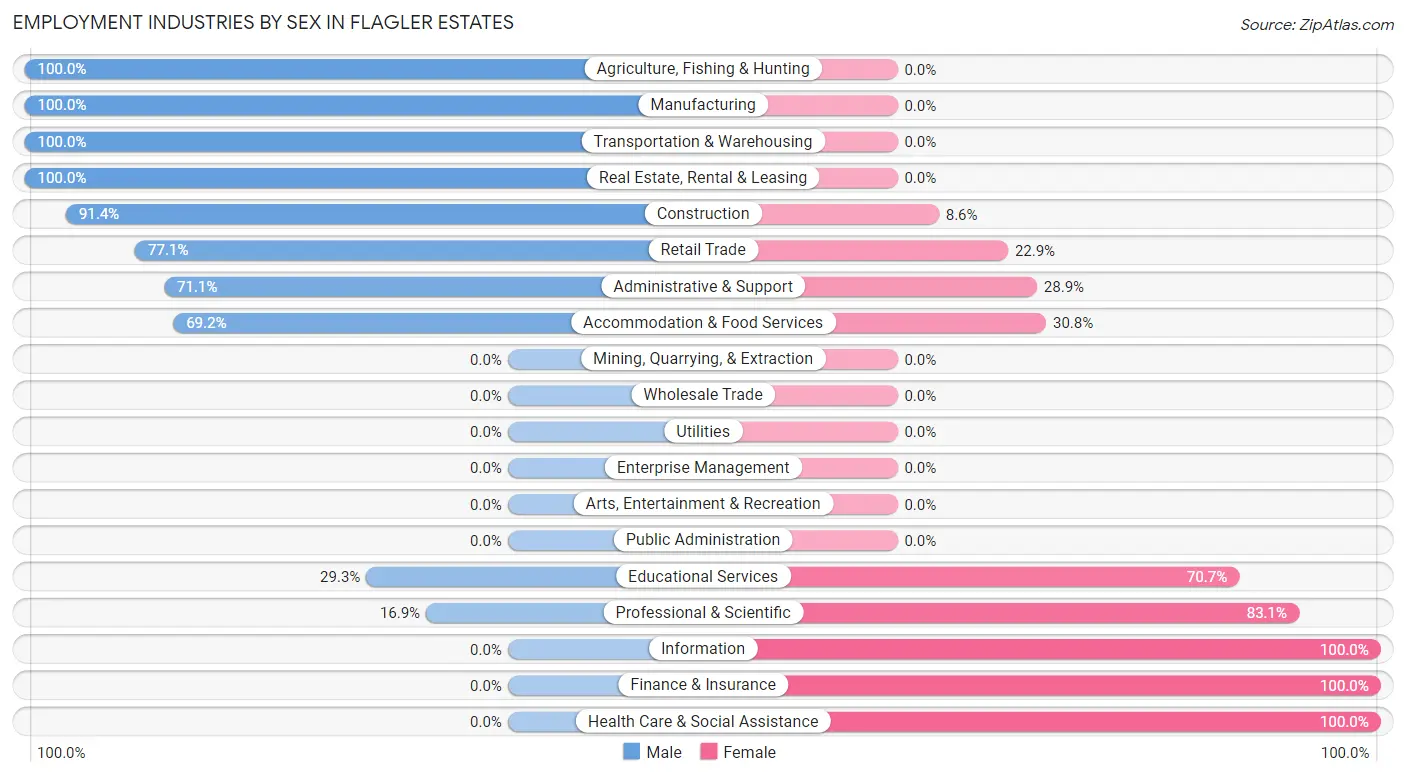
Employment Industries by Sex in Flagler Estates
The Flagler Estates industries that see more men than women are Agriculture, Fishing & Hunting (100.0%), Manufacturing (100.0%), and Transportation & Warehousing (100.0%), whereas the industries that tend to have a higher number of women are Information (100.0%), Finance & Insurance (100.0%), and Health Care & Social Assistance (100.0%).
| Industry | Male | Female |
| Agriculture, Fishing & Hunting | 59 (100.0%) | 0 (0.0%) |
| Mining, Quarrying, & Extraction | 0 (0.0%) | 0 (0.0%) |
| Construction | 171 (91.4%) | 16 (8.6%) |
| Manufacturing | 107 (100.0%) | 0 (0.0%) |
| Wholesale Trade | 0 (0.0%) | 0 (0.0%) |
| Retail Trade | 182 (77.1%) | 54 (22.9%) |
| Transportation & Warehousing | 49 (100.0%) | 0 (0.0%) |
| Utilities | 0 (0.0%) | 0 (0.0%) |
| Information | 0 (0.0%) | 73 (100.0%) |
| Finance & Insurance | 0 (0.0%) | 14 (100.0%) |
| Real Estate, Rental & Leasing | 15 (100.0%) | 0 (0.0%) |
| Professional & Scientific | 43 (16.9%) | 211 (83.1%) |
| Enterprise Management | 0 (0.0%) | 0 (0.0%) |
| Administrative & Support | 69 (71.1%) | 28 (28.9%) |
| Educational Services | 63 (29.3%) | 152 (70.7%) |
| Health Care & Social Assistance | 0 (0.0%) | 8 (100.0%) |
| Arts, Entertainment & Recreation | 0 (0.0%) | 0 (0.0%) |
| Accommodation & Food Services | 18 (69.2%) | 8 (30.8%) |
| Public Administration | 0 (0.0%) | 0 (0.0%) |
| Total | 934 (59.9%) | 626 (40.1%) |
Education in Flagler Estates
School Enrollment in Flagler Estates
The most common levels of schooling among the 1,098 students in Flagler Estates are high school (274 | 24.9%), middle school (257 | 23.4%), and elementary school (233 | 21.2%).
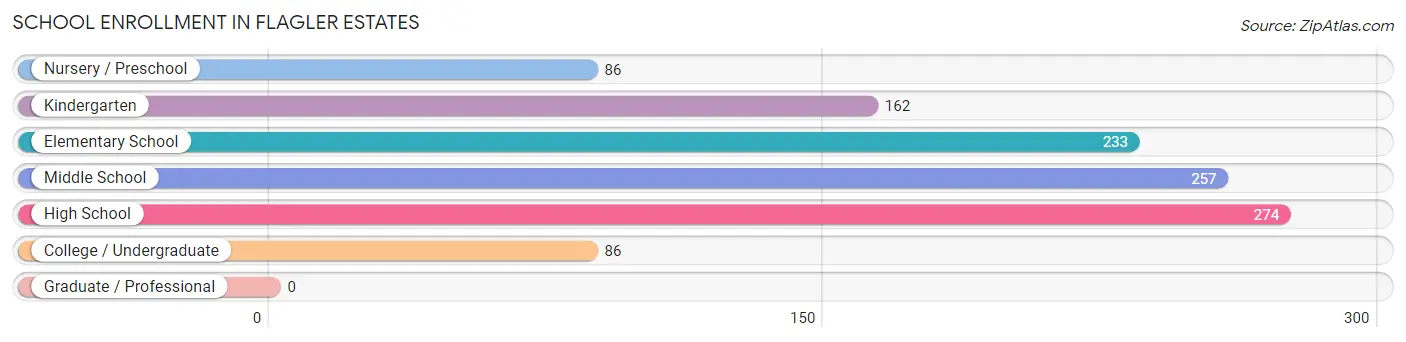
| School Level | # Students | % Students |
| Nursery / Preschool | 86 | 7.8% |
| Kindergarten | 162 | 14.7% |
| Elementary School | 233 | 21.2% |
| Middle School | 257 | 23.4% |
| High School | 274 | 24.9% |
| College / Undergraduate | 86 | 7.8% |
| Graduate / Professional | 0 | 0.0% |
| Total | 1,098 | 100.0% |
School Enrollment by Age by Funding Source in Flagler Estates
Out of a total of 1,098 students who are enrolled in schools in Flagler Estates, 120 (10.9%) attend a private institution, while the remaining 978 (89.1%) are enrolled in public schools. The age group of 5 to 9 year old has the highest likelihood of being enrolled in private schools, with 120 (26.2% in the age bracket) enrolled. Conversely, the age group of 3 to 4 year olds has the lowest likelihood of being enrolled in a private school, with 23 (100.0% in the age bracket) attending a public institution.
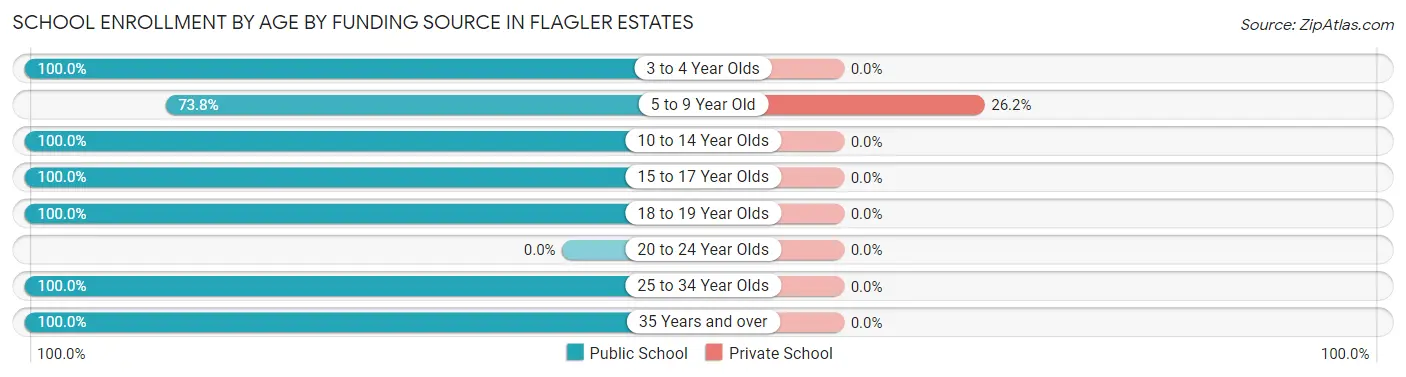
| Age Bracket | Public School | Private School |
| 3 to 4 Year Olds | 23 (100.0%) | 0 (0.0%) |
| 5 to 9 Year Old | 338 (73.8%) | 120 (26.2%) |
| 10 to 14 Year Olds | 314 (100.0%) | 0 (0.0%) |
| 15 to 17 Year Olds | 172 (100.0%) | 0 (0.0%) |
| 18 to 19 Year Olds | 45 (100.0%) | 0 (0.0%) |
| 20 to 24 Year Olds | 0 (0.0%) | 0 (0.0%) |
| 25 to 34 Year Olds | 62 (100.0%) | 0 (0.0%) |
| 35 Years and over | 24 (100.0%) | 0 (0.0%) |
| Total | 978 (89.1%) | 120 (10.9%) |
Educational Attainment by Field of Study in Flagler Estates
Bio, nature & agricultural (136 | 41.2%), communications (116 | 35.1%), education (24 | 7.3%), science & technology (15 | 4.5%), and computers & mathematics (14 | 4.2%) are the most common fields of study among 330 individuals in Flagler Estates who have obtained a bachelor's degree or higher.
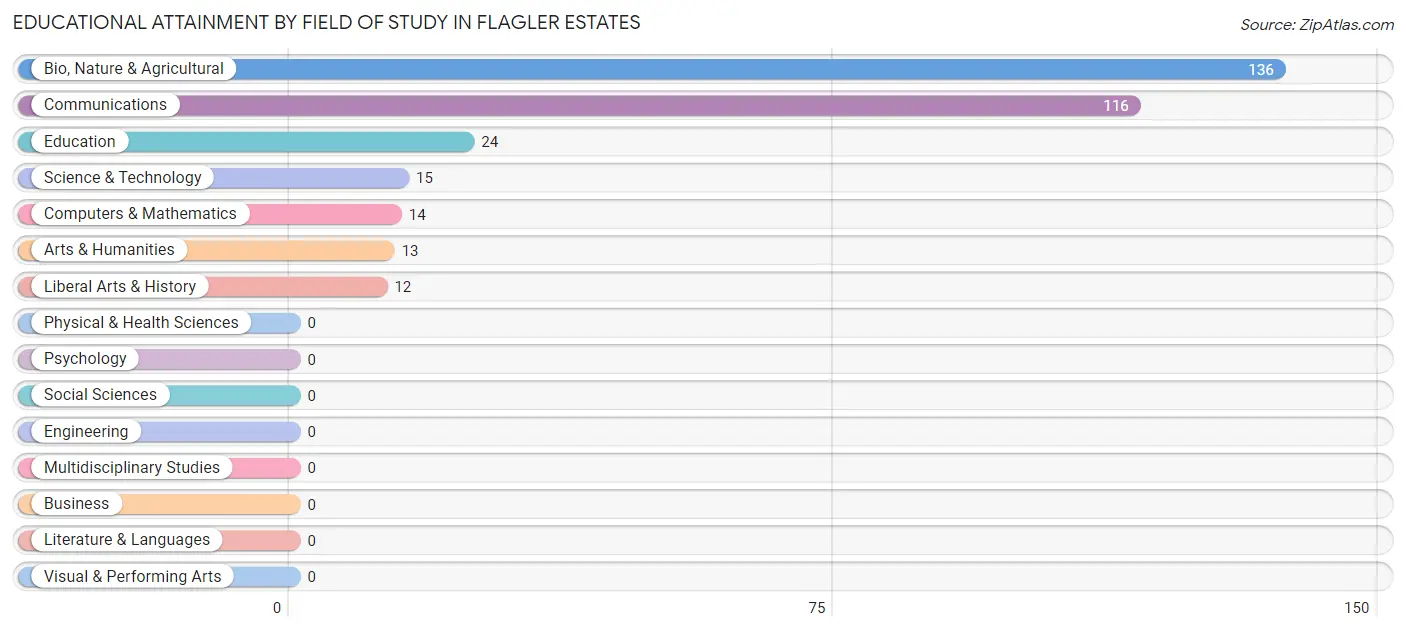
| Field of Study | # Graduates | % Graduates |
| Computers & Mathematics | 14 | 4.2% |
| Bio, Nature & Agricultural | 136 | 41.2% |
| Physical & Health Sciences | 0 | 0.0% |
| Psychology | 0 | 0.0% |
| Social Sciences | 0 | 0.0% |
| Engineering | 0 | 0.0% |
| Multidisciplinary Studies | 0 | 0.0% |
| Science & Technology | 15 | 4.5% |
| Business | 0 | 0.0% |
| Education | 24 | 7.3% |
| Literature & Languages | 0 | 0.0% |
| Liberal Arts & History | 12 | 3.6% |
| Visual & Performing Arts | 0 | 0.0% |
| Communications | 116 | 35.1% |
| Arts & Humanities | 13 | 3.9% |
| Total | 330 | 100.0% |
Transportation & Commute in Flagler Estates
Vehicle Availability by Sex in Flagler Estates
The most prevalent vehicle ownership categories in Flagler Estates are males with 2 vehicles (442, accounting for 47.3%) and females with 2 vehicles (156, making up 70.6%).
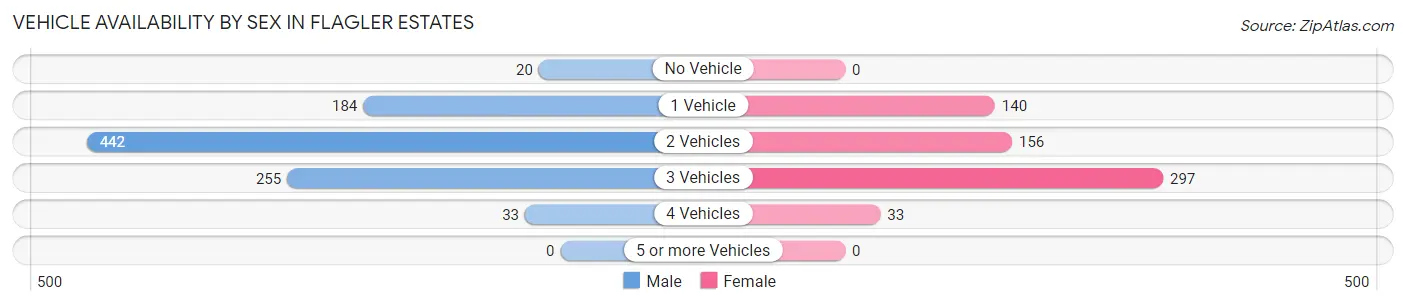
| Vehicles Available | Male | Female |
| No Vehicle | 20 (2.1%) | 0 (0.0%) |
| 1 Vehicle | 184 (19.7%) | 140 (22.4%) |
| 2 Vehicles | 442 (47.3%) | 156 (24.9%) |
| 3 Vehicles | 255 (27.3%) | 297 (47.4%) |
| 4 Vehicles | 33 (3.5%) | 33 (5.3%) |
| 5 or more Vehicles | 0 (0.0%) | 0 (0.0%) |
| Total | 934 (100.0%) | 626 (100.0%) |
Commute Time in Flagler Estates
The most frequently occuring commute durations in Flagler Estates are 30 to 34 minutes (275 commuters, 20.0%), 15 to 19 minutes (226 commuters, 16.4%), and 25 to 29 minutes (220 commuters, 16.0%).
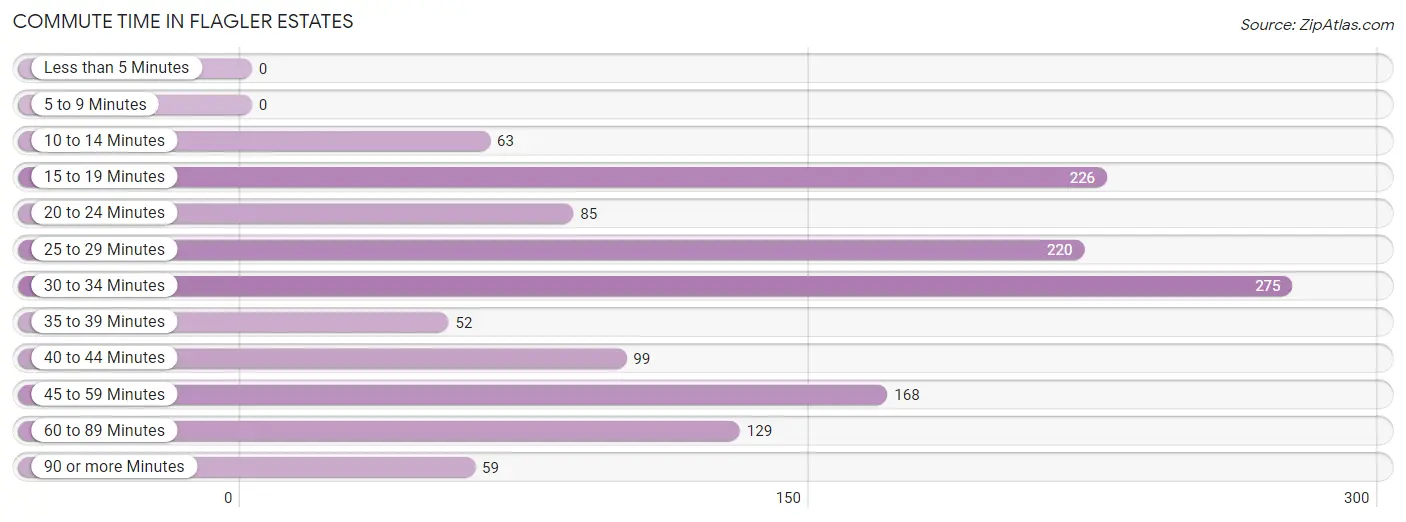
| Commute Time | # Commuters | % Commuters |
| Less than 5 Minutes | 0 | 0.0% |
| 5 to 9 Minutes | 0 | 0.0% |
| 10 to 14 Minutes | 63 | 4.6% |
| 15 to 19 Minutes | 226 | 16.4% |
| 20 to 24 Minutes | 85 | 6.2% |
| 25 to 29 Minutes | 220 | 16.0% |
| 30 to 34 Minutes | 275 | 20.0% |
| 35 to 39 Minutes | 52 | 3.8% |
| 40 to 44 Minutes | 99 | 7.2% |
| 45 to 59 Minutes | 168 | 12.2% |
| 60 to 89 Minutes | 129 | 9.4% |
| 90 or more Minutes | 59 | 4.3% |
Commute Time by Sex in Flagler Estates
The most common commute times in Flagler Estates are 25 to 29 minutes (206 commuters, 26.4%) for males and 30 to 34 minutes (275 commuters, 46.1%) for females.
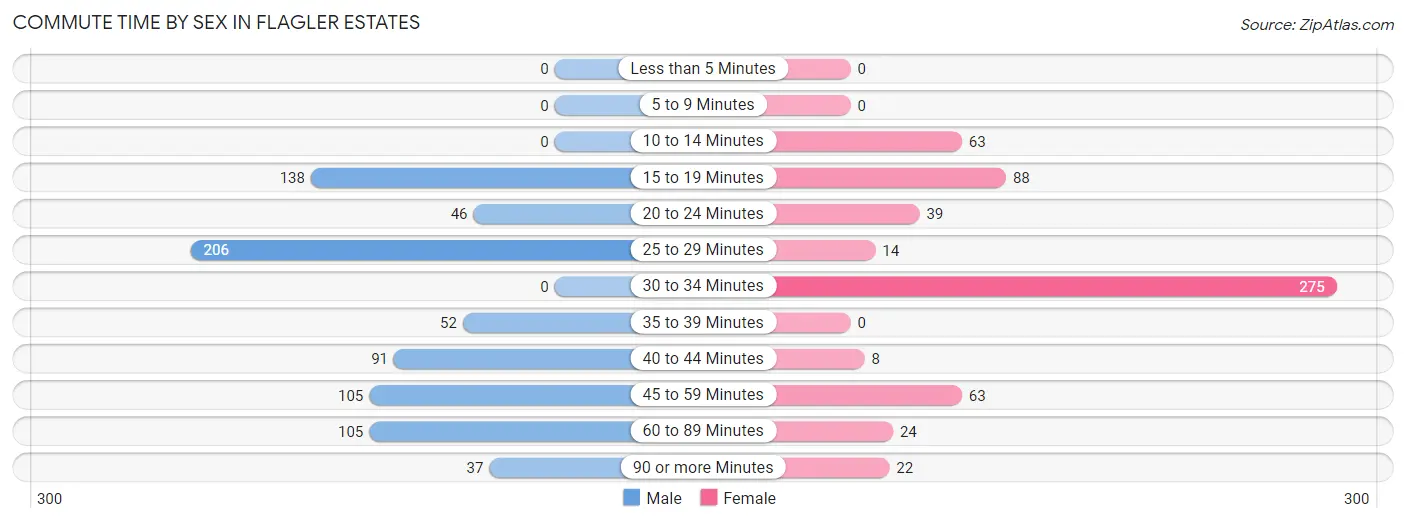
| Commute Time | Male | Female |
| Less than 5 Minutes | 0 (0.0%) | 0 (0.0%) |
| 5 to 9 Minutes | 0 (0.0%) | 0 (0.0%) |
| 10 to 14 Minutes | 0 (0.0%) | 63 (10.6%) |
| 15 to 19 Minutes | 138 (17.7%) | 88 (14.8%) |
| 20 to 24 Minutes | 46 (5.9%) | 39 (6.5%) |
| 25 to 29 Minutes | 206 (26.4%) | 14 (2.4%) |
| 30 to 34 Minutes | 0 (0.0%) | 275 (46.1%) |
| 35 to 39 Minutes | 52 (6.7%) | 0 (0.0%) |
| 40 to 44 Minutes | 91 (11.7%) | 8 (1.3%) |
| 45 to 59 Minutes | 105 (13.5%) | 63 (10.6%) |
| 60 to 89 Minutes | 105 (13.5%) | 24 (4.0%) |
| 90 or more Minutes | 37 (4.7%) | 22 (3.7%) |
Time of Departure to Work by Sex in Flagler Estates
The most frequent times of departure to work in Flagler Estates are 6:00 AM to 6:29 AM (217, 27.8%) for males and 7:30 AM to 7:59 AM (199, 33.4%) for females.
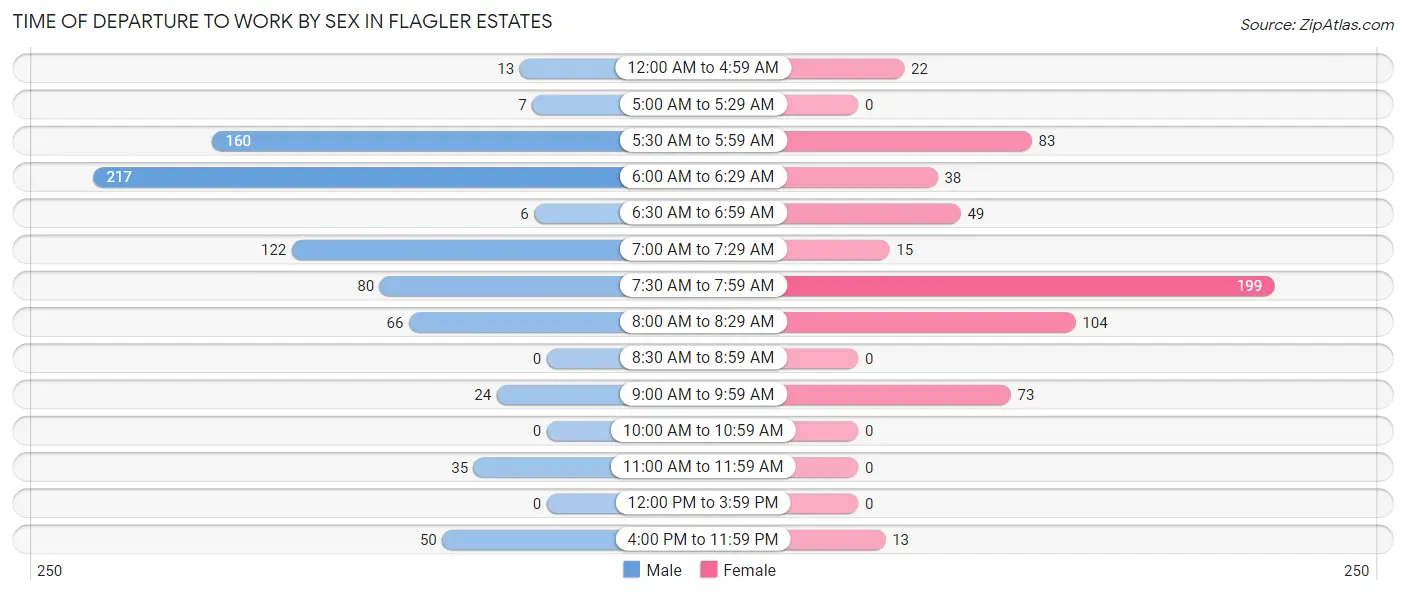
| Time of Departure | Male | Female |
| 12:00 AM to 4:59 AM | 13 (1.7%) | 22 (3.7%) |
| 5:00 AM to 5:29 AM | 7 (0.9%) | 0 (0.0%) |
| 5:30 AM to 5:59 AM | 160 (20.5%) | 83 (13.9%) |
| 6:00 AM to 6:29 AM | 217 (27.8%) | 38 (6.4%) |
| 6:30 AM to 6:59 AM | 6 (0.8%) | 49 (8.2%) |
| 7:00 AM to 7:29 AM | 122 (15.6%) | 15 (2.5%) |
| 7:30 AM to 7:59 AM | 80 (10.3%) | 199 (33.4%) |
| 8:00 AM to 8:29 AM | 66 (8.5%) | 104 (17.4%) |
| 8:30 AM to 8:59 AM | 0 (0.0%) | 0 (0.0%) |
| 9:00 AM to 9:59 AM | 24 (3.1%) | 73 (12.2%) |
| 10:00 AM to 10:59 AM | 0 (0.0%) | 0 (0.0%) |
| 11:00 AM to 11:59 AM | 35 (4.5%) | 0 (0.0%) |
| 12:00 PM to 3:59 PM | 0 (0.0%) | 0 (0.0%) |
| 4:00 PM to 11:59 PM | 50 (6.4%) | 13 (2.2%) |
| Total | 780 (100.0%) | 596 (100.0%) |
Housing Occupancy in Flagler Estates
Occupancy by Ownership in Flagler Estates
Of the total 1,439 dwellings in Flagler Estates, owner-occupied units account for 1,112 (77.3%), while renter-occupied units make up 327 (22.7%).
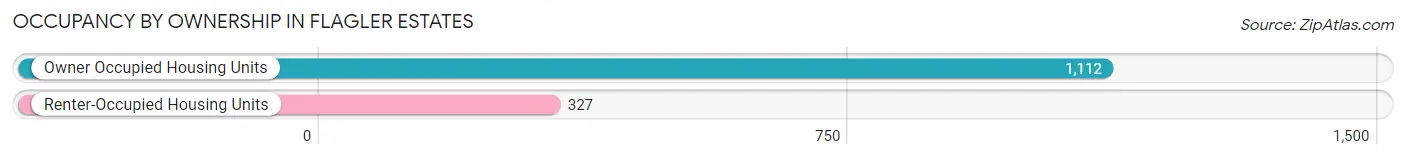
| Occupancy | # Housing Units | % Housing Units |
| Owner Occupied Housing Units | 1,112 | 77.3% |
| Renter-Occupied Housing Units | 327 | 22.7% |
| Total Occupied Housing Units | 1,439 | 100.0% |
Occupancy by Household Size in Flagler Estates
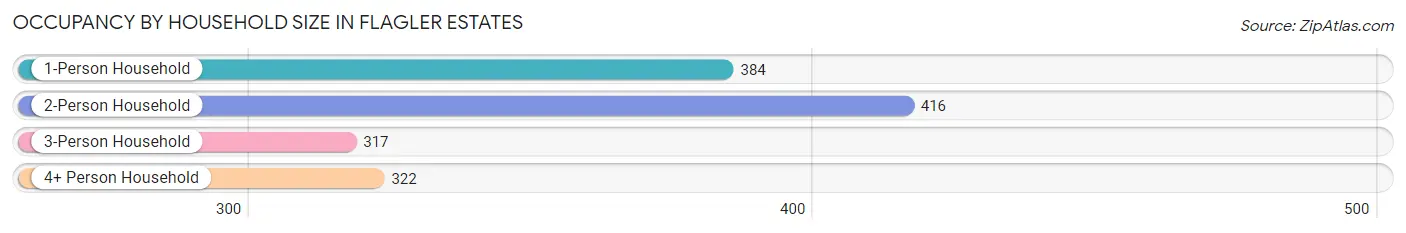
| Household Size | # Housing Units | % Housing Units |
| 1-Person Household | 384 | 26.7% |
| 2-Person Household | 416 | 28.9% |
| 3-Person Household | 317 | 22.0% |
| 4+ Person Household | 322 | 22.4% |
| Total Housing Units | 1,439 | 100.0% |
Occupancy by Ownership by Household Size in Flagler Estates
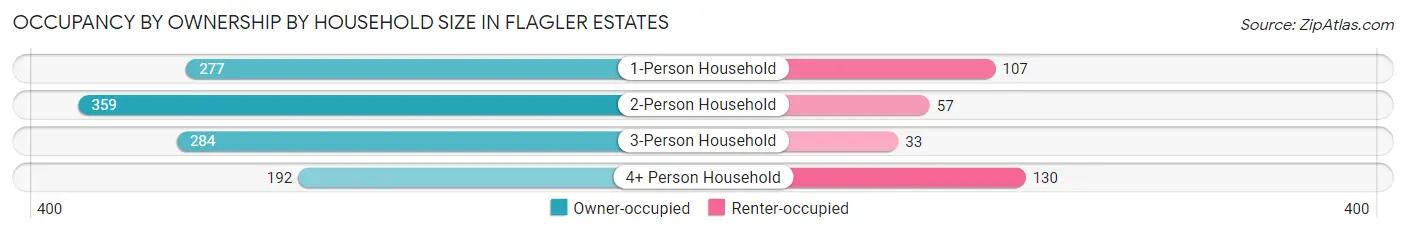
| Household Size | Owner-occupied | Renter-occupied |
| 1-Person Household | 277 (72.1%) | 107 (27.9%) |
| 2-Person Household | 359 (86.3%) | 57 (13.7%) |
| 3-Person Household | 284 (89.6%) | 33 (10.4%) |
| 4+ Person Household | 192 (59.6%) | 130 (40.4%) |
| Total Housing Units | 1,112 (77.3%) | 327 (22.7%) |
Occupancy by Educational Attainment in Flagler Estates
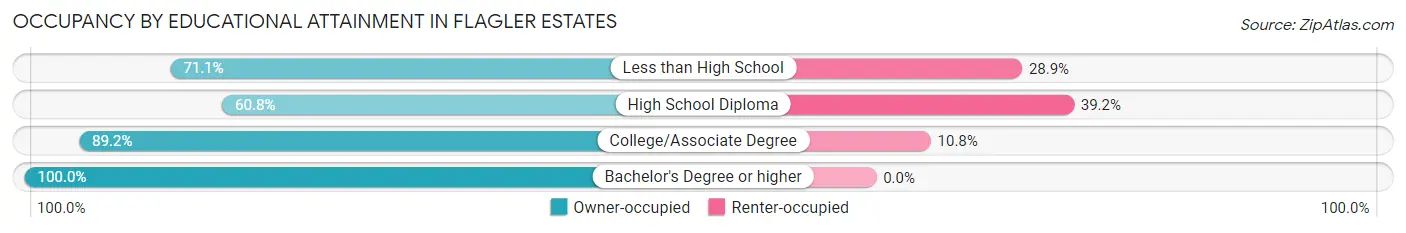
| Household Size | Owner-occupied | Renter-occupied |
| Less than High School | 187 (71.1%) | 76 (28.9%) |
| High School Diploma | 312 (60.8%) | 201 (39.2%) |
| College/Associate Degree | 413 (89.2%) | 50 (10.8%) |
| Bachelor's Degree or higher | 200 (100.0%) | 0 (0.0%) |
Occupancy by Age of Householder in Flagler Estates
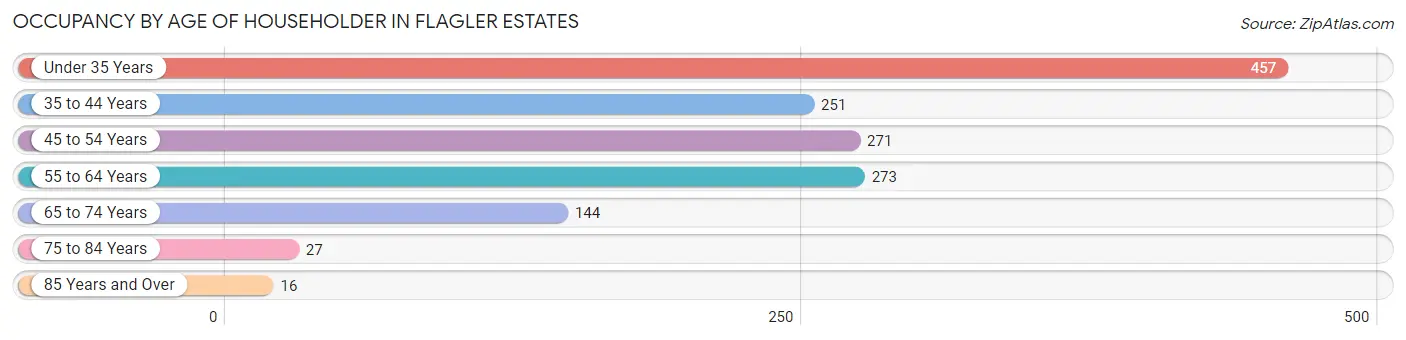
| Age Bracket | # Households | % Households |
| Under 35 Years | 457 | 31.8% |
| 35 to 44 Years | 251 | 17.4% |
| 45 to 54 Years | 271 | 18.8% |
| 55 to 64 Years | 273 | 19.0% |
| 65 to 74 Years | 144 | 10.0% |
| 75 to 84 Years | 27 | 1.9% |
| 85 Years and Over | 16 | 1.1% |
| Total | 1,439 | 100.0% |
Housing Finances in Flagler Estates
Median Income by Occupancy in Flagler Estates
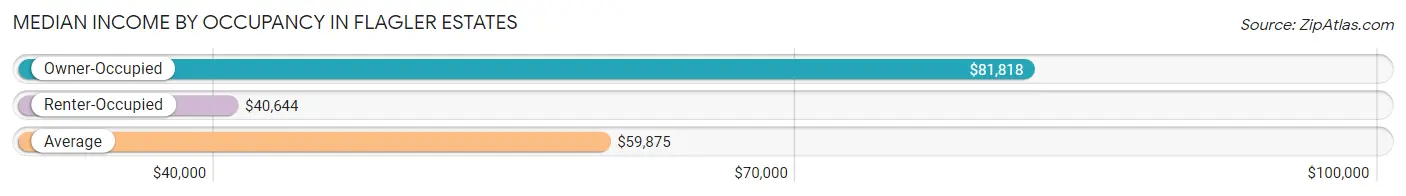
| Occupancy Type | # Households | Median Income |
| Owner-Occupied | 1,112 (77.3%) | $81,818 |
| Renter-Occupied | 327 (22.7%) | $40,644 |
| Average | 1,439 (100.0%) | $59,875 |
Occupancy by Householder Income Bracket in Flagler Estates
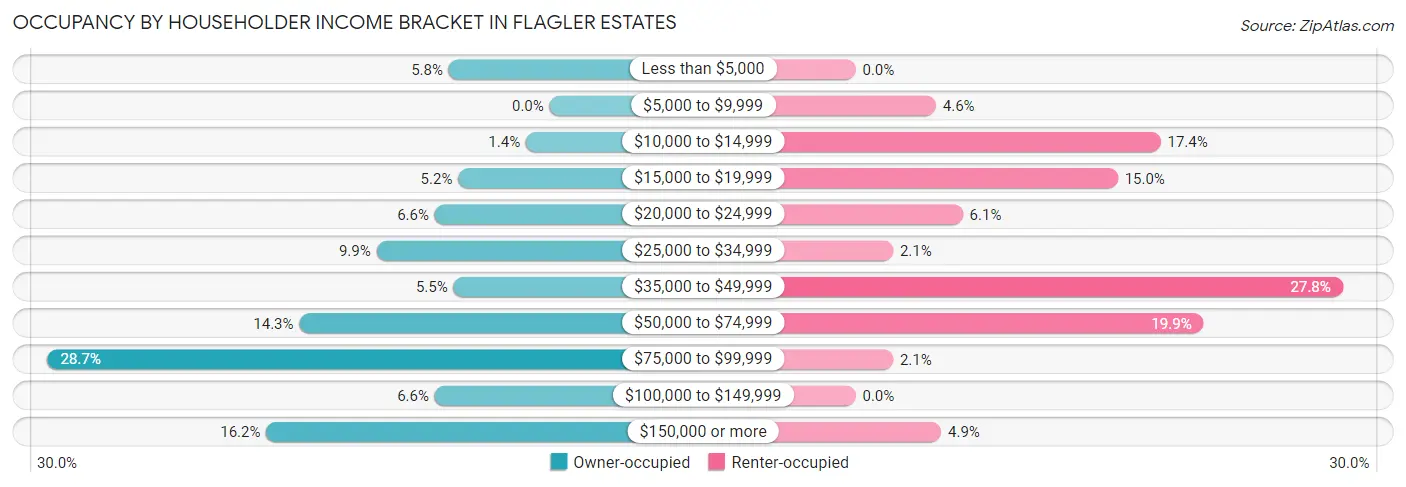
| Income Bracket | Owner-occupied | Renter-occupied |
| Less than $5,000 | 64 (5.8%) | 0 (0.0%) |
| $5,000 to $9,999 | 0 (0.0%) | 15 (4.6%) |
| $10,000 to $14,999 | 15 (1.3%) | 57 (17.4%) |
| $15,000 to $19,999 | 58 (5.2%) | 49 (15.0%) |
| $20,000 to $24,999 | 73 (6.6%) | 20 (6.1%) |
| $25,000 to $34,999 | 110 (9.9%) | 7 (2.1%) |
| $35,000 to $49,999 | 61 (5.5%) | 91 (27.8%) |
| $50,000 to $74,999 | 159 (14.3%) | 65 (19.9%) |
| $75,000 to $99,999 | 319 (28.7%) | 7 (2.1%) |
| $100,000 to $149,999 | 73 (6.6%) | 0 (0.0%) |
| $150,000 or more | 180 (16.2%) | 16 (4.9%) |
| Total | 1,112 (100.0%) | 327 (100.0%) |
Monthly Housing Cost Tiers in Flagler Estates
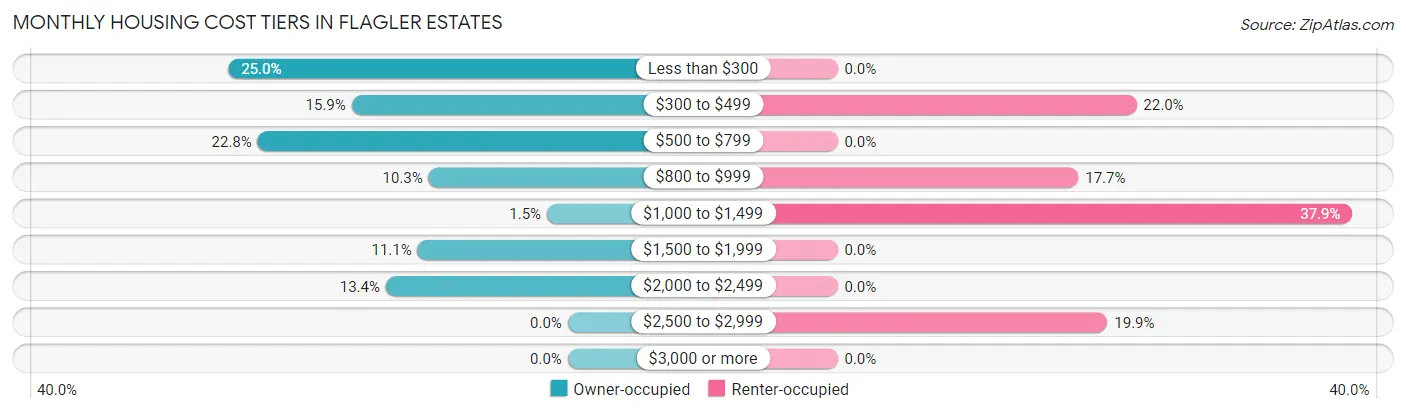
| Monthly Cost | Owner-occupied | Renter-occupied |
| Less than $300 | 278 (25.0%) | 0 (0.0%) |
| $300 to $499 | 177 (15.9%) | 72 (22.0%) |
| $500 to $799 | 254 (22.8%) | 0 (0.0%) |
| $800 to $999 | 114 (10.2%) | 58 (17.7%) |
| $1,000 to $1,499 | 17 (1.5%) | 124 (37.9%) |
| $1,500 to $1,999 | 123 (11.1%) | 0 (0.0%) |
| $2,000 to $2,499 | 149 (13.4%) | 0 (0.0%) |
| $2,500 to $2,999 | 0 (0.0%) | 65 (19.9%) |
| $3,000 or more | 0 (0.0%) | 0 (0.0%) |
| Total | 1,112 (100.0%) | 327 (100.0%) |
Physical Housing Characteristics in Flagler Estates
Housing Structures in Flagler Estates
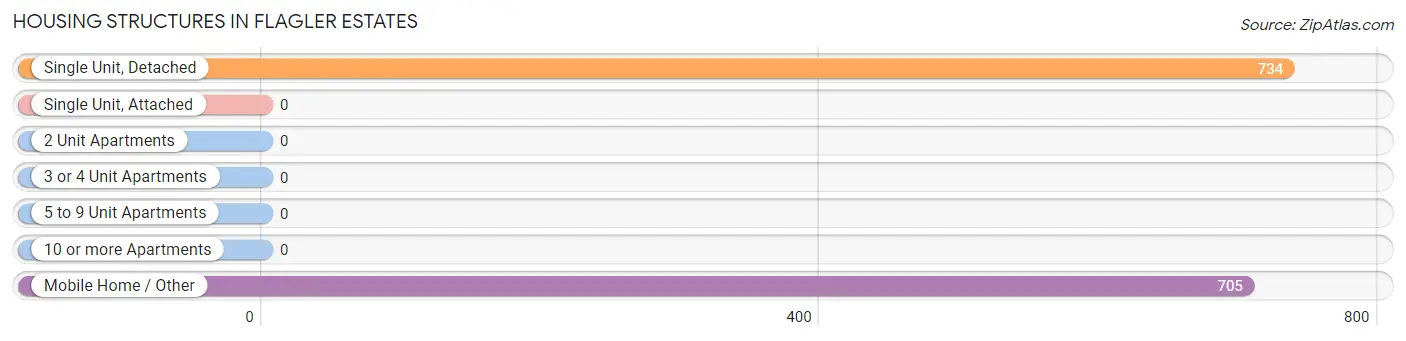
| Structure Type | # Housing Units | % Housing Units |
| Single Unit, Detached | 734 | 51.0% |
| Single Unit, Attached | 0 | 0.0% |
| 2 Unit Apartments | 0 | 0.0% |
| 3 or 4 Unit Apartments | 0 | 0.0% |
| 5 to 9 Unit Apartments | 0 | 0.0% |
| 10 or more Apartments | 0 | 0.0% |
| Mobile Home / Other | 705 | 49.0% |
| Total | 1,439 | 100.0% |
Housing Structures by Occupancy in Flagler Estates
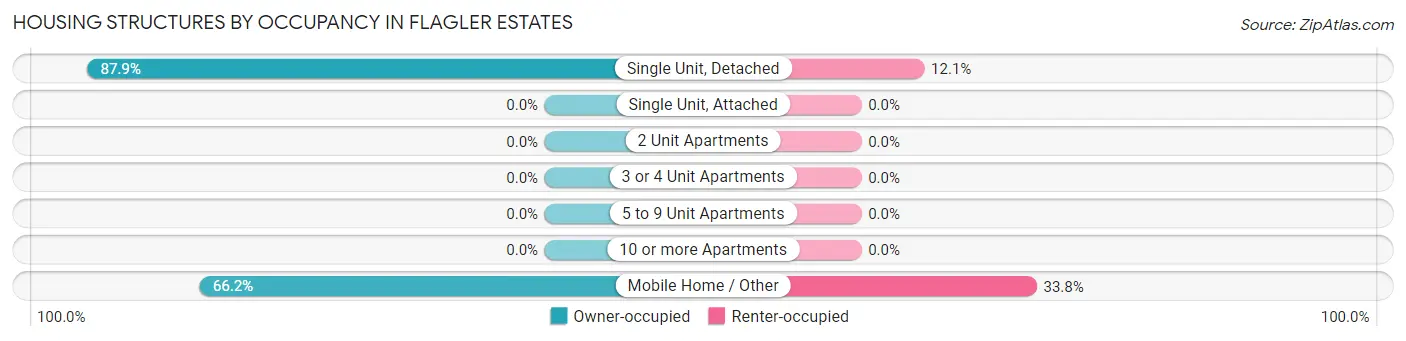
| Structure Type | Owner-occupied | Renter-occupied |
| Single Unit, Detached | 645 (87.9%) | 89 (12.1%) |
| Single Unit, Attached | 0 (0.0%) | 0 (0.0%) |
| 2 Unit Apartments | 0 (0.0%) | 0 (0.0%) |
| 3 or 4 Unit Apartments | 0 (0.0%) | 0 (0.0%) |
| 5 to 9 Unit Apartments | 0 (0.0%) | 0 (0.0%) |
| 10 or more Apartments | 0 (0.0%) | 0 (0.0%) |
| Mobile Home / Other | 467 (66.2%) | 238 (33.8%) |
| Total | 1,112 (77.3%) | 327 (22.7%) |
Housing Structures by Number of Rooms in Flagler Estates
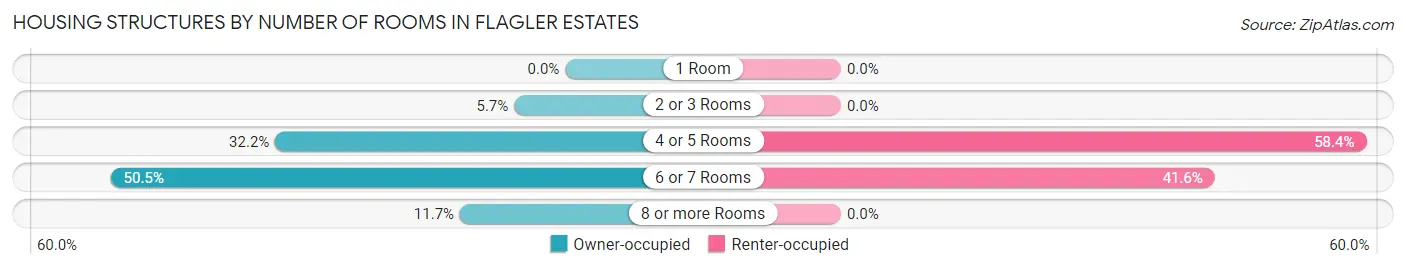
| Number of Rooms | Owner-occupied | Renter-occupied |
| 1 Room | 0 (0.0%) | 0 (0.0%) |
| 2 or 3 Rooms | 63 (5.7%) | 0 (0.0%) |
| 4 or 5 Rooms | 358 (32.2%) | 191 (58.4%) |
| 6 or 7 Rooms | 561 (50.4%) | 136 (41.6%) |
| 8 or more Rooms | 130 (11.7%) | 0 (0.0%) |
| Total | 1,112 (100.0%) | 327 (100.0%) |
Housing Structure by Heating Type in Flagler Estates
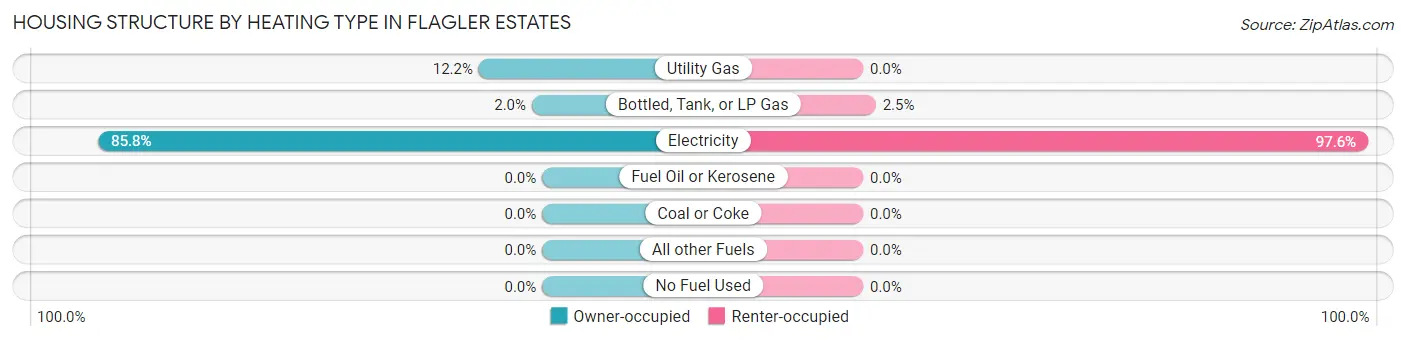
| Heating Type | Owner-occupied | Renter-occupied |
| Utility Gas | 136 (12.2%) | 0 (0.0%) |
| Bottled, Tank, or LP Gas | 22 (2.0%) | 8 (2.5%) |
| Electricity | 954 (85.8%) | 319 (97.6%) |
| Fuel Oil or Kerosene | 0 (0.0%) | 0 (0.0%) |
| Coal or Coke | 0 (0.0%) | 0 (0.0%) |
| All other Fuels | 0 (0.0%) | 0 (0.0%) |
| No Fuel Used | 0 (0.0%) | 0 (0.0%) |
| Total | 1,112 (100.0%) | 327 (100.0%) |
Household Vehicle Usage in Flagler Estates
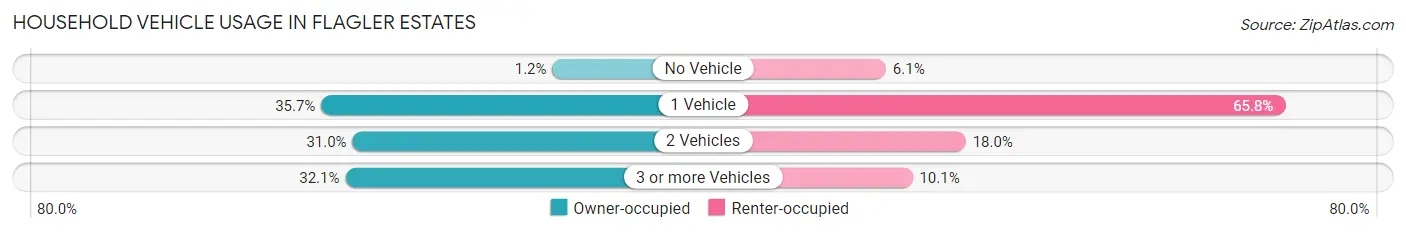
| Vehicles per Household | Owner-occupied | Renter-occupied |
| No Vehicle | 13 (1.2%) | 20 (6.1%) |
| 1 Vehicle | 397 (35.7%) | 215 (65.7%) |
| 2 Vehicles | 345 (31.0%) | 59 (18.0%) |
| 3 or more Vehicles | 357 (32.1%) | 33 (10.1%) |
| Total | 1,112 (100.0%) | 327 (100.0%) |
Real Estate & Mortgages in Flagler Estates
Real Estate and Mortgage Overview in Flagler Estates
| Characteristic | Without Mortgage | With Mortgage |
| Housing Units | 589 | 523 |
| Median Property Value | $184,400 | $195,100 |
| Median Household Income | - | - |
| Monthly Housing Costs | $307 | $0 |
| Real Estate Taxes | $1,257 | $16 |
Property Value by Mortgage Status in Flagler Estates
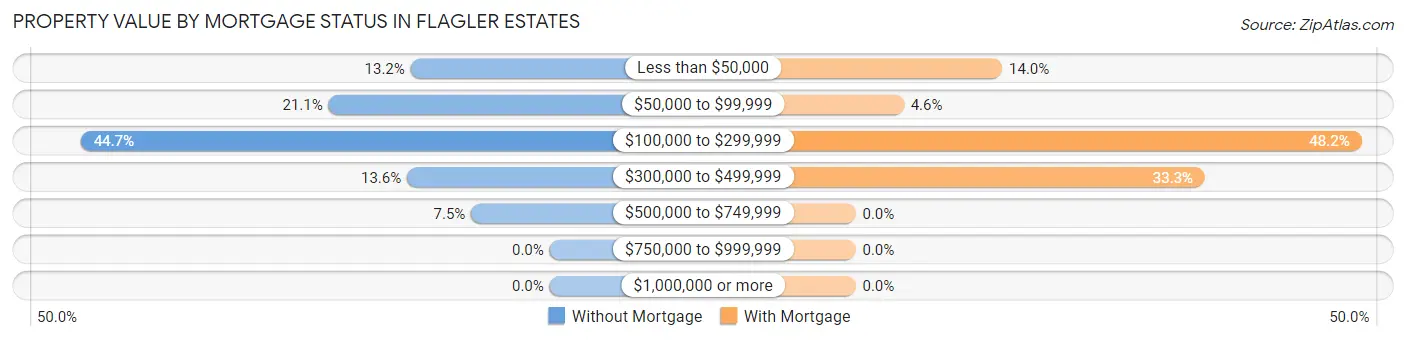
| Property Value | Without Mortgage | With Mortgage |
| Less than $50,000 | 78 (13.2%) | 73 (14.0%) |
| $50,000 to $99,999 | 124 (21.0%) | 24 (4.6%) |
| $100,000 to $299,999 | 263 (44.7%) | 252 (48.2%) |
| $300,000 to $499,999 | 80 (13.6%) | 174 (33.3%) |
| $500,000 to $749,999 | 44 (7.5%) | 0 (0.0%) |
| $750,000 to $999,999 | 0 (0.0%) | 0 (0.0%) |
| $1,000,000 or more | 0 (0.0%) | 0 (0.0%) |
| Total | 589 (100.0%) | 523 (100.0%) |
Household Income by Mortgage Status in Flagler Estates
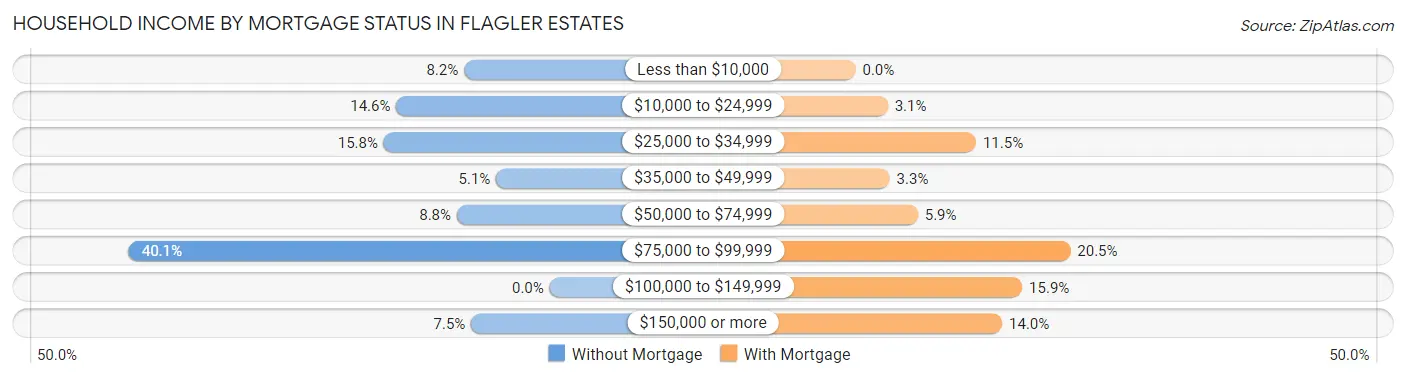
| Household Income | Without Mortgage | With Mortgage |
| Less than $10,000 | 48 (8.2%) | 0 (0.0%) |
| $10,000 to $24,999 | 86 (14.6%) | 16 (3.1%) |
| $25,000 to $34,999 | 93 (15.8%) | 60 (11.5%) |
| $35,000 to $49,999 | 30 (5.1%) | 17 (3.3%) |
| $50,000 to $74,999 | 52 (8.8%) | 31 (5.9%) |
| $75,000 to $99,999 | 236 (40.1%) | 107 (20.5%) |
| $100,000 to $149,999 | 0 (0.0%) | 83 (15.9%) |
| $150,000 or more | 44 (7.5%) | 73 (14.0%) |
| Total | 589 (100.0%) | 523 (100.0%) |
Property Value to Household Income Ratio in Flagler Estates
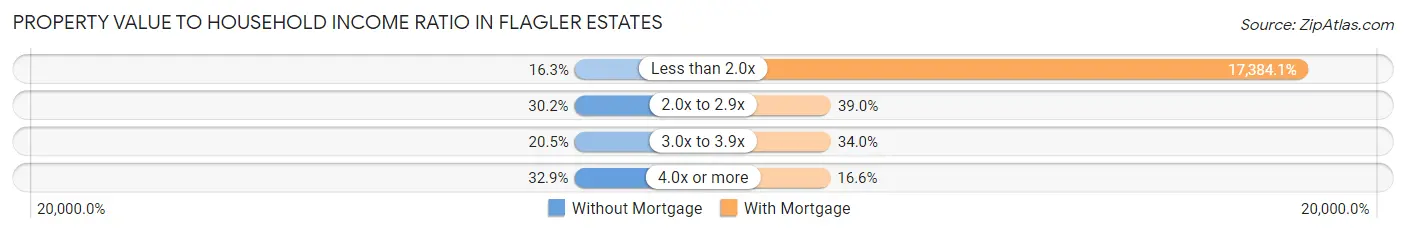
| Value-to-Income Ratio | Without Mortgage | With Mortgage |
| Less than 2.0x | 96 (16.3%) | 90,919 (17,384.1%) |
| 2.0x to 2.9x | 178 (30.2%) | 204 (39.0%) |
| 3.0x to 3.9x | 121 (20.5%) | 178 (34.0%) |
| 4.0x or more | 194 (32.9%) | 87 (16.6%) |
| Total | 589 (100.0%) | 523 (100.0%) |
Real Estate Taxes by Mortgage Status in Flagler Estates
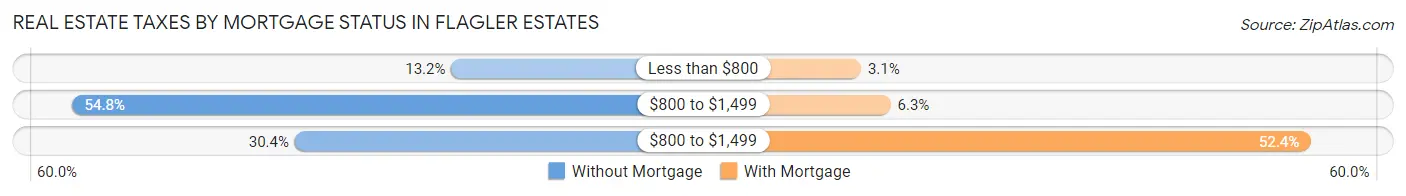
| Property Taxes | Without Mortgage | With Mortgage |
| Less than $800 | 78 (13.2%) | 16 (3.1%) |
| $800 to $1,499 | 323 (54.8%) | 33 (6.3%) |
| $800 to $1,499 | 179 (30.4%) | 274 (52.4%) |
| Total | 589 (100.0%) | 523 (100.0%) |
Health & Disability in Flagler Estates
Health Insurance Coverage by Age in Flagler Estates
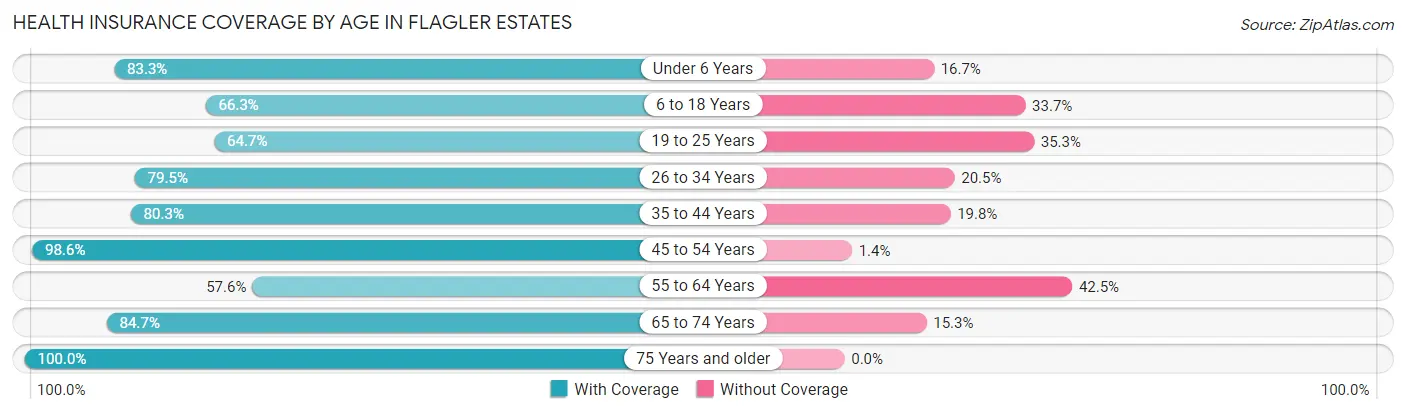
| Age Bracket | With Coverage | Without Coverage |
| Under 6 Years | 115 (83.3%) | 23 (16.7%) |
| 6 to 18 Years | 609 (66.3%) | 310 (33.7%) |
| 19 to 25 Years | 75 (64.7%) | 41 (35.3%) |
| 26 to 34 Years | 492 (79.5%) | 127 (20.5%) |
| 35 to 44 Years | 455 (80.2%) | 112 (19.8%) |
| 45 to 54 Years | 427 (98.6%) | 6 (1.4%) |
| 55 to 64 Years | 263 (57.6%) | 194 (42.4%) |
| 65 to 74 Years | 205 (84.7%) | 37 (15.3%) |
| 75 Years and older | 117 (100.0%) | 0 (0.0%) |
| Total | 2,758 (76.4%) | 850 (23.6%) |
Health Insurance Coverage by Citizenship Status in Flagler Estates
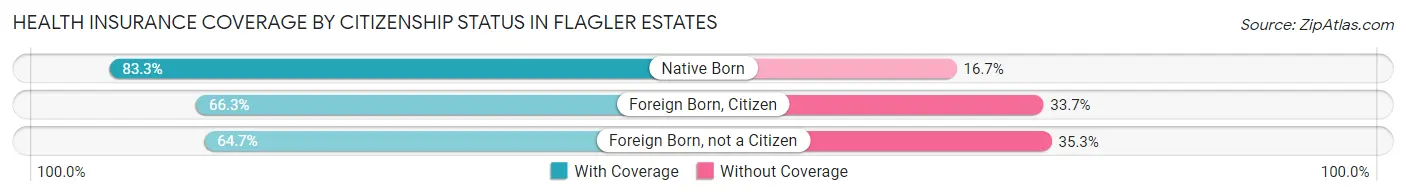
| Citizenship Status | With Coverage | Without Coverage |
| Native Born | 115 (83.3%) | 23 (16.7%) |
| Foreign Born, Citizen | 609 (66.3%) | 310 (33.7%) |
| Foreign Born, not a Citizen | 75 (64.7%) | 41 (35.3%) |
Health Insurance Coverage by Household Income in Flagler Estates
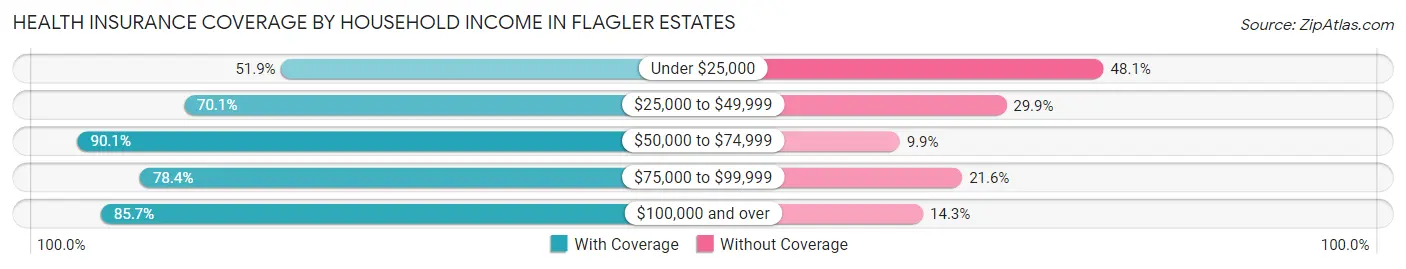
| Household Income | With Coverage | Without Coverage |
| Under $25,000 | 318 (51.9%) | 295 (48.1%) |
| $25,000 to $49,999 | 413 (70.1%) | 176 (29.9%) |
| $50,000 to $74,999 | 662 (90.1%) | 73 (9.9%) |
| $75,000 to $99,999 | 718 (78.4%) | 198 (21.6%) |
| $100,000 and over | 647 (85.7%) | 108 (14.3%) |
Public vs Private Health Insurance Coverage by Age in Flagler Estates
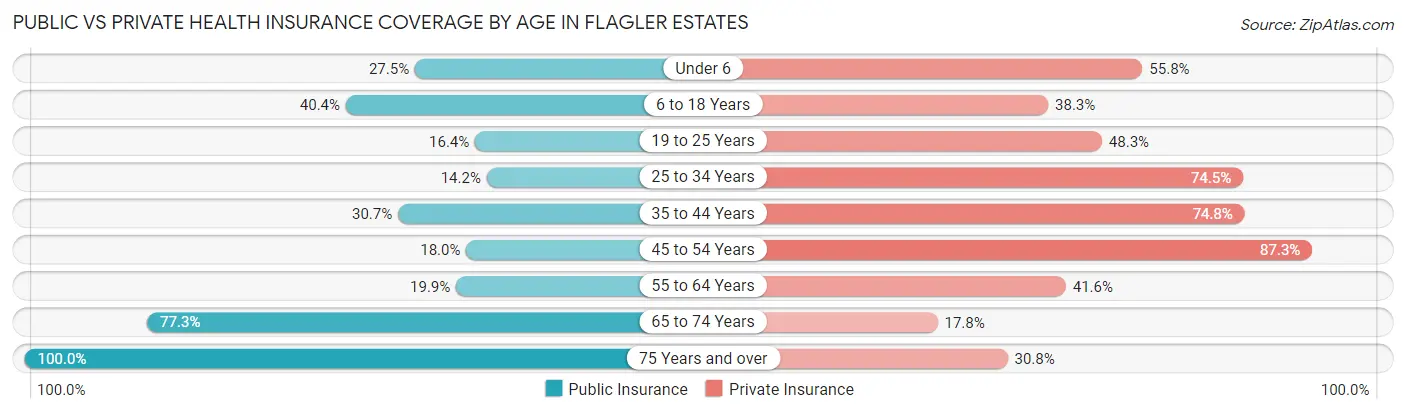
| Age Bracket | Public Insurance | Private Insurance |
| Under 6 | 38 (27.5%) | 77 (55.8%) |
| 6 to 18 Years | 371 (40.4%) | 352 (38.3%) |
| 19 to 25 Years | 19 (16.4%) | 56 (48.3%) |
| 25 to 34 Years | 88 (14.2%) | 461 (74.5%) |
| 35 to 44 Years | 174 (30.7%) | 424 (74.8%) |
| 45 to 54 Years | 78 (18.0%) | 378 (87.3%) |
| 55 to 64 Years | 91 (19.9%) | 190 (41.6%) |
| 65 to 74 Years | 187 (77.3%) | 43 (17.8%) |
| 75 Years and over | 117 (100.0%) | 36 (30.8%) |
| Total | 1,163 (32.2%) | 2,017 (55.9%) |
Disability Status by Sex by Age in Flagler Estates
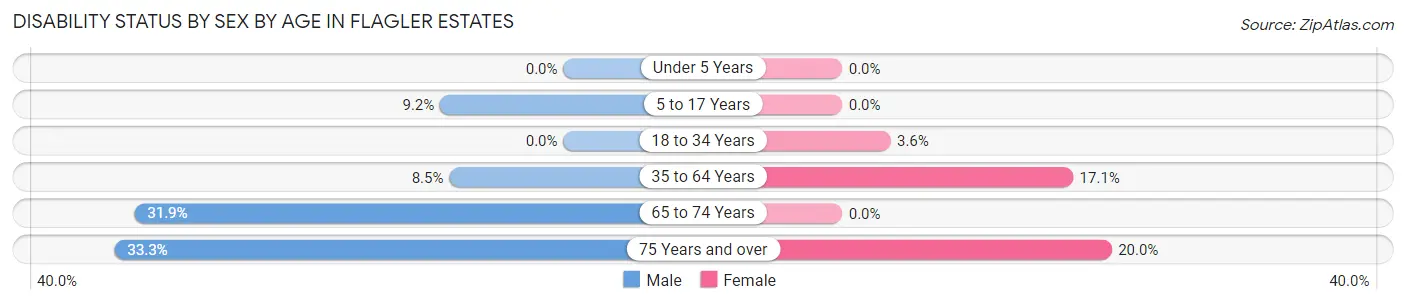
| Age Bracket | Male | Female |
| Under 5 Years | 0 (0.0%) | 0 (0.0%) |
| 5 to 17 Years | 55 (9.1%) | 0 (0.0%) |
| 18 to 34 Years | 0 (0.0%) | 19 (3.6%) |
| 35 to 64 Years | 73 (8.5%) | 102 (17.1%) |
| 65 to 74 Years | 43 (31.9%) | 0 (0.0%) |
| 75 Years and over | 9 (33.3%) | 18 (20.0%) |
Disability Class by Sex by Age in Flagler Estates
Disability Class: Hearing Difficulty
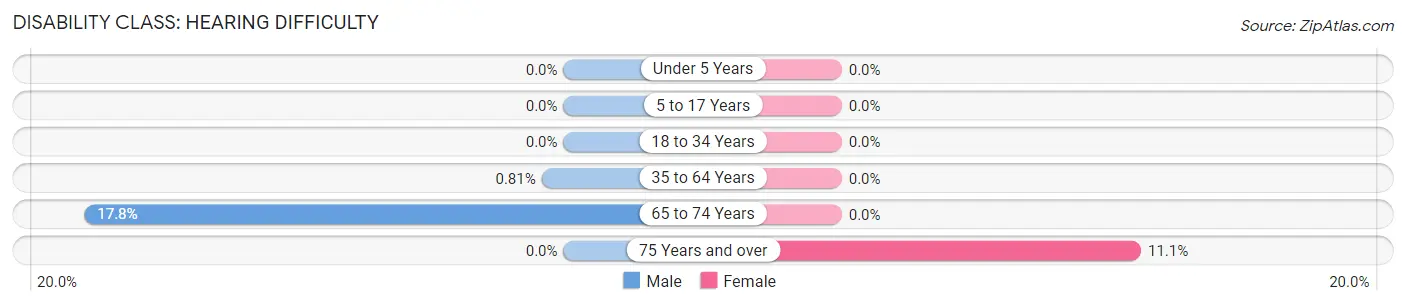
| Age Bracket | Male | Female |
| Under 5 Years | 0 (0.0%) | 0 (0.0%) |
| 5 to 17 Years | 0 (0.0%) | 0 (0.0%) |
| 18 to 34 Years | 0 (0.0%) | 0 (0.0%) |
| 35 to 64 Years | 7 (0.8%) | 0 (0.0%) |
| 65 to 74 Years | 24 (17.8%) | 0 (0.0%) |
| 75 Years and over | 0 (0.0%) | 10 (11.1%) |
Disability Class: Vision Difficulty
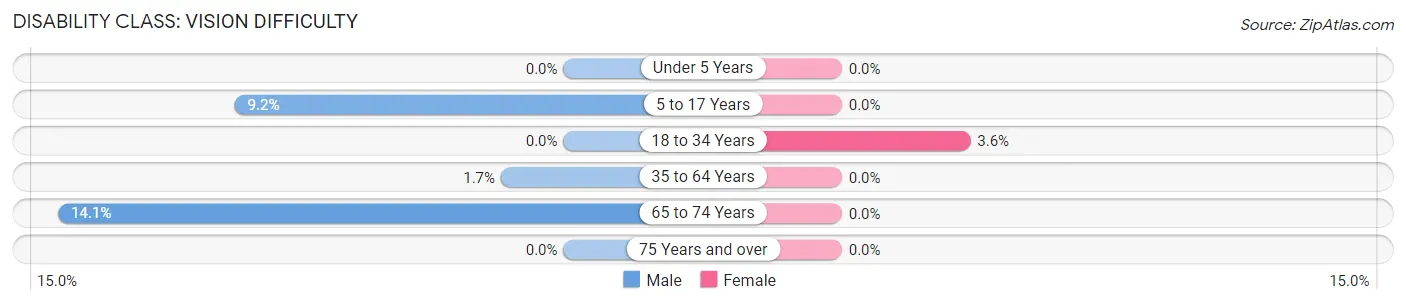
| Age Bracket | Male | Female |
| Under 5 Years | 0 (0.0%) | 0 (0.0%) |
| 5 to 17 Years | 55 (9.1%) | 0 (0.0%) |
| 18 to 34 Years | 0 (0.0%) | 19 (3.6%) |
| 35 to 64 Years | 15 (1.7%) | 0 (0.0%) |
| 65 to 74 Years | 19 (14.1%) | 0 (0.0%) |
| 75 Years and over | 0 (0.0%) | 0 (0.0%) |
Disability Class: Cognitive Difficulty
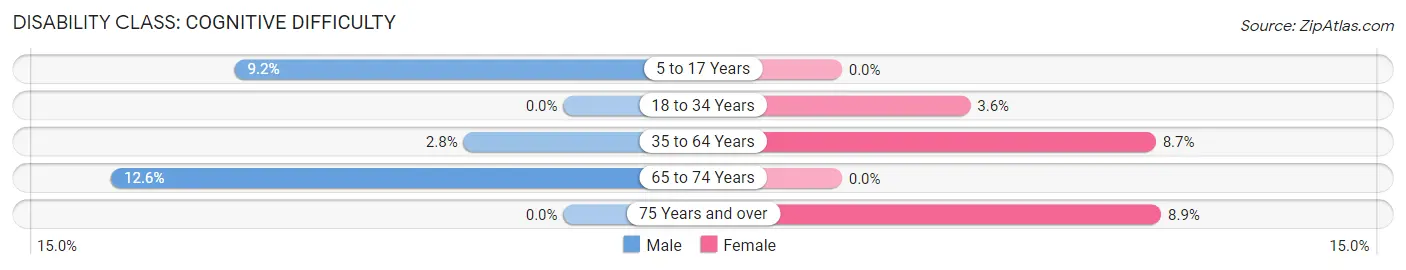
| Age Bracket | Male | Female |
| 5 to 17 Years | 55 (9.1%) | 0 (0.0%) |
| 18 to 34 Years | 0 (0.0%) | 19 (3.6%) |
| 35 to 64 Years | 24 (2.8%) | 52 (8.7%) |
| 65 to 74 Years | 17 (12.6%) | 0 (0.0%) |
| 75 Years and over | 0 (0.0%) | 8 (8.9%) |
Disability Class: Ambulatory Difficulty
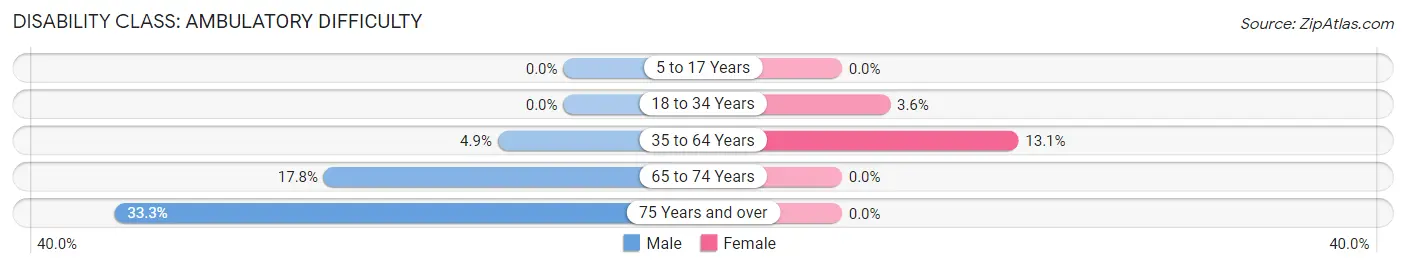
| Age Bracket | Male | Female |
| 5 to 17 Years | 0 (0.0%) | 0 (0.0%) |
| 18 to 34 Years | 0 (0.0%) | 19 (3.6%) |
| 35 to 64 Years | 42 (4.9%) | 78 (13.1%) |
| 65 to 74 Years | 24 (17.8%) | 0 (0.0%) |
| 75 Years and over | 9 (33.3%) | 0 (0.0%) |
Disability Class: Self-Care Difficulty
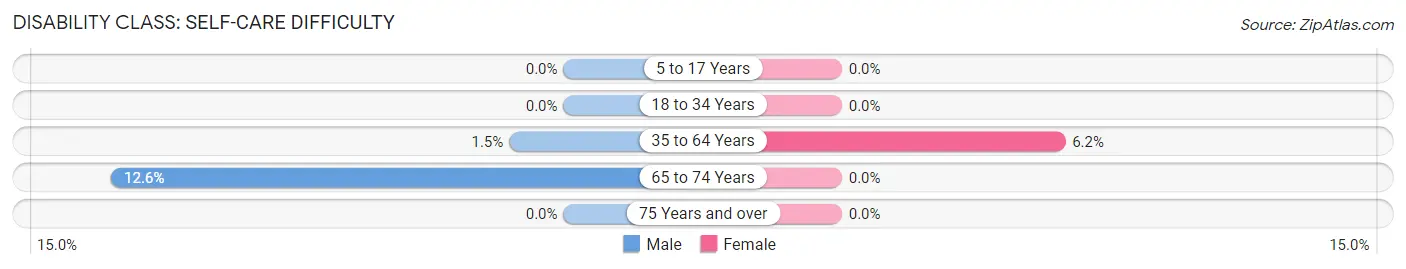
| Age Bracket | Male | Female |
| 5 to 17 Years | 0 (0.0%) | 0 (0.0%) |
| 18 to 34 Years | 0 (0.0%) | 0 (0.0%) |
| 35 to 64 Years | 13 (1.5%) | 37 (6.2%) |
| 65 to 74 Years | 17 (12.6%) | 0 (0.0%) |
| 75 Years and over | 0 (0.0%) | 0 (0.0%) |
Technology Access in Flagler Estates
Computing Device Access in Flagler Estates
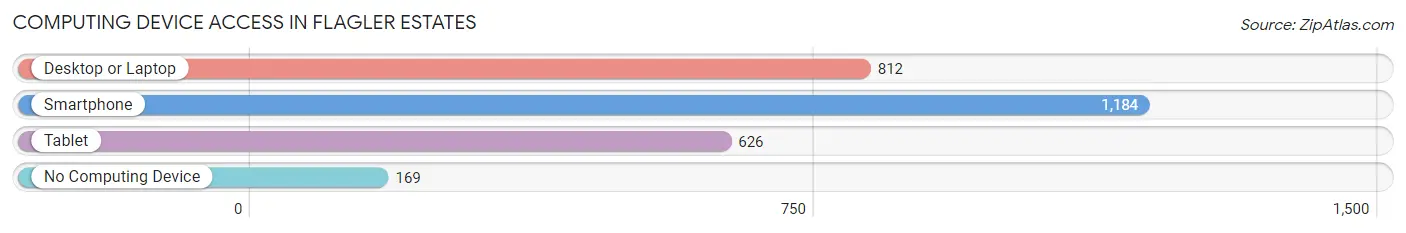
| Device Type | # Households | % Households |
| Desktop or Laptop | 812 | 56.4% |
| Smartphone | 1,184 | 82.3% |
| Tablet | 626 | 43.5% |
| No Computing Device | 169 | 11.7% |
| Total | 1,439 | 100.0% |
Internet Access in Flagler Estates
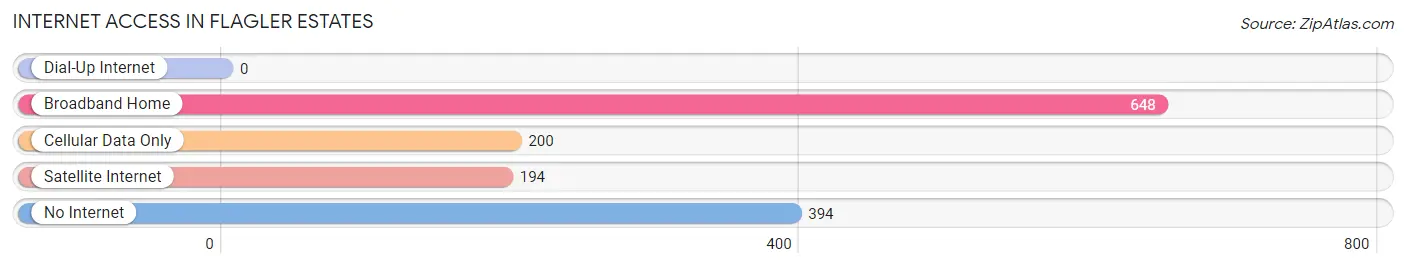
| Internet Type | # Households | % Households |
| Dial-Up Internet | 0 | 0.0% |
| Broadband Home | 648 | 45.0% |
| Cellular Data Only | 200 | 13.9% |
| Satellite Internet | 194 | 13.5% |
| No Internet | 394 | 27.4% |
| Total | 1,439 | 100.0% |
Flagler Estates Summary
Flagler Estates is an unincorporated community located in St. Johns County, Florida, United States. It is located on the eastern side of the county, just south of the city of St. Augustine. The community is bordered by the Intracoastal Waterway to the east, the St. Johns River to the south, and the Flagler County line to the west. The population of Flagler Estates was estimated to be around 2,000 in 2020.
History
Flagler Estates was originally part of a large tract of land owned by the Flagler family. The Flagler family had owned the land since the late 1800s, when Henry Flagler purchased it for his railroad. In the early 1900s, the Flagler family began to subdivide the land and sell it off to developers. The first development in Flagler Estates was the Flagler Estates subdivision, which was developed in the late 1950s. The subdivision was designed to be a rural community, with large lots and plenty of open space.
In the late 1960s, the Flagler Estates subdivision was annexed into the City of St. Augustine. This allowed the city to provide services such as water, sewer, and garbage collection to the residents of Flagler Estates. In the 1970s, the Flagler Estates subdivision was further subdivided into smaller lots, and more homes were built.
Geography
Flagler Estates is located in St. Johns County, Florida, on the eastern side of the county. It is bordered by the Intracoastal Waterway to the east, the St. Johns River to the south, and the Flagler County line to the west. The community is located approximately 20 miles south of the city of St. Augustine.
The terrain of Flagler Estates is mostly flat, with some rolling hills. The soil is sandy and well-drained, making it ideal for growing crops. The climate is subtropical, with hot summers and mild winters.
Economy
The economy of Flagler Estates is largely based on agriculture. The area is home to several farms, which produce a variety of crops, including corn, soybeans, and citrus fruits. The area is also home to several nurseries, which produce a variety of plants and flowers.
In addition to agriculture, Flagler Estates is home to several businesses, including restaurants, convenience stores, and gas stations. The area is also home to several small manufacturing companies, which produce a variety of products, including furniture, clothing, and electronics.
Demographics
The population of Flagler Estates was estimated to be around 2,000 in 2020. The population is mostly white, with a small percentage of African Americans and Hispanics. The median household income is around $50,000, and the median home value is around $150,000. The unemployment rate is around 5%, which is lower than the national average.
Flagler Estates is a rural community, with a small-town feel. The area is home to several parks and recreational areas, including the Flagler Estates Park and the Flagler Estates Nature Preserve. The area is also home to several churches, including the Flagler Estates Baptist Church and the Flagler Estates United Methodist Church.
Common Questions
What is Per Capita Income in Flagler Estates?
Per Capita income in Flagler Estates is $29,058.
What is the Median Family Income in Flagler Estates?
Median Family Income in Flagler Estates is $71,135.
What is the Median Household income in Flagler Estates?
Median Household Income in Flagler Estates is $59,875.
What is Inequality or Gini Index in Flagler Estates?
Inequality or Gini Index in Flagler Estates is 0.44.
What is the Total Population of Flagler Estates?
Total Population of Flagler Estates is 3,608.
What is the Total Male Population of Flagler Estates?
Total Male Population of Flagler Estates is 1,874.
What is the Total Female Population of Flagler Estates?
Total Female Population of Flagler Estates is 1,734.
What is the Ratio of Males per 100 Females in Flagler Estates?
There are 108.07 Males per 100 Females in Flagler Estates.
What is the Ratio of Females per 100 Males in Flagler Estates?
There are 92.53 Females per 100 Males in Flagler Estates.
What is the Median Population Age in Flagler Estates?
Median Population Age in Flagler Estates is 36.1 Years.
What is the Average Family Size in Flagler Estates
Average Family Size in Flagler Estates is 3.0 People.
What is the Average Household Size in Flagler Estates
Average Household Size in Flagler Estates is 2.5 People.
How Large is the Labor Force in Flagler Estates?
There are 1,671 People in the Labor Forcein in Flagler Estates.
What is the Percentage of People in the Labor Force in Flagler Estates?
62.3% of People are in the Labor Force in Flagler Estates.
What is the Unemployment Rate in Flagler Estates?
Unemployment Rate in Flagler Estates is 6.6%.