Pine Lakes, FL Map & Demographics
Pine Lakes Map
Pine Lakes Overview
$16,544
PER CAPITA INCOME
$73,302
AVG FAMILY INCOME
$72,509
AVG HOUSEHOLD INCOME
51.9%
WAGE / INCOME GAP [ % ]
48.1¢/ $1
WAGE / INCOME GAP [ $ ]
0.22
INEQUALITY / GINI INDEX
1,274
TOTAL POPULATION
407
MALE POPULATION
867
FEMALE POPULATION
46.94
MALES / 100 FEMALES
213.02
FEMALES / 100 MALES
20.7
MEDIAN AGE
4.9
AVG FAMILY SIZE
3.7
AVG HOUSEHOLD SIZE
583
LABOR FORCE [ PEOPLE ]
72.2%
PERCENT IN LABOR FORCE
26.4%
UNEMPLOYMENT RATE
Income in Pine Lakes
Income Overview in Pine Lakes
Per Capita Income in Pine Lakes is $16,544, while median incomes of families and households are $73,302 and $72,509 respectively.
| Characteristic | Number | Measure |
| Per Capita Income | 1,274 | $16,544 |
| Median Family Income | 224 | $73,302 |
| Mean Family Income | 224 | $64,959 |
| Median Household Income | 341 | $72,509 |
| Mean Household Income | 341 | $60,021 |
| Income Deficit | 224 | $0 |
| Wage / Income Gap (%) | 1,274 | 51.90% |
| Wage / Income Gap ($) | 1,274 | 48.10¢ per $1 |
| Gini / Inequality Index | 1,274 | 0.22 |
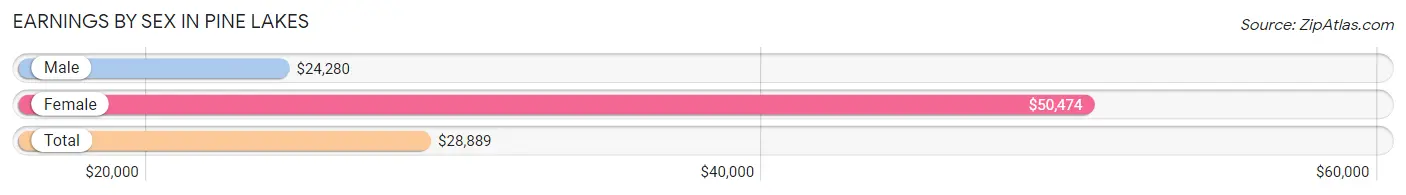
Earnings by Sex in Pine Lakes
Average Earnings in Pine Lakes are $28,889, $24,280 for men and $50,474 for women, a difference of 51.9%.
| Sex | Number | Average Earnings |
| Male | 248 (53.0%) | $24,280 |
| Female | 220 (47.0%) | $50,474 |
| Total | 468 (100.0%) | $28,889 |
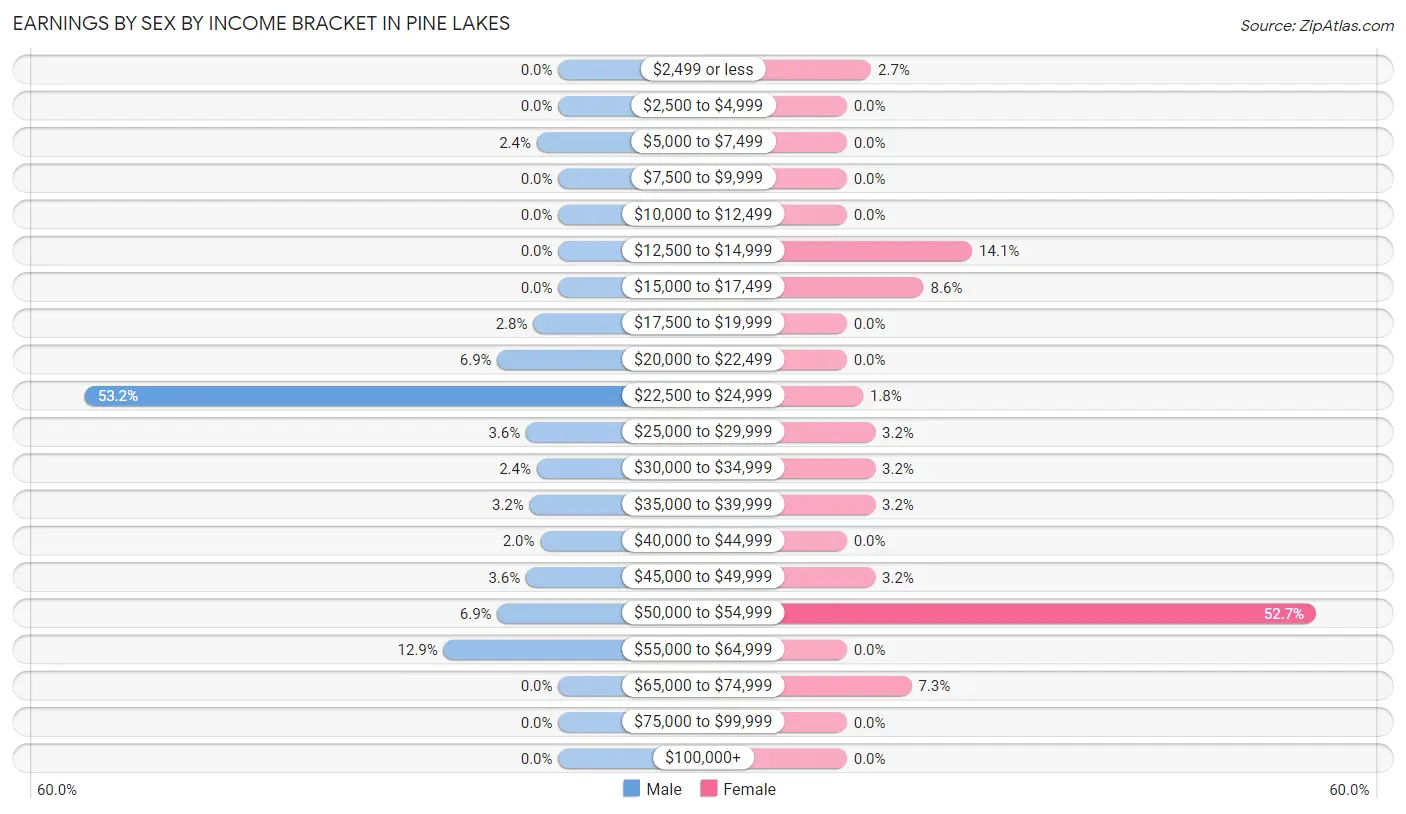
Earnings by Sex by Income Bracket in Pine Lakes
The most common earnings brackets in Pine Lakes are $22,500 to $24,999 for men (132 | 53.2%) and $50,000 to $54,999 for women (116 | 52.7%).
| Income | Male | Female |
| $2,499 or less | 0 (0.0%) | 6 (2.7%) |
| $2,500 to $4,999 | 0 (0.0%) | 0 (0.0%) |
| $5,000 to $7,499 | 6 (2.4%) | 0 (0.0%) |
| $7,500 to $9,999 | 0 (0.0%) | 0 (0.0%) |
| $10,000 to $12,499 | 0 (0.0%) | 0 (0.0%) |
| $12,500 to $14,999 | 0 (0.0%) | 31 (14.1%) |
| $15,000 to $17,499 | 0 (0.0%) | 19 (8.6%) |
| $17,500 to $19,999 | 7 (2.8%) | 0 (0.0%) |
| $20,000 to $22,499 | 17 (6.9%) | 0 (0.0%) |
| $22,500 to $24,999 | 132 (53.2%) | 4 (1.8%) |
| $25,000 to $29,999 | 9 (3.6%) | 7 (3.2%) |
| $30,000 to $34,999 | 6 (2.4%) | 7 (3.2%) |
| $35,000 to $39,999 | 8 (3.2%) | 7 (3.2%) |
| $40,000 to $44,999 | 5 (2.0%) | 0 (0.0%) |
| $45,000 to $49,999 | 9 (3.6%) | 7 (3.2%) |
| $50,000 to $54,999 | 17 (6.9%) | 116 (52.7%) |
| $55,000 to $64,999 | 32 (12.9%) | 0 (0.0%) |
| $65,000 to $74,999 | 0 (0.0%) | 16 (7.3%) |
| $75,000 to $99,999 | 0 (0.0%) | 0 (0.0%) |
| $100,000+ | 0 (0.0%) | 0 (0.0%) |
| Total | 248 (100.0%) | 220 (100.0%) |
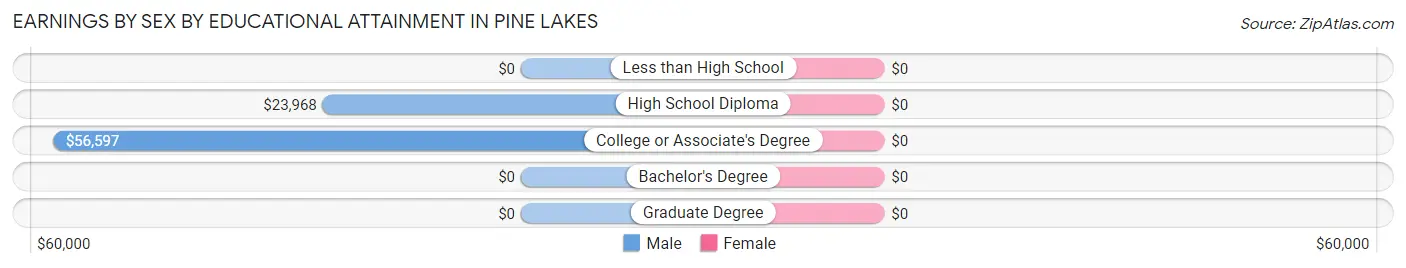
Earnings by Sex by Educational Attainment in Pine Lakes
| Educational Attainment | Male Income | Female Income |
| Less than High School | - | - |
| High School Diploma | $23,968 | $0 |
| College or Associate's Degree | $56,597 | $0 |
| Bachelor's Degree | - | - |
| Graduate Degree | - | - |
| Total | $24,508 | $50,808 |
Family Income in Pine Lakes
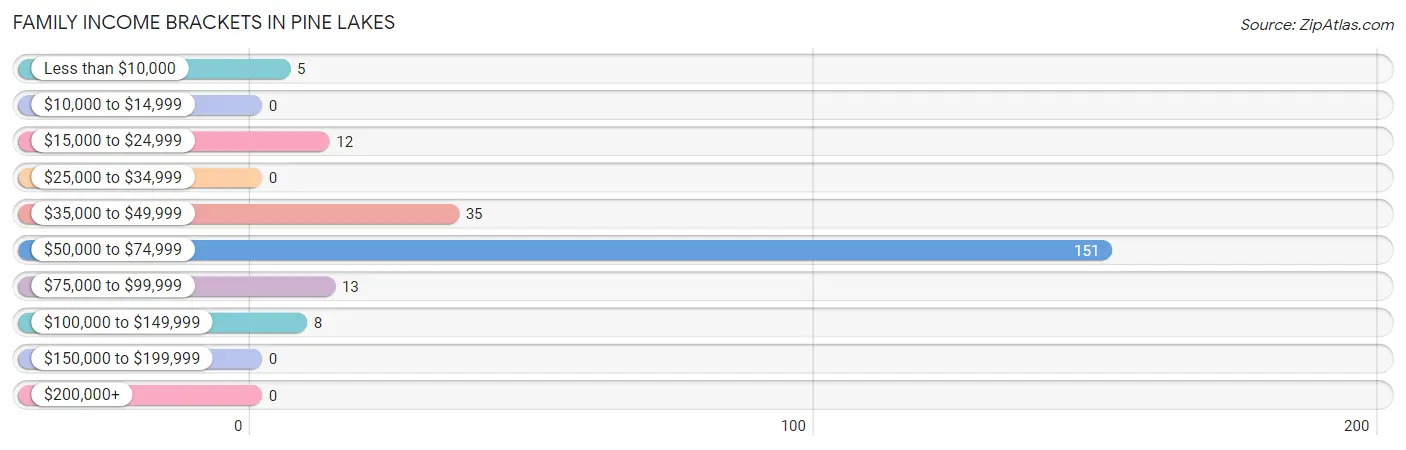
Family Income Brackets in Pine Lakes
According to the Pine Lakes family income data, there are 151 families falling into the $50,000 to $74,999 income range, which is the most common income bracket and makes up 67.4% of all families.
| Income Bracket | # Families | % Families |
| Less than $10,000 | 5 | 2.2% |
| $10,000 to $14,999 | 0 | 0.0% |
| $15,000 to $24,999 | 12 | 5.4% |
| $25,000 to $34,999 | 0 | 0.0% |
| $35,000 to $49,999 | 35 | 15.6% |
| $50,000 to $74,999 | 151 | 67.4% |
| $75,000 to $99,999 | 13 | 5.8% |
| $100,000 to $149,999 | 8 | 3.6% |
| $150,000 to $199,999 | 0 | 0.0% |
| $200,000+ | 0 | 0.0% |
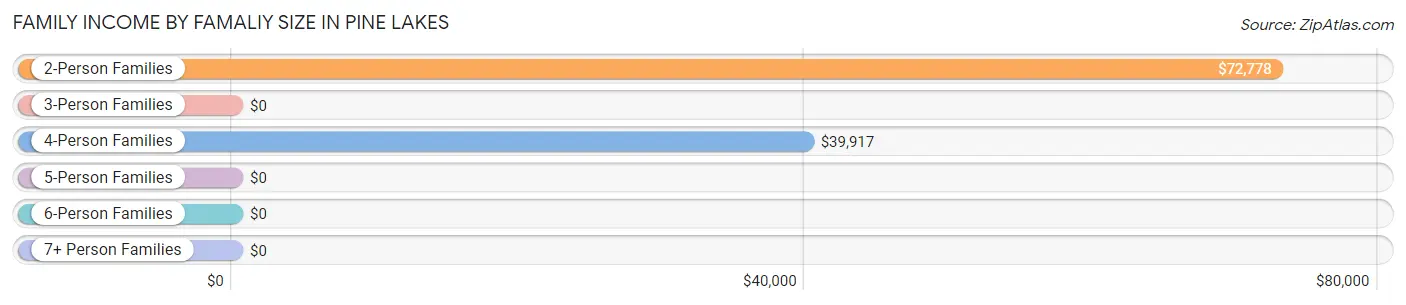
Family Income by Famaliy Size in Pine Lakes
2-person families (60 | 26.8%) account for the highest median family income in Pine Lakes with $72,778 per family, while 2-person families (60 | 26.8%) have the highest median income of $36,389 per family member.
| Income Bracket | # Families | Median Income |
| 2-Person Families | 60 (26.8%) | $72,778 |
| 3-Person Families | 6 (2.7%) | $0 |
| 4-Person Families | 29 (13.0%) | $39,917 |
| 5-Person Families | 13 (5.8%) | $0 |
| 6-Person Families | 116 (51.8%) | $0 |
| 7+ Person Families | 0 (0.0%) | $0 |
| Total | 224 (100.0%) | $73,302 |
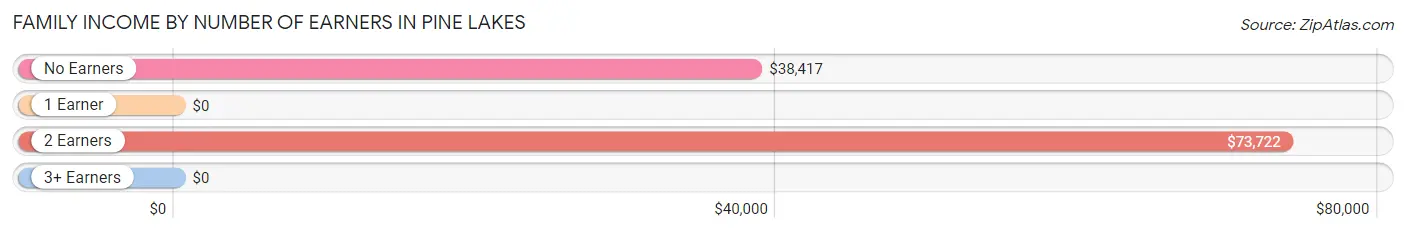
Family Income by Number of Earners in Pine Lakes
| Number of Earners | # Families | Median Income |
| No Earners | 45 (20.1%) | $38,417 |
| 1 Earner | 13 (5.8%) | $0 |
| 2 Earners | 153 (68.3%) | $73,722 |
| 3+ Earners | 13 (5.8%) | $0 |
| Total | 224 (100.0%) | $73,302 |
Household Income in Pine Lakes
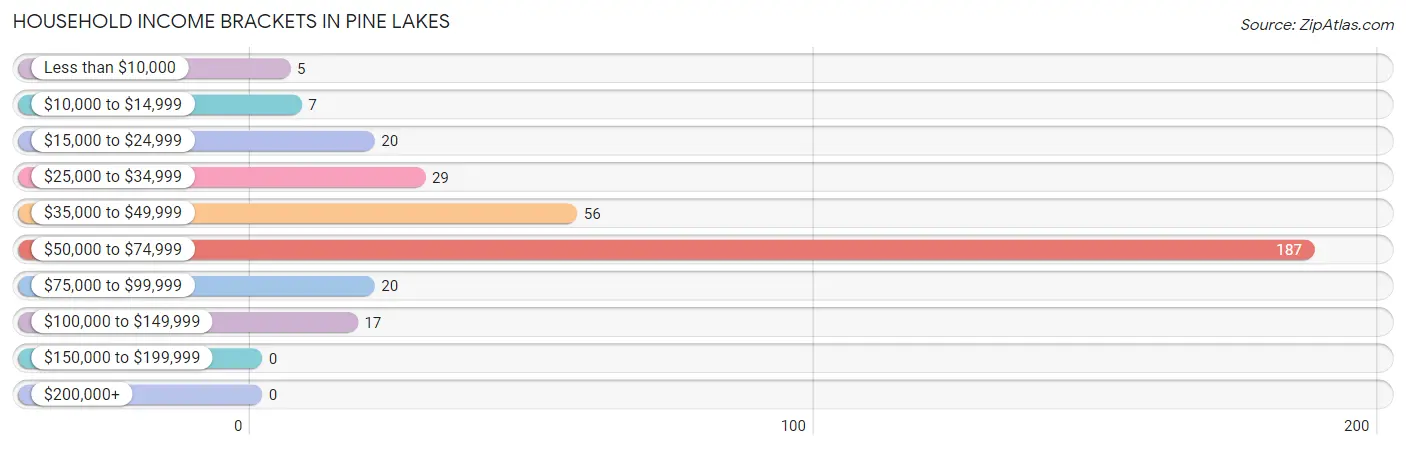
Household Income Brackets in Pine Lakes
With 187 households falling in the category, the $50,000 to $74,999 income range is the most frequent in Pine Lakes, accounting for 54.8% of all households.
| Income Bracket | # Households | % Households |
| Less than $10,000 | 5 | 1.5% |
| $10,000 to $14,999 | 7 | 2.1% |
| $15,000 to $24,999 | 20 | 5.9% |
| $25,000 to $34,999 | 29 | 8.5% |
| $35,000 to $49,999 | 56 | 16.4% |
| $50,000 to $74,999 | 187 | 54.8% |
| $75,000 to $99,999 | 20 | 5.9% |
| $100,000 to $149,999 | 17 | 5.0% |
| $150,000 to $199,999 | 0 | 0.0% |
| $200,000+ | 0 | 0.0% |
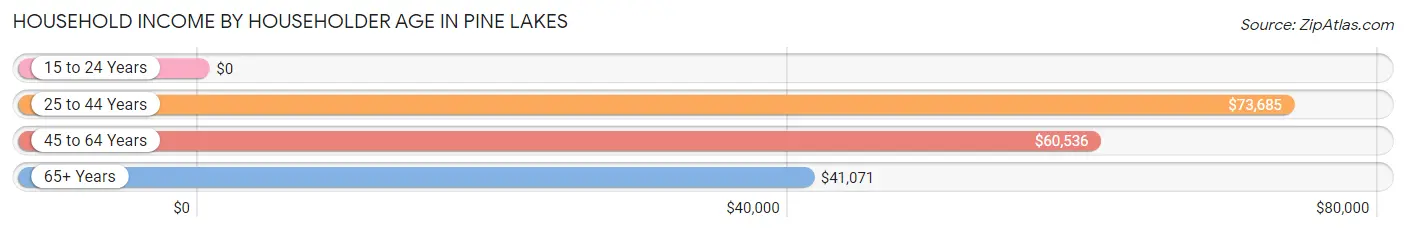
Household Income by Householder Age in Pine Lakes
The median household income in Pine Lakes is $72,509, with the highest median household income of $73,685 found in the 25 to 44 years age bracket for the primary householder. A total of 141 households (41.3%) fall into this category. Meanwhile, the 15 to 24 years age bracket for the primary householder has the lowest median household income of $0, with 17 households (5.0%) in this group.
| Income Bracket | # Households | Median Income |
| 15 to 24 Years | 17 (5.0%) | $0 |
| 25 to 44 Years | 141 (41.3%) | $73,685 |
| 45 to 64 Years | 87 (25.5%) | $60,536 |
| 65+ Years | 96 (28.1%) | $41,071 |
| Total | 341 (100.0%) | $72,509 |
Poverty in Pine Lakes
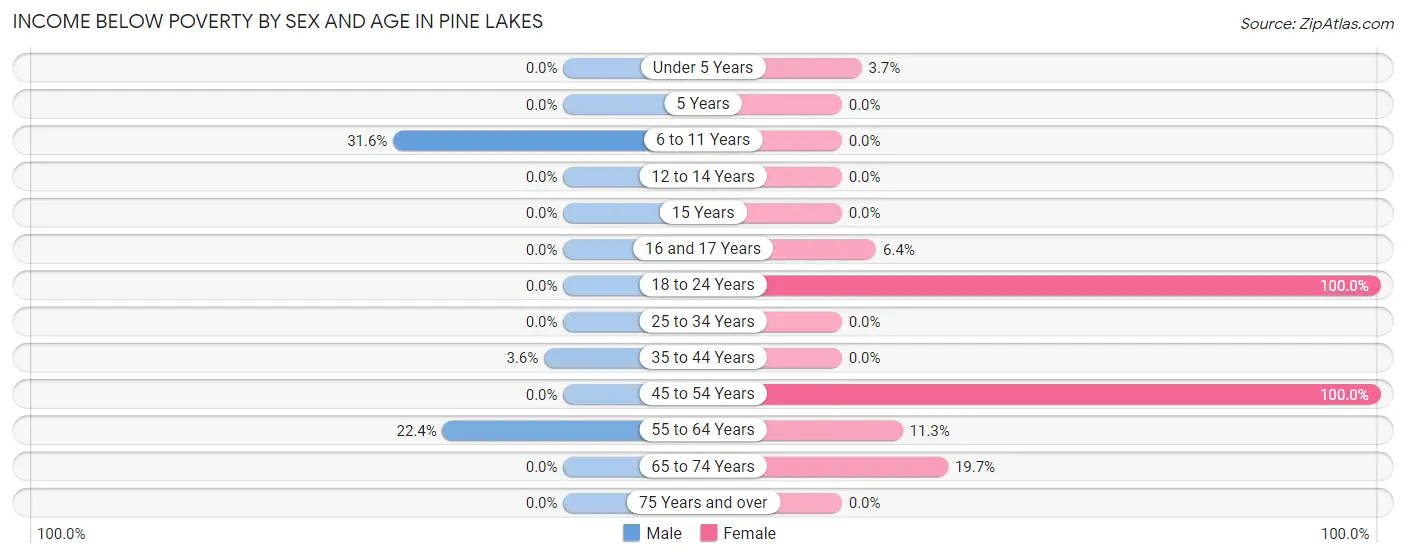
Income Below Poverty by Sex and Age in Pine Lakes
With 6.1% poverty level for males and 8.2% for females among the residents of Pine Lakes, 6 to 11 year old males and 18 to 24 year old females are the most vulnerable to poverty, with 6 males (31.6%) and 31 females (100.0%) in their respective age groups living below the poverty level.
| Age Bracket | Male | Female |
| Under 5 Years | 0 (0.0%) | 7 (3.7%) |
| 5 Years | 0 (0.0%) | 0 (0.0%) |
| 6 to 11 Years | 6 (31.6%) | 0 (0.0%) |
| 12 to 14 Years | 0 (0.0%) | 0 (0.0%) |
| 15 Years | 0 (0.0%) | 0 (0.0%) |
| 16 and 17 Years | 0 (0.0%) | 7 (6.4%) |
| 18 to 24 Years | 0 (0.0%) | 31 (100.0%) |
| 25 to 34 Years | 0 (0.0%) | 0 (0.0%) |
| 35 to 44 Years | 6 (3.6%) | 0 (0.0%) |
| 45 to 54 Years | 0 (0.0%) | 6 (100.0%) |
| 55 to 64 Years | 13 (22.4%) | 7 (11.3%) |
| 65 to 74 Years | 0 (0.0%) | 13 (19.7%) |
| 75 Years and over | 0 (0.0%) | 0 (0.0%) |
| Total | 25 (6.1%) | 71 (8.2%) |
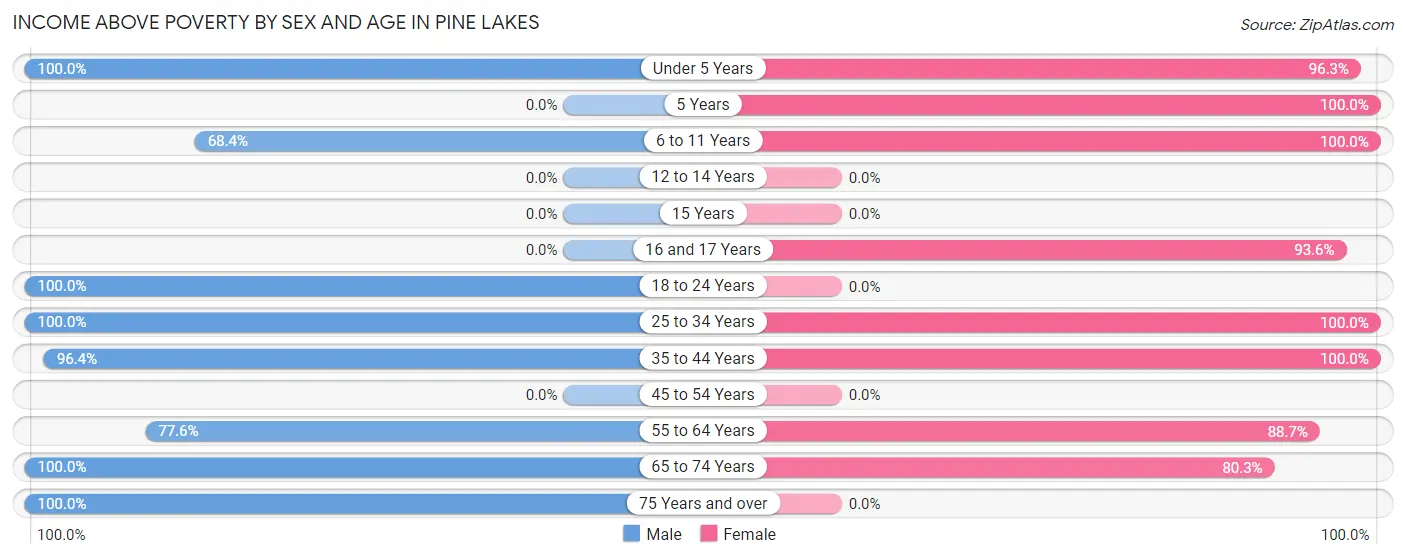
Income Above Poverty by Sex and Age in Pine Lakes
According to the poverty statistics in Pine Lakes, males aged under 5 years and females aged 5 years are the age groups that are most secure financially, with 100.0% of males and 100.0% of females in these age groups living above the poverty line.
| Age Bracket | Male | Female |
| Under 5 Years | 7 (100.0%) | 184 (96.3%) |
| 5 Years | 0 (0.0%) | 121 (100.0%) |
| 6 to 11 Years | 13 (68.4%) | 129 (100.0%) |
| 12 to 14 Years | 0 (0.0%) | 0 (0.0%) |
| 15 Years | 0 (0.0%) | 0 (0.0%) |
| 16 and 17 Years | 0 (0.0%) | 103 (93.6%) |
| 18 to 24 Years | 63 (100.0%) | 0 (0.0%) |
| 25 to 34 Years | 9 (100.0%) | 16 (100.0%) |
| 35 to 44 Years | 162 (96.4%) | 135 (100.0%) |
| 45 to 54 Years | 0 (0.0%) | 0 (0.0%) |
| 55 to 64 Years | 45 (77.6%) | 55 (88.7%) |
| 65 to 74 Years | 69 (100.0%) | 53 (80.3%) |
| 75 Years and over | 14 (100.0%) | 0 (0.0%) |
| Total | 382 (93.9%) | 796 (91.8%) |
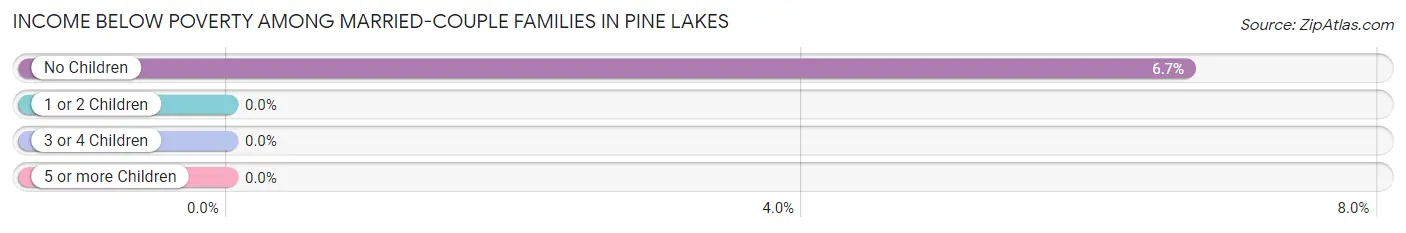
Income Below Poverty Among Married-Couple Families in Pine Lakes
The poverty statistics for married-couple families in Pine Lakes show that 2.4% or 5 of the total 205 families live below the poverty line. Families with no children have the highest poverty rate of 6.7%, comprising of 5 families. On the other hand, families with 1 or 2 children have the lowest poverty rate of 0.0%, which includes 0 families.
| Children | Above Poverty | Below Poverty |
| No Children | 70 (93.3%) | 5 (6.7%) |
| 1 or 2 Children | 14 (100.0%) | 0 (0.0%) |
| 3 or 4 Children | 116 (100.0%) | 0 (0.0%) |
| 5 or more Children | 0 (0.0%) | 0 (0.0%) |
| Total | 200 (97.6%) | 5 (2.4%) |
Income Below Poverty Among Single-Parent Households in Pine Lakes
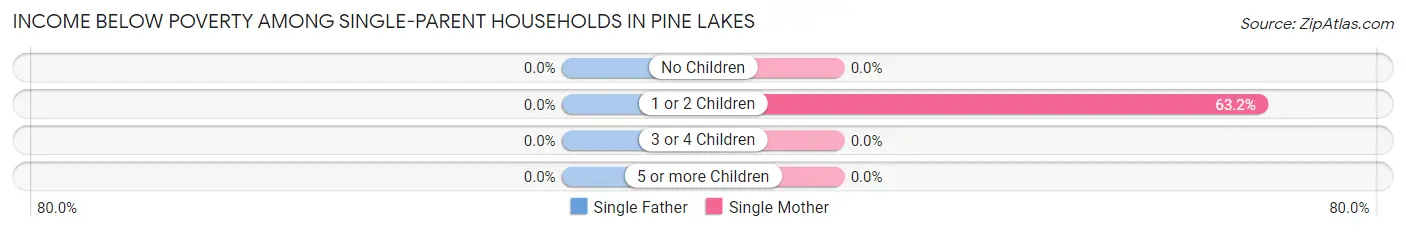
| Children | Single Father | Single Mother |
| No Children | 0 (0.0%) | 0 (0.0%) |
| 1 or 2 Children | 0 (0.0%) | 12 (63.2%) |
| 3 or 4 Children | 0 (0.0%) | 0 (0.0%) |
| 5 or more Children | 0 (0.0%) | 0 (0.0%) |
| Total | 0 (0.0%) | 12 (63.2%) |
Income Below Poverty Among Married-Couple vs Single-Parent Households in Pine Lakes
The poverty data for Pine Lakes shows that 5 of the married-couple family households (2.4%) and 12 of the single-parent households (63.2%) are living below the poverty level. Within the married-couple family households, those with no children have the highest poverty rate, with 5 households (6.7%) falling below the poverty line. Among the single-parent households, those with 1 or 2 children have the highest poverty rate, with 12 household (63.2%) living below poverty.
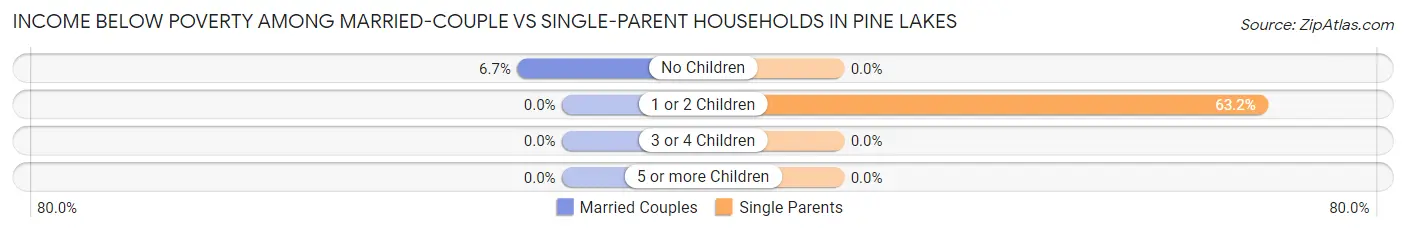
| Children | Married-Couple Families | Single-Parent Households |
| No Children | 5 (6.7%) | 0 (0.0%) |
| 1 or 2 Children | 0 (0.0%) | 12 (63.2%) |
| 3 or 4 Children | 0 (0.0%) | 0 (0.0%) |
| 5 or more Children | 0 (0.0%) | 0 (0.0%) |
| Total | 5 (2.4%) | 12 (63.2%) |
Race in Pine Lakes
The most populous races in Pine Lakes are White / Caucasian (1,197 | 94.0%), Two or more Races (77 | 6.0%), and Hispanic or Latino (38 | 3.0%).
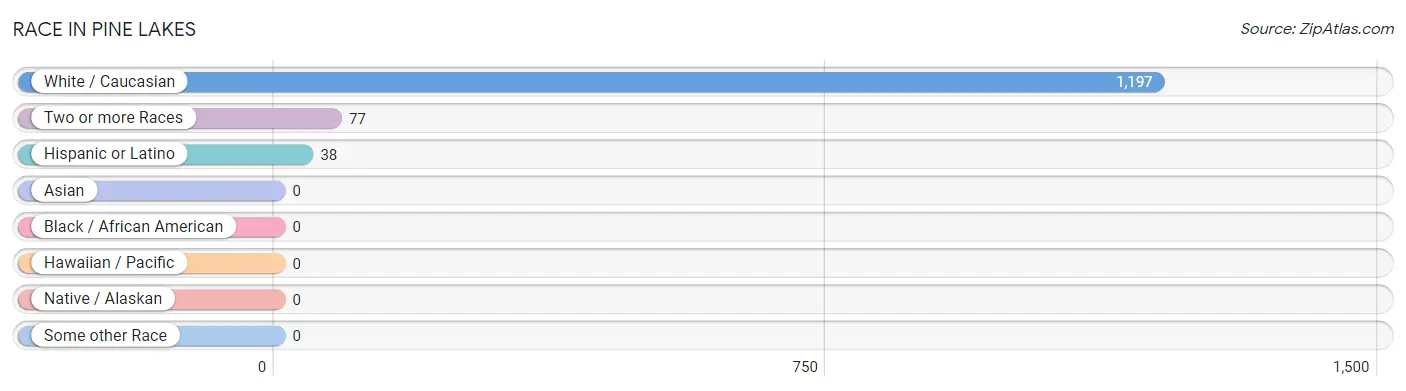
| Race | # Population | % Population |
| Asian | 0 | 0.0% |
| Black / African American | 0 | 0.0% |
| Hawaiian / Pacific | 0 | 0.0% |
| Hispanic or Latino | 38 | 3.0% |
| Native / Alaskan | 0 | 0.0% |
| White / Caucasian | 1,197 | 94.0% |
| Two or more Races | 77 | 6.0% |
| Some other Race | 0 | 0.0% |
| Total | 1,274 | 100.0% |
Ancestry in Pine Lakes
The most populous ancestries reported in Pine Lakes are English (791 | 62.1%), German (786 | 61.7%), Scottish (132 | 10.4%), Irish (128 | 10.1%), and American (46 | 3.6%), together accounting for 147.8% of all Pine Lakes residents.
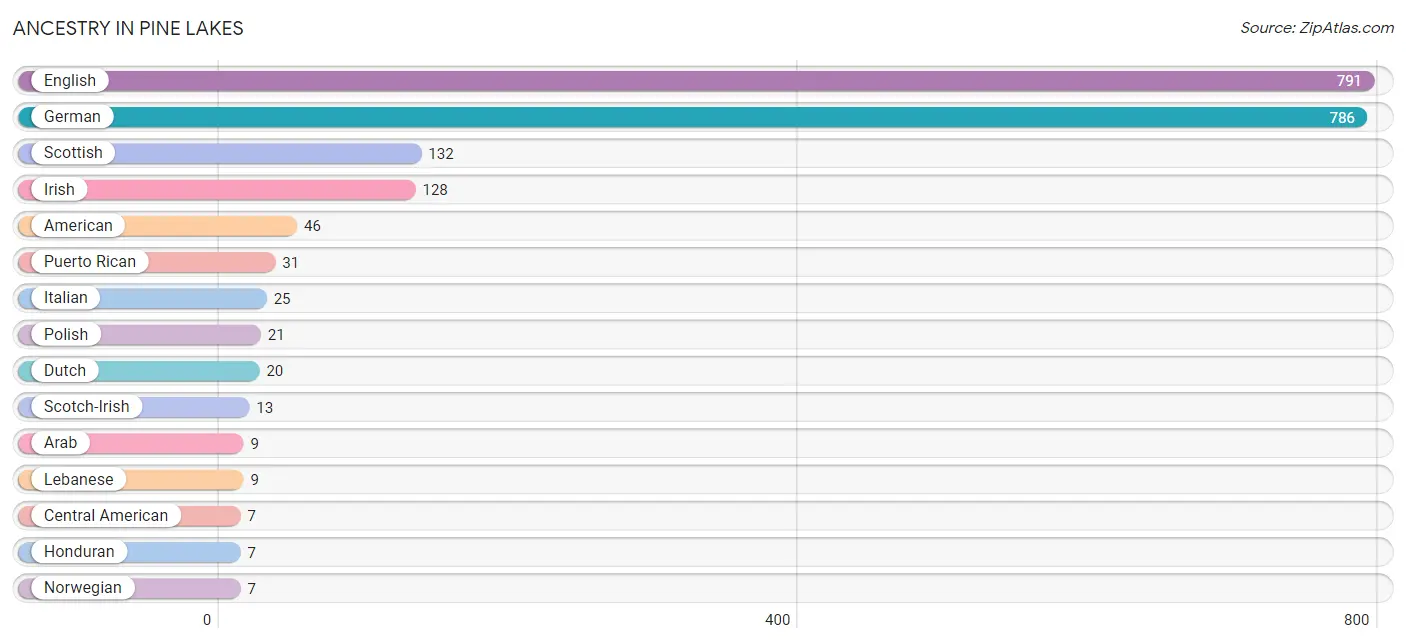
| Ancestry | # Population | % Population |
| American | 46 | 3.6% |
| Arab | 9 | 0.7% |
| Central American | 7 | 0.5% |
| Cherokee | 6 | 0.5% |
| Dutch | 20 | 1.6% |
| English | 791 | 62.1% |
| French | 6 | 0.5% |
| French Canadian | 6 | 0.5% |
| German | 786 | 61.7% |
| Honduran | 7 | 0.5% |
| Irish | 128 | 10.1% |
| Italian | 25 | 2.0% |
| Lebanese | 9 | 0.7% |
| Norwegian | 7 | 0.5% |
| Polish | 21 | 1.7% |
| Puerto Rican | 31 | 2.4% |
| Scotch-Irish | 13 | 1.0% |
| Scottish | 132 | 10.4% |
| Swedish | 7 | 0.5% |
| Welsh | 6 | 0.5% | View All 20 Rows |
Immigrants in Pine Lakes
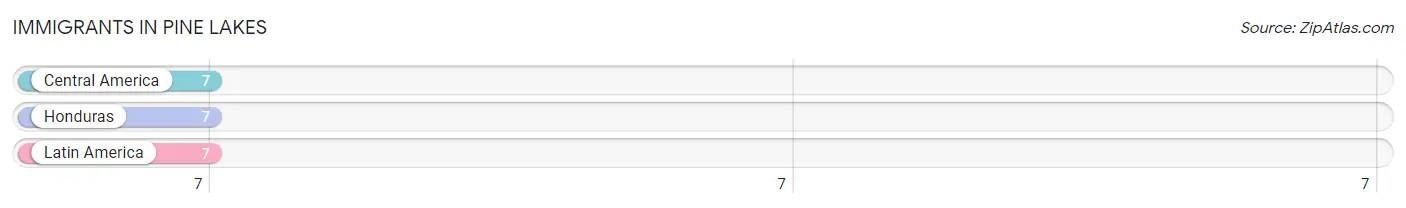
The most numerous immigrant groups reported in Pine Lakes came from Central America (7 | 0.5%), Honduras (7 | 0.5%), and Latin America (7 | 0.5%), together accounting for 1.7% of all Pine Lakes residents.
| Immigration Origin | # Population | % Population |
| Central America | 7 | 0.5% |
| Honduras | 7 | 0.5% |
| Latin America | 7 | 0.5% | View All 3 Rows |
Sex and Age in Pine Lakes
Sex and Age in Pine Lakes
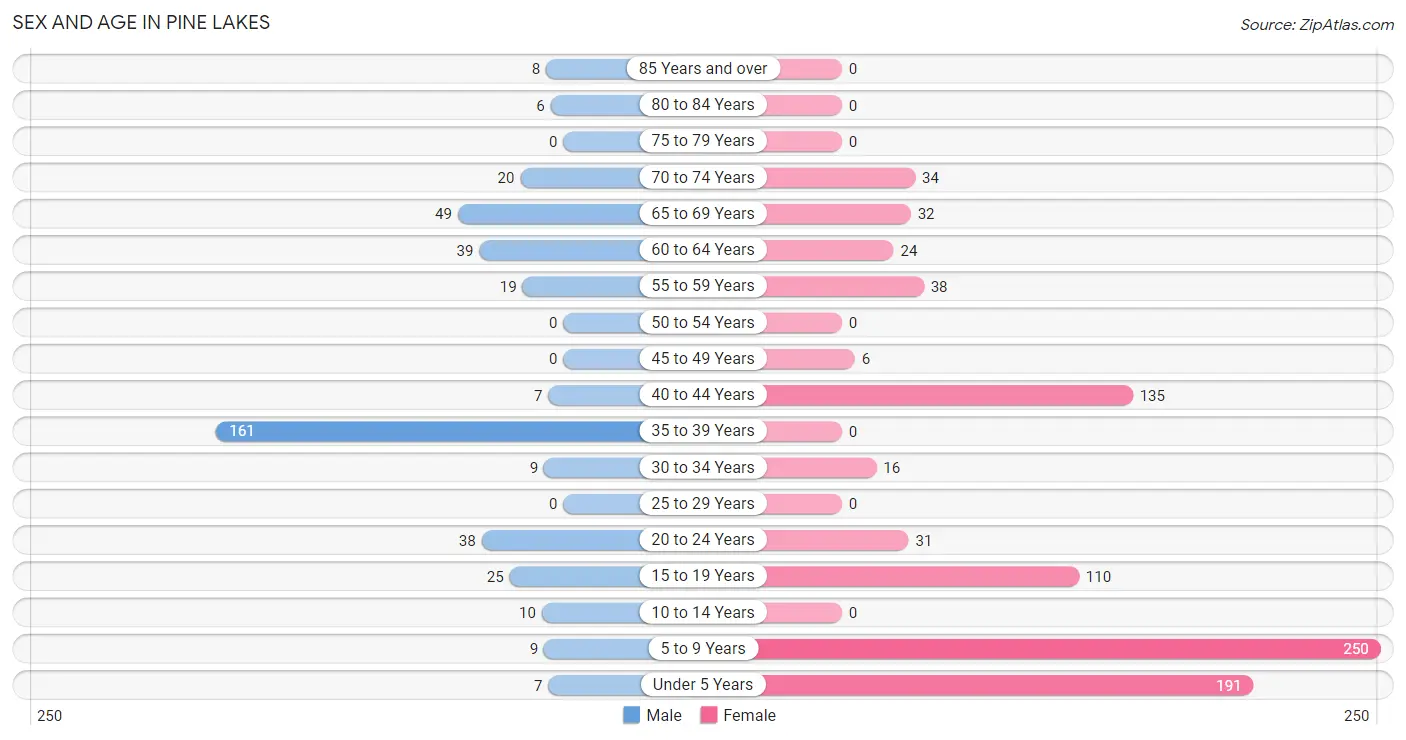
The most populous age groups in Pine Lakes are 35 to 39 Years (161 | 39.6%) for men and 5 to 9 Years (250 | 28.8%) for women.
| Age Bracket | Male | Female |
| Under 5 Years | 7 (1.7%) | 191 (22.0%) |
| 5 to 9 Years | 9 (2.2%) | 250 (28.8%) |
| 10 to 14 Years | 10 (2.5%) | 0 (0.0%) |
| 15 to 19 Years | 25 (6.1%) | 110 (12.7%) |
| 20 to 24 Years | 38 (9.3%) | 31 (3.6%) |
| 25 to 29 Years | 0 (0.0%) | 0 (0.0%) |
| 30 to 34 Years | 9 (2.2%) | 16 (1.8%) |
| 35 to 39 Years | 161 (39.6%) | 0 (0.0%) |
| 40 to 44 Years | 7 (1.7%) | 135 (15.6%) |
| 45 to 49 Years | 0 (0.0%) | 6 (0.7%) |
| 50 to 54 Years | 0 (0.0%) | 0 (0.0%) |
| 55 to 59 Years | 19 (4.7%) | 38 (4.4%) |
| 60 to 64 Years | 39 (9.6%) | 24 (2.8%) |
| 65 to 69 Years | 49 (12.0%) | 32 (3.7%) |
| 70 to 74 Years | 20 (4.9%) | 34 (3.9%) |
| 75 to 79 Years | 0 (0.0%) | 0 (0.0%) |
| 80 to 84 Years | 6 (1.5%) | 0 (0.0%) |
| 85 Years and over | 8 (2.0%) | 0 (0.0%) |
| Total | 407 (100.0%) | 867 (100.0%) |
Families and Households in Pine Lakes
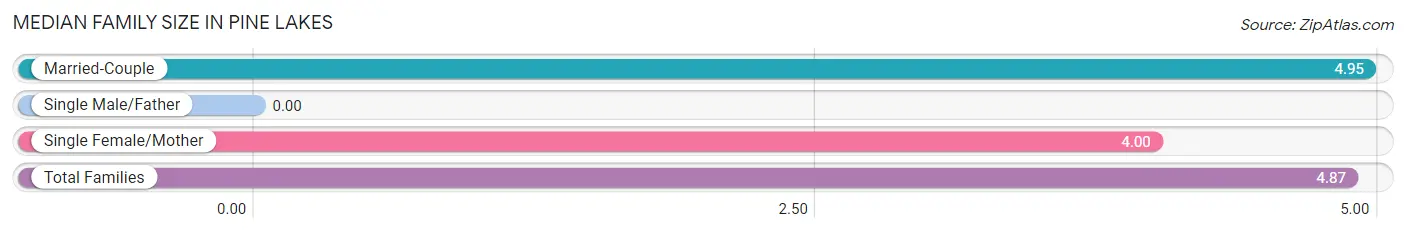
Median Family Size in Pine Lakes
| Family Type | # Families | Family Size |
| Married-Couple | 205 (91.5%) | 4.95 |
| Single Male/Father | 0 (0.0%) | - |
| Single Female/Mother | 19 (8.5%) | 4.00 |
| Total Families | 224 (100.0%) | 4.87 |
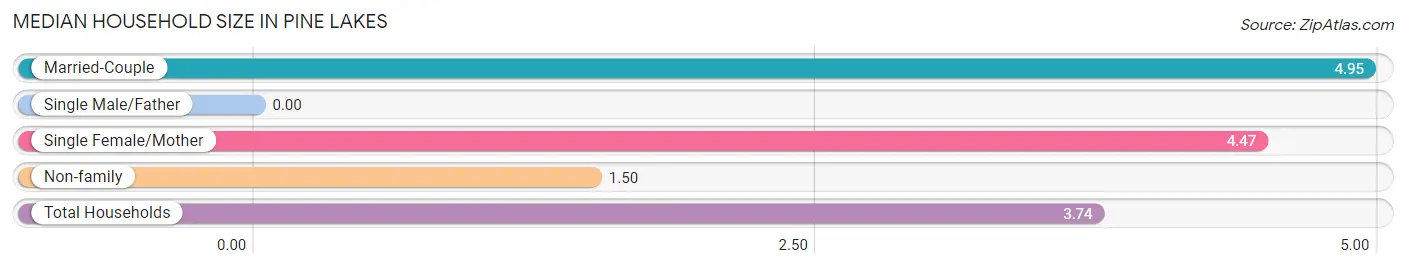
Median Household Size in Pine Lakes
| Household Type | # Households | Household Size |
| Married-Couple | 205 (60.1%) | 4.95 |
| Single Male/Father | 0 (0.0%) | - |
| Single Female/Mother | 19 (5.6%) | 4.47 |
| Non-family | 117 (34.3%) | 1.50 |
| Total Households | 341 (100.0%) | 3.74 |
Household Size by Marriage Status in Pine Lakes
Out of a total of 341 households in Pine Lakes, 224 (65.7%) are family households, while 117 (34.3%) are nonfamily households. The most numerous type of family households are 6-person households, comprising 116, and the most common type of nonfamily households are 1-person households, comprising 74.
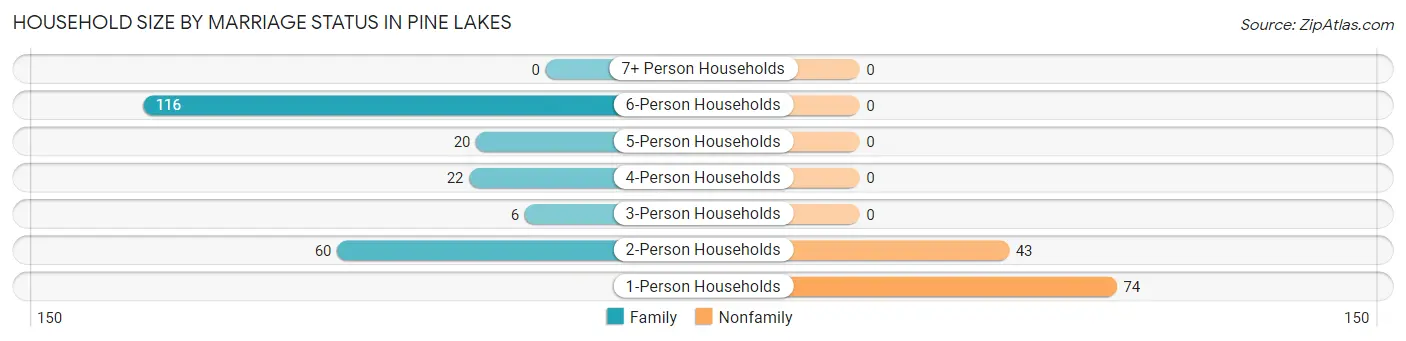
| Household Size | Family Households | Nonfamily Households |
| 1-Person Households | - | 74 (21.7%) |
| 2-Person Households | 60 (17.6%) | 43 (12.6%) |
| 3-Person Households | 6 (1.8%) | 0 (0.0%) |
| 4-Person Households | 22 (6.5%) | 0 (0.0%) |
| 5-Person Households | 20 (5.9%) | 0 (0.0%) |
| 6-Person Households | 116 (34.0%) | 0 (0.0%) |
| 7+ Person Households | 0 (0.0%) | 0 (0.0%) |
| Total | 224 (65.7%) | 117 (34.3%) |
Female Fertility in Pine Lakes
Fertility by Age in Pine Lakes
| Age Bracket | Women with Births | Births / 1,000 Women |
| 15 to 19 years | 0 (0.0%) | 0.0 |
| 20 to 34 years | 0 (0.0%) | 0.0 |
| 35 to 50 years | 0 (0.0%) | 0.0 |
| Total | 0 (0.0%) | 0.0 |
Fertility by Age by Marriage Status in Pine Lakes
| Age Bracket | Married | Unmarried |
| 15 to 19 years | 0 (0.0%) | 0 (0.0%) |
| 20 to 34 years | 0 (0.0%) | 0 (0.0%) |
| 35 to 50 years | 0 (0.0%) | 0 (0.0%) |
| Total | 0 (0.0%) | 0 (0.0%) |
Fertility by Education in Pine Lakes
| Educational Attainment | Women with Births | Births / 1,000 Women |
| Less than High School | 0 (0.0%) | 0.0 |
| High School Diploma | 0 (0.0%) | 0.0 |
| College or Associate's Degree | 0 (0.0%) | 0.0 |
| Bachelor's Degree | 0 (0.0%) | 0.0 |
| Graduate Degree | 0 (0.0%) | 0.0 |
| Total | 0 (0.0%) | 0.0 |
Fertility by Education by Marriage Status in Pine Lakes
| Educational Attainment | Married | Unmarried |
| Less than High School | 0 (0.0%) | 0 (0.0%) |
| High School Diploma | 0 (0.0%) | 0 (0.0%) |
| College or Associate's Degree | 0 (0.0%) | 0 (0.0%) |
| Bachelor's Degree | 0 (0.0%) | 0 (0.0%) |
| Graduate Degree | 0 (0.0%) | 0 (0.0%) |
| Total | 0 (0.0%) | 0 (0.0%) |
Employment Characteristics in Pine Lakes
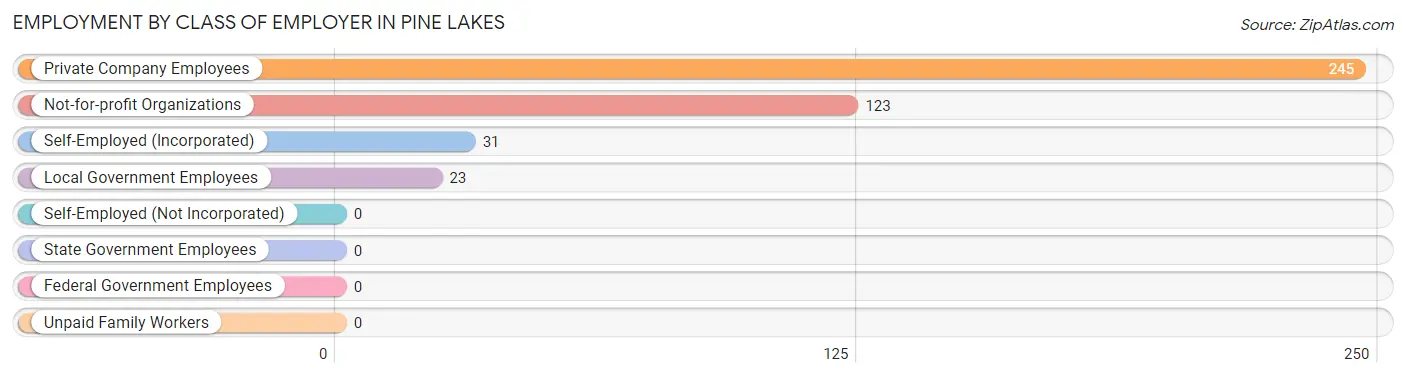
Employment by Class of Employer in Pine Lakes
Among the 422 employed individuals in Pine Lakes, private company employees (245 | 58.1%), not-for-profit organizations (123 | 29.1%), and self-employed (incorporated) (31 | 7.3%) make up the most common classes of employment.
| Employer Class | # Employees | % Employees |
| Private Company Employees | 245 | 58.1% |
| Self-Employed (Incorporated) | 31 | 7.3% |
| Self-Employed (Not Incorporated) | 0 | 0.0% |
| Not-for-profit Organizations | 123 | 29.1% |
| Local Government Employees | 23 | 5.4% |
| State Government Employees | 0 | 0.0% |
| Federal Government Employees | 0 | 0.0% |
| Unpaid Family Workers | 0 | 0.0% |
| Total | 422 | 100.0% |
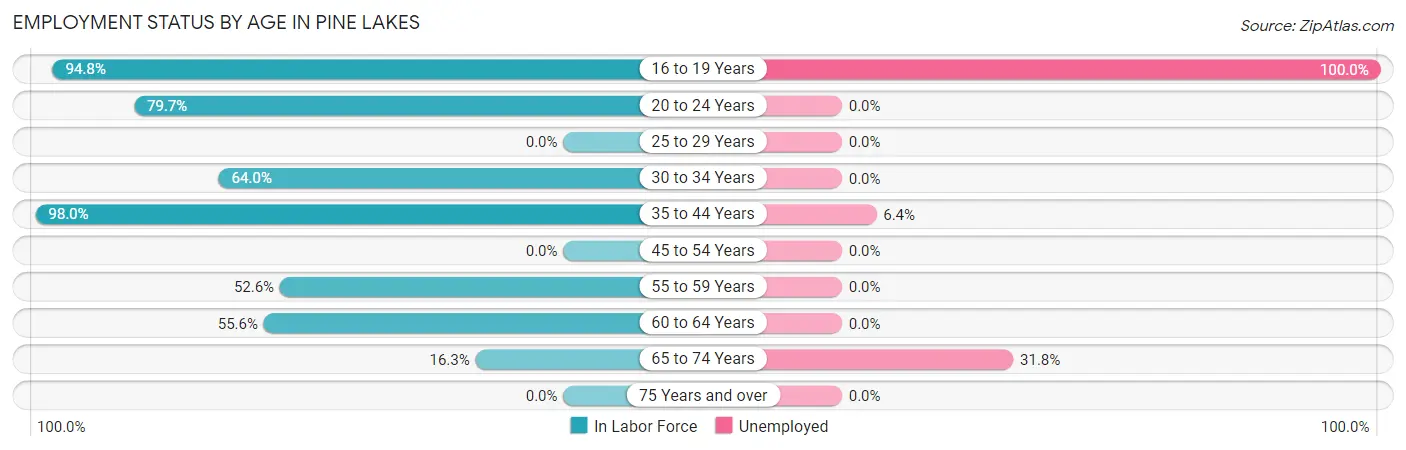
Employment Status by Age in Pine Lakes
According to the labor force statistics for Pine Lakes, out of the total population over 16 years of age (807), 72.2% or 583 individuals are in the labor force, with 26.4% or 154 of them unemployed. The age group with the highest labor force participation rate is 35 to 44 years, with 98.0% or 297 individuals in the labor force. Within the labor force, the 16 to 19 years age range has the highest percentage of unemployed individuals, with 100.0% or 128 of them being unemployed.
| Age Bracket | In Labor Force | Unemployed |
| 16 to 19 Years | 128 (94.8%) | 128 (100.0%) |
| 20 to 24 Years | 55 (79.7%) | 0 (0.0%) |
| 25 to 29 Years | 0 (0.0%) | 0 (0.0%) |
| 30 to 34 Years | 16 (64.0%) | 0 (0.0%) |
| 35 to 44 Years | 297 (98.0%) | 19 (6.4%) |
| 45 to 54 Years | 0 (0.0%) | 0 (0.0%) |
| 55 to 59 Years | 30 (52.6%) | 0 (0.0%) |
| 60 to 64 Years | 35 (55.6%) | 0 (0.0%) |
| 65 to 74 Years | 22 (16.3%) | 7 (31.8%) |
| 75 Years and over | 0 (0.0%) | 0 (0.0%) |
| Total | 583 (72.2%) | 154 (26.4%) |
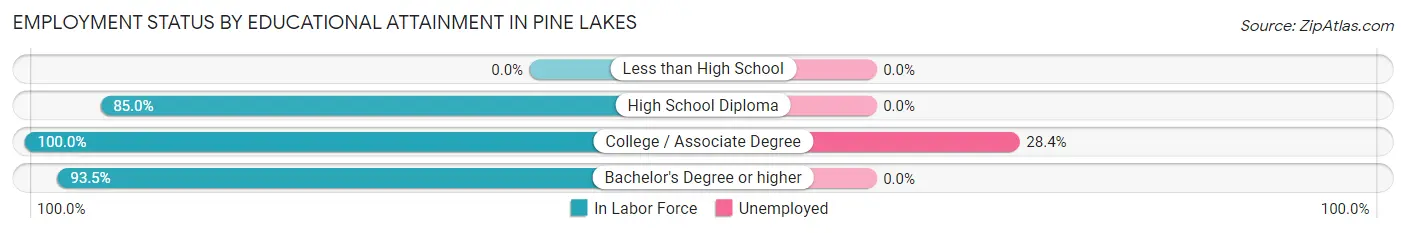
Employment Status by Educational Attainment in Pine Lakes
According to labor force statistics for Pine Lakes, 83.3% of individuals (378) out of the total population between 25 and 64 years of age (454) are in the labor force, with 5.0% or 19 of them being unemployed. The group with the highest labor force participation rate are those with the educational attainment of college / associate degree, with 100.0% or 67 individuals in the labor force. Within the labor force, individuals with college / associate degree education have the highest percentage of unemployment, with 28.4% or 19 of them being unemployed.
| Educational Attainment | In Labor Force | Unemployed |
| Less than High School | 0 (0.0%) | 0 (0.0%) |
| High School Diploma | 181 (85.0%) | 0 (0.0%) |
| College / Associate Degree | 67 (100.0%) | 19 (28.4%) |
| Bachelor's Degree or higher | 130 (93.5%) | 0 (0.0%) |
| Total | 378 (83.3%) | 23 (5.0%) |
Employment Occupations by Sex in Pine Lakes
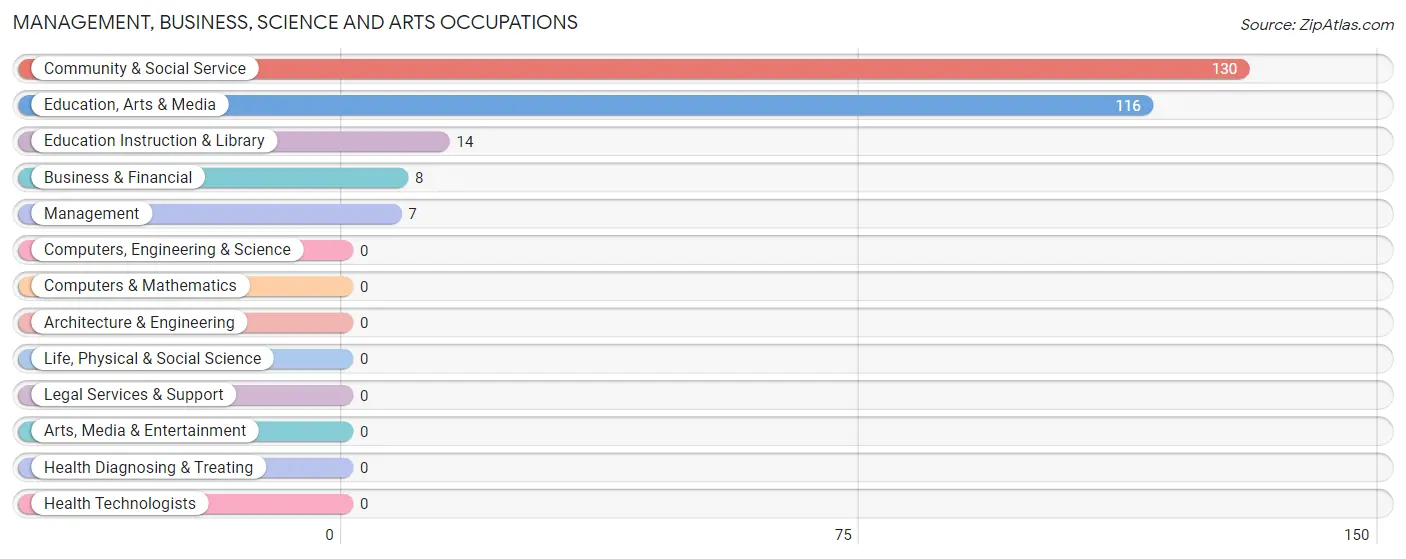
Management, Business, Science and Arts Occupations
The most common Management, Business, Science and Arts occupations in Pine Lakes are Community & Social Service (130 | 30.3%), Education, Arts & Media (116 | 27.0%), Education Instruction & Library (14 | 3.3%), Business & Financial (8 | 1.9%), and Management (7 | 1.6%).
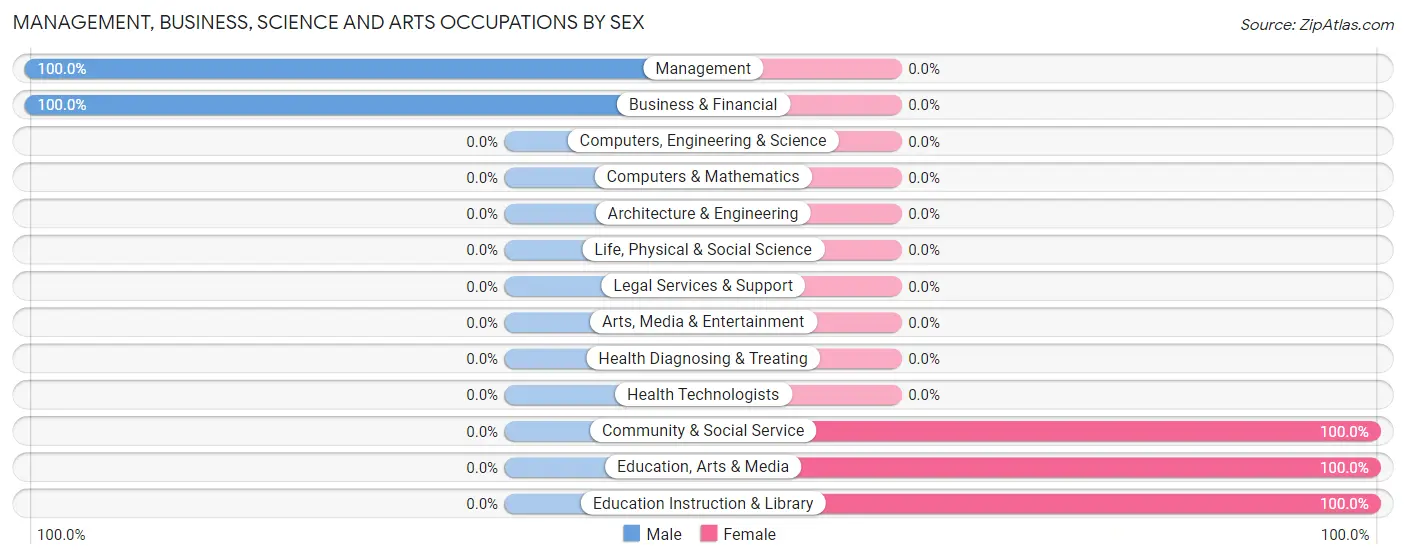
Management, Business, Science and Arts Occupations by Sex
Within the Management, Business, Science and Arts occupations in Pine Lakes, the most male-oriented occupations are Management (100.0%), and Business & Financial (100.0%), while the most female-oriented occupations are Community & Social Service (100.0%), Education, Arts & Media (100.0%), and Education Instruction & Library (100.0%).
| Occupation | Male | Female |
| Management | 7 (100.0%) | 0 (0.0%) |
| Business & Financial | 8 (100.0%) | 0 (0.0%) |
| Computers, Engineering & Science | 0 (0.0%) | 0 (0.0%) |
| Computers & Mathematics | 0 (0.0%) | 0 (0.0%) |
| Architecture & Engineering | 0 (0.0%) | 0 (0.0%) |
| Life, Physical & Social Science | 0 (0.0%) | 0 (0.0%) |
| Community & Social Service | 0 (0.0%) | 130 (100.0%) |
| Education, Arts & Media | 0 (0.0%) | 116 (100.0%) |
| Legal Services & Support | 0 (0.0%) | 0 (0.0%) |
| Education Instruction & Library | 0 (0.0%) | 14 (100.0%) |
| Arts, Media & Entertainment | 0 (0.0%) | 0 (0.0%) |
| Health Diagnosing & Treating | 0 (0.0%) | 0 (0.0%) |
| Health Technologists | 0 (0.0%) | 0 (0.0%) |
| Total (Category) | 15 (10.3%) | 130 (89.7%) |
| Total (Overall) | 234 (54.5%) | 195 (45.5%) |
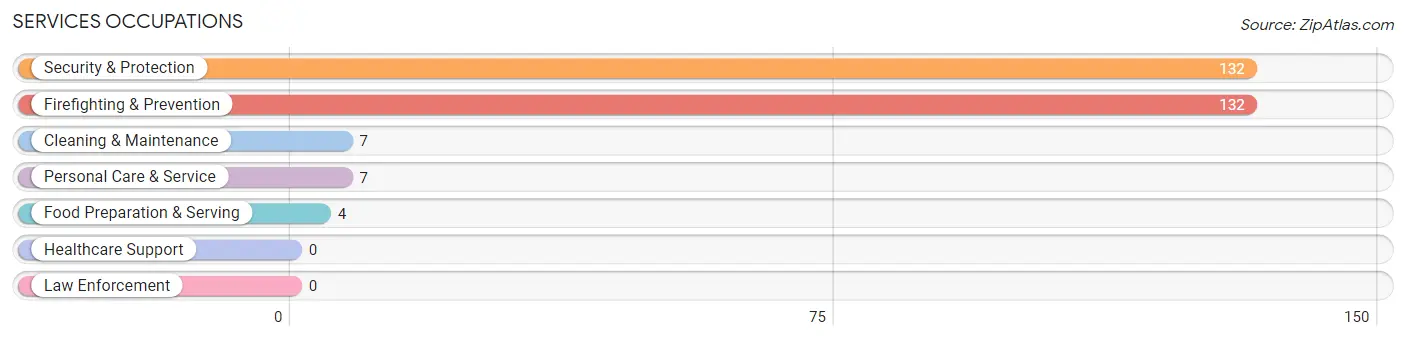
Services Occupations
The most common Services occupations in Pine Lakes are Security & Protection (132 | 30.8%), Firefighting & Prevention (132 | 30.8%), Cleaning & Maintenance (7 | 1.6%), Personal Care & Service (7 | 1.6%), and Food Preparation & Serving (4 | 0.9%).
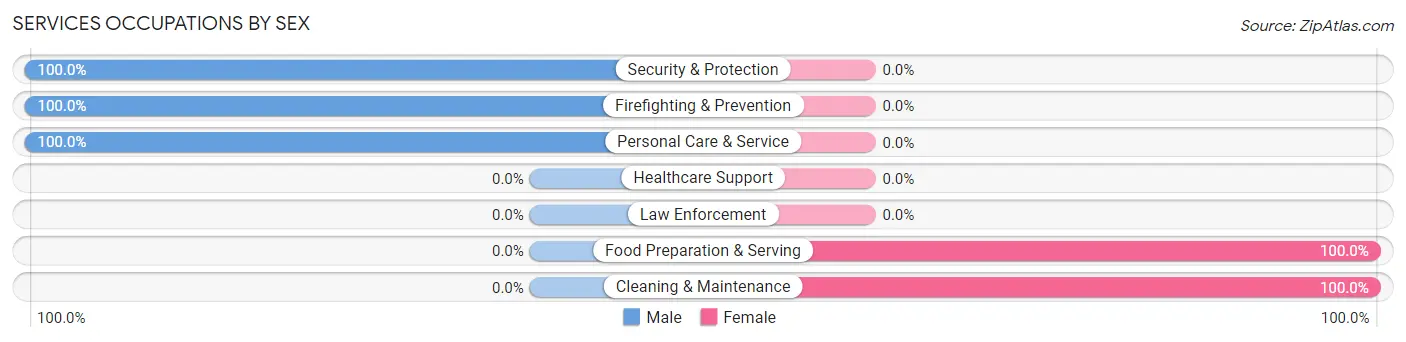
Services Occupations by Sex
Within the Services occupations in Pine Lakes, the most male-oriented occupations are Security & Protection (100.0%), Firefighting & Prevention (100.0%), and Personal Care & Service (100.0%), while the most female-oriented occupations are Food Preparation & Serving (100.0%), and Cleaning & Maintenance (100.0%).
| Occupation | Male | Female |
| Healthcare Support | 0 (0.0%) | 0 (0.0%) |
| Security & Protection | 132 (100.0%) | 0 (0.0%) |
| Firefighting & Prevention | 132 (100.0%) | 0 (0.0%) |
| Law Enforcement | 0 (0.0%) | 0 (0.0%) |
| Food Preparation & Serving | 0 (0.0%) | 4 (100.0%) |
| Cleaning & Maintenance | 0 (0.0%) | 7 (100.0%) |
| Personal Care & Service | 7 (100.0%) | 0 (0.0%) |
| Total (Category) | 139 (92.7%) | 11 (7.3%) |
| Total (Overall) | 234 (54.5%) | 195 (45.5%) |
Sales and Office Occupations
The most common Sales and Office occupations in Pine Lakes are Office & Administration (54 | 12.6%), and Sales & Related (2 | 0.5%).
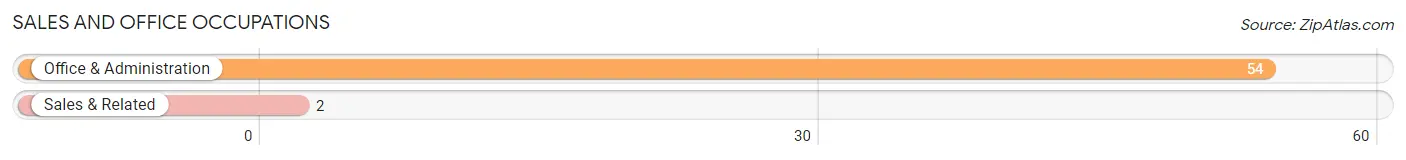
Sales and Office Occupations by Sex
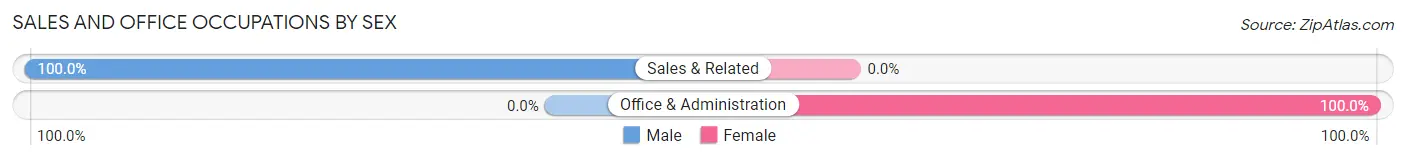
| Occupation | Male | Female |
| Sales & Related | 2 (100.0%) | 0 (0.0%) |
| Office & Administration | 0 (0.0%) | 54 (100.0%) |
| Total (Category) | 2 (3.6%) | 54 (96.4%) |
| Total (Overall) | 234 (54.5%) | 195 (45.5%) |
Natural Resources, Construction and Maintenance Occupations
The most common Natural Resources, Construction and Maintenance occupations in Pine Lakes are Installation, Maintenance & Repair (31 | 7.2%), and Construction & Extraction (25 | 5.8%).
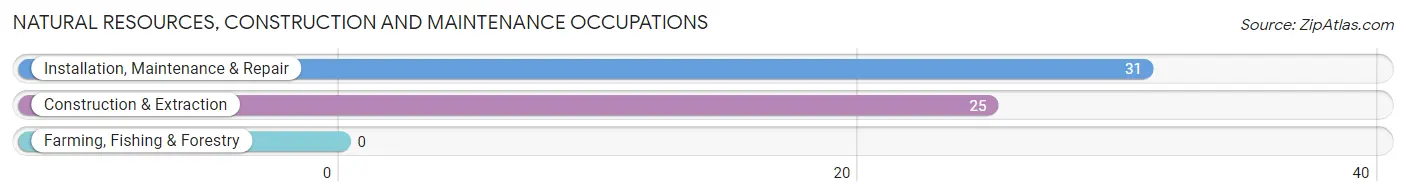
Natural Resources, Construction and Maintenance Occupations by Sex
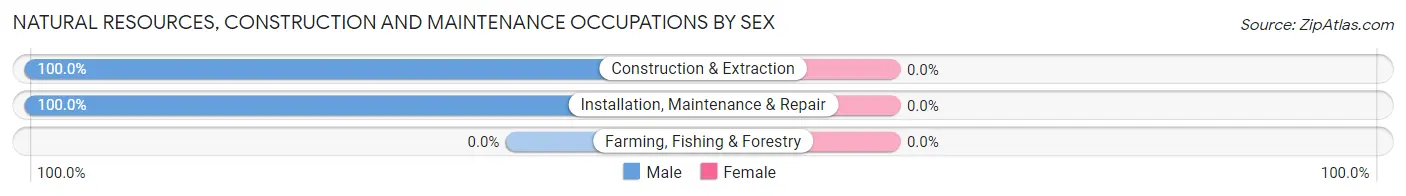
| Occupation | Male | Female |
| Farming, Fishing & Forestry | 0 (0.0%) | 0 (0.0%) |
| Construction & Extraction | 25 (100.0%) | 0 (0.0%) |
| Installation, Maintenance & Repair | 31 (100.0%) | 0 (0.0%) |
| Total (Category) | 56 (100.0%) | 0 (0.0%) |
| Total (Overall) | 234 (54.5%) | 195 (45.5%) |
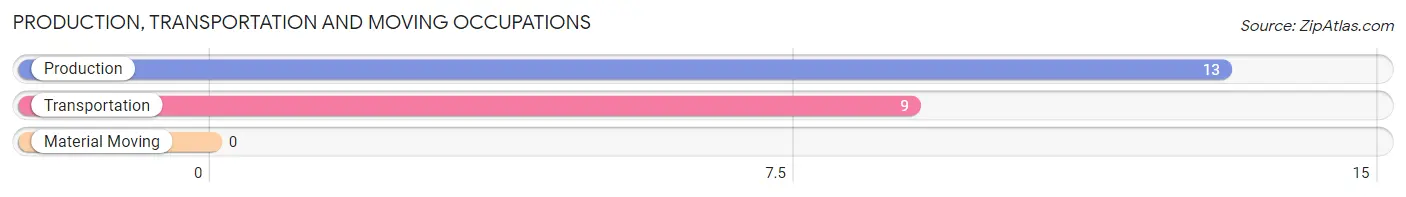
Production, Transportation and Moving Occupations
The most common Production, Transportation and Moving occupations in Pine Lakes are Production (13 | 3.0%), and Transportation (9 | 2.1%).
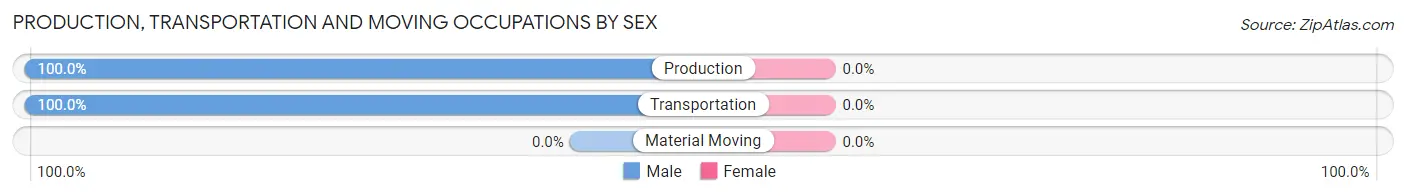
Production, Transportation and Moving Occupations by Sex
| Occupation | Male | Female |
| Production | 13 (100.0%) | 0 (0.0%) |
| Transportation | 9 (100.0%) | 0 (0.0%) |
| Material Moving | 0 (0.0%) | 0 (0.0%) |
| Total (Category) | 22 (100.0%) | 0 (0.0%) |
| Total (Overall) | 234 (54.5%) | 195 (45.5%) |
Employment Industries by Sex in Pine Lakes
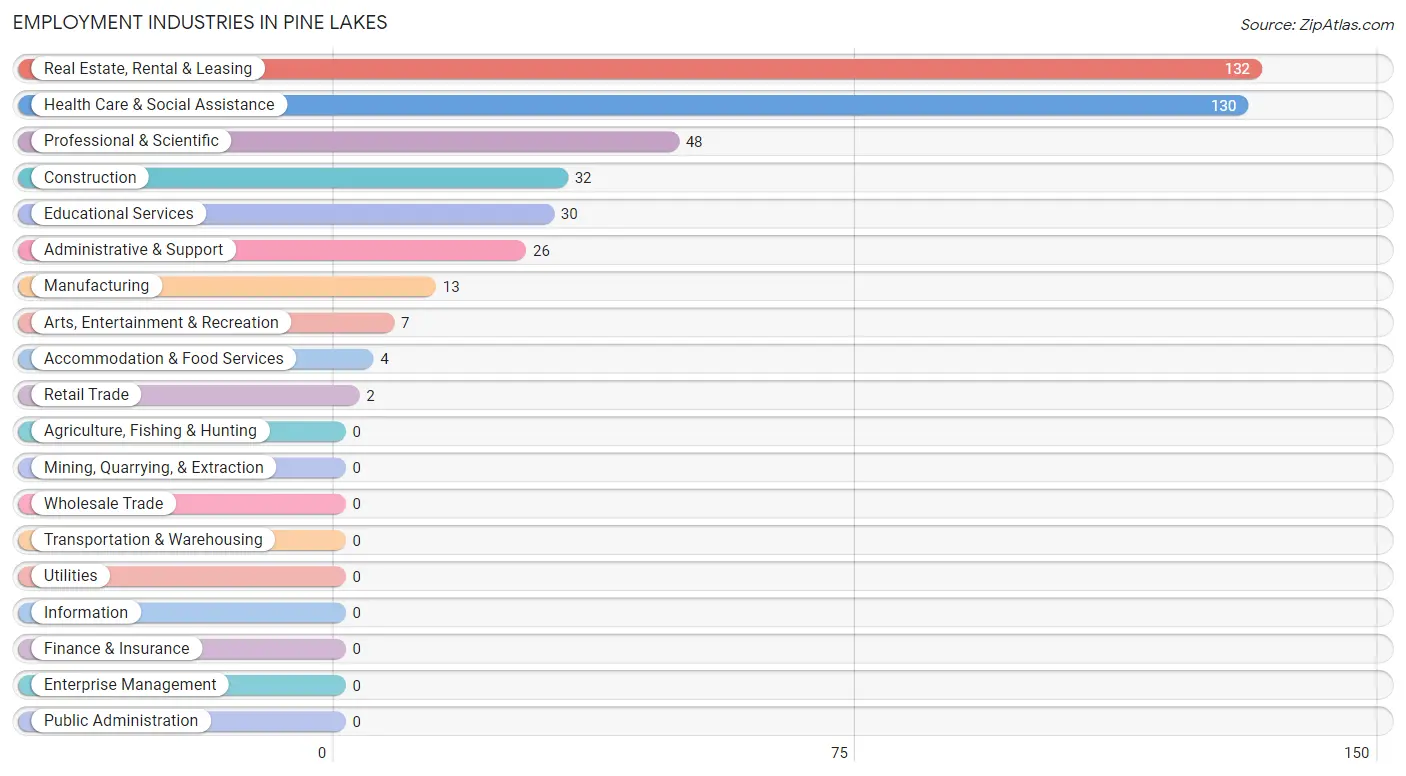
Employment Industries in Pine Lakes
The major employment industries in Pine Lakes include Real Estate, Rental & Leasing (132 | 30.8%), Health Care & Social Assistance (130 | 30.3%), Professional & Scientific (48 | 11.2%), Construction (32 | 7.5%), and Educational Services (30 | 7.0%).
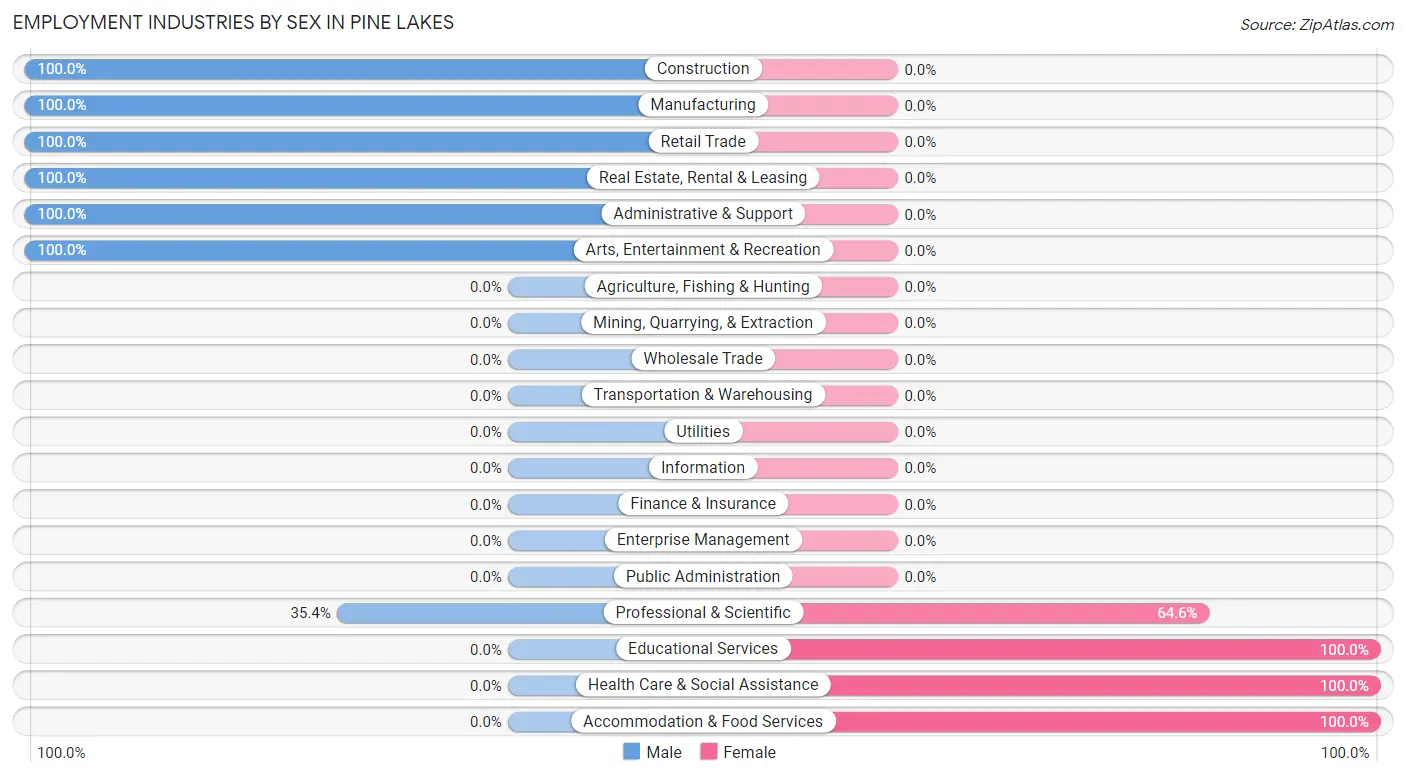
Employment Industries by Sex in Pine Lakes
The Pine Lakes industries that see more men than women are Construction (100.0%), Manufacturing (100.0%), and Retail Trade (100.0%), whereas the industries that tend to have a higher number of women are Educational Services (100.0%), Health Care & Social Assistance (100.0%), and Accommodation & Food Services (100.0%).
| Industry | Male | Female |
| Agriculture, Fishing & Hunting | 0 (0.0%) | 0 (0.0%) |
| Mining, Quarrying, & Extraction | 0 (0.0%) | 0 (0.0%) |
| Construction | 32 (100.0%) | 0 (0.0%) |
| Manufacturing | 13 (100.0%) | 0 (0.0%) |
| Wholesale Trade | 0 (0.0%) | 0 (0.0%) |
| Retail Trade | 2 (100.0%) | 0 (0.0%) |
| Transportation & Warehousing | 0 (0.0%) | 0 (0.0%) |
| Utilities | 0 (0.0%) | 0 (0.0%) |
| Information | 0 (0.0%) | 0 (0.0%) |
| Finance & Insurance | 0 (0.0%) | 0 (0.0%) |
| Real Estate, Rental & Leasing | 132 (100.0%) | 0 (0.0%) |
| Professional & Scientific | 17 (35.4%) | 31 (64.6%) |
| Enterprise Management | 0 (0.0%) | 0 (0.0%) |
| Administrative & Support | 26 (100.0%) | 0 (0.0%) |
| Educational Services | 0 (0.0%) | 30 (100.0%) |
| Health Care & Social Assistance | 0 (0.0%) | 130 (100.0%) |
| Arts, Entertainment & Recreation | 7 (100.0%) | 0 (0.0%) |
| Accommodation & Food Services | 0 (0.0%) | 4 (100.0%) |
| Public Administration | 0 (0.0%) | 0 (0.0%) |
| Total | 234 (54.5%) | 195 (45.5%) |
Education in Pine Lakes
School Enrollment in Pine Lakes
The most common levels of schooling among the 398 students in Pine Lakes are nursery / preschool (135 | 33.9%), kindergarten (114 | 28.6%), and high school (109 | 27.4%).
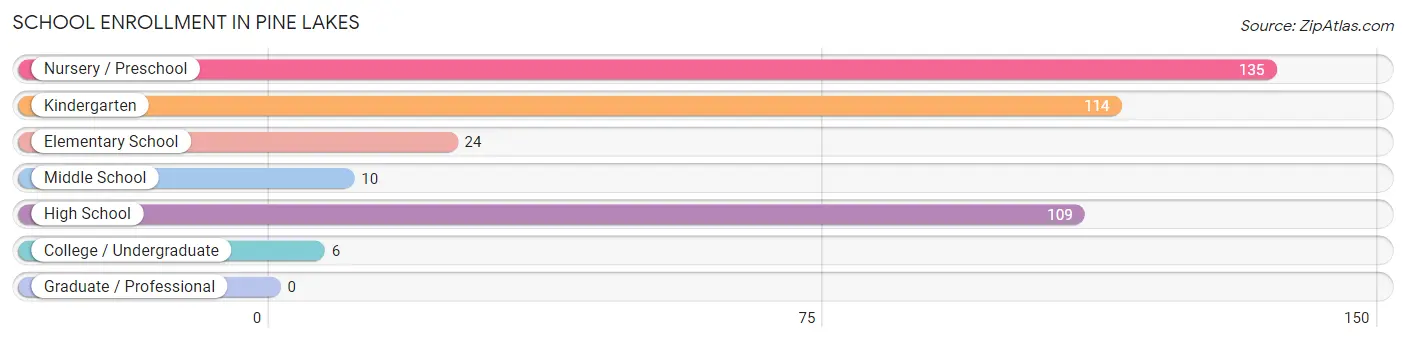
| School Level | # Students | % Students |
| Nursery / Preschool | 135 | 33.9% |
| Kindergarten | 114 | 28.6% |
| Elementary School | 24 | 6.0% |
| Middle School | 10 | 2.5% |
| High School | 109 | 27.4% |
| College / Undergraduate | 6 | 1.5% |
| Graduate / Professional | 0 | 0.0% |
| Total | 398 | 100.0% |
School Enrollment by Age by Funding Source in Pine Lakes
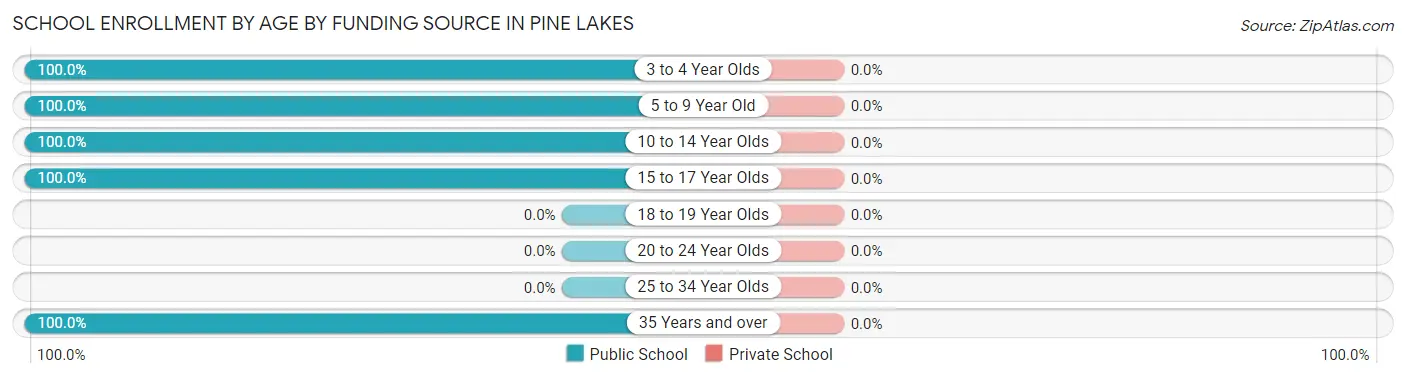
| Age Bracket | Public School | Private School |
| 3 to 4 Year Olds | 14 (100.0%) | 0 (0.0%) |
| 5 to 9 Year Old | 259 (100.0%) | 0 (0.0%) |
| 10 to 14 Year Olds | 10 (100.0%) | 0 (0.0%) |
| 15 to 17 Year Olds | 103 (100.0%) | 0 (0.0%) |
| 18 to 19 Year Olds | 0 (0.0%) | 0 (0.0%) |
| 20 to 24 Year Olds | 0 (0.0%) | 0 (0.0%) |
| 25 to 34 Year Olds | 0 (0.0%) | 0 (0.0%) |
| 35 Years and over | 12 (100.0%) | 0 (0.0%) |
| Total | 398 (100.0%) | 0 (0.0%) |
Educational Attainment by Field of Study in Pine Lakes
Psychology (116 | 72.1%), arts & humanities (16 | 9.9%), social sciences (14 | 8.7%), science & technology (8 | 5.0%), and bio, nature & agricultural (7 | 4.3%) are the most common fields of study among 161 individuals in Pine Lakes who have obtained a bachelor's degree or higher.
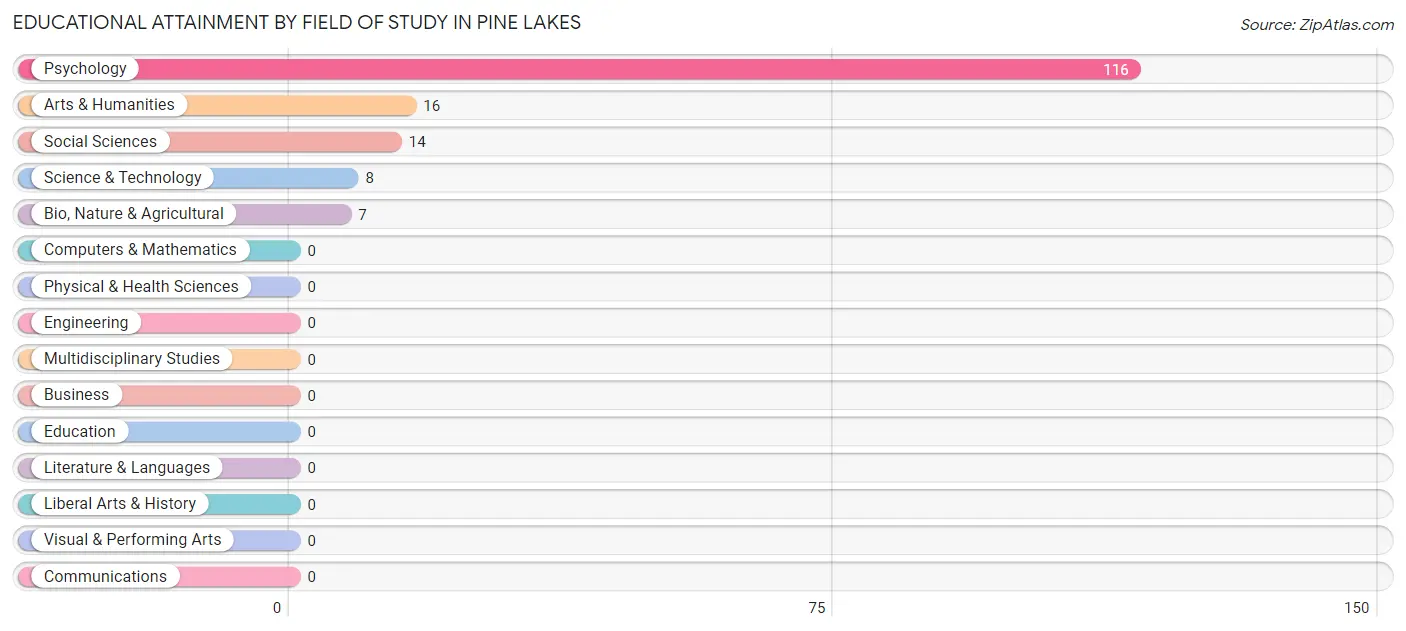
| Field of Study | # Graduates | % Graduates |
| Computers & Mathematics | 0 | 0.0% |
| Bio, Nature & Agricultural | 7 | 4.3% |
| Physical & Health Sciences | 0 | 0.0% |
| Psychology | 116 | 72.1% |
| Social Sciences | 14 | 8.7% |
| Engineering | 0 | 0.0% |
| Multidisciplinary Studies | 0 | 0.0% |
| Science & Technology | 8 | 5.0% |
| Business | 0 | 0.0% |
| Education | 0 | 0.0% |
| Literature & Languages | 0 | 0.0% |
| Liberal Arts & History | 0 | 0.0% |
| Visual & Performing Arts | 0 | 0.0% |
| Communications | 0 | 0.0% |
| Arts & Humanities | 16 | 9.9% |
| Total | 161 | 100.0% |
Transportation & Commute in Pine Lakes
Vehicle Availability by Sex in Pine Lakes
The most prevalent vehicle ownership categories in Pine Lakes are males with 2 vehicles (183, accounting for 78.2%) and females with 2 vehicles (134, making up 97.3%).
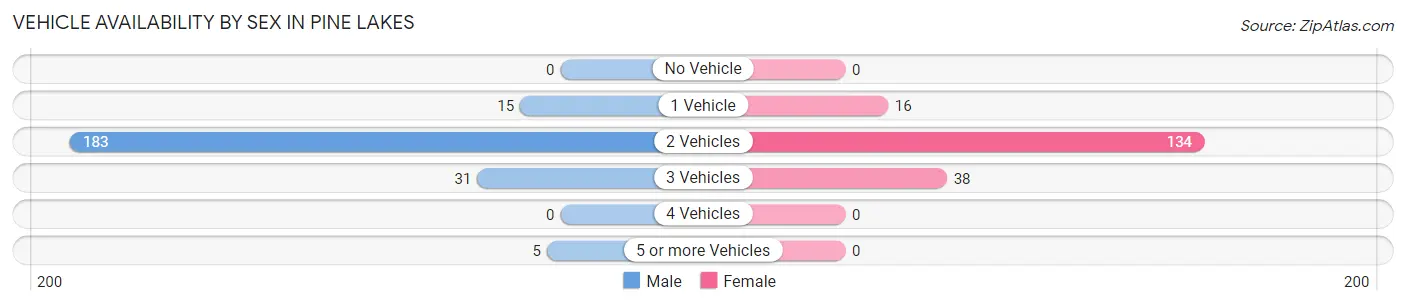
| Vehicles Available | Male | Female |
| No Vehicle | 0 (0.0%) | 0 (0.0%) |
| 1 Vehicle | 15 (6.4%) | 16 (8.5%) |
| 2 Vehicles | 183 (78.2%) | 134 (71.3%) |
| 3 Vehicles | 31 (13.3%) | 38 (20.2%) |
| 4 Vehicles | 0 (0.0%) | 0 (0.0%) |
| 5 or more Vehicles | 5 (2.1%) | 0 (0.0%) |
| Total | 234 (100.0%) | 188 (100.0%) |
Commute Time in Pine Lakes
The most frequently occuring commute durations in Pine Lakes are 30 to 34 minutes (179 commuters, 42.4%), 15 to 19 minutes (116 commuters, 27.5%), and 45 to 59 minutes (76 commuters, 18.0%).
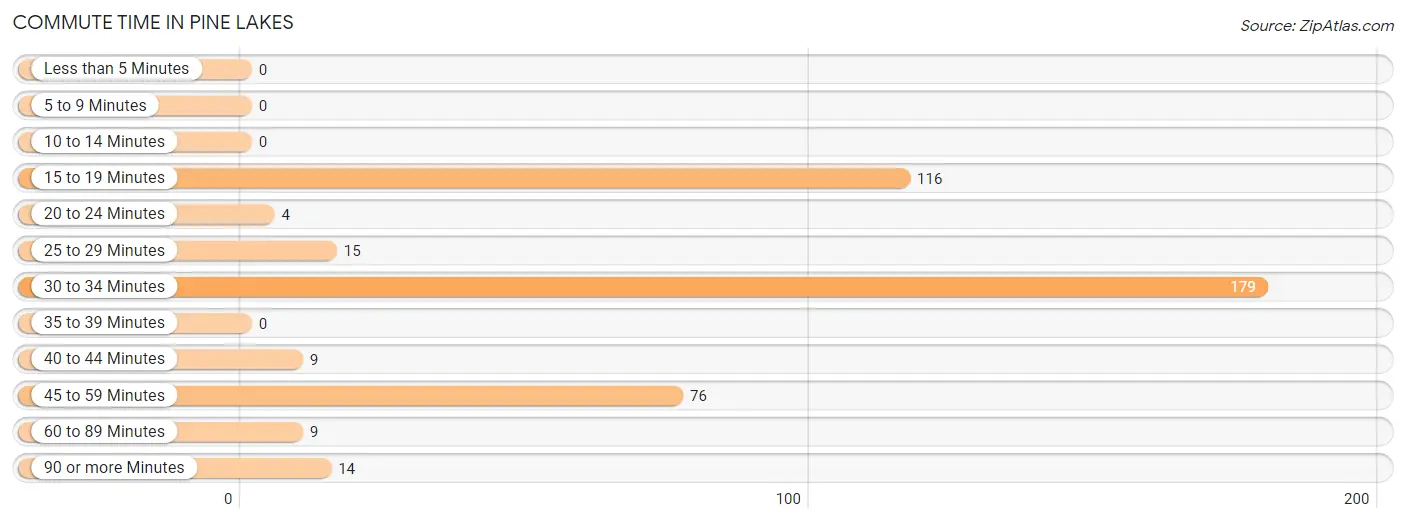
| Commute Time | # Commuters | % Commuters |
| Less than 5 Minutes | 0 | 0.0% |
| 5 to 9 Minutes | 0 | 0.0% |
| 10 to 14 Minutes | 0 | 0.0% |
| 15 to 19 Minutes | 116 | 27.5% |
| 20 to 24 Minutes | 4 | 0.9% |
| 25 to 29 Minutes | 15 | 3.5% |
| 30 to 34 Minutes | 179 | 42.4% |
| 35 to 39 Minutes | 0 | 0.0% |
| 40 to 44 Minutes | 9 | 2.1% |
| 45 to 59 Minutes | 76 | 18.0% |
| 60 to 89 Minutes | 9 | 2.1% |
| 90 or more Minutes | 14 | 3.3% |
Commute Time by Sex in Pine Lakes
The most common commute times in Pine Lakes are 30 to 34 minutes (163 commuters, 69.7%) for males and 15 to 19 minutes (116 commuters, 61.7%) for females.
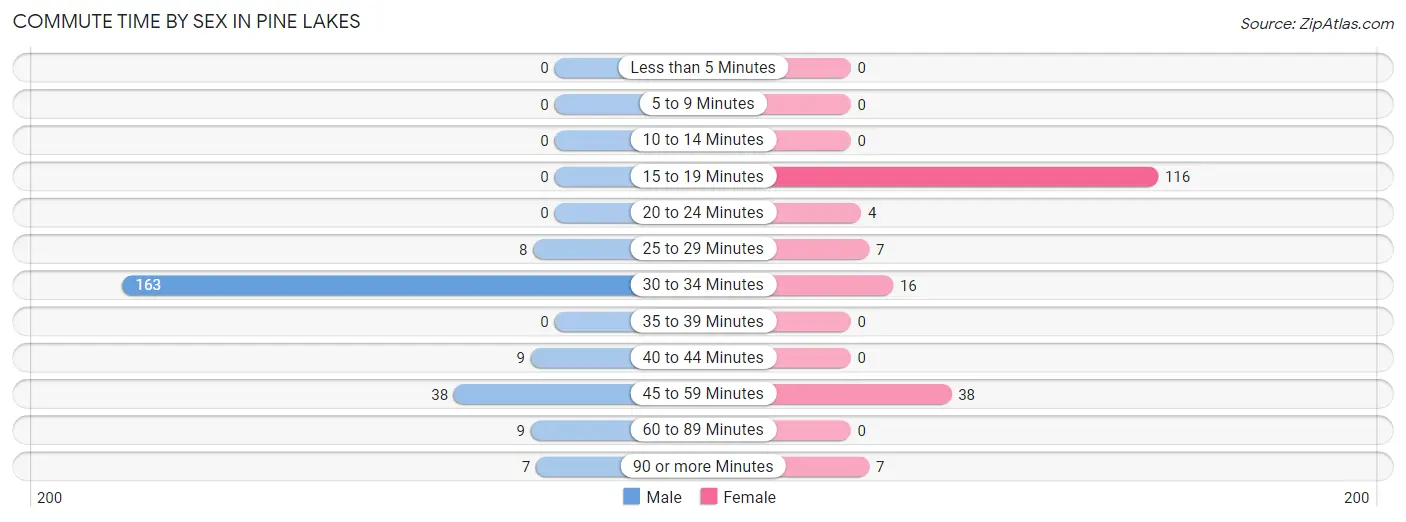
| Commute Time | Male | Female |
| Less than 5 Minutes | 0 (0.0%) | 0 (0.0%) |
| 5 to 9 Minutes | 0 (0.0%) | 0 (0.0%) |
| 10 to 14 Minutes | 0 (0.0%) | 0 (0.0%) |
| 15 to 19 Minutes | 0 (0.0%) | 116 (61.7%) |
| 20 to 24 Minutes | 0 (0.0%) | 4 (2.1%) |
| 25 to 29 Minutes | 8 (3.4%) | 7 (3.7%) |
| 30 to 34 Minutes | 163 (69.7%) | 16 (8.5%) |
| 35 to 39 Minutes | 0 (0.0%) | 0 (0.0%) |
| 40 to 44 Minutes | 9 (3.8%) | 0 (0.0%) |
| 45 to 59 Minutes | 38 (16.2%) | 38 (20.2%) |
| 60 to 89 Minutes | 9 (3.8%) | 0 (0.0%) |
| 90 or more Minutes | 7 (3.0%) | 7 (3.7%) |
Time of Departure to Work by Sex in Pine Lakes
The most frequent times of departure to work in Pine Lakes are 12:00 PM to 3:59 PM (132, 56.4%) for males and 10:00 AM to 10:59 AM (116, 61.7%) for females.
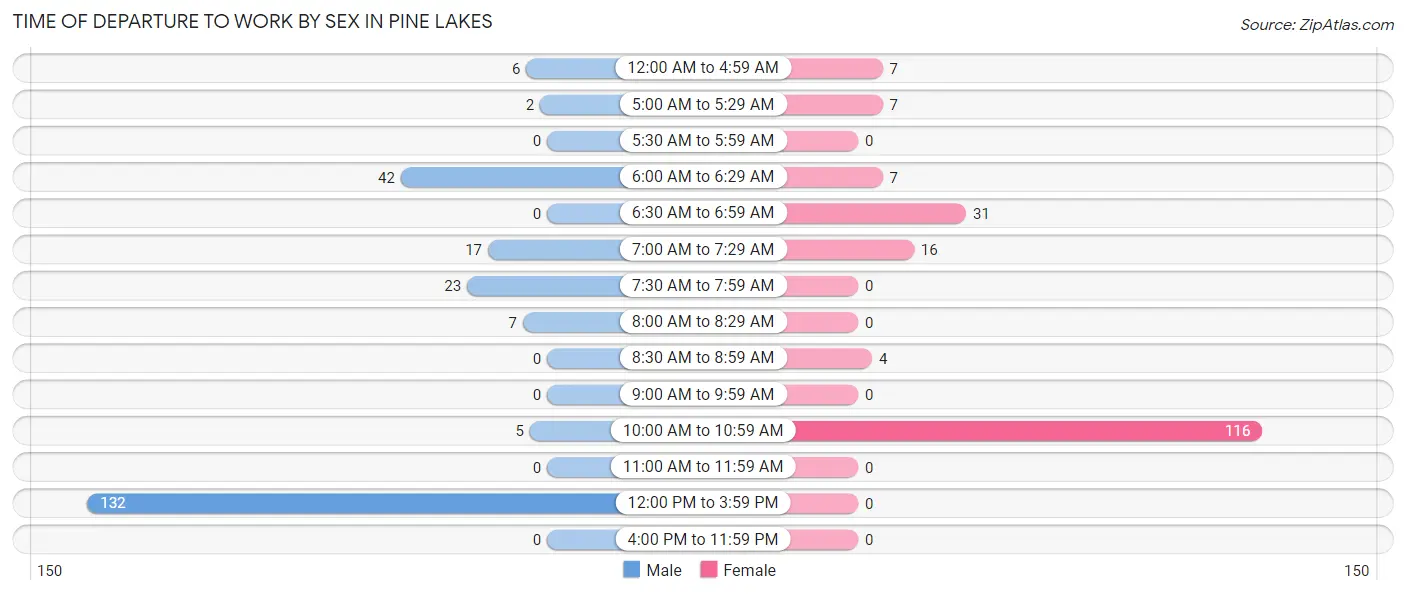
| Time of Departure | Male | Female |
| 12:00 AM to 4:59 AM | 6 (2.6%) | 7 (3.7%) |
| 5:00 AM to 5:29 AM | 2 (0.9%) | 7 (3.7%) |
| 5:30 AM to 5:59 AM | 0 (0.0%) | 0 (0.0%) |
| 6:00 AM to 6:29 AM | 42 (17.9%) | 7 (3.7%) |
| 6:30 AM to 6:59 AM | 0 (0.0%) | 31 (16.5%) |
| 7:00 AM to 7:29 AM | 17 (7.3%) | 16 (8.5%) |
| 7:30 AM to 7:59 AM | 23 (9.8%) | 0 (0.0%) |
| 8:00 AM to 8:29 AM | 7 (3.0%) | 0 (0.0%) |
| 8:30 AM to 8:59 AM | 0 (0.0%) | 4 (2.1%) |
| 9:00 AM to 9:59 AM | 0 (0.0%) | 0 (0.0%) |
| 10:00 AM to 10:59 AM | 5 (2.1%) | 116 (61.7%) |
| 11:00 AM to 11:59 AM | 0 (0.0%) | 0 (0.0%) |
| 12:00 PM to 3:59 PM | 132 (56.4%) | 0 (0.0%) |
| 4:00 PM to 11:59 PM | 0 (0.0%) | 0 (0.0%) |
| Total | 234 (100.0%) | 188 (100.0%) |
Housing Occupancy in Pine Lakes
Occupancy by Ownership in Pine Lakes
Of the total 341 dwellings in Pine Lakes, owner-occupied units account for 166 (48.7%), while renter-occupied units make up 175 (51.3%).
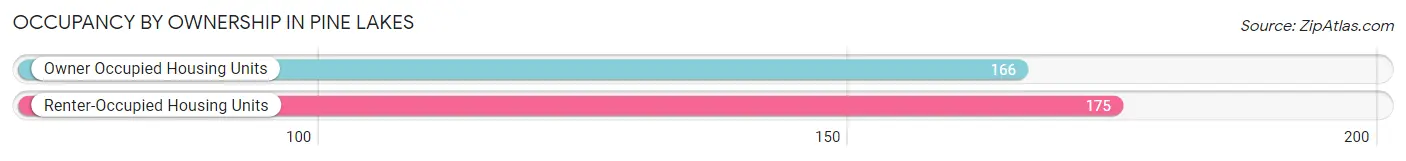
| Occupancy | # Housing Units | % Housing Units |
| Owner Occupied Housing Units | 166 | 48.7% |
| Renter-Occupied Housing Units | 175 | 51.3% |
| Total Occupied Housing Units | 341 | 100.0% |
Occupancy by Household Size in Pine Lakes
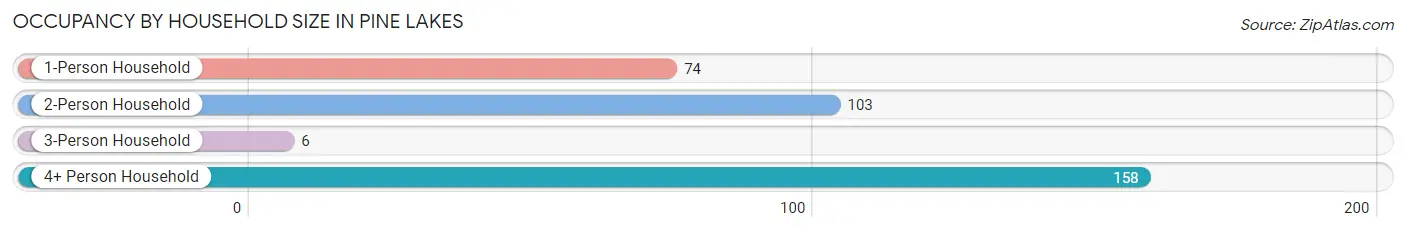
| Household Size | # Housing Units | % Housing Units |
| 1-Person Household | 74 | 21.7% |
| 2-Person Household | 103 | 30.2% |
| 3-Person Household | 6 | 1.8% |
| 4+ Person Household | 158 | 46.3% |
| Total Housing Units | 341 | 100.0% |
Occupancy by Ownership by Household Size in Pine Lakes
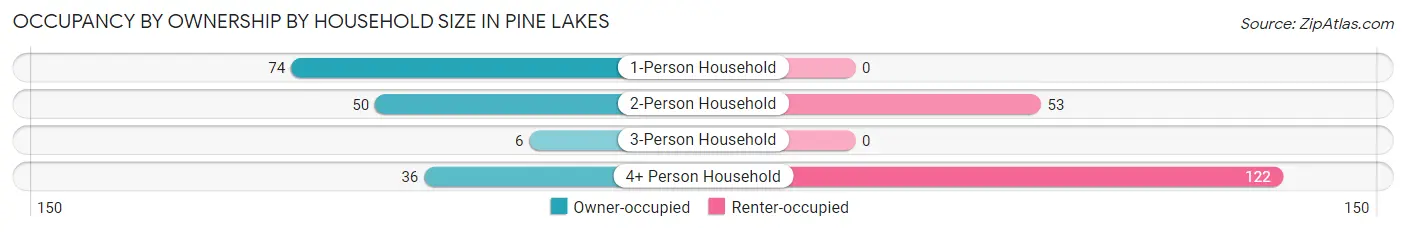
| Household Size | Owner-occupied | Renter-occupied |
| 1-Person Household | 74 (100.0%) | 0 (0.0%) |
| 2-Person Household | 50 (48.5%) | 53 (51.5%) |
| 3-Person Household | 6 (100.0%) | 0 (0.0%) |
| 4+ Person Household | 36 (22.8%) | 122 (77.2%) |
| Total Housing Units | 166 (48.7%) | 175 (51.3%) |
Occupancy by Educational Attainment in Pine Lakes
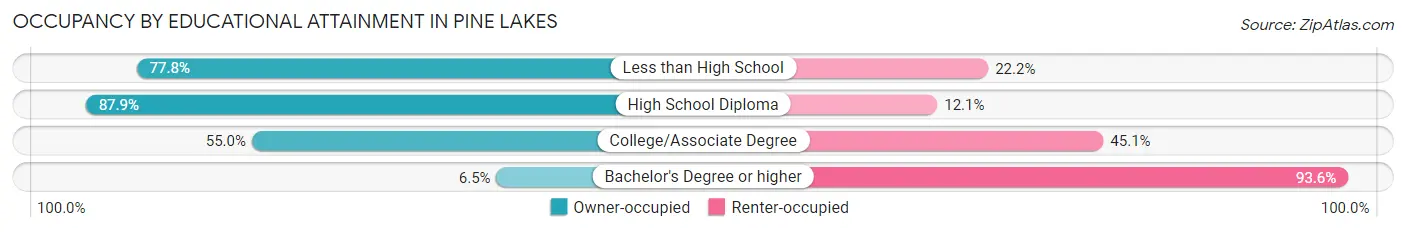
| Household Size | Owner-occupied | Renter-occupied |
| Less than High School | 21 (77.8%) | 6 (22.2%) |
| High School Diploma | 87 (87.9%) | 12 (12.1%) |
| College/Associate Degree | 50 (54.9%) | 41 (45.1%) |
| Bachelor's Degree or higher | 8 (6.5%) | 116 (93.5%) |
Occupancy by Age of Householder in Pine Lakes
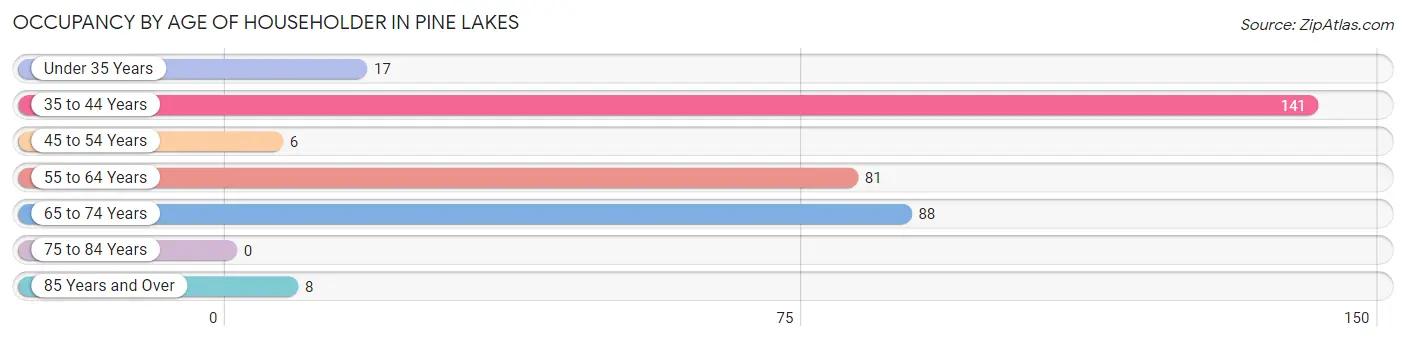
| Age Bracket | # Households | % Households |
| Under 35 Years | 17 | 5.0% |
| 35 to 44 Years | 141 | 41.3% |
| 45 to 54 Years | 6 | 1.8% |
| 55 to 64 Years | 81 | 23.7% |
| 65 to 74 Years | 88 | 25.8% |
| 75 to 84 Years | 0 | 0.0% |
| 85 Years and Over | 8 | 2.4% |
| Total | 341 | 100.0% |
Housing Finances in Pine Lakes
Median Income by Occupancy in Pine Lakes
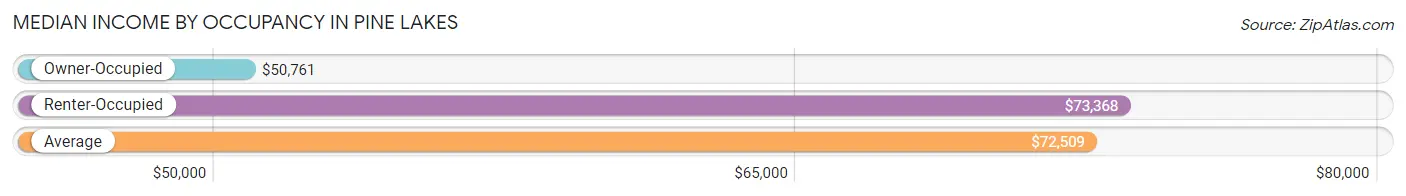
| Occupancy Type | # Households | Median Income |
| Owner-Occupied | 166 (48.7%) | $50,761 |
| Renter-Occupied | 175 (51.3%) | $73,368 |
| Average | 341 (100.0%) | $72,509 |
Occupancy by Householder Income Bracket in Pine Lakes
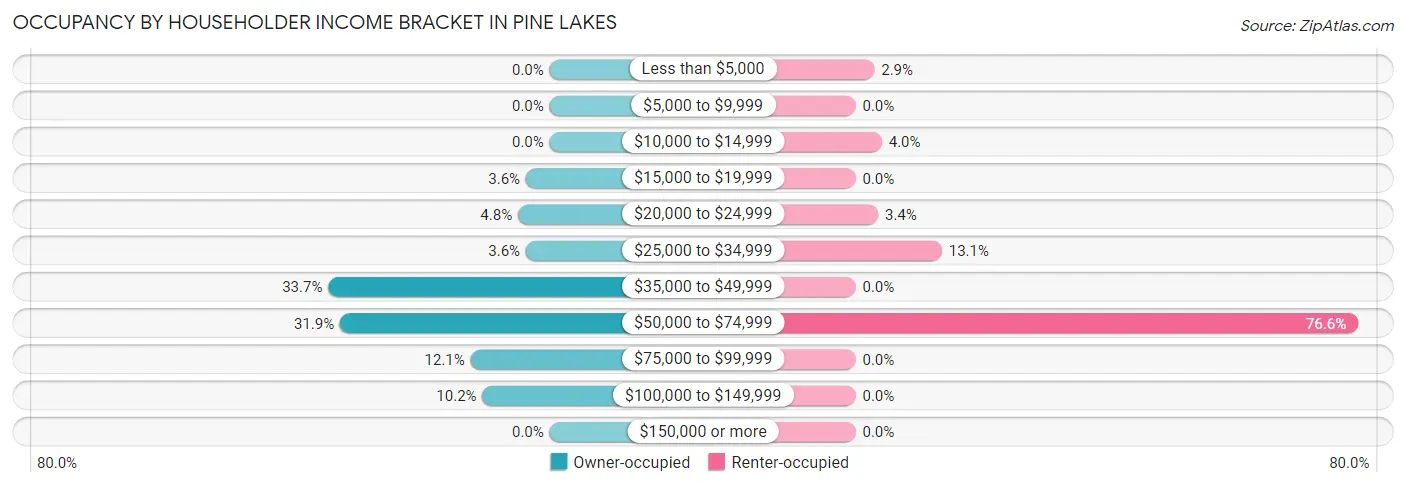
| Income Bracket | Owner-occupied | Renter-occupied |
| Less than $5,000 | 0 (0.0%) | 5 (2.9%) |
| $5,000 to $9,999 | 0 (0.0%) | 0 (0.0%) |
| $10,000 to $14,999 | 0 (0.0%) | 7 (4.0%) |
| $15,000 to $19,999 | 6 (3.6%) | 0 (0.0%) |
| $20,000 to $24,999 | 8 (4.8%) | 6 (3.4%) |
| $25,000 to $34,999 | 6 (3.6%) | 23 (13.1%) |
| $35,000 to $49,999 | 56 (33.7%) | 0 (0.0%) |
| $50,000 to $74,999 | 53 (31.9%) | 134 (76.6%) |
| $75,000 to $99,999 | 20 (12.0%) | 0 (0.0%) |
| $100,000 to $149,999 | 17 (10.2%) | 0 (0.0%) |
| $150,000 or more | 0 (0.0%) | 0 (0.0%) |
| Total | 166 (100.0%) | 175 (100.0%) |
Monthly Housing Cost Tiers in Pine Lakes
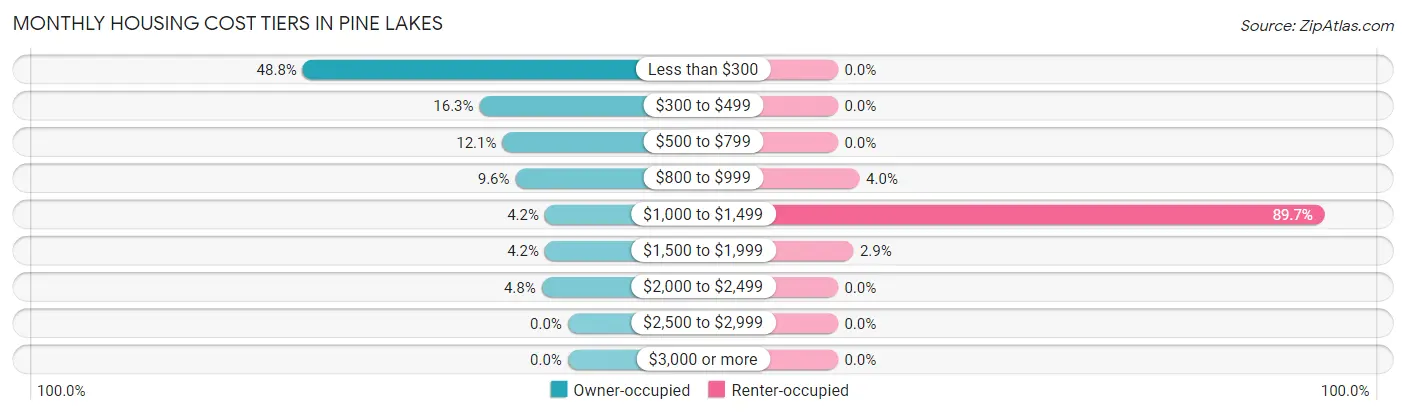
| Monthly Cost | Owner-occupied | Renter-occupied |
| Less than $300 | 81 (48.8%) | 0 (0.0%) |
| $300 to $499 | 27 (16.3%) | 0 (0.0%) |
| $500 to $799 | 20 (12.0%) | 0 (0.0%) |
| $800 to $999 | 16 (9.6%) | 7 (4.0%) |
| $1,000 to $1,499 | 7 (4.2%) | 157 (89.7%) |
| $1,500 to $1,999 | 7 (4.2%) | 5 (2.9%) |
| $2,000 to $2,499 | 8 (4.8%) | 0 (0.0%) |
| $2,500 to $2,999 | 0 (0.0%) | 0 (0.0%) |
| $3,000 or more | 0 (0.0%) | 0 (0.0%) |
| Total | 166 (100.0%) | 175 (100.0%) |
Physical Housing Characteristics in Pine Lakes
Housing Structures in Pine Lakes
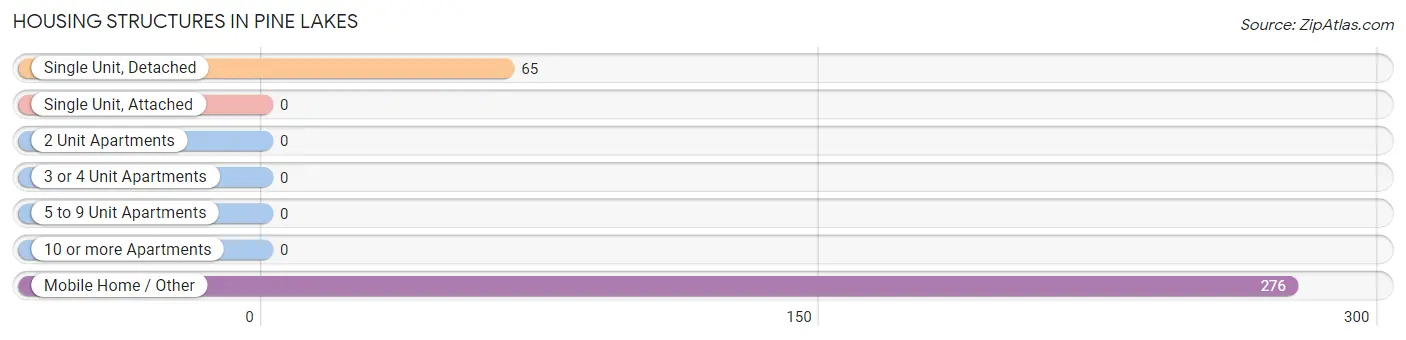
| Structure Type | # Housing Units | % Housing Units |
| Single Unit, Detached | 65 | 19.1% |
| Single Unit, Attached | 0 | 0.0% |
| 2 Unit Apartments | 0 | 0.0% |
| 3 or 4 Unit Apartments | 0 | 0.0% |
| 5 to 9 Unit Apartments | 0 | 0.0% |
| 10 or more Apartments | 0 | 0.0% |
| Mobile Home / Other | 276 | 80.9% |
| Total | 341 | 100.0% |
Housing Structures by Occupancy in Pine Lakes
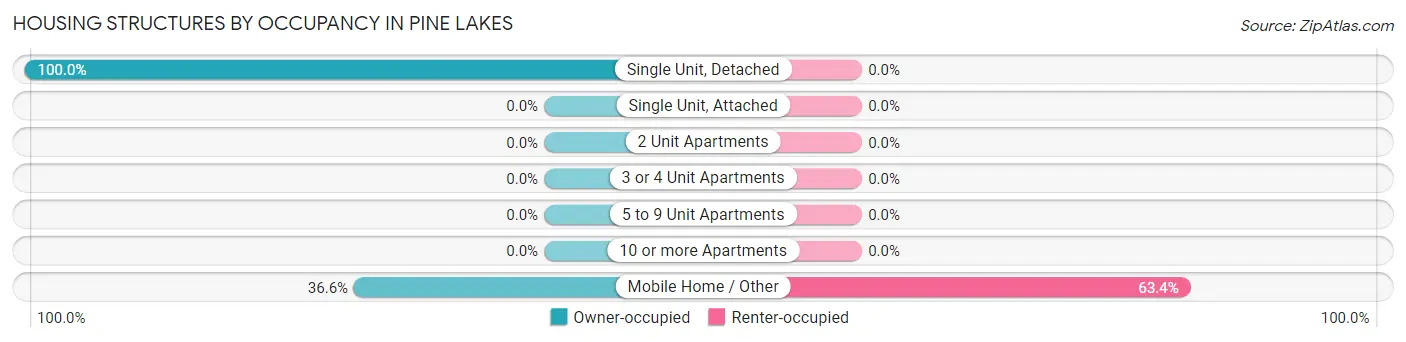
| Structure Type | Owner-occupied | Renter-occupied |
| Single Unit, Detached | 65 (100.0%) | 0 (0.0%) |
| Single Unit, Attached | 0 (0.0%) | 0 (0.0%) |
| 2 Unit Apartments | 0 (0.0%) | 0 (0.0%) |
| 3 or 4 Unit Apartments | 0 (0.0%) | 0 (0.0%) |
| 5 to 9 Unit Apartments | 0 (0.0%) | 0 (0.0%) |
| 10 or more Apartments | 0 (0.0%) | 0 (0.0%) |
| Mobile Home / Other | 101 (36.6%) | 175 (63.4%) |
| Total | 166 (48.7%) | 175 (51.3%) |
Housing Structures by Number of Rooms in Pine Lakes
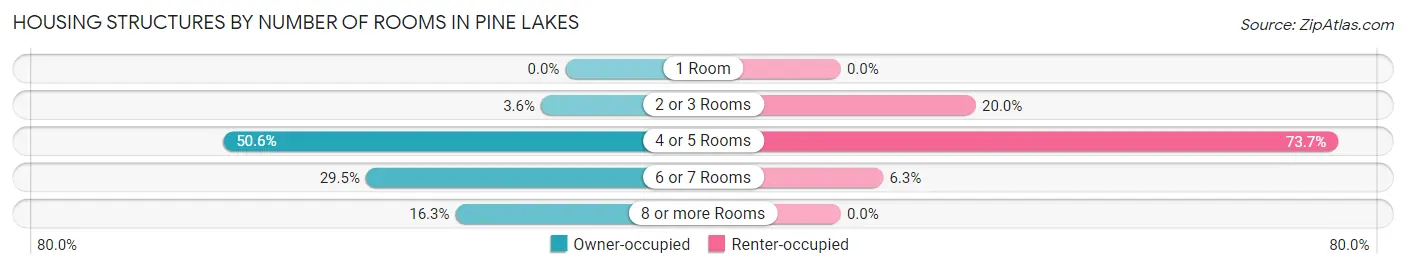
| Number of Rooms | Owner-occupied | Renter-occupied |
| 1 Room | 0 (0.0%) | 0 (0.0%) |
| 2 or 3 Rooms | 6 (3.6%) | 35 (20.0%) |
| 4 or 5 Rooms | 84 (50.6%) | 129 (73.7%) |
| 6 or 7 Rooms | 49 (29.5%) | 11 (6.3%) |
| 8 or more Rooms | 27 (16.3%) | 0 (0.0%) |
| Total | 166 (100.0%) | 175 (100.0%) |
Housing Structure by Heating Type in Pine Lakes
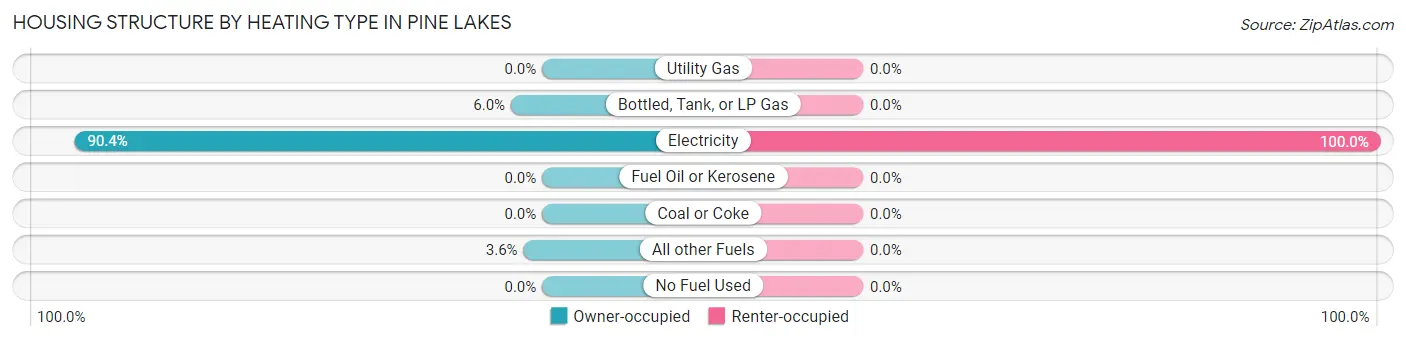
| Heating Type | Owner-occupied | Renter-occupied |
| Utility Gas | 0 (0.0%) | 0 (0.0%) |
| Bottled, Tank, or LP Gas | 10 (6.0%) | 0 (0.0%) |
| Electricity | 150 (90.4%) | 175 (100.0%) |
| Fuel Oil or Kerosene | 0 (0.0%) | 0 (0.0%) |
| Coal or Coke | 0 (0.0%) | 0 (0.0%) |
| All other Fuels | 6 (3.6%) | 0 (0.0%) |
| No Fuel Used | 0 (0.0%) | 0 (0.0%) |
| Total | 166 (100.0%) | 175 (100.0%) |
Household Vehicle Usage in Pine Lakes
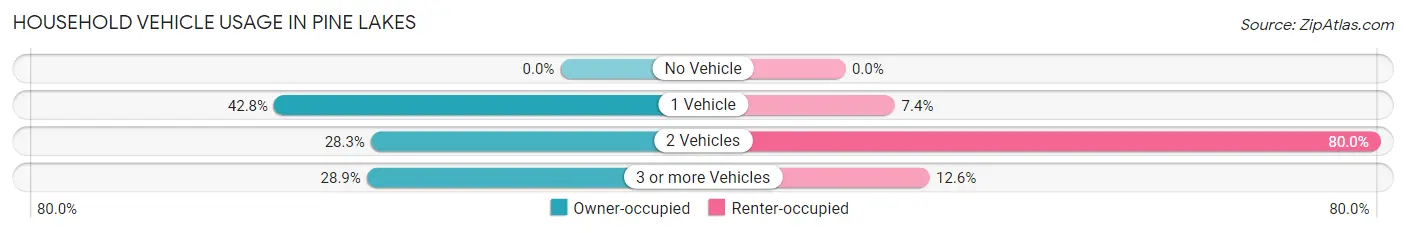
| Vehicles per Household | Owner-occupied | Renter-occupied |
| No Vehicle | 0 (0.0%) | 0 (0.0%) |
| 1 Vehicle | 71 (42.8%) | 13 (7.4%) |
| 2 Vehicles | 47 (28.3%) | 140 (80.0%) |
| 3 or more Vehicles | 48 (28.9%) | 22 (12.6%) |
| Total | 166 (100.0%) | 175 (100.0%) |
Real Estate & Mortgages in Pine Lakes
Real Estate and Mortgage Overview in Pine Lakes
| Characteristic | Without Mortgage | With Mortgage |
| Housing Units | 122 | 44 |
| Median Property Value | $80,600 | $95,000 |
| Median Household Income | $44,167 | $0 |
| Monthly Housing Costs | $272 | $0 |
| Real Estate Taxes | $581 | $0 |
Property Value by Mortgage Status in Pine Lakes
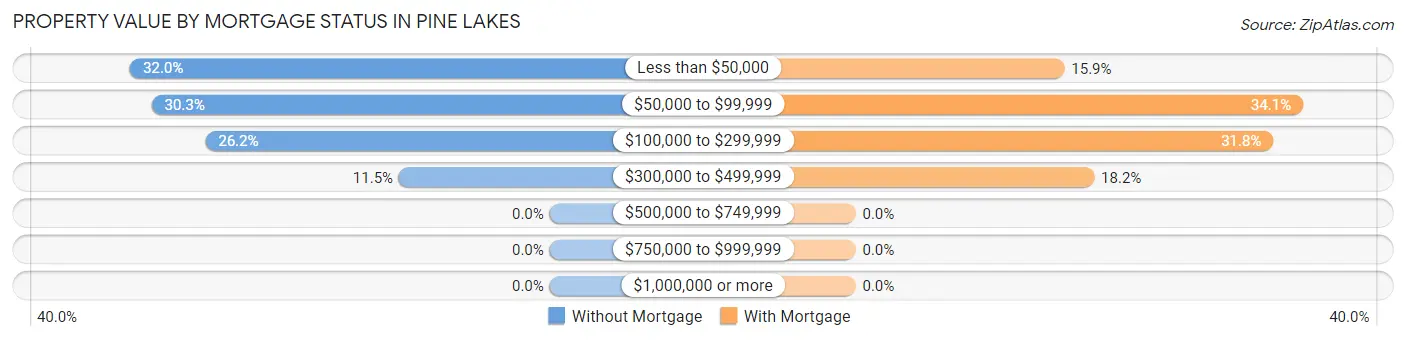
| Property Value | Without Mortgage | With Mortgage |
| Less than $50,000 | 39 (32.0%) | 7 (15.9%) |
| $50,000 to $99,999 | 37 (30.3%) | 15 (34.1%) |
| $100,000 to $299,999 | 32 (26.2%) | 14 (31.8%) |
| $300,000 to $499,999 | 14 (11.5%) | 8 (18.2%) |
| $500,000 to $749,999 | 0 (0.0%) | 0 (0.0%) |
| $750,000 to $999,999 | 0 (0.0%) | 0 (0.0%) |
| $1,000,000 or more | 0 (0.0%) | 0 (0.0%) |
| Total | 122 (100.0%) | 44 (100.0%) |
Household Income by Mortgage Status in Pine Lakes
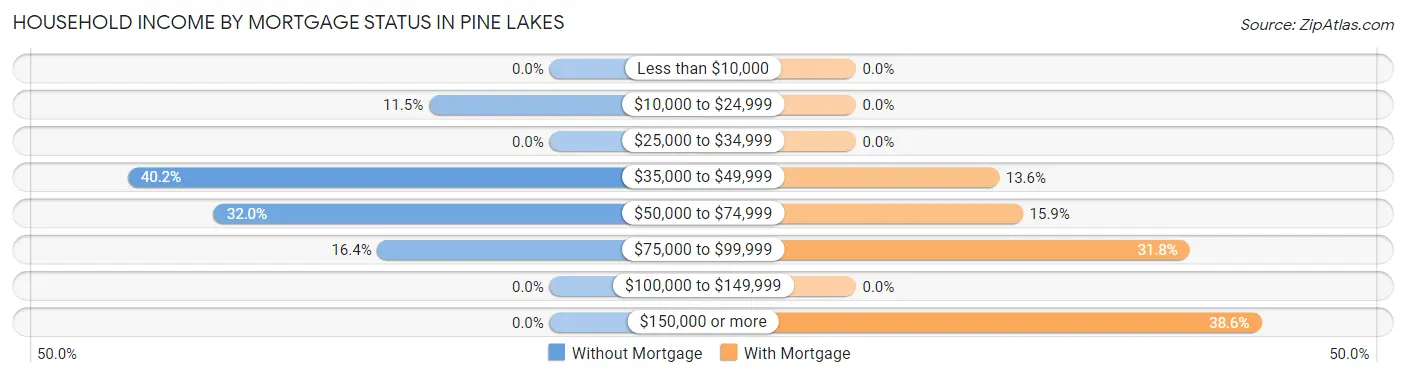
| Household Income | Without Mortgage | With Mortgage |
| Less than $10,000 | 0 (0.0%) | 0 (0.0%) |
| $10,000 to $24,999 | 14 (11.5%) | 0 (0.0%) |
| $25,000 to $34,999 | 0 (0.0%) | 0 (0.0%) |
| $35,000 to $49,999 | 49 (40.2%) | 6 (13.6%) |
| $50,000 to $74,999 | 39 (32.0%) | 7 (15.9%) |
| $75,000 to $99,999 | 20 (16.4%) | 14 (31.8%) |
| $100,000 to $149,999 | 0 (0.0%) | 0 (0.0%) |
| $150,000 or more | 0 (0.0%) | 17 (38.6%) |
| Total | 122 (100.0%) | 44 (100.0%) |
Property Value to Household Income Ratio in Pine Lakes
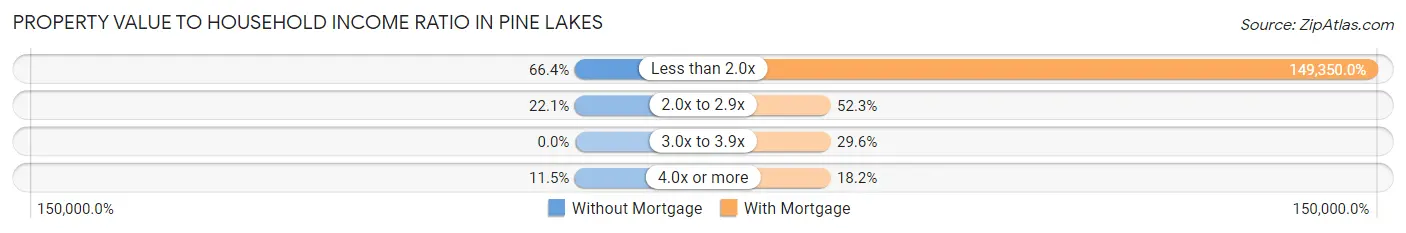
| Value-to-Income Ratio | Without Mortgage | With Mortgage |
| Less than 2.0x | 81 (66.4%) | 65,714 (149,350.0%) |
| 2.0x to 2.9x | 27 (22.1%) | 23 (52.3%) |
| 3.0x to 3.9x | 0 (0.0%) | 13 (29.5%) |
| 4.0x or more | 14 (11.5%) | 8 (18.2%) |
| Total | 122 (100.0%) | 44 (100.0%) |
Real Estate Taxes by Mortgage Status in Pine Lakes
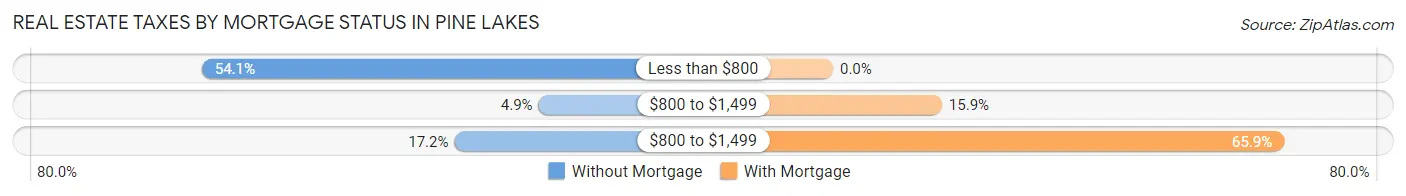
| Property Taxes | Without Mortgage | With Mortgage |
| Less than $800 | 66 (54.1%) | 0 (0.0%) |
| $800 to $1,499 | 6 (4.9%) | 7 (15.9%) |
| $800 to $1,499 | 21 (17.2%) | 29 (65.9%) |
| Total | 122 (100.0%) | 44 (100.0%) |
Health & Disability in Pine Lakes
Health Insurance Coverage by Age in Pine Lakes
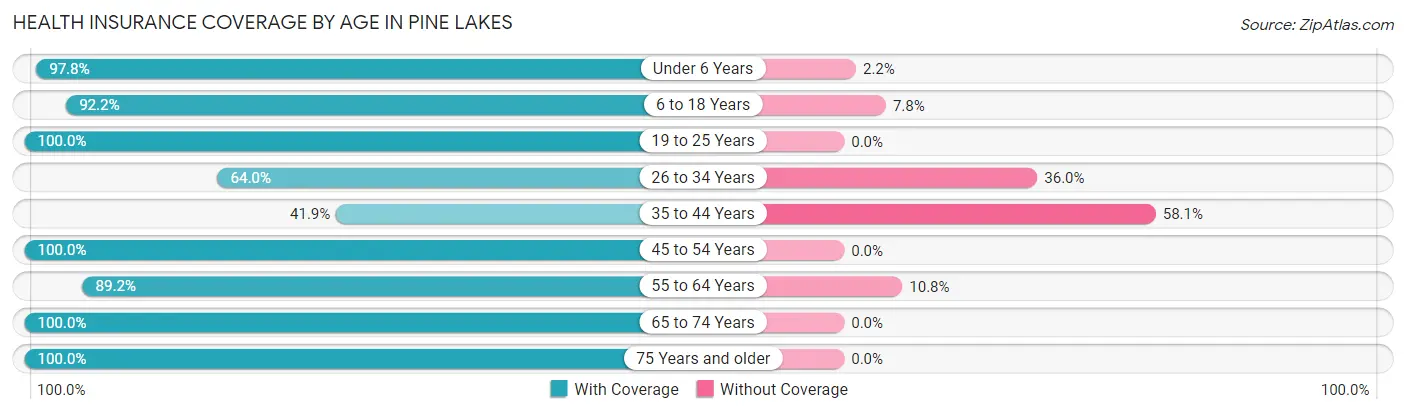
| Age Bracket | With Coverage | Without Coverage |
| Under 6 Years | 312 (97.8%) | 7 (2.2%) |
| 6 to 18 Years | 261 (92.2%) | 22 (7.8%) |
| 19 to 25 Years | 69 (100.0%) | 0 (0.0%) |
| 26 to 34 Years | 16 (64.0%) | 9 (36.0%) |
| 35 to 44 Years | 127 (41.9%) | 176 (58.1%) |
| 45 to 54 Years | 6 (100.0%) | 0 (0.0%) |
| 55 to 64 Years | 107 (89.2%) | 13 (10.8%) |
| 65 to 74 Years | 135 (100.0%) | 0 (0.0%) |
| 75 Years and older | 14 (100.0%) | 0 (0.0%) |
| Total | 1,047 (82.2%) | 227 (17.8%) |
Health Insurance Coverage by Citizenship Status in Pine Lakes
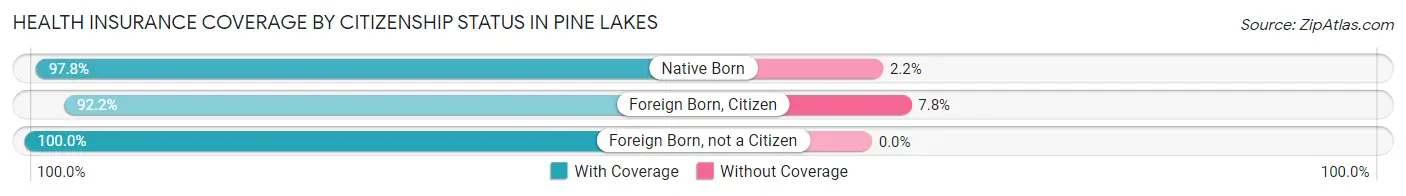
| Citizenship Status | With Coverage | Without Coverage |
| Native Born | 312 (97.8%) | 7 (2.2%) |
| Foreign Born, Citizen | 261 (92.2%) | 22 (7.8%) |
| Foreign Born, not a Citizen | 69 (100.0%) | 0 (0.0%) |
Health Insurance Coverage by Household Income in Pine Lakes
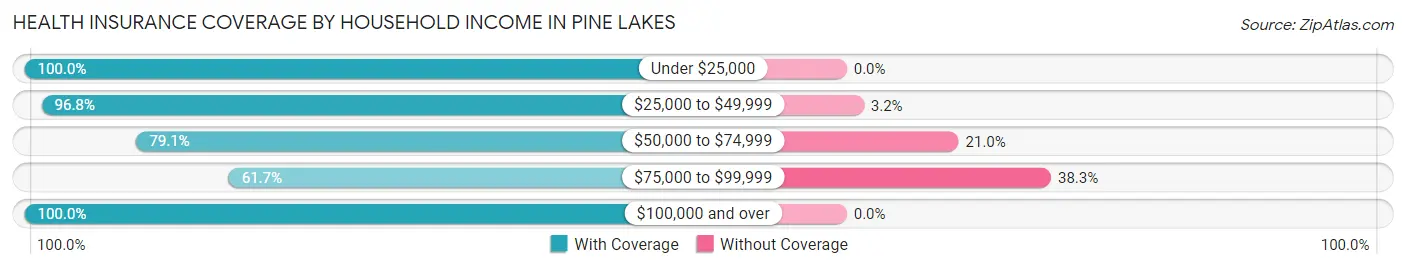
| Household Income | With Coverage | Without Coverage |
| Under $25,000 | 74 (100.0%) | 0 (0.0%) |
| $25,000 to $49,999 | 182 (96.8%) | 6 (3.2%) |
| $50,000 to $74,999 | 717 (79.0%) | 190 (20.9%) |
| $75,000 to $99,999 | 50 (61.7%) | 31 (38.3%) |
| $100,000 and over | 24 (100.0%) | 0 (0.0%) |
Public vs Private Health Insurance Coverage by Age in Pine Lakes
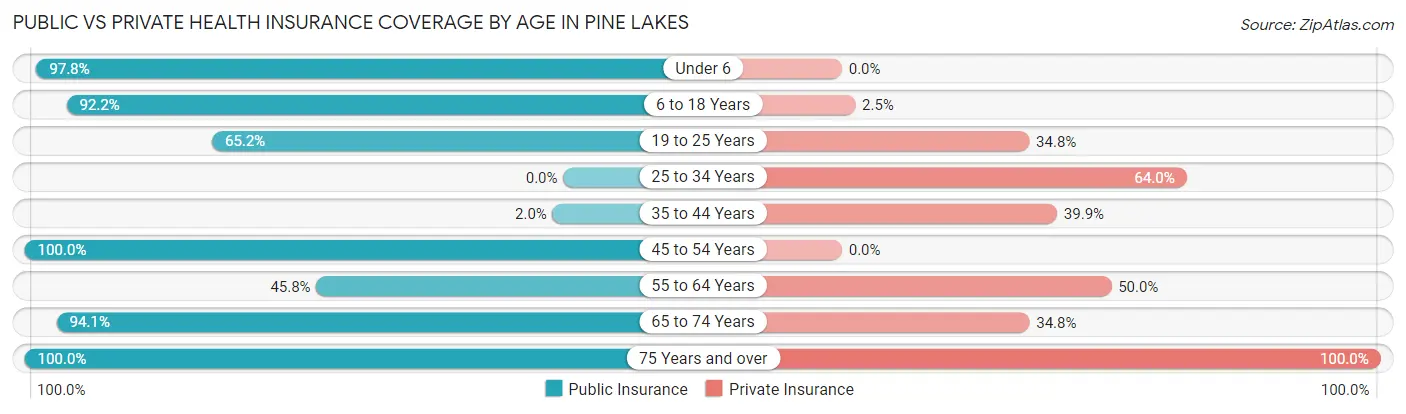
| Age Bracket | Public Insurance | Private Insurance |
| Under 6 | 312 (97.8%) | 0 (0.0%) |
| 6 to 18 Years | 261 (92.2%) | 7 (2.5%) |
| 19 to 25 Years | 45 (65.2%) | 24 (34.8%) |
| 25 to 34 Years | 0 (0.0%) | 16 (64.0%) |
| 35 to 44 Years | 6 (2.0%) | 121 (39.9%) |
| 45 to 54 Years | 6 (100.0%) | 0 (0.0%) |
| 55 to 64 Years | 55 (45.8%) | 60 (50.0%) |
| 65 to 74 Years | 127 (94.1%) | 47 (34.8%) |
| 75 Years and over | 14 (100.0%) | 14 (100.0%) |
| Total | 826 (64.8%) | 289 (22.7%) |
Disability Status by Sex by Age in Pine Lakes
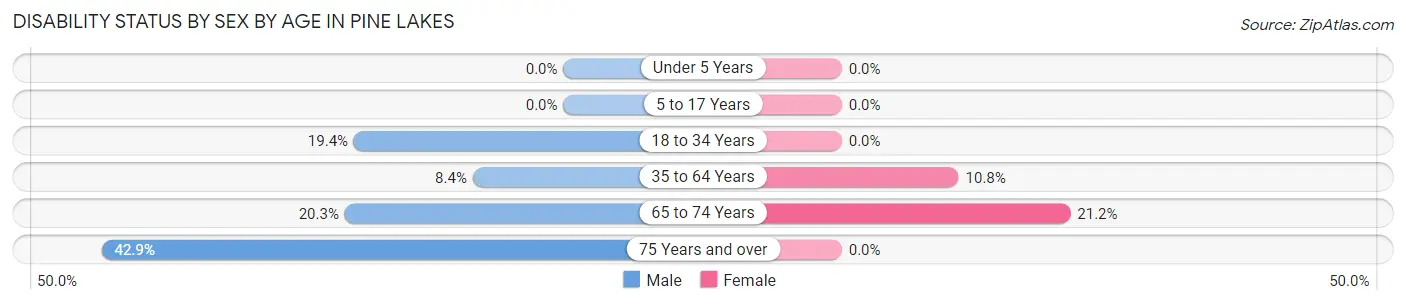
| Age Bracket | Male | Female |
| Under 5 Years | 0 (0.0%) | 0 (0.0%) |
| 5 to 17 Years | 0 (0.0%) | 0 (0.0%) |
| 18 to 34 Years | 14 (19.4%) | 0 (0.0%) |
| 35 to 64 Years | 19 (8.4%) | 22 (10.8%) |
| 65 to 74 Years | 14 (20.3%) | 14 (21.2%) |
| 75 Years and over | 6 (42.9%) | 0 (0.0%) |
Disability Class by Sex by Age in Pine Lakes
Disability Class: Hearing Difficulty
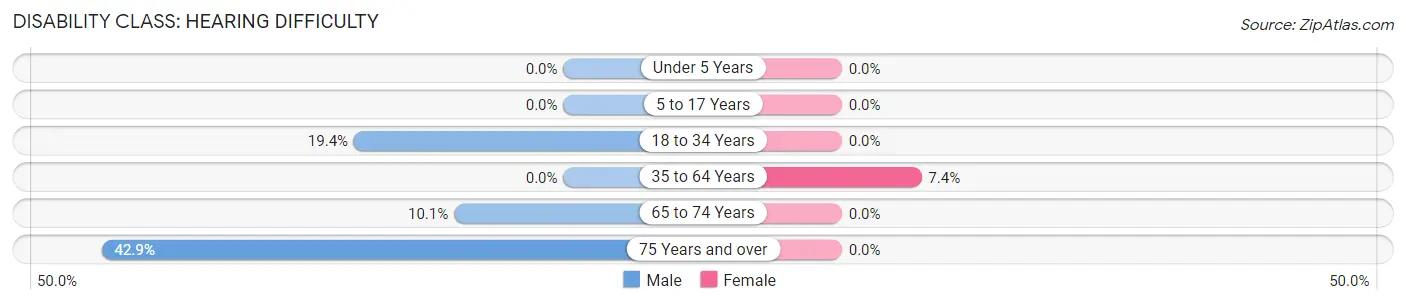
| Age Bracket | Male | Female |
| Under 5 Years | 0 (0.0%) | 0 (0.0%) |
| 5 to 17 Years | 0 (0.0%) | 0 (0.0%) |
| 18 to 34 Years | 14 (19.4%) | 0 (0.0%) |
| 35 to 64 Years | 0 (0.0%) | 15 (7.4%) |
| 65 to 74 Years | 7 (10.1%) | 0 (0.0%) |
| 75 Years and over | 6 (42.9%) | 0 (0.0%) |
Disability Class: Vision Difficulty
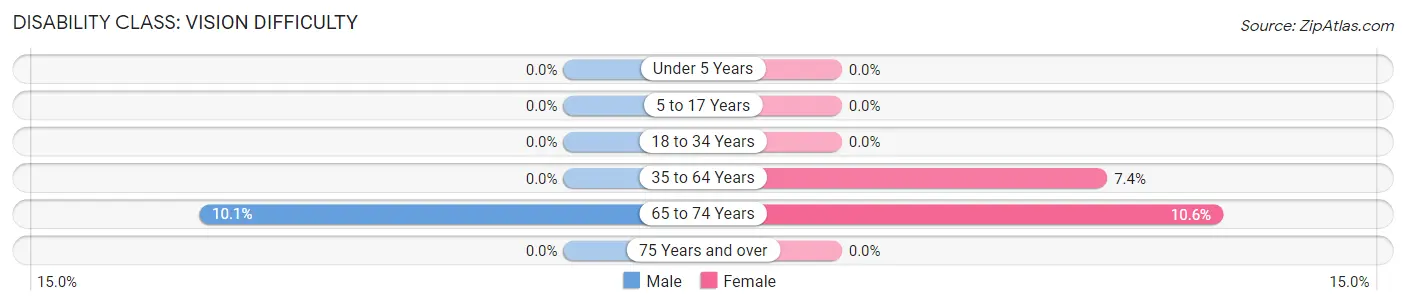
| Age Bracket | Male | Female |
| Under 5 Years | 0 (0.0%) | 0 (0.0%) |
| 5 to 17 Years | 0 (0.0%) | 0 (0.0%) |
| 18 to 34 Years | 0 (0.0%) | 0 (0.0%) |
| 35 to 64 Years | 0 (0.0%) | 15 (7.4%) |
| 65 to 74 Years | 7 (10.1%) | 7 (10.6%) |
| 75 Years and over | 0 (0.0%) | 0 (0.0%) |
Disability Class: Cognitive Difficulty
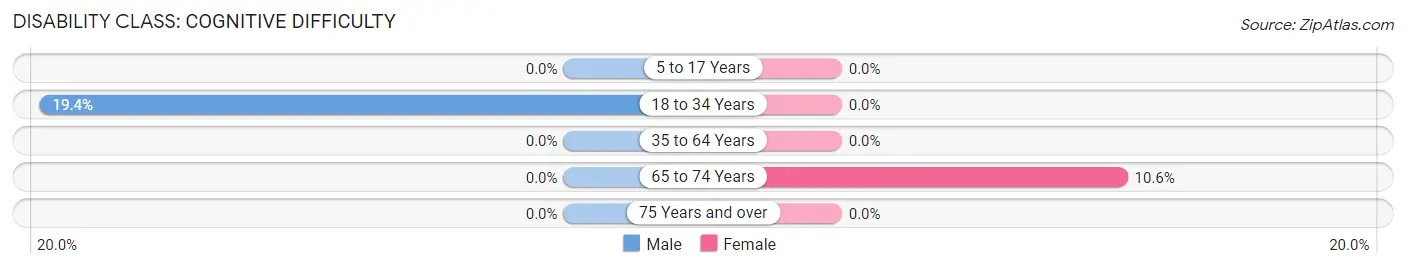
| Age Bracket | Male | Female |
| 5 to 17 Years | 0 (0.0%) | 0 (0.0%) |
| 18 to 34 Years | 14 (19.4%) | 0 (0.0%) |
| 35 to 64 Years | 0 (0.0%) | 0 (0.0%) |
| 65 to 74 Years | 0 (0.0%) | 7 (10.6%) |
| 75 Years and over | 0 (0.0%) | 0 (0.0%) |
Disability Class: Ambulatory Difficulty
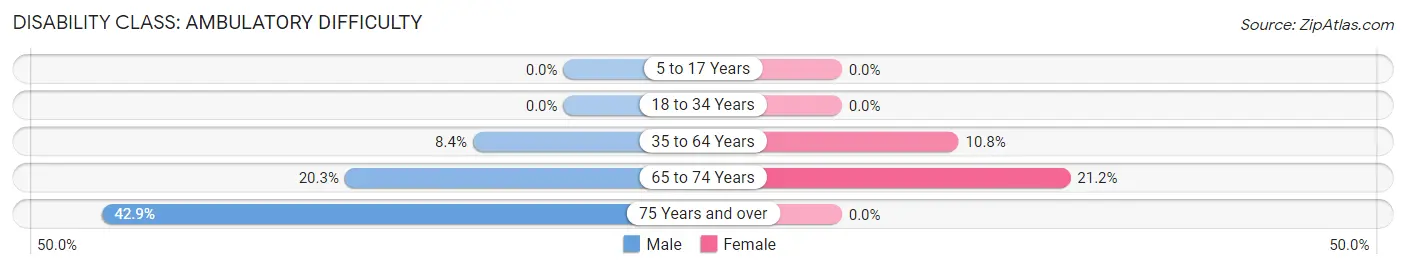
| Age Bracket | Male | Female |
| 5 to 17 Years | 0 (0.0%) | 0 (0.0%) |
| 18 to 34 Years | 0 (0.0%) | 0 (0.0%) |
| 35 to 64 Years | 19 (8.4%) | 22 (10.8%) |
| 65 to 74 Years | 14 (20.3%) | 14 (21.2%) |
| 75 Years and over | 6 (42.9%) | 0 (0.0%) |
Disability Class: Self-Care Difficulty
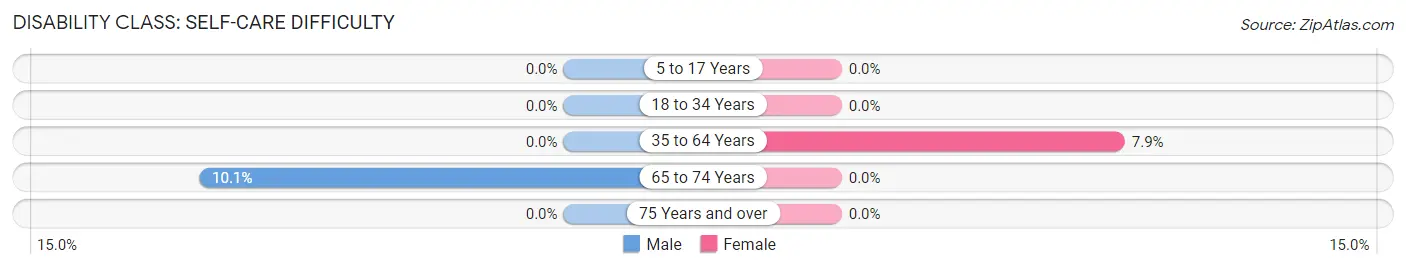
| Age Bracket | Male | Female |
| 5 to 17 Years | 0 (0.0%) | 0 (0.0%) |
| 18 to 34 Years | 0 (0.0%) | 0 (0.0%) |
| 35 to 64 Years | 0 (0.0%) | 16 (7.9%) |
| 65 to 74 Years | 7 (10.1%) | 0 (0.0%) |
| 75 Years and over | 0 (0.0%) | 0 (0.0%) |
Technology Access in Pine Lakes
Computing Device Access in Pine Lakes
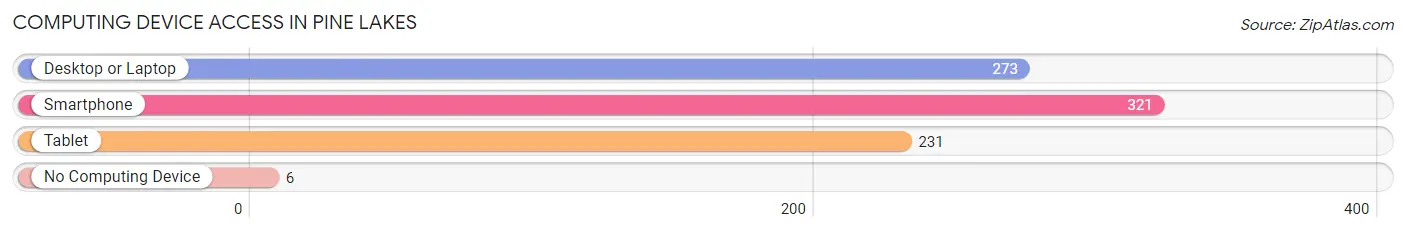
| Device Type | # Households | % Households |
| Desktop or Laptop | 273 | 80.1% |
| Smartphone | 321 | 94.1% |
| Tablet | 231 | 67.7% |
| No Computing Device | 6 | 1.8% |
| Total | 341 | 100.0% |
Internet Access in Pine Lakes
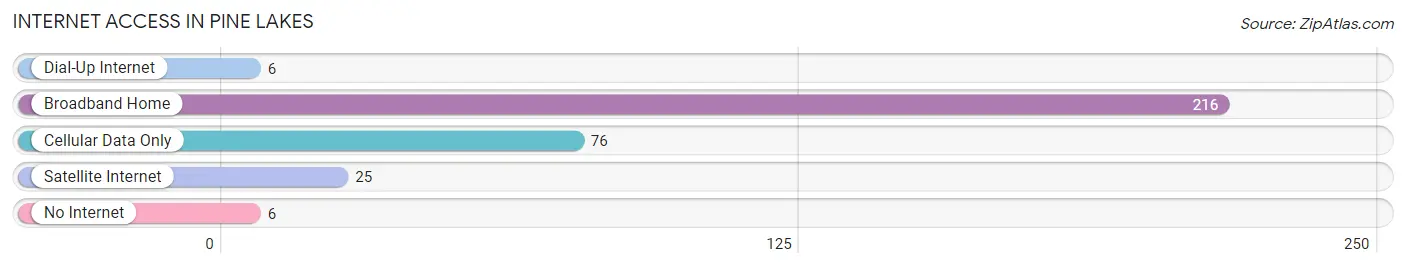
| Internet Type | # Households | % Households |
| Dial-Up Internet | 6 | 1.8% |
| Broadband Home | 216 | 63.3% |
| Cellular Data Only | 76 | 22.3% |
| Satellite Internet | 25 | 7.3% |
| No Internet | 6 | 1.8% |
| Total | 341 | 100.0% |
Pine Lakes Summary
Pine Lakes is a small town located in the state of Florida, United States. It is situated in the northern part of the state, in the county of Pasco. The town is located on the banks of the Anclote River, and is surrounded by the cities of New Port Richey, Port Richey, and Hudson. The population of Pine Lakes was estimated to be around 4,000 in 2020.
History
Pine Lakes was first settled in the late 1800s by a group of settlers from the nearby town of Port Richey. The settlers were attracted to the area due to its abundance of pine trees, which provided them with a source of lumber for building homes and other structures. The town was officially incorporated in 1925, and the first mayor was elected in 1926.
The town grew slowly over the years, and by the 1950s, it had become a popular tourist destination. The town was known for its fishing, boating, and camping opportunities, as well as its proximity to the Gulf of Mexico. In the 1960s, the town began to experience a population boom, as more people moved to the area to take advantage of the town's amenities.
Geography
Pine Lakes is located in the northern part of Pasco County, Florida. It is situated on the banks of the Anclote River, and is surrounded by the cities of New Port Richey, Port Richey, and Hudson. The town is located approximately 25 miles north of Tampa, and is part of the Tampa Bay Area.
The town is located in a humid subtropical climate zone, and experiences hot and humid summers, and mild winters. The average temperature in the summer months is around 90 degrees Fahrenheit, while the average temperature in the winter months is around 60 degrees Fahrenheit.
Economy
The economy of Pine Lakes is largely based on tourism and retail. The town is home to several restaurants, bars, and shops, as well as a few small businesses. The town is also home to a number of marinas, which provide boat rentals and fishing charters.
The town is also home to a number of manufacturing and industrial businesses, including a paper mill and a plastics factory. The town is also home to a number of agricultural businesses, including a citrus grove and a dairy farm.
Demographics
As of 2020, the population of Pine Lakes was estimated to be around 4,000. The town is predominantly white, with around 75% of the population identifying as such. The remaining 25% of the population is made up of African Americans, Hispanics, and other ethnicities.
The median household income in Pine Lakes is around $50,000, and the median home value is around $150,000. The town has a low unemployment rate, and the majority of the population is employed in the tourism and retail industries.
Conclusion
Pine Lakes is a small town located in the northern part of Pasco County, Florida. It is situated on the banks of the Anclote River, and is surrounded by the cities of New Port Richey, Port Richey, and Hudson. The town is known for its abundance of pine trees, and is a popular tourist destination due to its fishing, boating, and camping opportunities. The population of Pine Lakes was estimated to be around 4,000 in 2020, and the town has a predominantly white population. The economy of Pine Lakes is largely based on tourism and retail, and the town is also home to a number of manufacturing and industrial businesses.
Common Questions
What is Per Capita Income in Pine Lakes?
Per Capita income in Pine Lakes is $16,544.
What is the Median Family Income in Pine Lakes?
Median Family Income in Pine Lakes is $73,302.
What is the Median Household income in Pine Lakes?
Median Household Income in Pine Lakes is $72,509.
What is Income or Wage Gap in Pine Lakes?
Income or Wage Gap in Pine Lakes is 51.9%.
Women in Pine Lakes earn 48.1 cents for every dollar earned by a man.
What is Inequality or Gini Index in Pine Lakes?
Inequality or Gini Index in Pine Lakes is 0.22.
What is the Total Population of Pine Lakes?
Total Population of Pine Lakes is 1,274.
What is the Total Male Population of Pine Lakes?
Total Male Population of Pine Lakes is 407.
What is the Total Female Population of Pine Lakes?
Total Female Population of Pine Lakes is 867.
What is the Ratio of Males per 100 Females in Pine Lakes?
There are 46.94 Males per 100 Females in Pine Lakes.
What is the Ratio of Females per 100 Males in Pine Lakes?
There are 213.02 Females per 100 Males in Pine Lakes.
What is the Median Population Age in Pine Lakes?
Median Population Age in Pine Lakes is 20.7 Years.
What is the Average Family Size in Pine Lakes
Average Family Size in Pine Lakes is 4.9 People.
What is the Average Household Size in Pine Lakes
Average Household Size in Pine Lakes is 3.7 People.
How Large is the Labor Force in Pine Lakes?
There are 583 People in the Labor Forcein in Pine Lakes.
What is the Percentage of People in the Labor Force in Pine Lakes?
72.2% of People are in the Labor Force in Pine Lakes.
What is the Unemployment Rate in Pine Lakes?
Unemployment Rate in Pine Lakes is 26.4%.