Belleair Bluffs, FL Map & Demographics
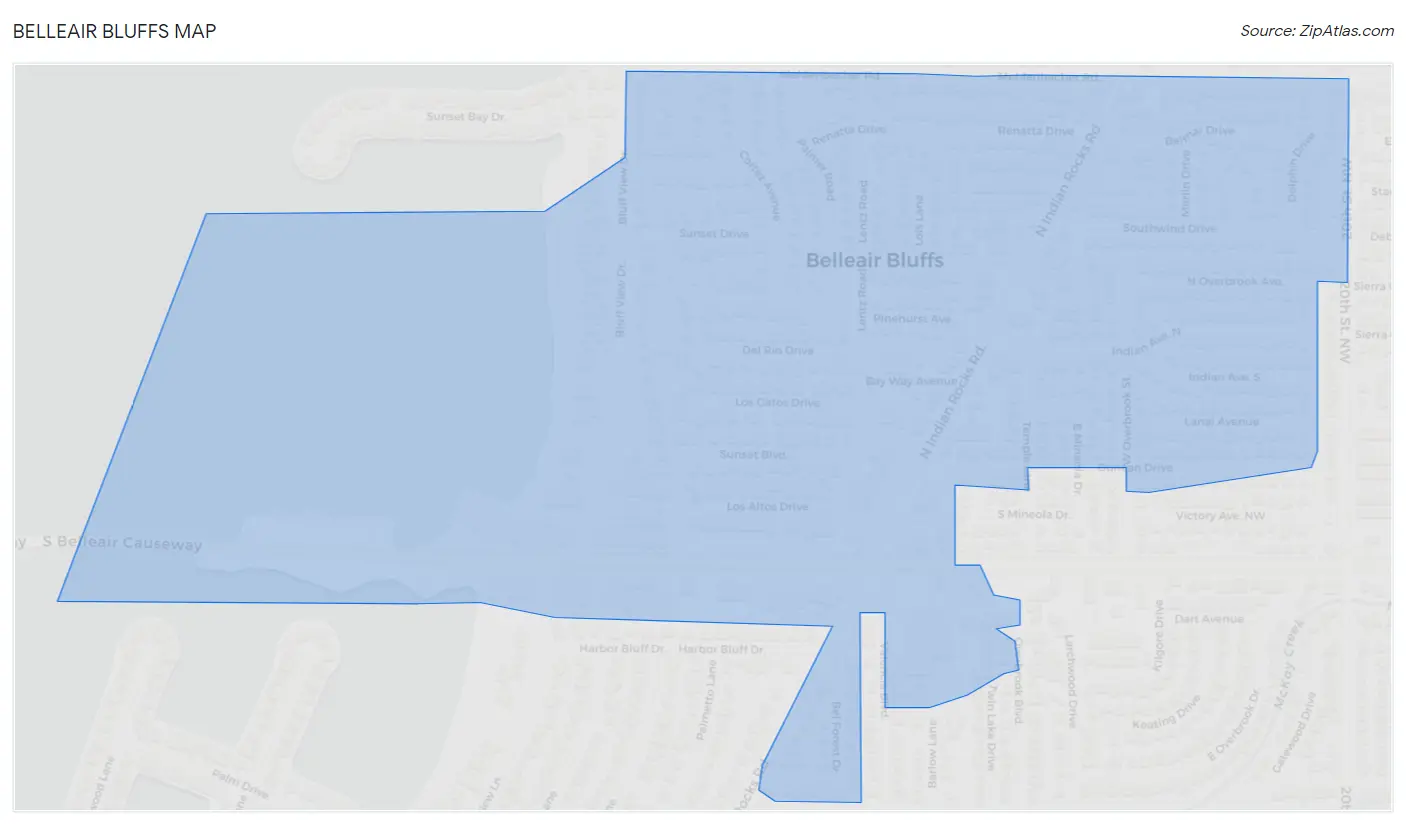
Belleair Bluffs Map
Belleair Bluffs Overview
$58,043
PER CAPITA INCOME
$95,583
AVG FAMILY INCOME
$51,913
AVG HOUSEHOLD INCOME
12.8%
WAGE / INCOME GAP [ % ]
87.2¢/ $1
WAGE / INCOME GAP [ $ ]
$2,016
FAMILY INCOME DEFICIT
0.61
INEQUALITY / GINI INDEX
2,476
TOTAL POPULATION
1,145
MALE POPULATION
1,331
FEMALE POPULATION
86.03
MALES / 100 FEMALES
116.24
FEMALES / 100 MALES
60.1
MEDIAN AGE
3.0
AVG FAMILY SIZE
2.0
AVG HOUSEHOLD SIZE
1,242
LABOR FORCE [ PEOPLE ]
55.3%
PERCENT IN LABOR FORCE
4.7%
UNEMPLOYMENT RATE
Belleair Bluffs Area Codes
Income in Belleair Bluffs
Income Overview in Belleair Bluffs
Per Capita Income in Belleair Bluffs is $58,043, while median incomes of families and households are $95,583 and $51,913 respectively.
| Characteristic | Number | Measure |
| Per Capita Income | 2,476 | $58,043 |
| Median Family Income | 558 | $95,583 |
| Mean Family Income | 558 | $120,031 |
| Median Household Income | 1,229 | $51,913 |
| Mean Household Income | 1,229 | $112,952 |
| Income Deficit | 558 | $2,016 |
| Wage / Income Gap (%) | 2,476 | 12.83% |
| Wage / Income Gap ($) | 2,476 | 87.17¢ per $1 |
| Gini / Inequality Index | 2,476 | 0.61 |
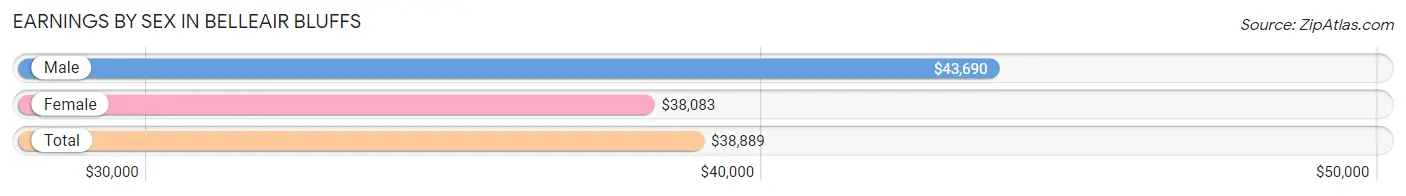
Earnings by Sex in Belleair Bluffs
Average Earnings in Belleair Bluffs are $38,889, $43,690 for men and $38,083 for women, a difference of 12.8%.
| Sex | Number | Average Earnings |
| Male | 618 (48.6%) | $43,690 |
| Female | 654 (51.4%) | $38,083 |
| Total | 1,272 (100.0%) | $38,889 |
Earnings by Sex by Income Bracket in Belleair Bluffs
The most common earnings brackets in Belleair Bluffs are $100,000+ for men (155 | 25.1%) and $65,000 to $74,999 for women (101 | 15.4%).
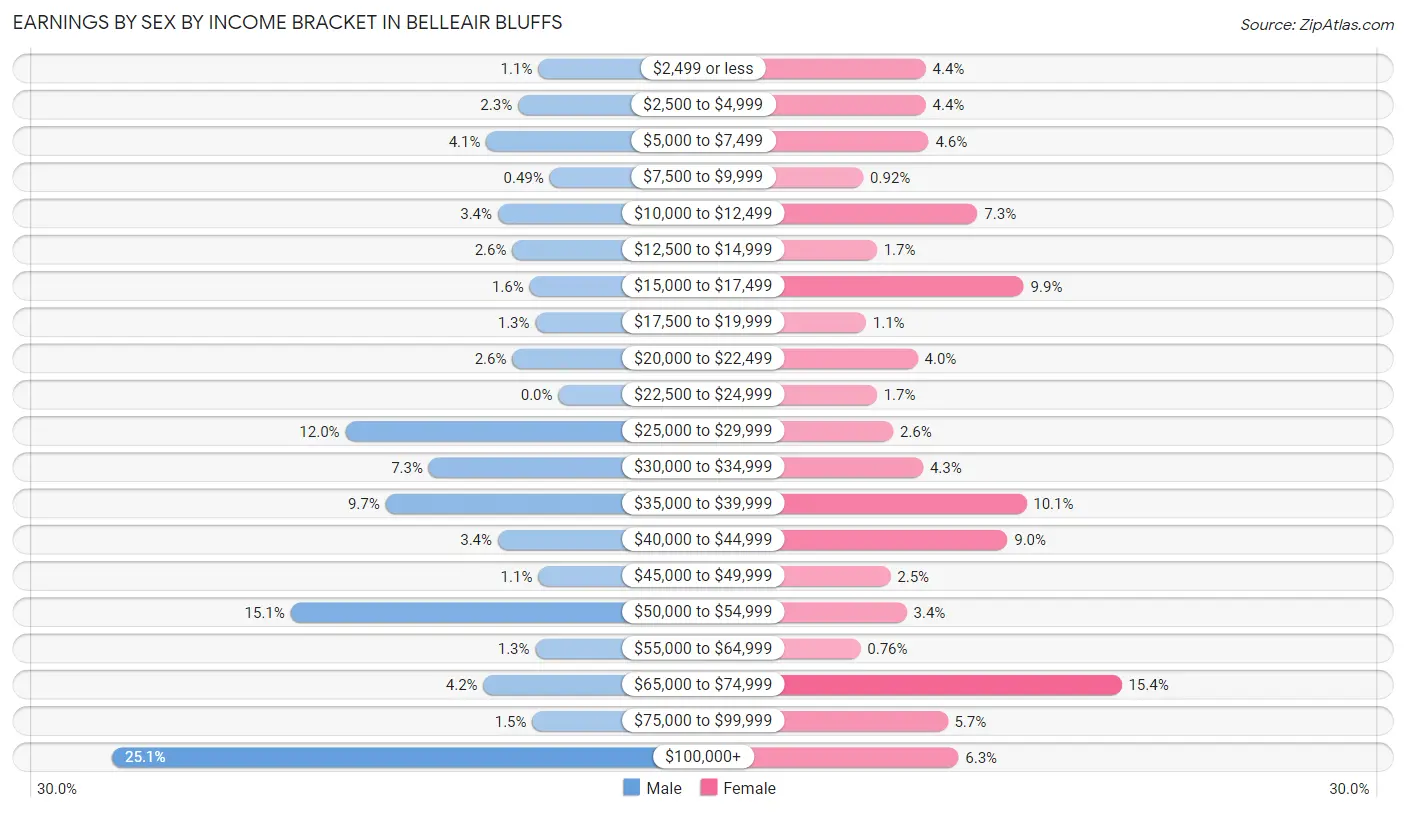
| Income | Male | Female |
| $2,499 or less | 7 (1.1%) | 29 (4.4%) |
| $2,500 to $4,999 | 14 (2.3%) | 29 (4.4%) |
| $5,000 to $7,499 | 25 (4.1%) | 30 (4.6%) |
| $7,500 to $9,999 | 3 (0.5%) | 6 (0.9%) |
| $10,000 to $12,499 | 21 (3.4%) | 48 (7.3%) |
| $12,500 to $14,999 | 16 (2.6%) | 11 (1.7%) |
| $15,000 to $17,499 | 10 (1.6%) | 65 (9.9%) |
| $17,500 to $19,999 | 8 (1.3%) | 7 (1.1%) |
| $20,000 to $22,499 | 16 (2.6%) | 26 (4.0%) |
| $22,500 to $24,999 | 0 (0.0%) | 11 (1.7%) |
| $25,000 to $29,999 | 74 (12.0%) | 17 (2.6%) |
| $30,000 to $34,999 | 45 (7.3%) | 28 (4.3%) |
| $35,000 to $39,999 | 60 (9.7%) | 66 (10.1%) |
| $40,000 to $44,999 | 21 (3.4%) | 59 (9.0%) |
| $45,000 to $49,999 | 7 (1.1%) | 16 (2.5%) |
| $50,000 to $54,999 | 93 (15.0%) | 22 (3.4%) |
| $55,000 to $64,999 | 8 (1.3%) | 5 (0.8%) |
| $65,000 to $74,999 | 26 (4.2%) | 101 (15.4%) |
| $75,000 to $99,999 | 9 (1.5%) | 37 (5.7%) |
| $100,000+ | 155 (25.1%) | 41 (6.3%) |
| Total | 618 (100.0%) | 654 (100.0%) |
Earnings by Sex by Educational Attainment in Belleair Bluffs
Average earnings in Belleair Bluffs are $46,250 for men and $38,792 for women, a difference of 16.1%. Men with an educational attainment of graduate degree enjoy the highest average annual earnings of $167,868, while those with college or associate's degree education earn the least with $32,917. Women with an educational attainment of college or associate's degree earn the most with the average annual earnings of $54,875, while those with less than high school education have the smallest earnings of $18,929.
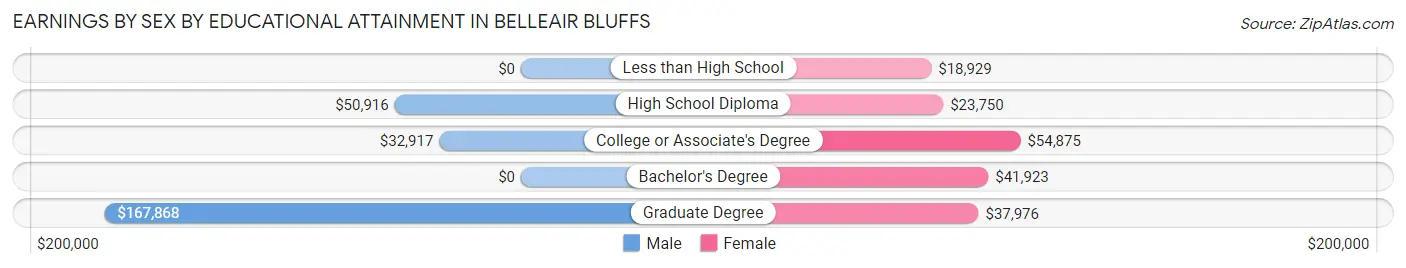
| Educational Attainment | Male Income | Female Income |
| Less than High School | - | - |
| High School Diploma | $50,916 | $23,750 |
| College or Associate's Degree | $32,917 | $54,875 |
| Bachelor's Degree | - | - |
| Graduate Degree | $167,868 | $37,976 |
| Total | $46,250 | $38,792 |
Family Income in Belleair Bluffs
Family Income Brackets in Belleair Bluffs
According to the Belleair Bluffs family income data, there are 134 families falling into the $100,000 to $149,999 income range, which is the most common income bracket and makes up 24.0% of all families.
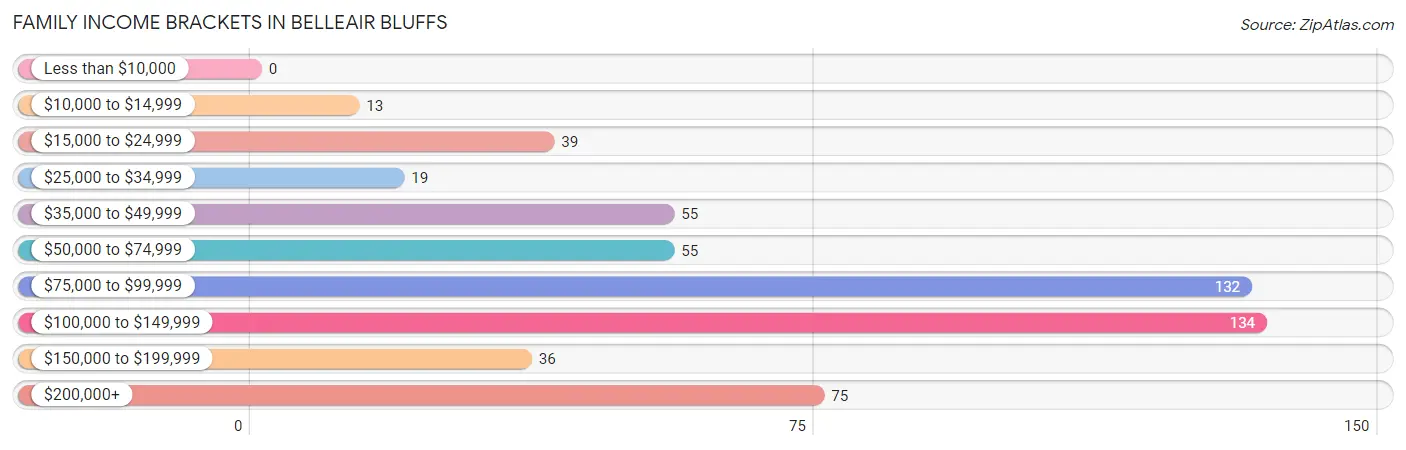
| Income Bracket | # Families | % Families |
| Less than $10,000 | 0 | 0.0% |
| $10,000 to $14,999 | 13 | 2.3% |
| $15,000 to $24,999 | 39 | 7.0% |
| $25,000 to $34,999 | 19 | 3.4% |
| $35,000 to $49,999 | 55 | 9.9% |
| $50,000 to $74,999 | 55 | 9.9% |
| $75,000 to $99,999 | 132 | 23.7% |
| $100,000 to $149,999 | 134 | 24.0% |
| $150,000 to $199,999 | 36 | 6.5% |
| $200,000+ | 75 | 13.4% |
Family Income by Famaliy Size in Belleair Bluffs
2-person families (358 | 64.2%) account for the highest median family income in Belleair Bluffs with $96,333 per family, while 2-person families (358 | 64.2%) have the highest median income of $48,166 per family member.
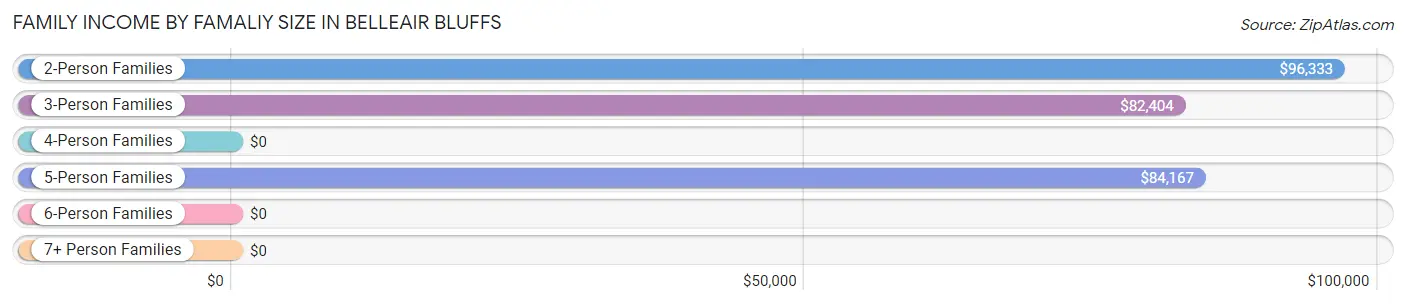
| Income Bracket | # Families | Median Income |
| 2-Person Families | 358 (64.2%) | $96,333 |
| 3-Person Families | 77 (13.8%) | $82,404 |
| 4-Person Families | 33 (5.9%) | $0 |
| 5-Person Families | 90 (16.1%) | $84,167 |
| 6-Person Families | 0 (0.0%) | $0 |
| 7+ Person Families | 0 (0.0%) | $0 |
| Total | 558 (100.0%) | $95,583 |
Family Income by Number of Earners in Belleair Bluffs
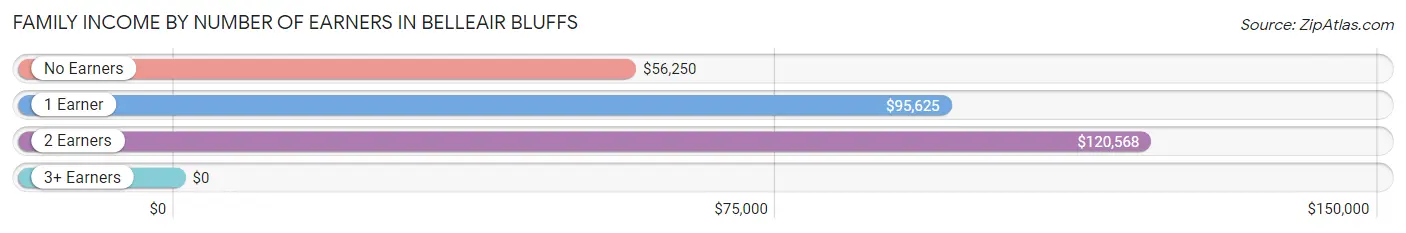
| Number of Earners | # Families | Median Income |
| No Earners | 106 (19.0%) | $56,250 |
| 1 Earner | 233 (41.8%) | $95,625 |
| 2 Earners | 173 (31.0%) | $120,568 |
| 3+ Earners | 46 (8.2%) | $0 |
| Total | 558 (100.0%) | $95,583 |
Household Income in Belleair Bluffs
Household Income Brackets in Belleair Bluffs
With 213 households falling in the category, the $35,000 to $49,999 income range is the most frequent in Belleair Bluffs, accounting for 17.3% of all households. In contrast, only 28 households (2.3%) fall into the $10,000 to $14,999 income bracket, making it the least populous group.
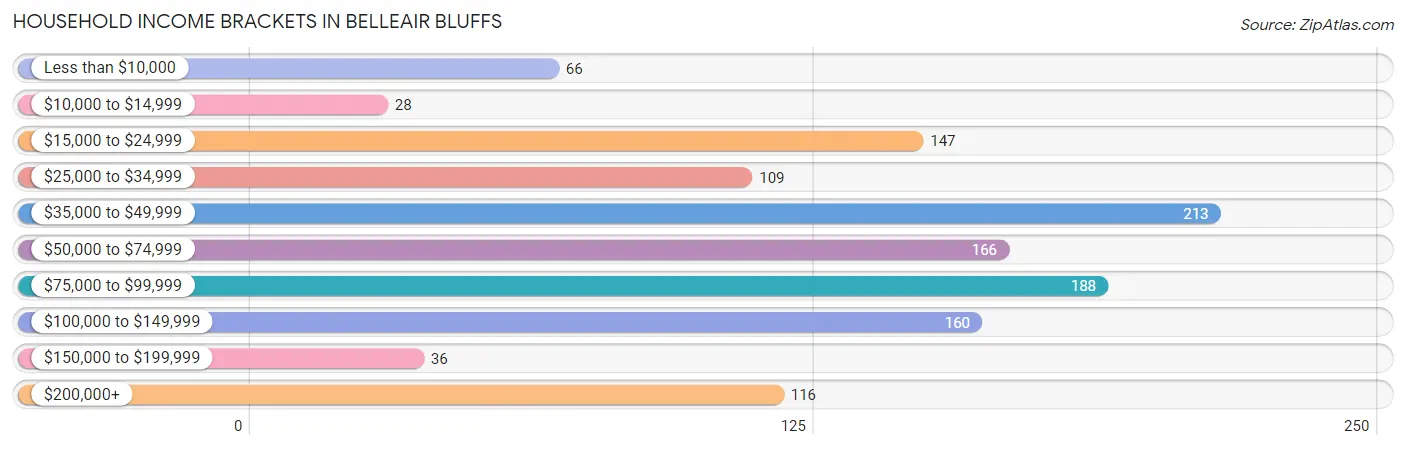
| Income Bracket | # Households | % Households |
| Less than $10,000 | 66 | 5.4% |
| $10,000 to $14,999 | 28 | 2.3% |
| $15,000 to $24,999 | 147 | 12.0% |
| $25,000 to $34,999 | 109 | 8.9% |
| $35,000 to $49,999 | 213 | 17.3% |
| $50,000 to $74,999 | 166 | 13.5% |
| $75,000 to $99,999 | 188 | 15.3% |
| $100,000 to $149,999 | 160 | 13.0% |
| $150,000 to $199,999 | 36 | 2.9% |
| $200,000+ | 116 | 9.4% |
Household Income by Householder Age in Belleair Bluffs
The median household income in Belleair Bluffs is $51,913, with the highest median household income of $75,238 found in the 45 to 64 years age bracket for the primary householder. A total of 496 households (40.4%) fall into this category. Meanwhile, the 15 to 24 years age bracket for the primary householder has the lowest median household income of $0, with 7 households (0.6%) in this group.
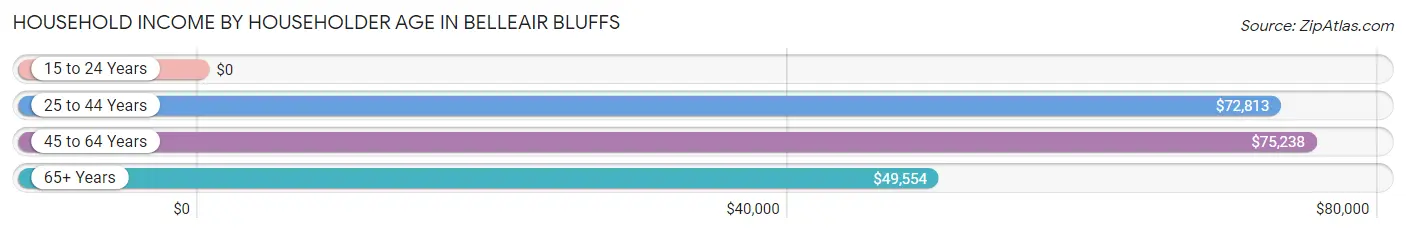
| Income Bracket | # Households | Median Income |
| 15 to 24 Years | 7 (0.6%) | $0 |
| 25 to 44 Years | 82 (6.7%) | $72,813 |
| 45 to 64 Years | 496 (40.4%) | $75,238 |
| 65+ Years | 644 (52.4%) | $49,554 |
| Total | 1,229 (100.0%) | $51,913 |
Poverty in Belleair Bluffs
Income Below Poverty by Sex and Age in Belleair Bluffs
With 4.1% poverty level for males and 12.4% for females among the residents of Belleair Bluffs, 75 year old and over males and 55 to 64 year old females are the most vulnerable to poverty, with 21 males (15.0%) and 88 females (29.3%) in their respective age groups living below the poverty level.
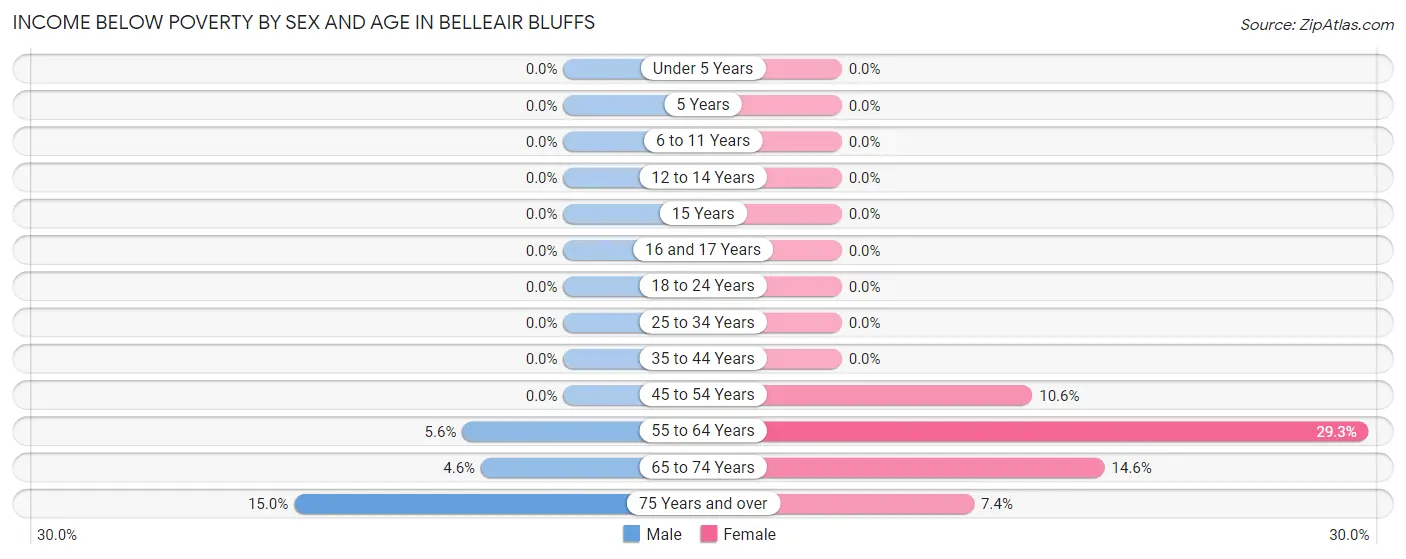
| Age Bracket | Male | Female |
| Under 5 Years | 0 (0.0%) | 0 (0.0%) |
| 5 Years | 0 (0.0%) | 0 (0.0%) |
| 6 to 11 Years | 0 (0.0%) | 0 (0.0%) |
| 12 to 14 Years | 0 (0.0%) | 0 (0.0%) |
| 15 Years | 0 (0.0%) | 0 (0.0%) |
| 16 and 17 Years | 0 (0.0%) | 0 (0.0%) |
| 18 to 24 Years | 0 (0.0%) | 0 (0.0%) |
| 25 to 34 Years | 0 (0.0%) | 0 (0.0%) |
| 35 to 44 Years | 0 (0.0%) | 0 (0.0%) |
| 45 to 54 Years | 0 (0.0%) | 19 (10.6%) |
| 55 to 64 Years | 13 (5.6%) | 88 (29.3%) |
| 65 to 74 Years | 13 (4.6%) | 42 (14.6%) |
| 75 Years and over | 21 (15.0%) | 16 (7.4%) |
| Total | 47 (4.1%) | 165 (12.4%) |
Income Above Poverty by Sex and Age in Belleair Bluffs
According to the poverty statistics in Belleair Bluffs, males aged under 5 years and females aged under 5 years are the age groups that are most secure financially, with 100.0% of males and 100.0% of females in these age groups living above the poverty line.
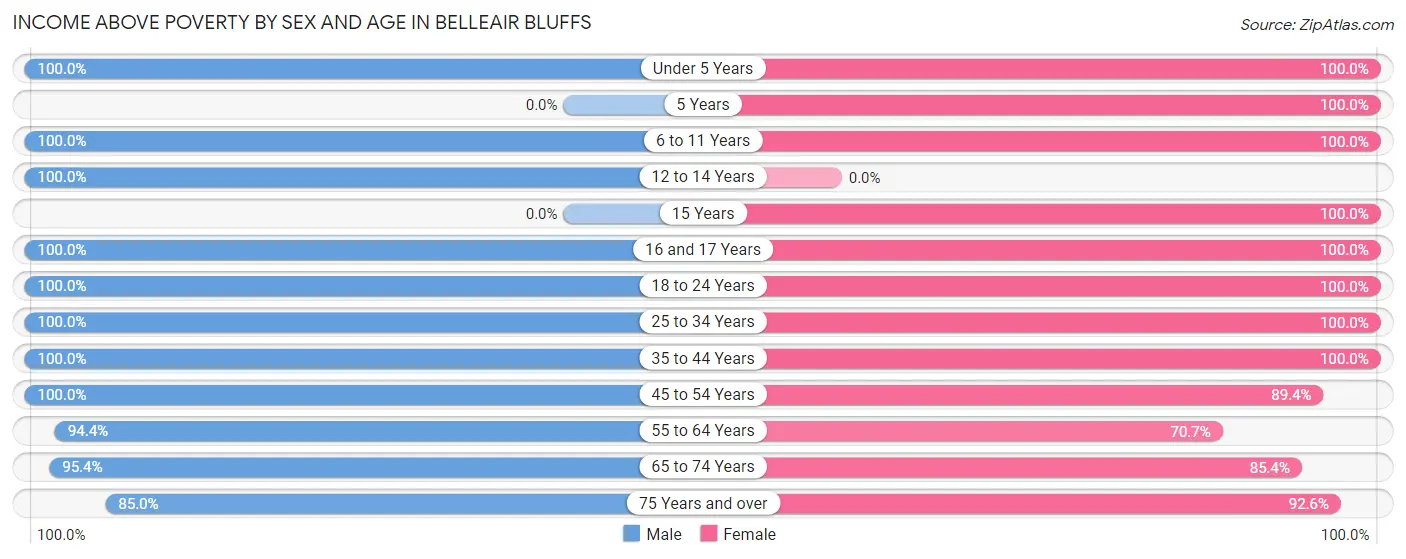
| Age Bracket | Male | Female |
| Under 5 Years | 11 (100.0%) | 22 (100.0%) |
| 5 Years | 0 (0.0%) | 11 (100.0%) |
| 6 to 11 Years | 58 (100.0%) | 50 (100.0%) |
| 12 to 14 Years | 43 (100.0%) | 0 (0.0%) |
| 15 Years | 0 (0.0%) | 35 (100.0%) |
| 16 and 17 Years | 18 (100.0%) | 8 (100.0%) |
| 18 to 24 Years | 29 (100.0%) | 58 (100.0%) |
| 25 to 34 Years | 51 (100.0%) | 57 (100.0%) |
| 35 to 44 Years | 44 (100.0%) | 107 (100.0%) |
| 45 to 54 Years | 237 (100.0%) | 160 (89.4%) |
| 55 to 64 Years | 218 (94.4%) | 212 (70.7%) |
| 65 to 74 Years | 270 (95.4%) | 245 (85.4%) |
| 75 Years and over | 119 (85.0%) | 201 (92.6%) |
| Total | 1,098 (95.9%) | 1,166 (87.6%) |
Income Below Poverty Among Married-Couple Families in Belleair Bluffs
The poverty statistics for married-couple families in Belleair Bluffs show that 6.5% or 32 of the total 493 families live below the poverty line. Families with no children have the highest poverty rate of 7.9%, comprising of 32 families. On the other hand, families with 1 or 2 children have the lowest poverty rate of 0.0%, which includes 0 families.
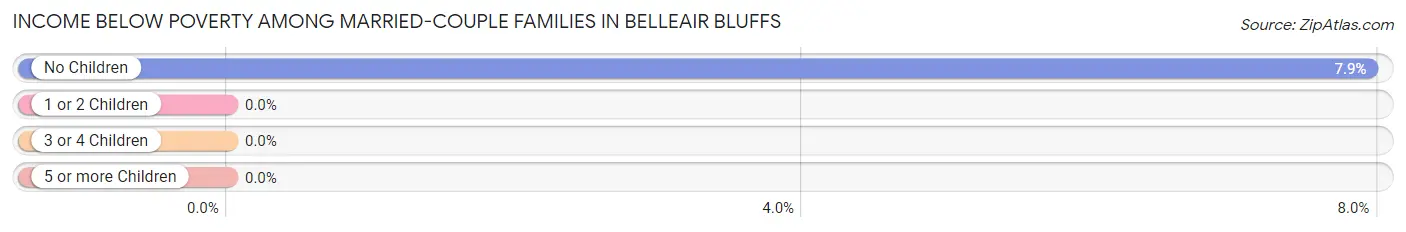
| Children | Above Poverty | Below Poverty |
| No Children | 371 (92.1%) | 32 (7.9%) |
| 1 or 2 Children | 38 (100.0%) | 0 (0.0%) |
| 3 or 4 Children | 52 (100.0%) | 0 (0.0%) |
| 5 or more Children | 0 (0.0%) | 0 (0.0%) |
| Total | 461 (93.5%) | 32 (6.5%) |
Income Below Poverty Among Single-Parent Households in Belleair Bluffs
| Children | Single Father | Single Mother |
| No Children | 0 (0.0%) | 0 (0.0%) |
| 1 or 2 Children | 0 (0.0%) | 0 (0.0%) |
| 3 or 4 Children | 0 (0.0%) | 0 (0.0%) |
| 5 or more Children | 0 (0.0%) | 0 (0.0%) |
| Total | 0 (0.0%) | 0 (0.0%) |
Income Below Poverty Among Married-Couple vs Single-Parent Households in Belleair Bluffs
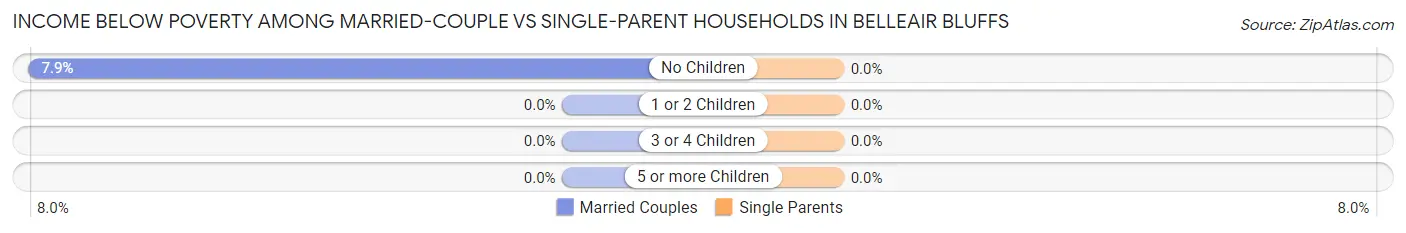
| Children | Married-Couple Families | Single-Parent Households |
| No Children | 32 (7.9%) | 0 (0.0%) |
| 1 or 2 Children | 0 (0.0%) | 0 (0.0%) |
| 3 or 4 Children | 0 (0.0%) | 0 (0.0%) |
| 5 or more Children | 0 (0.0%) | 0 (0.0%) |
| Total | 32 (6.5%) | 0 (0.0%) |
Race in Belleair Bluffs
The most populous races in Belleair Bluffs are White / Caucasian (2,263 | 91.4%), Hispanic or Latino (181 | 7.3%), and Two or more Races (88 | 3.5%).
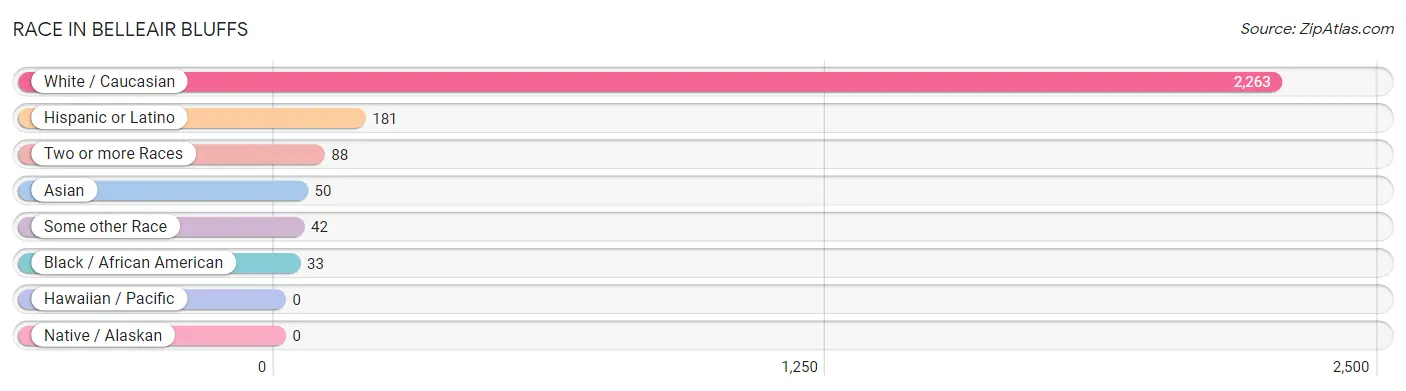
| Race | # Population | % Population |
| Asian | 50 | 2.0% |
| Black / African American | 33 | 1.3% |
| Hawaiian / Pacific | 0 | 0.0% |
| Hispanic or Latino | 181 | 7.3% |
| Native / Alaskan | 0 | 0.0% |
| White / Caucasian | 2,263 | 91.4% |
| Two or more Races | 88 | 3.5% |
| Some other Race | 42 | 1.7% |
| Total | 2,476 | 100.0% |
Ancestry in Belleair Bluffs
The most populous ancestries reported in Belleair Bluffs are Irish (406 | 16.4%), German (340 | 13.7%), English (270 | 10.9%), Italian (234 | 9.5%), and Polish (148 | 6.0%), together accounting for 56.5% of all Belleair Bluffs residents.
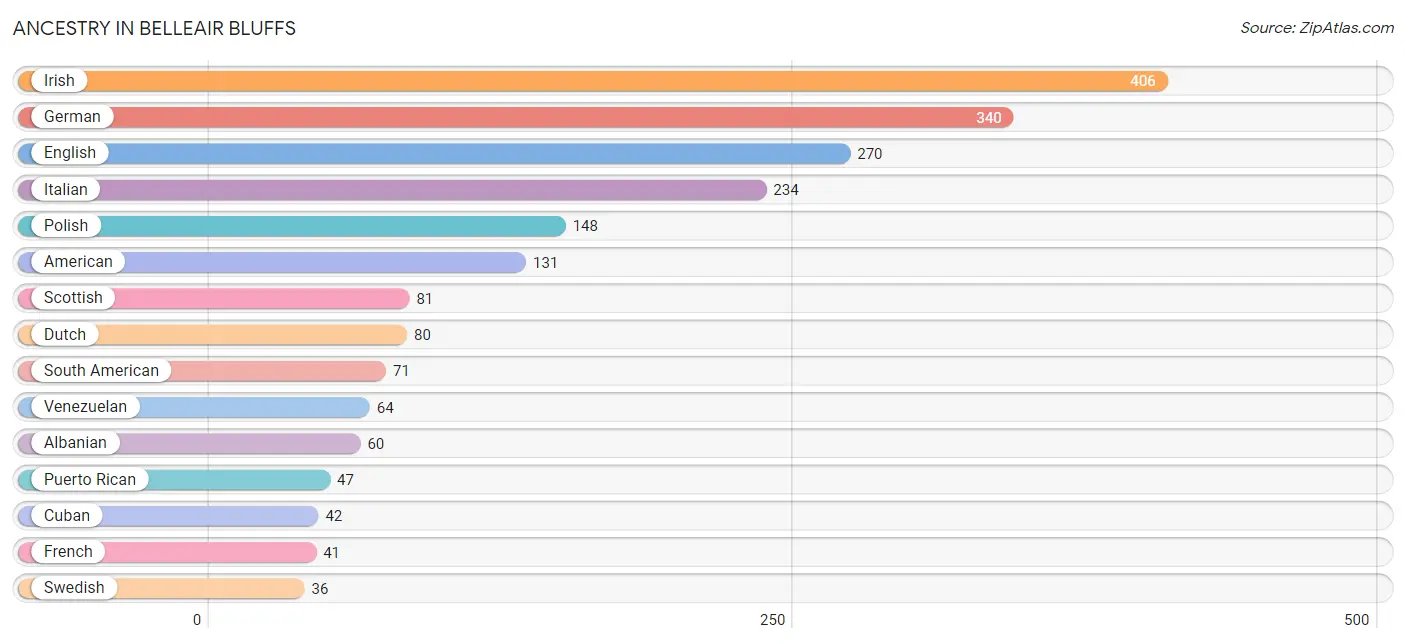
| Ancestry | # Population | % Population |
| Albanian | 60 | 2.4% |
| American | 131 | 5.3% |
| Arab | 10 | 0.4% |
| British | 35 | 1.4% |
| Canadian | 17 | 0.7% |
| Cherokee | 6 | 0.2% |
| Colombian | 7 | 0.3% |
| Cuban | 42 | 1.7% |
| Danish | 10 | 0.4% |
| Dominican | 12 | 0.5% |
| Dutch | 80 | 3.2% |
| English | 270 | 10.9% |
| European | 9 | 0.4% |
| French | 41 | 1.7% |
| French Canadian | 8 | 0.3% |
| German | 340 | 13.7% |
| Hungarian | 10 | 0.4% |
| Indian (Asian) | 30 | 1.2% |
| Irish | 406 | 16.4% |
| Italian | 234 | 9.5% |
| Korean | 7 | 0.3% |
| Lithuanian | 17 | 0.7% |
| Norwegian | 29 | 1.2% |
| Pakistani | 13 | 0.5% |
| Polish | 148 | 6.0% |
| Portuguese | 14 | 0.6% |
| Puerto Rican | 47 | 1.9% |
| Russian | 28 | 1.1% |
| Scandinavian | 14 | 0.6% |
| Scotch-Irish | 18 | 0.7% |
| Scottish | 81 | 3.3% |
| Slovak | 15 | 0.6% |
| Slovene | 9 | 0.4% |
| South American | 71 | 2.9% |
| Spanish | 9 | 0.4% |
| Subsaharan African | 5 | 0.2% |
| Swedish | 36 | 1.5% |
| Venezuelan | 64 | 2.6% |
| Welsh | 12 | 0.5% | View All 39 Rows |
Immigrants in Belleair Bluffs
The most numerous immigrant groups reported in Belleair Bluffs came from Europe (155 | 6.3%), Eastern Europe (88 | 3.5%), Latin America (63 | 2.5%), South America (63 | 2.5%), and Albania (55 | 2.2%), together accounting for 17.1% of all Belleair Bluffs residents.
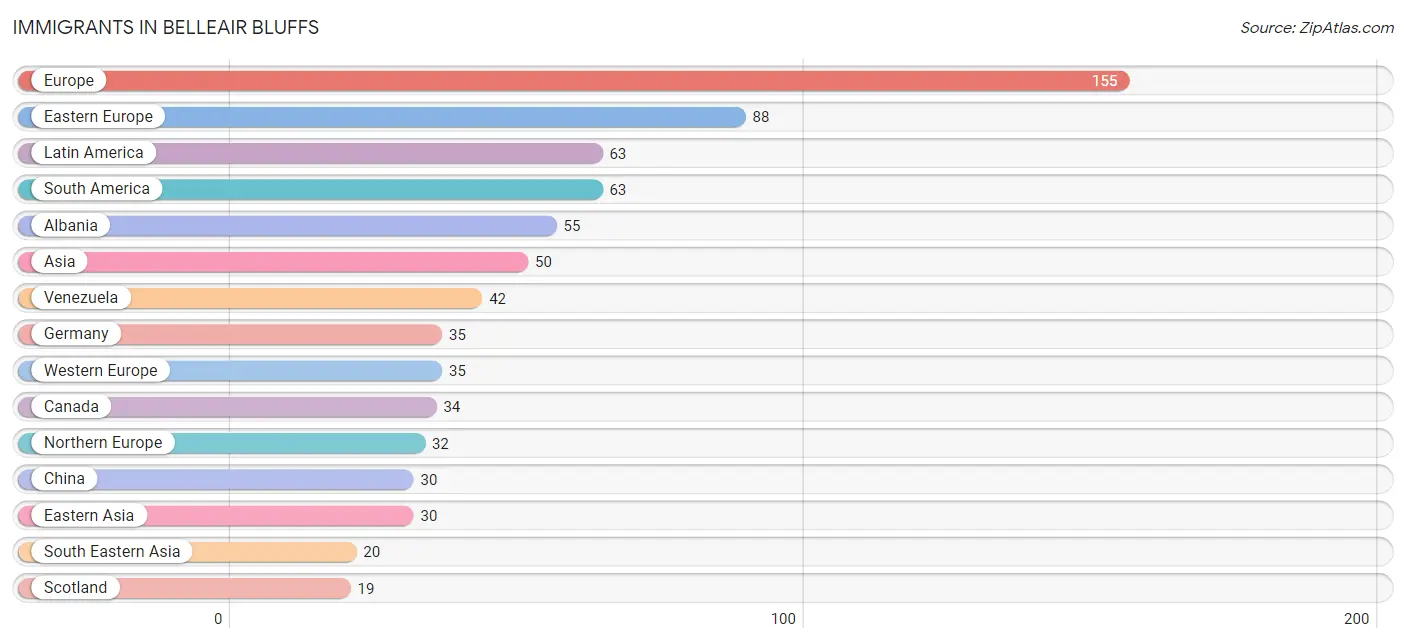
| Immigration Origin | # Population | % Population |
| Albania | 55 | 2.2% |
| Asia | 50 | 2.0% |
| Brazil | 14 | 0.6% |
| Canada | 34 | 1.4% |
| China | 30 | 1.2% |
| Colombia | 7 | 0.3% |
| Eastern Asia | 30 | 1.2% |
| Eastern Europe | 88 | 3.5% |
| Europe | 155 | 6.3% |
| Germany | 35 | 1.4% |
| Hungary | 7 | 0.3% |
| Latin America | 63 | 2.5% |
| Northern Europe | 32 | 1.3% |
| Philippines | 7 | 0.3% |
| Poland | 7 | 0.3% |
| Scotland | 19 | 0.8% |
| South America | 63 | 2.5% |
| South Eastern Asia | 20 | 0.8% |
| Thailand | 13 | 0.5% |
| Ukraine | 19 | 0.8% |
| Venezuela | 42 | 1.7% |
| Western Europe | 35 | 1.4% | View All 22 Rows |
Sex and Age in Belleair Bluffs
Sex and Age in Belleair Bluffs
The most populous age groups in Belleair Bluffs are 50 to 54 Years (152 | 13.3%) for men and 65 to 69 Years (177 | 13.3%) for women.
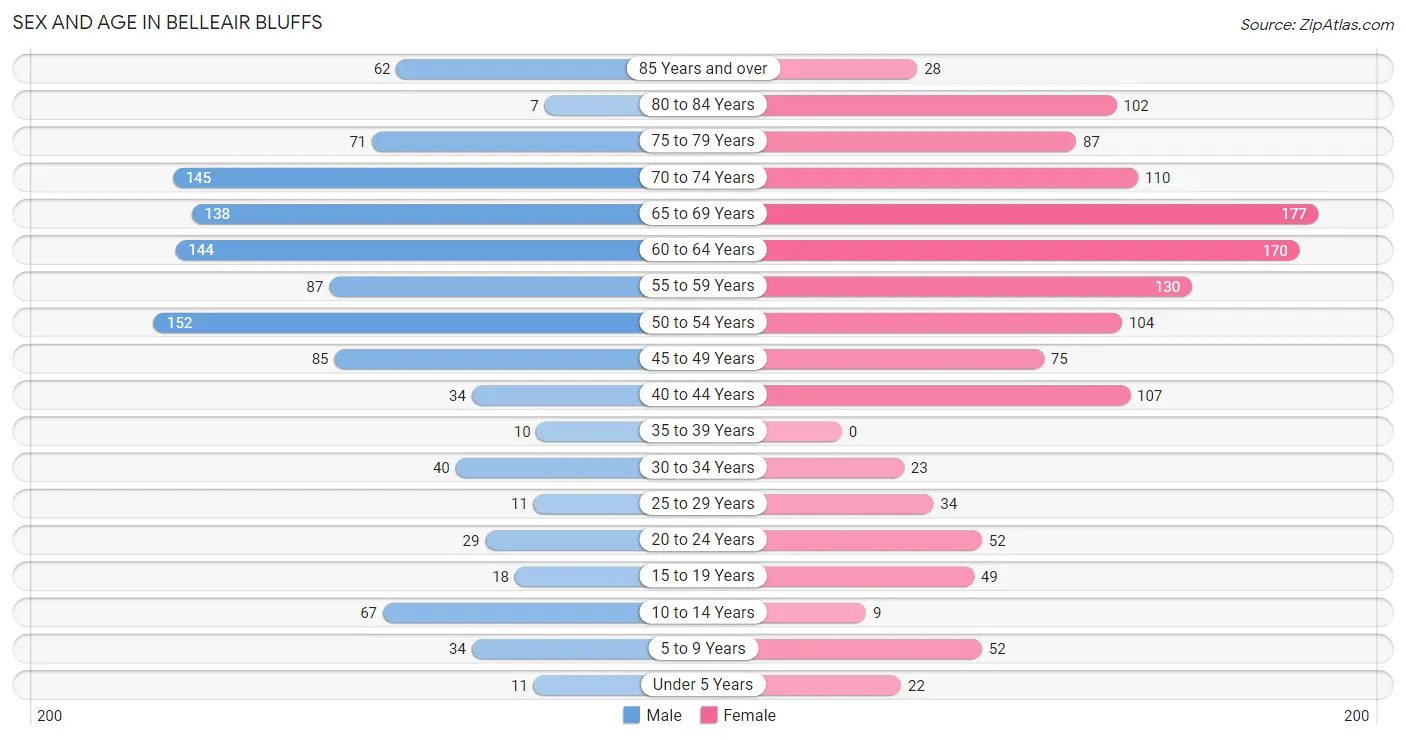
| Age Bracket | Male | Female |
| Under 5 Years | 11 (1.0%) | 22 (1.7%) |
| 5 to 9 Years | 34 (3.0%) | 52 (3.9%) |
| 10 to 14 Years | 67 (5.9%) | 9 (0.7%) |
| 15 to 19 Years | 18 (1.6%) | 49 (3.7%) |
| 20 to 24 Years | 29 (2.5%) | 52 (3.9%) |
| 25 to 29 Years | 11 (1.0%) | 34 (2.5%) |
| 30 to 34 Years | 40 (3.5%) | 23 (1.7%) |
| 35 to 39 Years | 10 (0.9%) | 0 (0.0%) |
| 40 to 44 Years | 34 (3.0%) | 107 (8.0%) |
| 45 to 49 Years | 85 (7.4%) | 75 (5.6%) |
| 50 to 54 Years | 152 (13.3%) | 104 (7.8%) |
| 55 to 59 Years | 87 (7.6%) | 130 (9.8%) |
| 60 to 64 Years | 144 (12.6%) | 170 (12.8%) |
| 65 to 69 Years | 138 (12.0%) | 177 (13.3%) |
| 70 to 74 Years | 145 (12.7%) | 110 (8.3%) |
| 75 to 79 Years | 71 (6.2%) | 87 (6.5%) |
| 80 to 84 Years | 7 (0.6%) | 102 (7.7%) |
| 85 Years and over | 62 (5.4%) | 28 (2.1%) |
| Total | 1,145 (100.0%) | 1,331 (100.0%) |
Families and Households in Belleair Bluffs
Median Family Size in Belleair Bluffs
The median family size in Belleair Bluffs is 2.97 persons per family, with single female/mother families (47 | 8.4%) accounting for the largest median family size of 3.26 persons per family. On the other hand, single male/father families (18 | 3.2%) represent the smallest median family size with 2.22 persons per family.
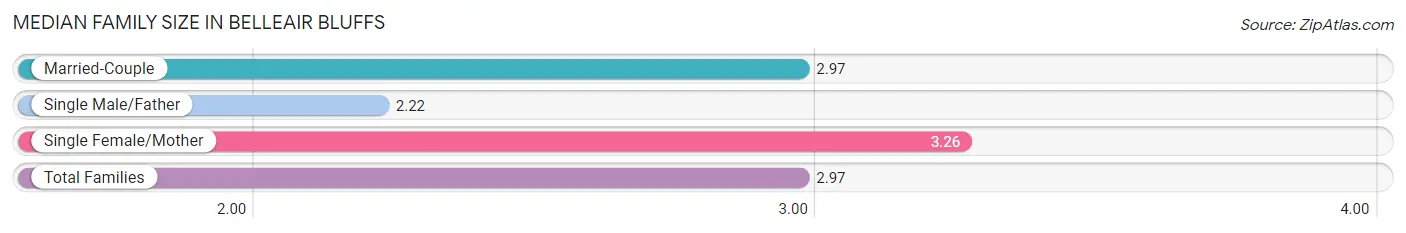
| Family Type | # Families | Family Size |
| Married-Couple | 493 (88.3%) | 2.97 |
| Single Male/Father | 18 (3.2%) | 2.22 |
| Single Female/Mother | 47 (8.4%) | 3.26 |
| Total Families | 558 (100.0%) | 2.97 |
Median Household Size in Belleair Bluffs
The median household size in Belleair Bluffs is 2.01 persons per household, with single female/mother households (47 | 3.8%) accounting for the largest median household size of 3.74 persons per household. non-family households (671 | 54.6%) represent the smallest median household size with 1.17 persons per household.
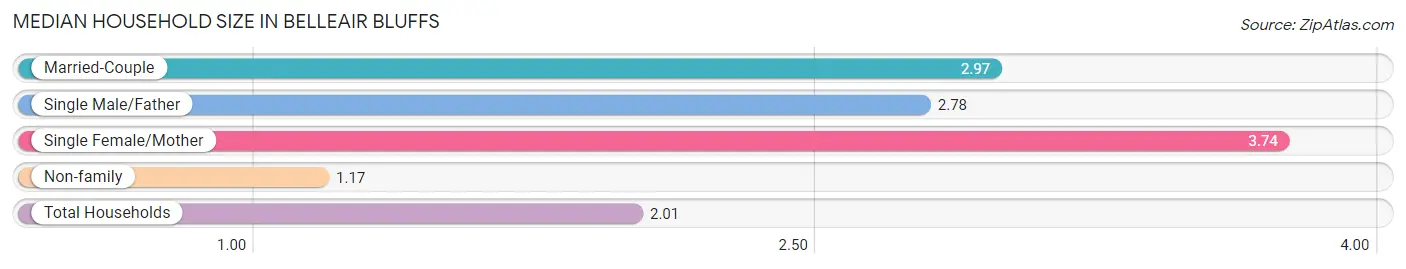
| Household Type | # Households | Household Size |
| Married-Couple | 493 (40.1%) | 2.97 |
| Single Male/Father | 18 (1.5%) | 2.78 |
| Single Female/Mother | 47 (3.8%) | 3.74 |
| Non-family | 671 (54.6%) | 1.17 |
| Total Households | 1,229 (100.0%) | 2.01 |
Household Size by Marriage Status in Belleair Bluffs
Out of a total of 1,229 households in Belleair Bluffs, 558 (45.4%) are family households, while 671 (54.6%) are nonfamily households. The most numerous type of family households are 2-person households, comprising 335, and the most common type of nonfamily households are 1-person households, comprising 565.
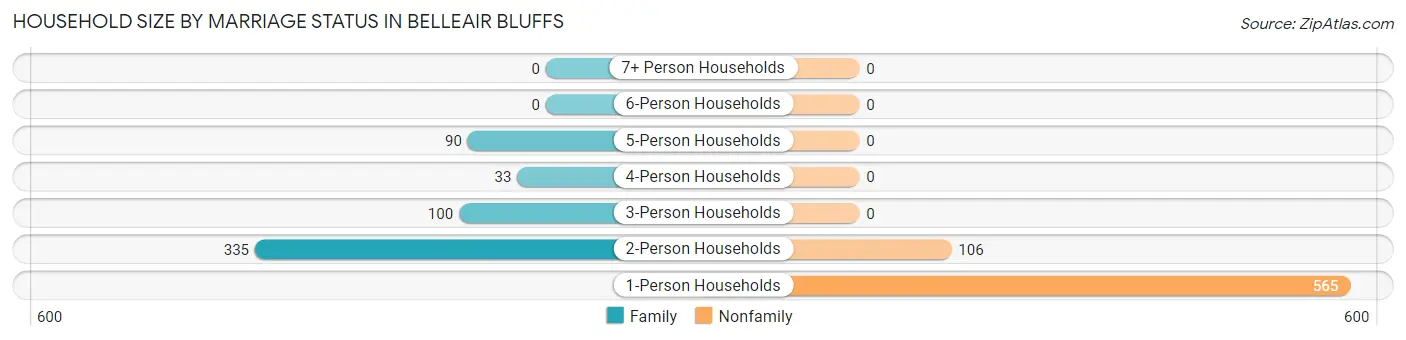
| Household Size | Family Households | Nonfamily Households |
| 1-Person Households | - | 565 (46.0%) |
| 2-Person Households | 335 (27.3%) | 106 (8.6%) |
| 3-Person Households | 100 (8.1%) | 0 (0.0%) |
| 4-Person Households | 33 (2.7%) | 0 (0.0%) |
| 5-Person Households | 90 (7.3%) | 0 (0.0%) |
| 6-Person Households | 0 (0.0%) | 0 (0.0%) |
| 7+ Person Households | 0 (0.0%) | 0 (0.0%) |
| Total | 558 (45.4%) | 671 (54.6%) |
Female Fertility in Belleair Bluffs
Fertility by Age in Belleair Bluffs
| Age Bracket | Women with Births | Births / 1,000 Women |
| 15 to 19 years | 0 (0.0%) | 0.0 |
| 20 to 34 years | 0 (0.0%) | 0.0 |
| 35 to 50 years | 0 (0.0%) | 0.0 |
| Total | 0 (0.0%) | 0.0 |
Fertility by Age by Marriage Status in Belleair Bluffs
| Age Bracket | Married | Unmarried |
| 15 to 19 years | 0 (0.0%) | 0 (0.0%) |
| 20 to 34 years | 0 (0.0%) | 0 (0.0%) |
| 35 to 50 years | 0 (0.0%) | 0 (0.0%) |
| Total | 0 (0.0%) | 0 (0.0%) |
Fertility by Education in Belleair Bluffs
| Educational Attainment | Women with Births | Births / 1,000 Women |
| Less than High School | 0 (0.0%) | 0.0 |
| High School Diploma | 0 (0.0%) | 0.0 |
| College or Associate's Degree | 0 (0.0%) | 0.0 |
| Bachelor's Degree | 0 (0.0%) | 0.0 |
| Graduate Degree | 0 (0.0%) | 0.0 |
| Total | 0 (0.0%) | 0.0 |
Fertility by Education by Marriage Status in Belleair Bluffs
| Educational Attainment | Married | Unmarried |
| Less than High School | 0 (0.0%) | 0 (0.0%) |
| High School Diploma | 0 (0.0%) | 0 (0.0%) |
| College or Associate's Degree | 0 (0.0%) | 0 (0.0%) |
| Bachelor's Degree | 0 (0.0%) | 0 (0.0%) |
| Graduate Degree | 0 (0.0%) | 0 (0.0%) |
| Total | 0 (0.0%) | 0 (0.0%) |
Employment Characteristics in Belleair Bluffs
Employment by Class of Employer in Belleair Bluffs
Among the 1,171 employed individuals in Belleair Bluffs, private company employees (730 | 62.3%), not-for-profit organizations (152 | 13.0%), and self-employed (incorporated) (117 | 10.0%) make up the most common classes of employment.
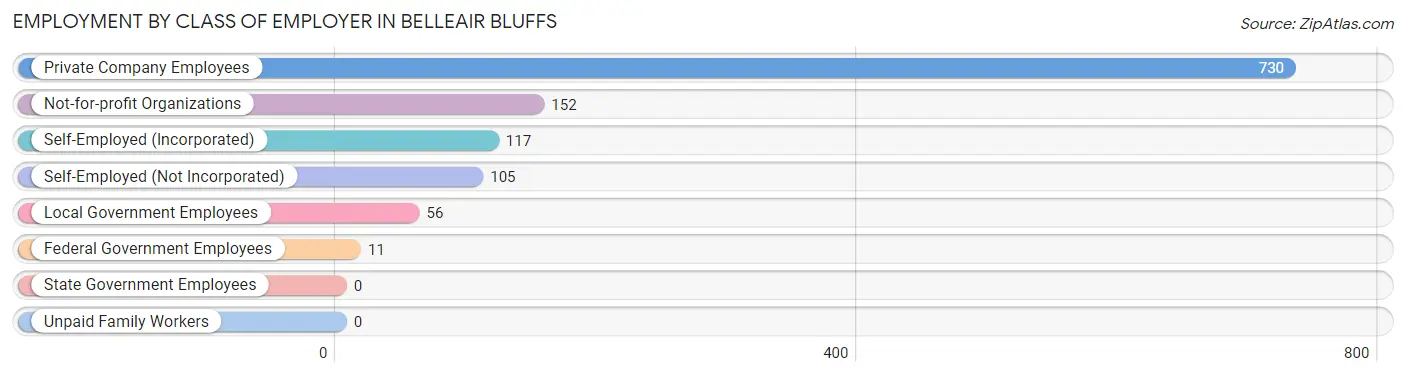
| Employer Class | # Employees | % Employees |
| Private Company Employees | 730 | 62.3% |
| Self-Employed (Incorporated) | 117 | 10.0% |
| Self-Employed (Not Incorporated) | 105 | 9.0% |
| Not-for-profit Organizations | 152 | 13.0% |
| Local Government Employees | 56 | 4.8% |
| State Government Employees | 0 | 0.0% |
| Federal Government Employees | 11 | 0.9% |
| Unpaid Family Workers | 0 | 0.0% |
| Total | 1,171 | 100.0% |
Employment Status by Age in Belleair Bluffs
According to the labor force statistics for Belleair Bluffs, out of the total population over 16 years of age (2,246), 55.3% or 1,242 individuals are in the labor force, with 4.7% or 58 of them unemployed. The age group with the highest labor force participation rate is 20 to 24 years, with 100.0% or 81 individuals in the labor force. Within the labor force, the 20 to 24 years age range has the highest percentage of unemployed individuals, with 28.4% or 23 of them being unemployed.
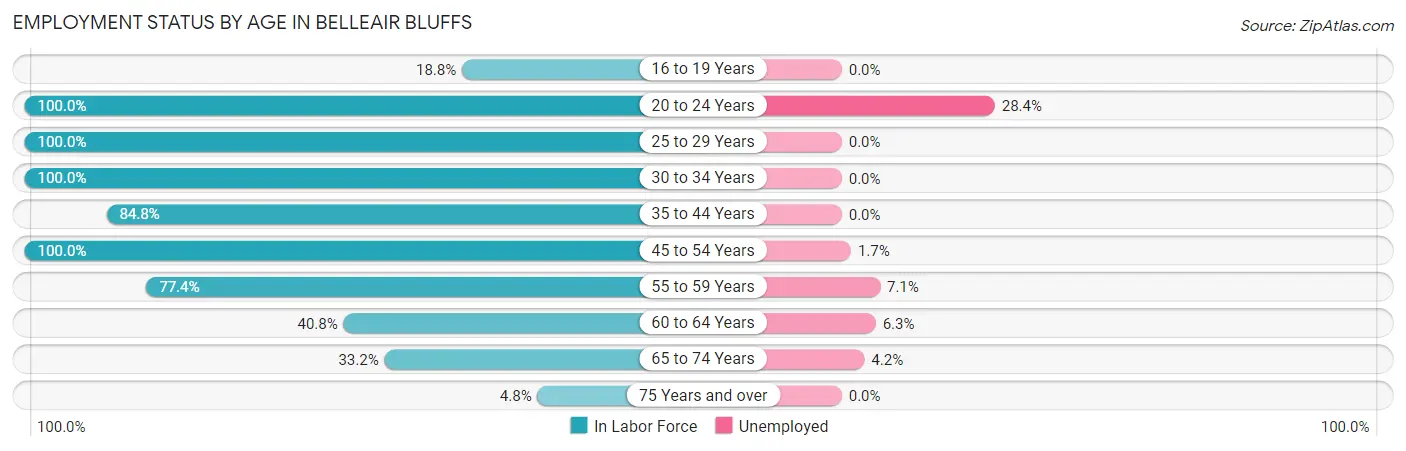
| Age Bracket | In Labor Force | Unemployed |
| 16 to 19 Years | 6 (18.8%) | 0 (0.0%) |
| 20 to 24 Years | 81 (100.0%) | 23 (28.4%) |
| 25 to 29 Years | 45 (100.0%) | 0 (0.0%) |
| 30 to 34 Years | 63 (100.0%) | 0 (0.0%) |
| 35 to 44 Years | 128 (84.8%) | 0 (0.0%) |
| 45 to 54 Years | 416 (100.0%) | 7 (1.7%) |
| 55 to 59 Years | 168 (77.4%) | 12 (7.1%) |
| 60 to 64 Years | 128 (40.8%) | 8 (6.3%) |
| 65 to 74 Years | 189 (33.2%) | 8 (4.2%) |
| 75 Years and over | 17 (4.8%) | 0 (0.0%) |
| Total | 1,242 (55.3%) | 58 (4.7%) |
Employment Status by Educational Attainment in Belleair Bluffs
According to labor force statistics for Belleair Bluffs, 78.6% of individuals (948) out of the total population between 25 and 64 years of age (1,206) are in the labor force, with 2.8% or 27 of them being unemployed. The group with the highest labor force participation rate are those with the educational attainment of college / associate degree, with 88.8% or 332 individuals in the labor force. Within the labor force, individuals with college / associate degree education have the highest percentage of unemployment, with 4.5% or 15 of them being unemployed.
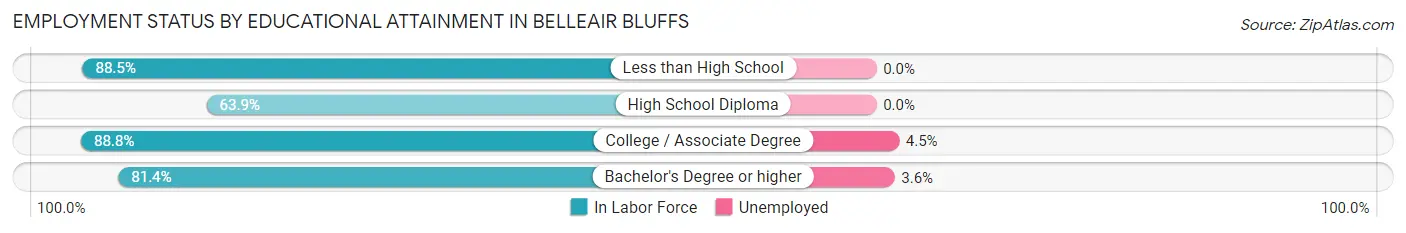
| Educational Attainment | In Labor Force | Unemployed |
| Less than High School | 46 (88.5%) | 0 (0.0%) |
| High School Diploma | 237 (63.9%) | 0 (0.0%) |
| College / Associate Degree | 332 (88.8%) | 17 (4.5%) |
| Bachelor's Degree or higher | 333 (81.4%) | 15 (3.6%) |
| Total | 948 (78.6%) | 34 (2.8%) |
Employment Occupations by Sex in Belleair Bluffs
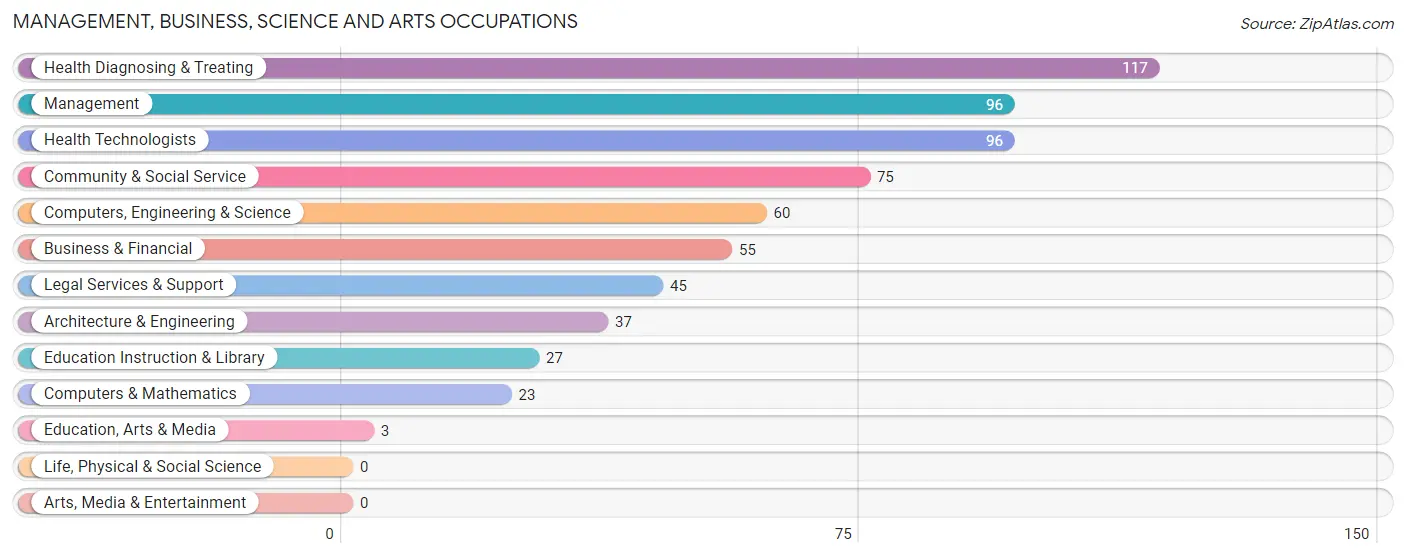
Management, Business, Science and Arts Occupations
The most common Management, Business, Science and Arts occupations in Belleair Bluffs are Health Diagnosing & Treating (117 | 9.9%), Management (96 | 8.1%), Health Technologists (96 | 8.1%), Community & Social Service (75 | 6.3%), and Computers, Engineering & Science (60 | 5.1%).
Management, Business, Science and Arts Occupations by Sex
Within the Management, Business, Science and Arts occupations in Belleair Bluffs, the most male-oriented occupations are Architecture & Engineering (100.0%), Education, Arts & Media (100.0%), and Legal Services & Support (100.0%), while the most female-oriented occupations are Business & Financial (100.0%), Health Diagnosing & Treating (77.8%), and Health Technologists (72.9%).
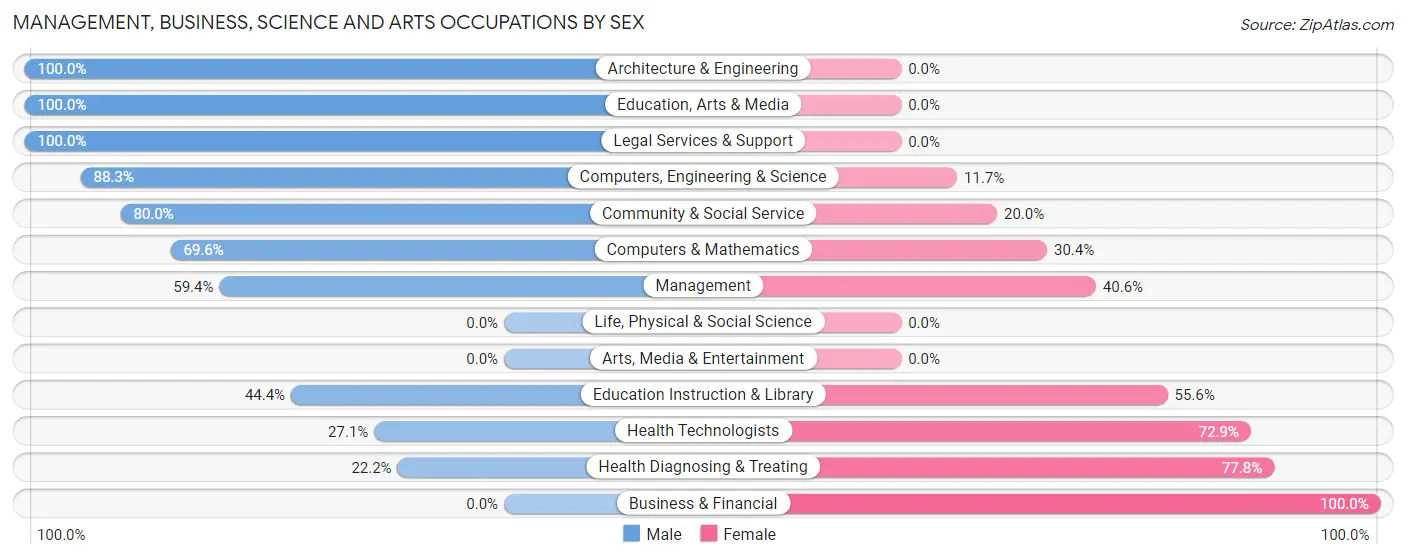
| Occupation | Male | Female |
| Management | 57 (59.4%) | 39 (40.6%) |
| Business & Financial | 0 (0.0%) | 55 (100.0%) |
| Computers, Engineering & Science | 53 (88.3%) | 7 (11.7%) |
| Computers & Mathematics | 16 (69.6%) | 7 (30.4%) |
| Architecture & Engineering | 37 (100.0%) | 0 (0.0%) |
| Life, Physical & Social Science | 0 (0.0%) | 0 (0.0%) |
| Community & Social Service | 60 (80.0%) | 15 (20.0%) |
| Education, Arts & Media | 3 (100.0%) | 0 (0.0%) |
| Legal Services & Support | 45 (100.0%) | 0 (0.0%) |
| Education Instruction & Library | 12 (44.4%) | 15 (55.6%) |
| Arts, Media & Entertainment | 0 (0.0%) | 0 (0.0%) |
| Health Diagnosing & Treating | 26 (22.2%) | 91 (77.8%) |
| Health Technologists | 26 (27.1%) | 70 (72.9%) |
| Total (Category) | 196 (48.6%) | 207 (51.4%) |
| Total (Overall) | 575 (48.6%) | 608 (51.4%) |
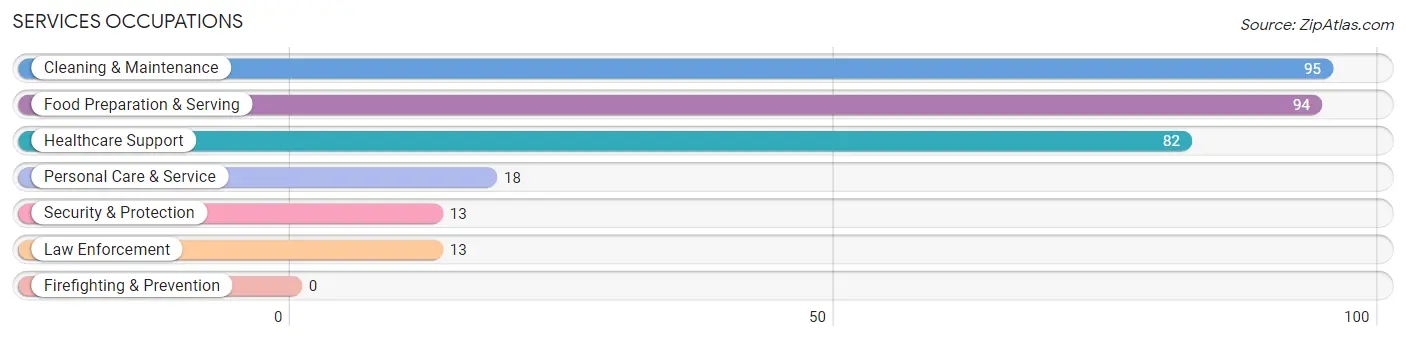
Services Occupations
The most common Services occupations in Belleair Bluffs are Cleaning & Maintenance (95 | 8.0%), Food Preparation & Serving (94 | 8.0%), Healthcare Support (82 | 6.9%), Personal Care & Service (18 | 1.5%), and Security & Protection (13 | 1.1%).
Services Occupations by Sex
Within the Services occupations in Belleair Bluffs, the most male-oriented occupations are Security & Protection (100.0%), Law Enforcement (100.0%), and Food Preparation & Serving (58.5%), while the most female-oriented occupations are Healthcare Support (100.0%), Personal Care & Service (100.0%), and Cleaning & Maintenance (43.2%).
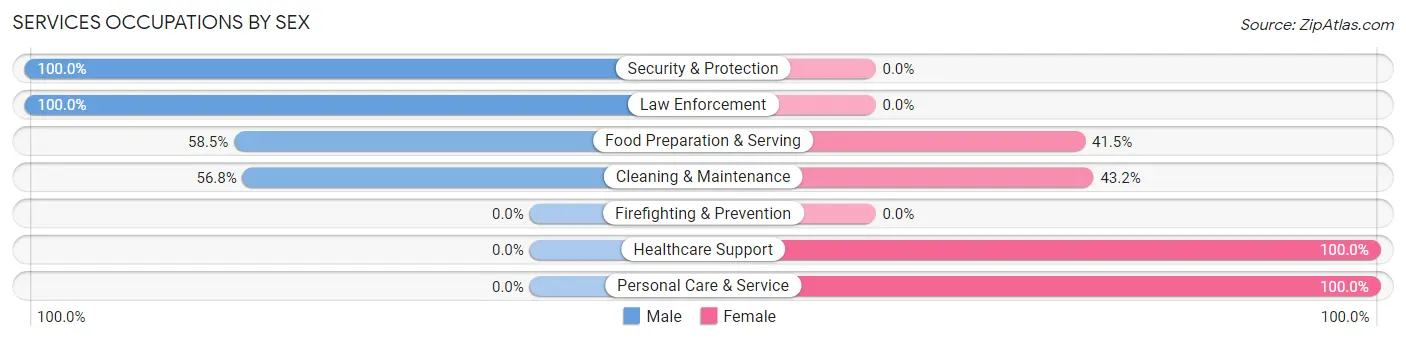
| Occupation | Male | Female |
| Healthcare Support | 0 (0.0%) | 82 (100.0%) |
| Security & Protection | 13 (100.0%) | 0 (0.0%) |
| Firefighting & Prevention | 0 (0.0%) | 0 (0.0%) |
| Law Enforcement | 13 (100.0%) | 0 (0.0%) |
| Food Preparation & Serving | 55 (58.5%) | 39 (41.5%) |
| Cleaning & Maintenance | 54 (56.8%) | 41 (43.2%) |
| Personal Care & Service | 0 (0.0%) | 18 (100.0%) |
| Total (Category) | 122 (40.4%) | 180 (59.6%) |
| Total (Overall) | 575 (48.6%) | 608 (51.4%) |
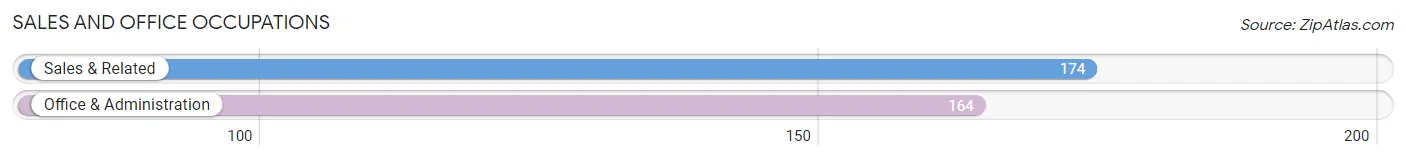
Sales and Office Occupations
The most common Sales and Office occupations in Belleair Bluffs are Sales & Related (174 | 14.7%), and Office & Administration (164 | 13.9%).
Sales and Office Occupations by Sex
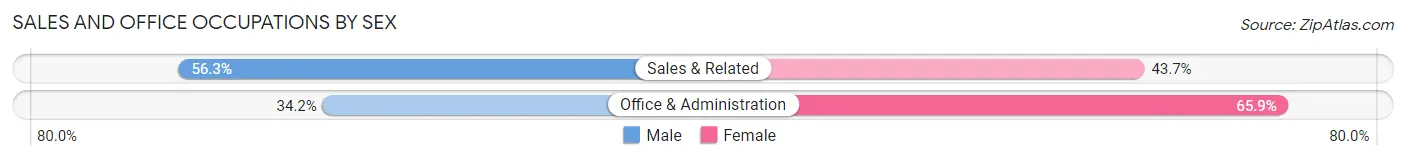
| Occupation | Male | Female |
| Sales & Related | 98 (56.3%) | 76 (43.7%) |
| Office & Administration | 56 (34.2%) | 108 (65.8%) |
| Total (Category) | 154 (45.6%) | 184 (54.4%) |
| Total (Overall) | 575 (48.6%) | 608 (51.4%) |
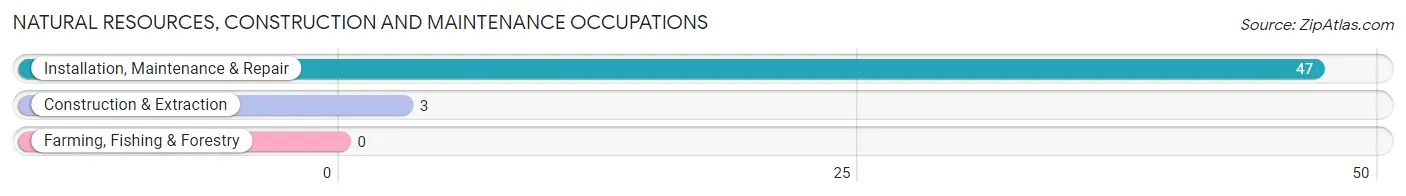
Natural Resources, Construction and Maintenance Occupations
The most common Natural Resources, Construction and Maintenance occupations in Belleair Bluffs are Installation, Maintenance & Repair (47 | 4.0%), and Construction & Extraction (3 | 0.3%).
Natural Resources, Construction and Maintenance Occupations by Sex
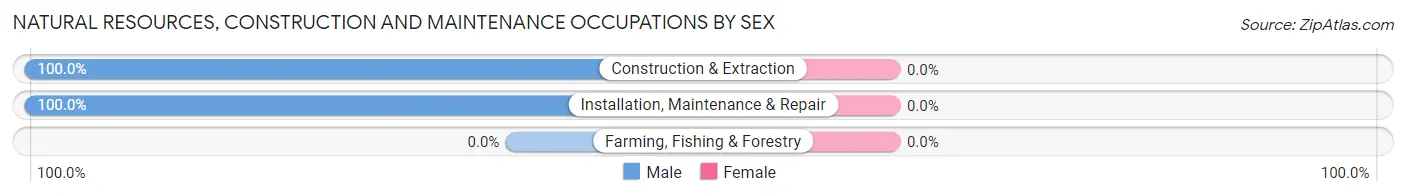
| Occupation | Male | Female |
| Farming, Fishing & Forestry | 0 (0.0%) | 0 (0.0%) |
| Construction & Extraction | 3 (100.0%) | 0 (0.0%) |
| Installation, Maintenance & Repair | 47 (100.0%) | 0 (0.0%) |
| Total (Category) | 50 (100.0%) | 0 (0.0%) |
| Total (Overall) | 575 (48.6%) | 608 (51.4%) |
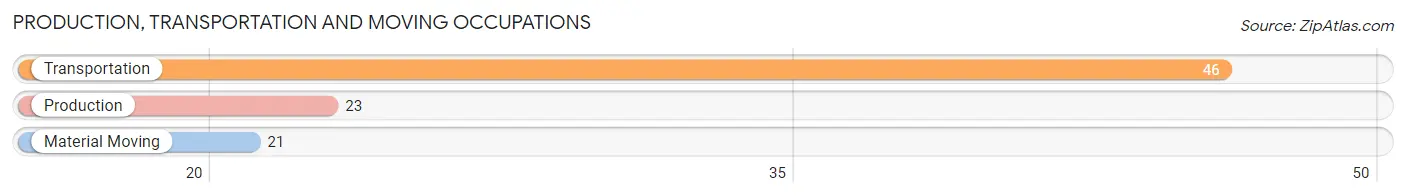
Production, Transportation and Moving Occupations
The most common Production, Transportation and Moving occupations in Belleair Bluffs are Transportation (46 | 3.9%), Production (23 | 1.9%), and Material Moving (21 | 1.8%).
Production, Transportation and Moving Occupations by Sex
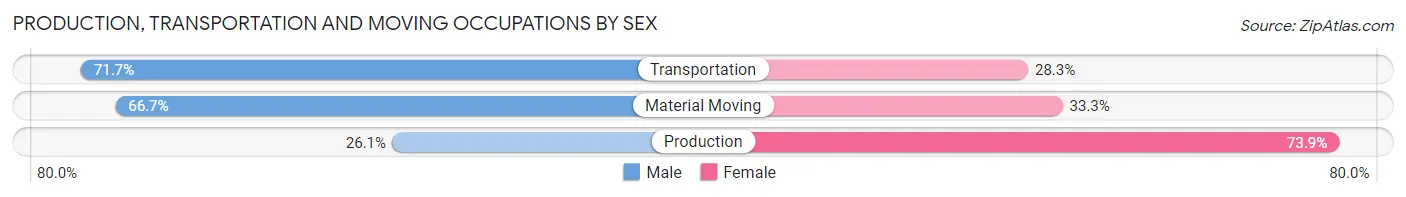
| Occupation | Male | Female |
| Production | 6 (26.1%) | 17 (73.9%) |
| Transportation | 33 (71.7%) | 13 (28.3%) |
| Material Moving | 14 (66.7%) | 7 (33.3%) |
| Total (Category) | 53 (58.9%) | 37 (41.1%) |
| Total (Overall) | 575 (48.6%) | 608 (51.4%) |
Employment Industries by Sex in Belleair Bluffs
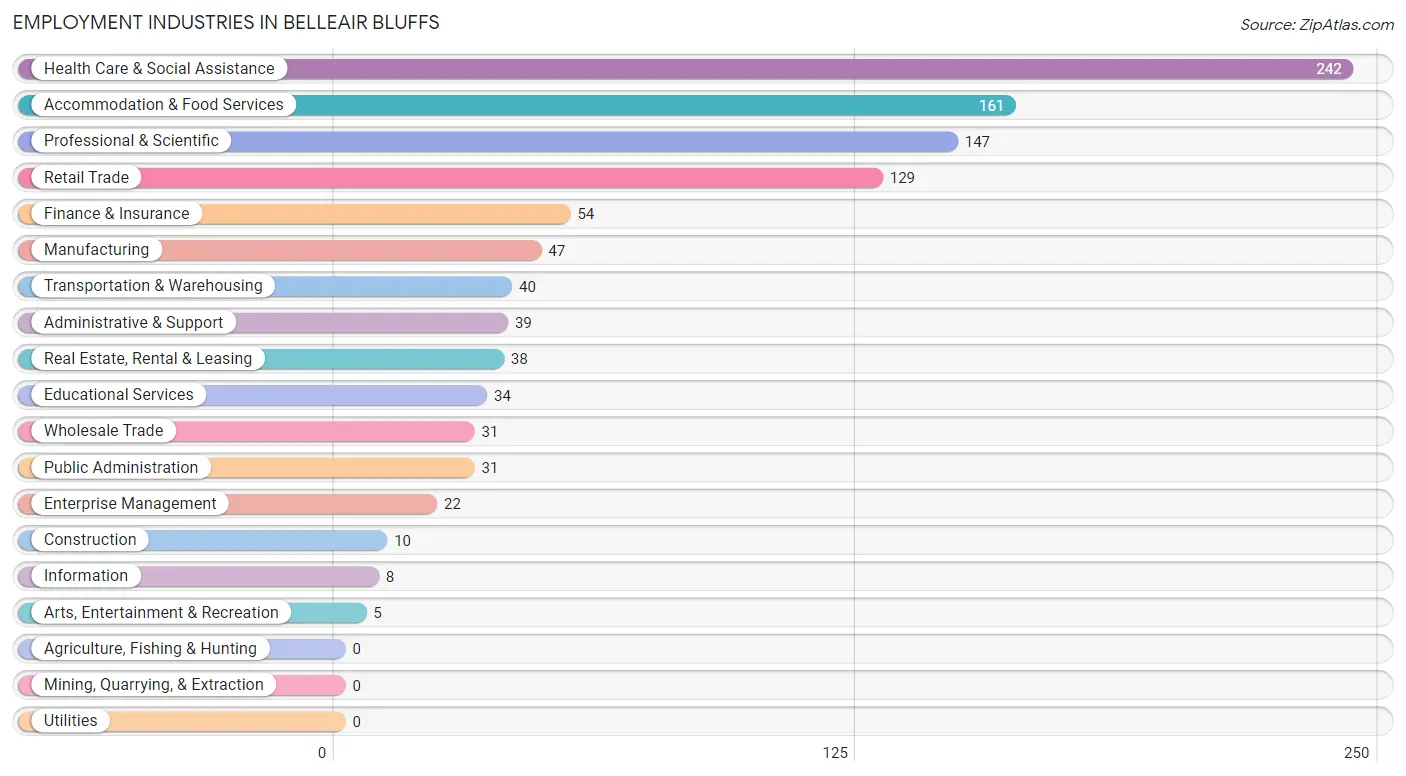
Employment Industries in Belleair Bluffs
The major employment industries in Belleair Bluffs include Health Care & Social Assistance (242 | 20.5%), Accommodation & Food Services (161 | 13.6%), Professional & Scientific (147 | 12.4%), Retail Trade (129 | 10.9%), and Finance & Insurance (54 | 4.6%).
Employment Industries by Sex in Belleair Bluffs
The Belleair Bluffs industries that see more men than women are Construction (100.0%), Information (100.0%), and Professional & Scientific (80.9%), whereas the industries that tend to have a higher number of women are Enterprise Management (100.0%), Arts, Entertainment & Recreation (100.0%), and Health Care & Social Assistance (82.6%).
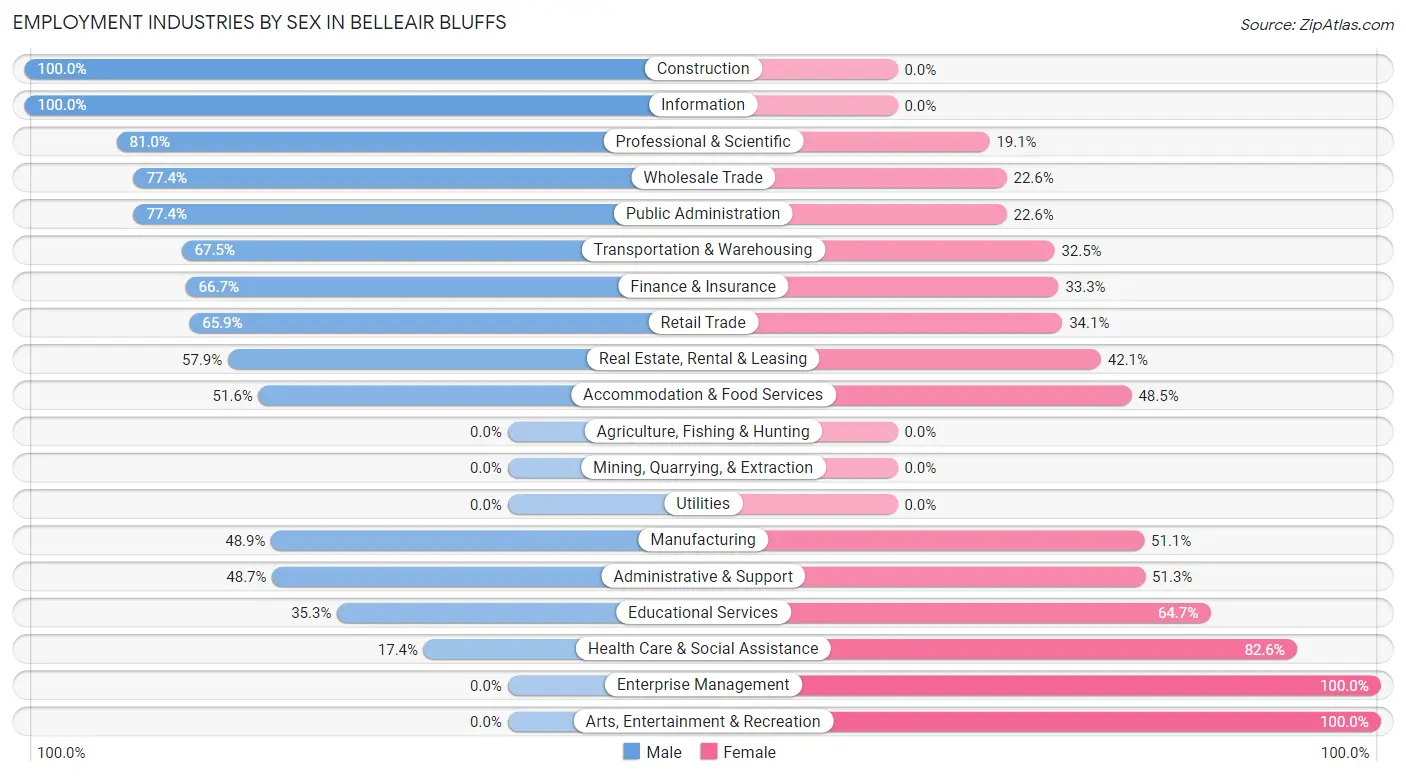
| Industry | Male | Female |
| Agriculture, Fishing & Hunting | 0 (0.0%) | 0 (0.0%) |
| Mining, Quarrying, & Extraction | 0 (0.0%) | 0 (0.0%) |
| Construction | 10 (100.0%) | 0 (0.0%) |
| Manufacturing | 23 (48.9%) | 24 (51.1%) |
| Wholesale Trade | 24 (77.4%) | 7 (22.6%) |
| Retail Trade | 85 (65.9%) | 44 (34.1%) |
| Transportation & Warehousing | 27 (67.5%) | 13 (32.5%) |
| Utilities | 0 (0.0%) | 0 (0.0%) |
| Information | 8 (100.0%) | 0 (0.0%) |
| Finance & Insurance | 36 (66.7%) | 18 (33.3%) |
| Real Estate, Rental & Leasing | 22 (57.9%) | 16 (42.1%) |
| Professional & Scientific | 119 (80.9%) | 28 (19.1%) |
| Enterprise Management | 0 (0.0%) | 22 (100.0%) |
| Administrative & Support | 19 (48.7%) | 20 (51.3%) |
| Educational Services | 12 (35.3%) | 22 (64.7%) |
| Health Care & Social Assistance | 42 (17.4%) | 200 (82.6%) |
| Arts, Entertainment & Recreation | 0 (0.0%) | 5 (100.0%) |
| Accommodation & Food Services | 83 (51.5%) | 78 (48.4%) |
| Public Administration | 24 (77.4%) | 7 (22.6%) |
| Total | 575 (48.6%) | 608 (51.4%) |
Education in Belleair Bluffs
School Enrollment in Belleair Bluffs
The most common levels of schooling among the 320 students in Belleair Bluffs are high school (91 | 28.4%), elementary school (75 | 23.4%), and middle school (55 | 17.2%).
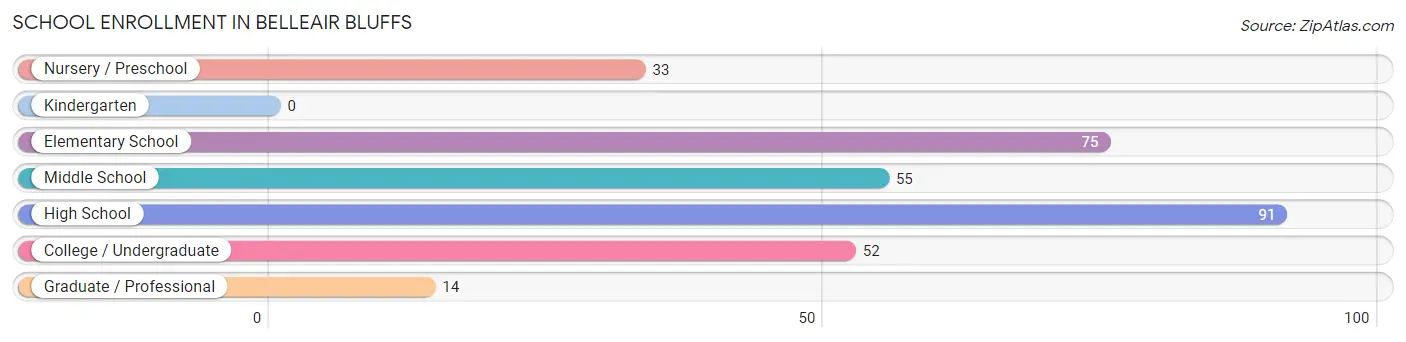
| School Level | # Students | % Students |
| Nursery / Preschool | 33 | 10.3% |
| Kindergarten | 0 | 0.0% |
| Elementary School | 75 | 23.4% |
| Middle School | 55 | 17.2% |
| High School | 91 | 28.4% |
| College / Undergraduate | 52 | 16.3% |
| Graduate / Professional | 14 | 4.4% |
| Total | 320 | 100.0% |
School Enrollment by Age by Funding Source in Belleair Bluffs
Out of a total of 320 students who are enrolled in schools in Belleair Bluffs, 179 (55.9%) attend a private institution, while the remaining 141 (44.1%) are enrolled in public schools. The age group of 3 to 4 year olds has the highest likelihood of being enrolled in private schools, with 22 (100.0% in the age bracket) enrolled. Conversely, the age group of 18 to 19 year olds has the lowest likelihood of being enrolled in a private school, with 6 (100.0% in the age bracket) attending a public institution.
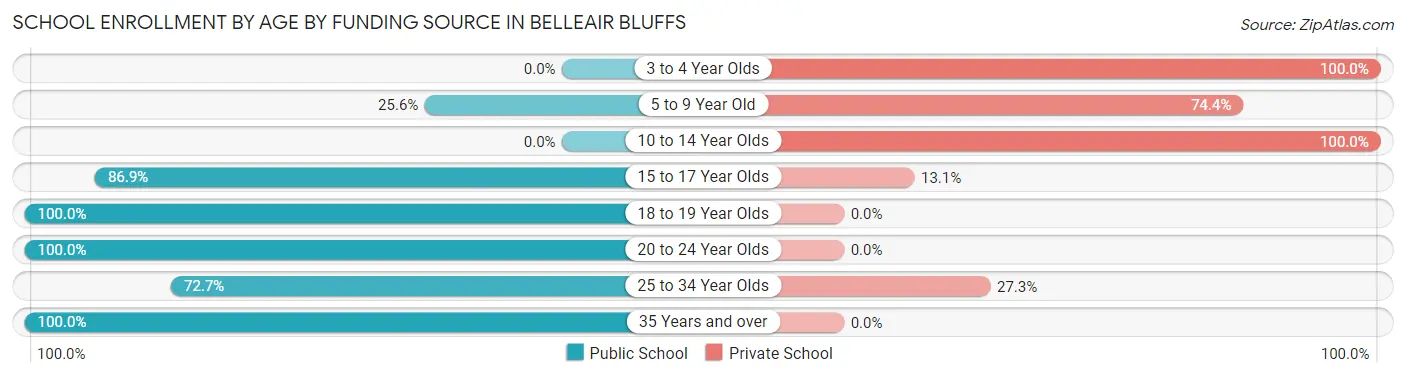
| Age Bracket | Public School | Private School |
| 3 to 4 Year Olds | 0 (0.0%) | 22 (100.0%) |
| 5 to 9 Year Old | 22 (25.6%) | 64 (74.4%) |
| 10 to 14 Year Olds | 0 (0.0%) | 76 (100.0%) |
| 15 to 17 Year Olds | 53 (86.9%) | 8 (13.1%) |
| 18 to 19 Year Olds | 6 (100.0%) | 0 (0.0%) |
| 20 to 24 Year Olds | 13 (100.0%) | 0 (0.0%) |
| 25 to 34 Year Olds | 24 (72.7%) | 9 (27.3%) |
| 35 Years and over | 23 (100.0%) | 0 (0.0%) |
| Total | 141 (44.1%) | 179 (55.9%) |
Educational Attainment by Field of Study in Belleair Bluffs
Business (185 | 20.9%), social sciences (109 | 12.3%), education (90 | 10.2%), visual & performing arts (90 | 10.2%), and science & technology (79 | 8.9%) are the most common fields of study among 883 individuals in Belleair Bluffs who have obtained a bachelor's degree or higher.
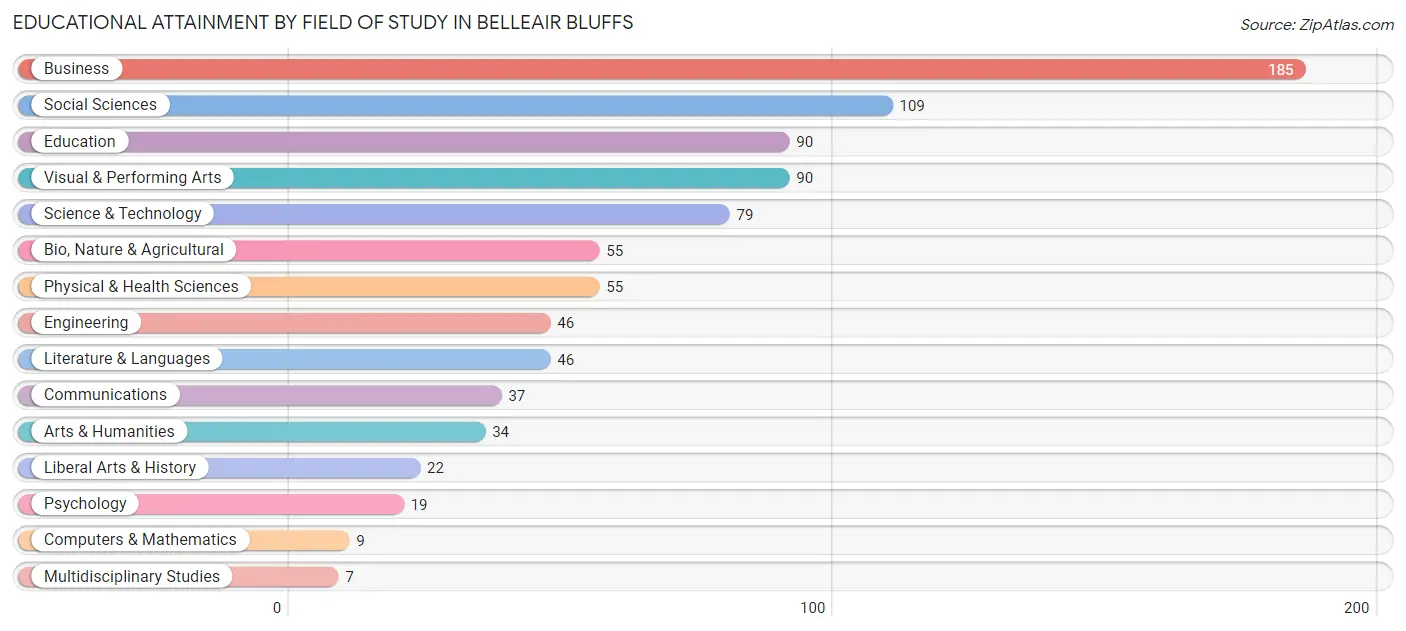
| Field of Study | # Graduates | % Graduates |
| Computers & Mathematics | 9 | 1.0% |
| Bio, Nature & Agricultural | 55 | 6.2% |
| Physical & Health Sciences | 55 | 6.2% |
| Psychology | 19 | 2.1% |
| Social Sciences | 109 | 12.3% |
| Engineering | 46 | 5.2% |
| Multidisciplinary Studies | 7 | 0.8% |
| Science & Technology | 79 | 8.9% |
| Business | 185 | 20.9% |
| Education | 90 | 10.2% |
| Literature & Languages | 46 | 5.2% |
| Liberal Arts & History | 22 | 2.5% |
| Visual & Performing Arts | 90 | 10.2% |
| Communications | 37 | 4.2% |
| Arts & Humanities | 34 | 3.8% |
| Total | 883 | 100.0% |
Transportation & Commute in Belleair Bluffs
Vehicle Availability by Sex in Belleair Bluffs
The most prevalent vehicle ownership categories in Belleair Bluffs are males with 2 vehicles (276, accounting for 48.4%) and females with 2 vehicles (251, making up 45.9%).
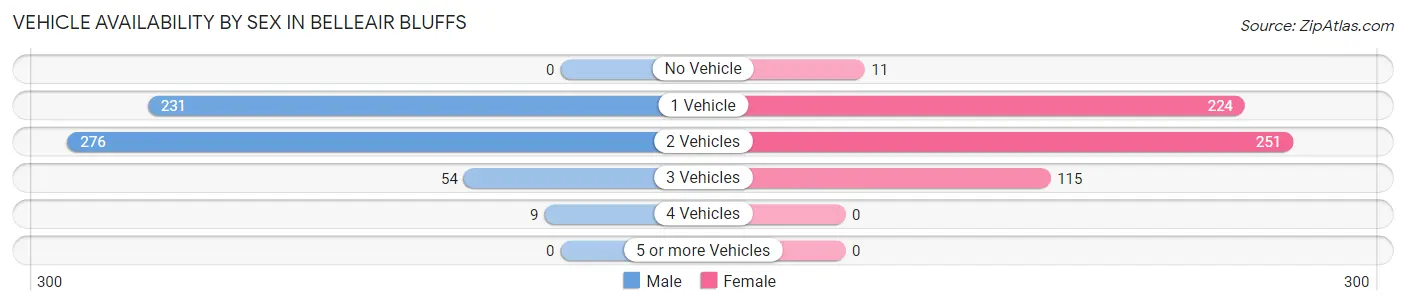
| Vehicles Available | Male | Female |
| No Vehicle | 0 (0.0%) | 11 (1.8%) |
| 1 Vehicle | 231 (40.5%) | 224 (37.3%) |
| 2 Vehicles | 276 (48.4%) | 251 (41.8%) |
| 3 Vehicles | 54 (9.5%) | 115 (19.1%) |
| 4 Vehicles | 9 (1.6%) | 0 (0.0%) |
| 5 or more Vehicles | 0 (0.0%) | 0 (0.0%) |
| Total | 570 (100.0%) | 601 (100.0%) |
Commute Time in Belleair Bluffs
The most frequently occuring commute durations in Belleair Bluffs are 15 to 19 minutes (227 commuters, 21.8%), 10 to 14 minutes (201 commuters, 19.4%), and 20 to 24 minutes (178 commuters, 17.1%).
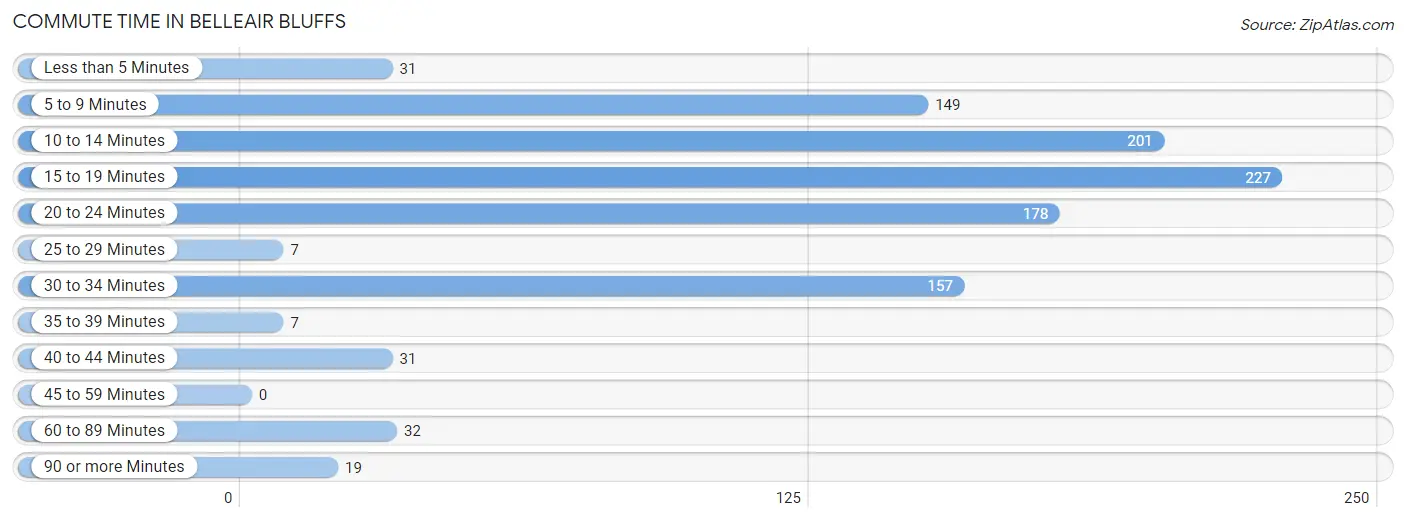
| Commute Time | # Commuters | % Commuters |
| Less than 5 Minutes | 31 | 3.0% |
| 5 to 9 Minutes | 149 | 14.3% |
| 10 to 14 Minutes | 201 | 19.4% |
| 15 to 19 Minutes | 227 | 21.8% |
| 20 to 24 Minutes | 178 | 17.1% |
| 25 to 29 Minutes | 7 | 0.7% |
| 30 to 34 Minutes | 157 | 15.1% |
| 35 to 39 Minutes | 7 | 0.7% |
| 40 to 44 Minutes | 31 | 3.0% |
| 45 to 59 Minutes | 0 | 0.0% |
| 60 to 89 Minutes | 32 | 3.1% |
| 90 or more Minutes | 19 | 1.8% |
Commute Time by Sex in Belleair Bluffs
The most common commute times in Belleair Bluffs are 10 to 14 minutes (129 commuters, 26.2%) for males and 15 to 19 minutes (123 commuters, 22.5%) for females.
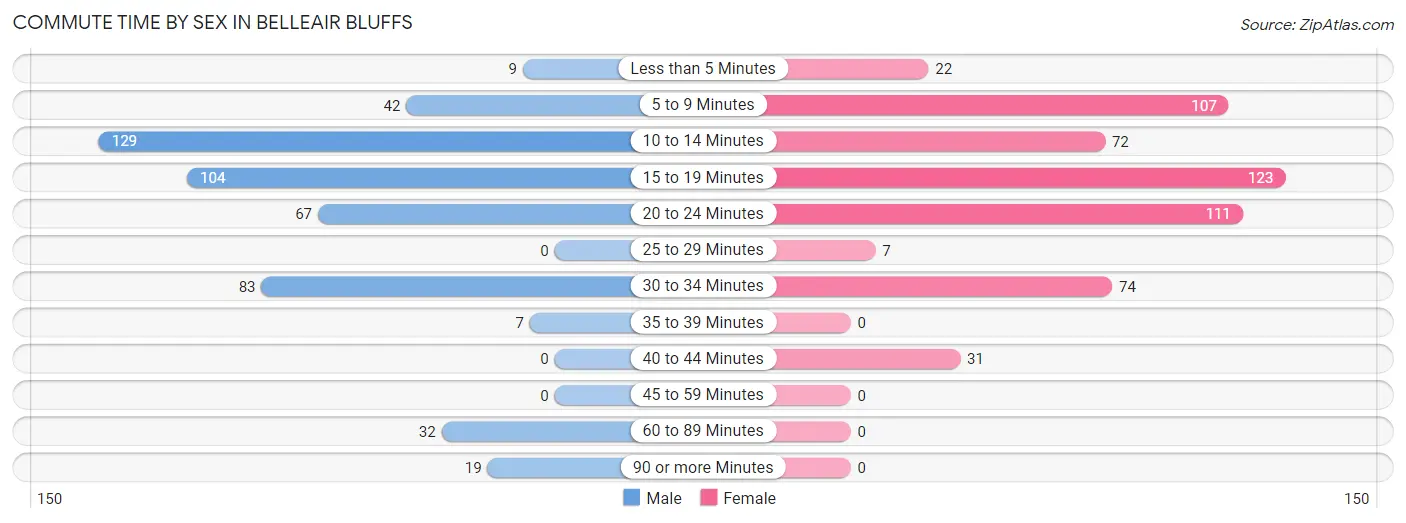
| Commute Time | Male | Female |
| Less than 5 Minutes | 9 (1.8%) | 22 (4.0%) |
| 5 to 9 Minutes | 42 (8.5%) | 107 (19.6%) |
| 10 to 14 Minutes | 129 (26.2%) | 72 (13.2%) |
| 15 to 19 Minutes | 104 (21.1%) | 123 (22.5%) |
| 20 to 24 Minutes | 67 (13.6%) | 111 (20.3%) |
| 25 to 29 Minutes | 0 (0.0%) | 7 (1.3%) |
| 30 to 34 Minutes | 83 (16.9%) | 74 (13.5%) |
| 35 to 39 Minutes | 7 (1.4%) | 0 (0.0%) |
| 40 to 44 Minutes | 0 (0.0%) | 31 (5.7%) |
| 45 to 59 Minutes | 0 (0.0%) | 0 (0.0%) |
| 60 to 89 Minutes | 32 (6.5%) | 0 (0.0%) |
| 90 or more Minutes | 19 (3.9%) | 0 (0.0%) |
Time of Departure to Work by Sex in Belleair Bluffs
The most frequent times of departure to work in Belleair Bluffs are 9:00 AM to 9:59 AM (61, 12.4%) for males and 8:30 AM to 8:59 AM (84, 15.4%) for females.
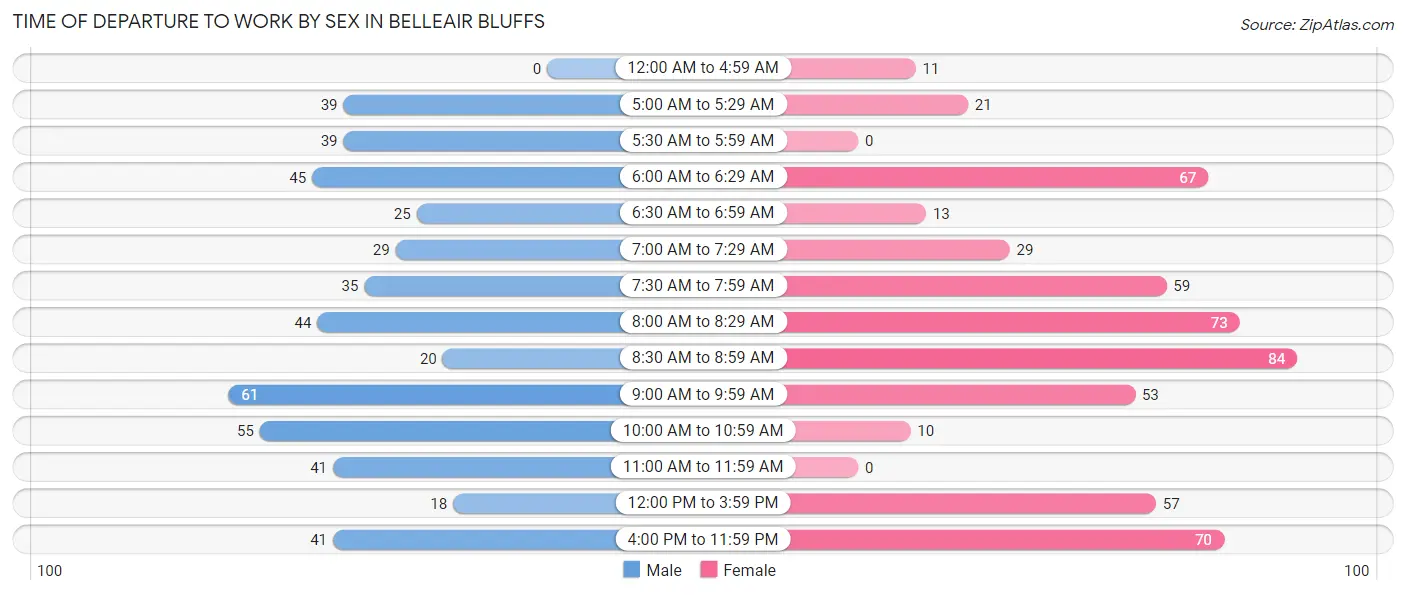
| Time of Departure | Male | Female |
| 12:00 AM to 4:59 AM | 0 (0.0%) | 11 (2.0%) |
| 5:00 AM to 5:29 AM | 39 (7.9%) | 21 (3.8%) |
| 5:30 AM to 5:59 AM | 39 (7.9%) | 0 (0.0%) |
| 6:00 AM to 6:29 AM | 45 (9.1%) | 67 (12.2%) |
| 6:30 AM to 6:59 AM | 25 (5.1%) | 13 (2.4%) |
| 7:00 AM to 7:29 AM | 29 (5.9%) | 29 (5.3%) |
| 7:30 AM to 7:59 AM | 35 (7.1%) | 59 (10.8%) |
| 8:00 AM to 8:29 AM | 44 (8.9%) | 73 (13.4%) |
| 8:30 AM to 8:59 AM | 20 (4.1%) | 84 (15.4%) |
| 9:00 AM to 9:59 AM | 61 (12.4%) | 53 (9.7%) |
| 10:00 AM to 10:59 AM | 55 (11.2%) | 10 (1.8%) |
| 11:00 AM to 11:59 AM | 41 (8.3%) | 0 (0.0%) |
| 12:00 PM to 3:59 PM | 18 (3.7%) | 57 (10.4%) |
| 4:00 PM to 11:59 PM | 41 (8.3%) | 70 (12.8%) |
| Total | 492 (100.0%) | 547 (100.0%) |
Housing Occupancy in Belleair Bluffs
Occupancy by Ownership in Belleair Bluffs
Of the total 1,229 dwellings in Belleair Bluffs, owner-occupied units account for 817 (66.5%), while renter-occupied units make up 412 (33.5%).
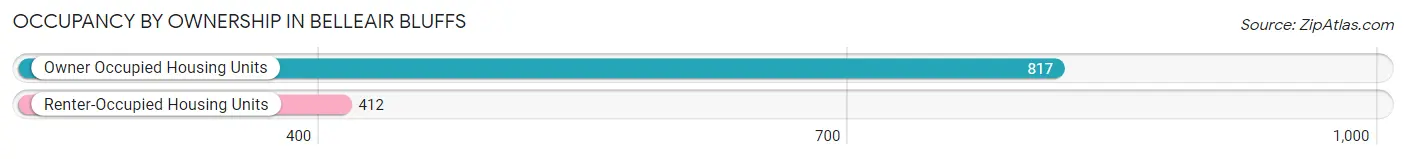
| Occupancy | # Housing Units | % Housing Units |
| Owner Occupied Housing Units | 817 | 66.5% |
| Renter-Occupied Housing Units | 412 | 33.5% |
| Total Occupied Housing Units | 1,229 | 100.0% |
Occupancy by Household Size in Belleair Bluffs
| Household Size | # Housing Units | % Housing Units |
| 1-Person Household | 565 | 46.0% |
| 2-Person Household | 441 | 35.9% |
| 3-Person Household | 100 | 8.1% |
| 4+ Person Household | 123 | 10.0% |
| Total Housing Units | 1,229 | 100.0% |
Occupancy by Ownership by Household Size in Belleair Bluffs
| Household Size | Owner-occupied | Renter-occupied |
| 1-Person Household | 311 (55.0%) | 254 (45.0%) |
| 2-Person Household | 344 (78.0%) | 97 (22.0%) |
| 3-Person Household | 60 (60.0%) | 40 (40.0%) |
| 4+ Person Household | 102 (82.9%) | 21 (17.1%) |
| Total Housing Units | 817 (66.5%) | 412 (33.5%) |
Occupancy by Educational Attainment in Belleair Bluffs
| Household Size | Owner-occupied | Renter-occupied |
| Less than High School | 45 (40.2%) | 67 (59.8%) |
| High School Diploma | 177 (55.7%) | 141 (44.3%) |
| College/Associate Degree | 248 (67.8%) | 118 (32.2%) |
| Bachelor's Degree or higher | 347 (80.1%) | 86 (19.9%) |
Occupancy by Age of Householder in Belleair Bluffs
| Age Bracket | # Households | % Households |
| Under 35 Years | 76 | 6.2% |
| 35 to 44 Years | 13 | 1.1% |
| 45 to 54 Years | 268 | 21.8% |
| 55 to 64 Years | 228 | 18.5% |
| 65 to 74 Years | 392 | 31.9% |
| 75 to 84 Years | 182 | 14.8% |
| 85 Years and Over | 70 | 5.7% |
| Total | 1,229 | 100.0% |
Housing Finances in Belleair Bluffs
Median Income by Occupancy in Belleair Bluffs
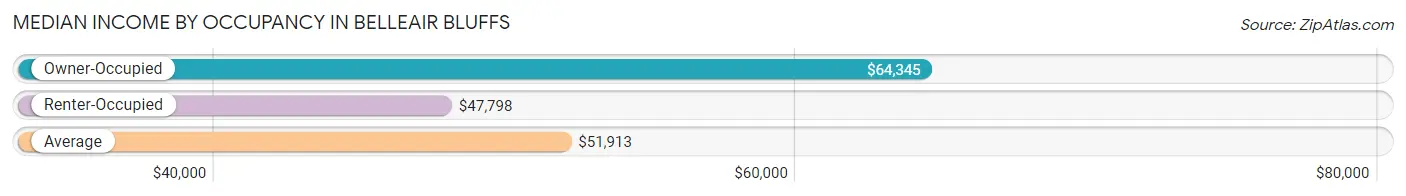
| Occupancy Type | # Households | Median Income |
| Owner-Occupied | 817 (66.5%) | $64,345 |
| Renter-Occupied | 412 (33.5%) | $47,798 |
| Average | 1,229 (100.0%) | $51,913 |
Occupancy by Householder Income Bracket in Belleair Bluffs
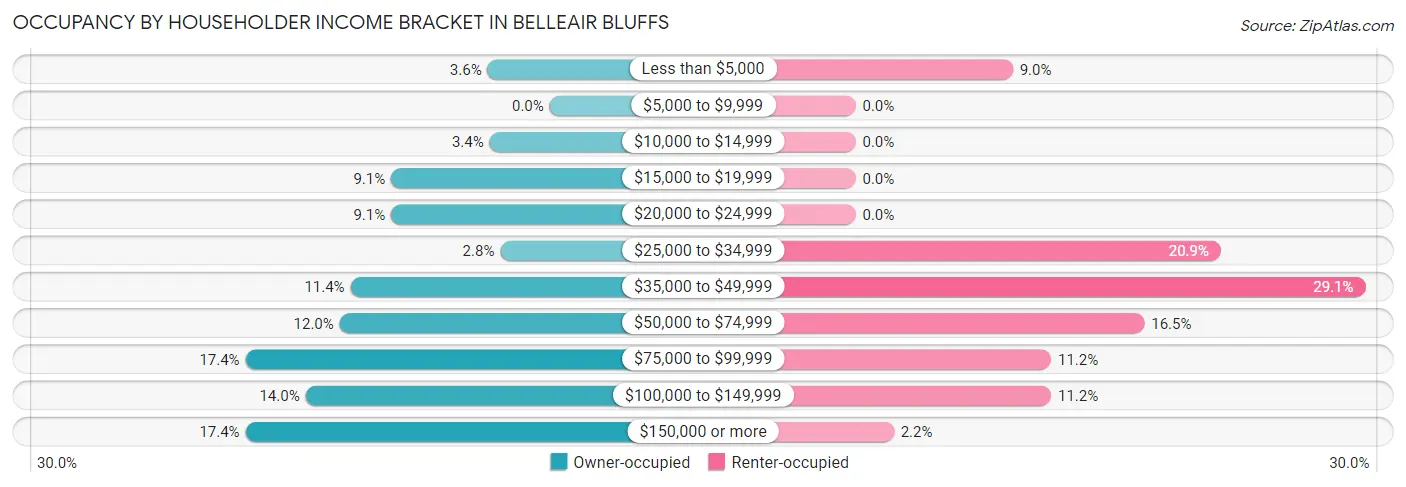
| Income Bracket | Owner-occupied | Renter-occupied |
| Less than $5,000 | 29 (3.5%) | 37 (9.0%) |
| $5,000 to $9,999 | 0 (0.0%) | 0 (0.0%) |
| $10,000 to $14,999 | 28 (3.4%) | 0 (0.0%) |
| $15,000 to $19,999 | 74 (9.1%) | 0 (0.0%) |
| $20,000 to $24,999 | 74 (9.1%) | 0 (0.0%) |
| $25,000 to $34,999 | 23 (2.8%) | 86 (20.9%) |
| $35,000 to $49,999 | 93 (11.4%) | 120 (29.1%) |
| $50,000 to $74,999 | 98 (12.0%) | 68 (16.5%) |
| $75,000 to $99,999 | 142 (17.4%) | 46 (11.2%) |
| $100,000 to $149,999 | 114 (14.0%) | 46 (11.2%) |
| $150,000 or more | 142 (17.4%) | 9 (2.2%) |
| Total | 817 (100.0%) | 412 (100.0%) |
Monthly Housing Cost Tiers in Belleair Bluffs
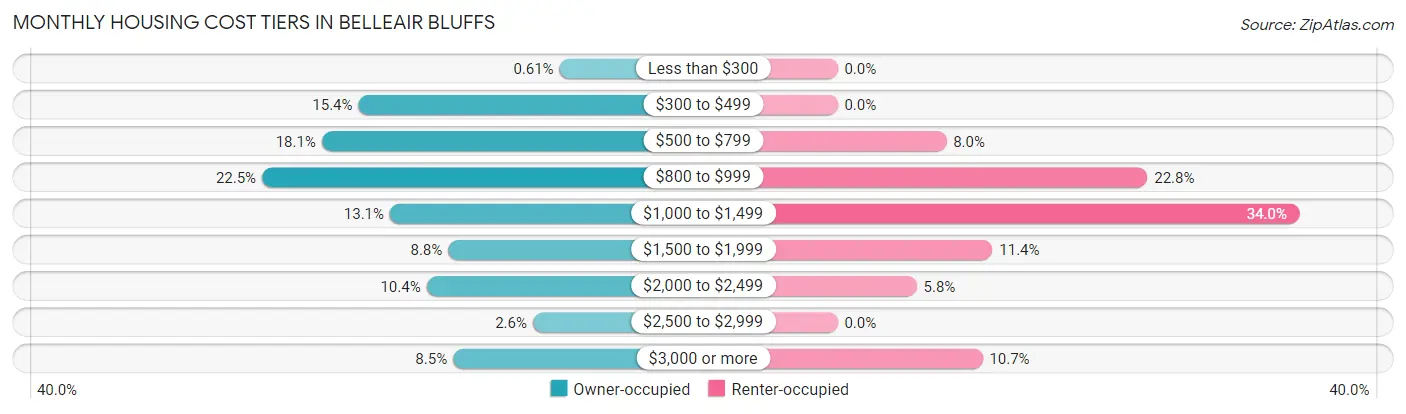
| Monthly Cost | Owner-occupied | Renter-occupied |
| Less than $300 | 5 (0.6%) | 0 (0.0%) |
| $300 to $499 | 126 (15.4%) | 0 (0.0%) |
| $500 to $799 | 148 (18.1%) | 33 (8.0%) |
| $800 to $999 | 184 (22.5%) | 94 (22.8%) |
| $1,000 to $1,499 | 107 (13.1%) | 140 (34.0%) |
| $1,500 to $1,999 | 72 (8.8%) | 47 (11.4%) |
| $2,000 to $2,499 | 85 (10.4%) | 24 (5.8%) |
| $2,500 to $2,999 | 21 (2.6%) | 0 (0.0%) |
| $3,000 or more | 69 (8.5%) | 44 (10.7%) |
| Total | 817 (100.0%) | 412 (100.0%) |
Physical Housing Characteristics in Belleair Bluffs
Housing Structures in Belleair Bluffs
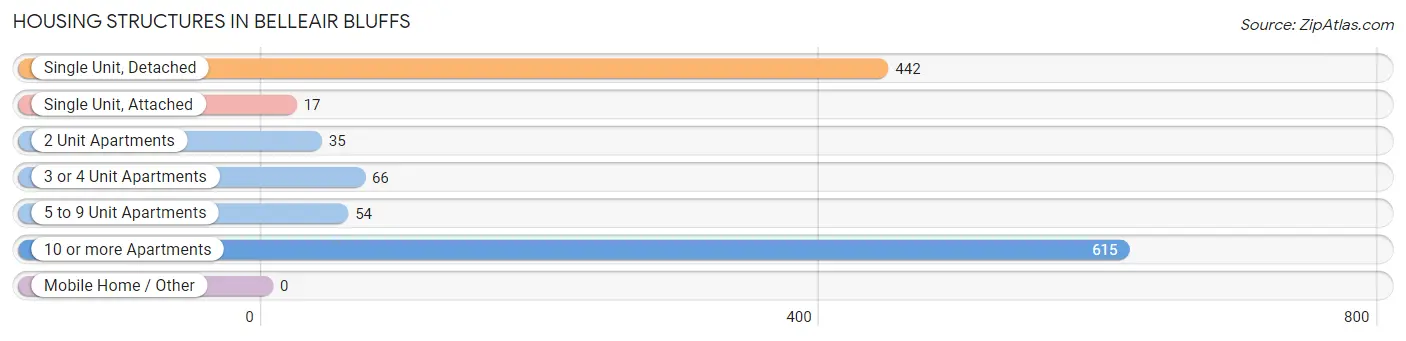
| Structure Type | # Housing Units | % Housing Units |
| Single Unit, Detached | 442 | 36.0% |
| Single Unit, Attached | 17 | 1.4% |
| 2 Unit Apartments | 35 | 2.9% |
| 3 or 4 Unit Apartments | 66 | 5.4% |
| 5 to 9 Unit Apartments | 54 | 4.4% |
| 10 or more Apartments | 615 | 50.0% |
| Mobile Home / Other | 0 | 0.0% |
| Total | 1,229 | 100.0% |
Housing Structures by Occupancy in Belleair Bluffs
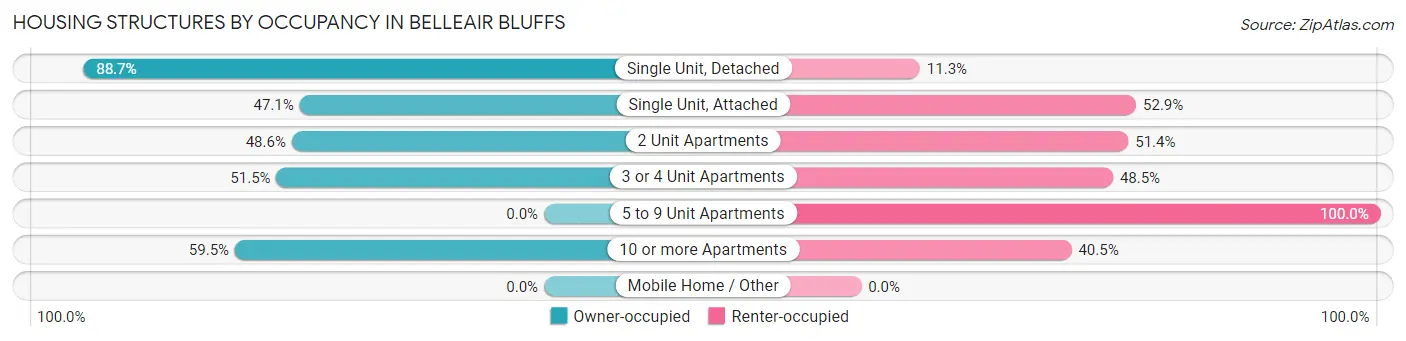
| Structure Type | Owner-occupied | Renter-occupied |
| Single Unit, Detached | 392 (88.7%) | 50 (11.3%) |
| Single Unit, Attached | 8 (47.1%) | 9 (52.9%) |
| 2 Unit Apartments | 17 (48.6%) | 18 (51.4%) |
| 3 or 4 Unit Apartments | 34 (51.5%) | 32 (48.5%) |
| 5 to 9 Unit Apartments | 0 (0.0%) | 54 (100.0%) |
| 10 or more Apartments | 366 (59.5%) | 249 (40.5%) |
| Mobile Home / Other | 0 (0.0%) | 0 (0.0%) |
| Total | 817 (66.5%) | 412 (33.5%) |
Housing Structures by Number of Rooms in Belleair Bluffs
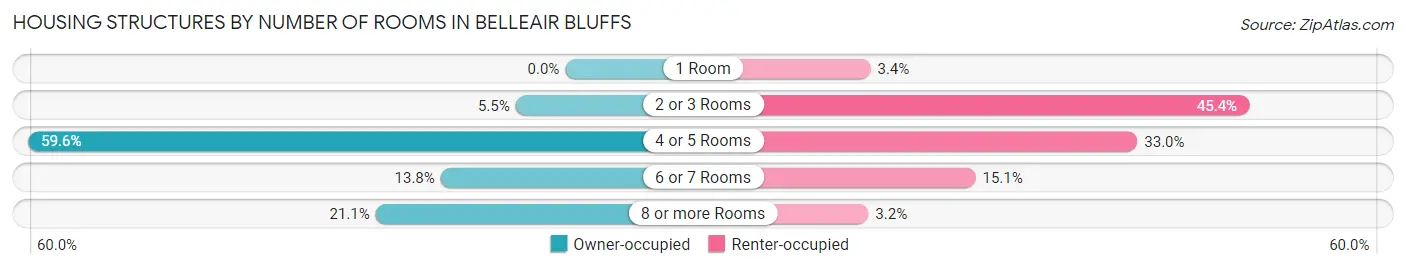
| Number of Rooms | Owner-occupied | Renter-occupied |
| 1 Room | 0 (0.0%) | 14 (3.4%) |
| 2 or 3 Rooms | 45 (5.5%) | 187 (45.4%) |
| 4 or 5 Rooms | 487 (59.6%) | 136 (33.0%) |
| 6 or 7 Rooms | 113 (13.8%) | 62 (15.0%) |
| 8 or more Rooms | 172 (21.0%) | 13 (3.2%) |
| Total | 817 (100.0%) | 412 (100.0%) |
Housing Structure by Heating Type in Belleair Bluffs
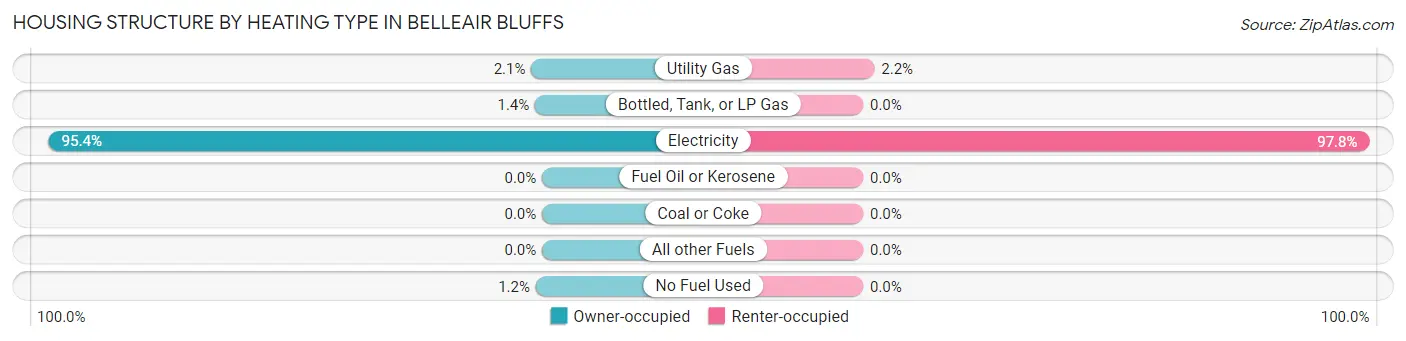
| Heating Type | Owner-occupied | Renter-occupied |
| Utility Gas | 17 (2.1%) | 9 (2.2%) |
| Bottled, Tank, or LP Gas | 11 (1.3%) | 0 (0.0%) |
| Electricity | 779 (95.4%) | 403 (97.8%) |
| Fuel Oil or Kerosene | 0 (0.0%) | 0 (0.0%) |
| Coal or Coke | 0 (0.0%) | 0 (0.0%) |
| All other Fuels | 0 (0.0%) | 0 (0.0%) |
| No Fuel Used | 10 (1.2%) | 0 (0.0%) |
| Total | 817 (100.0%) | 412 (100.0%) |
Household Vehicle Usage in Belleair Bluffs
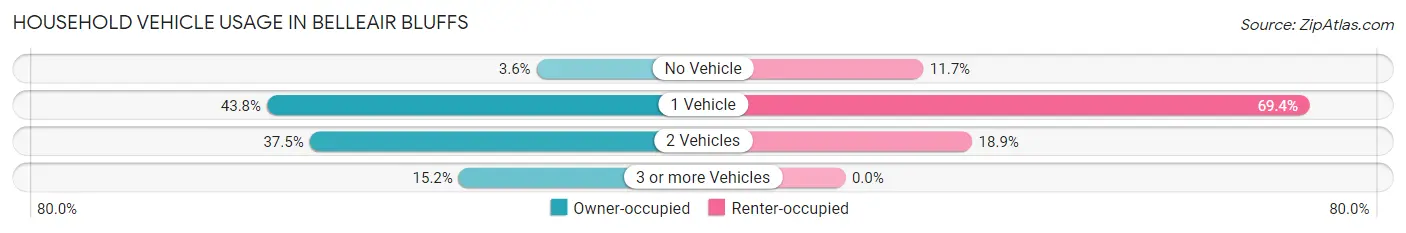
| Vehicles per Household | Owner-occupied | Renter-occupied |
| No Vehicle | 29 (3.5%) | 48 (11.7%) |
| 1 Vehicle | 358 (43.8%) | 286 (69.4%) |
| 2 Vehicles | 306 (37.4%) | 78 (18.9%) |
| 3 or more Vehicles | 124 (15.2%) | 0 (0.0%) |
| Total | 817 (100.0%) | 412 (100.0%) |
Real Estate & Mortgages in Belleair Bluffs
Real Estate and Mortgage Overview in Belleair Bluffs
| Characteristic | Without Mortgage | With Mortgage |
| Housing Units | 530 | 287 |
| Median Property Value | $364,900 | $357,000 |
| Median Household Income | $54,750 | $90 |
| Monthly Housing Costs | $812 | $31 |
| Real Estate Taxes | $2,254 | $0 |
Property Value by Mortgage Status in Belleair Bluffs
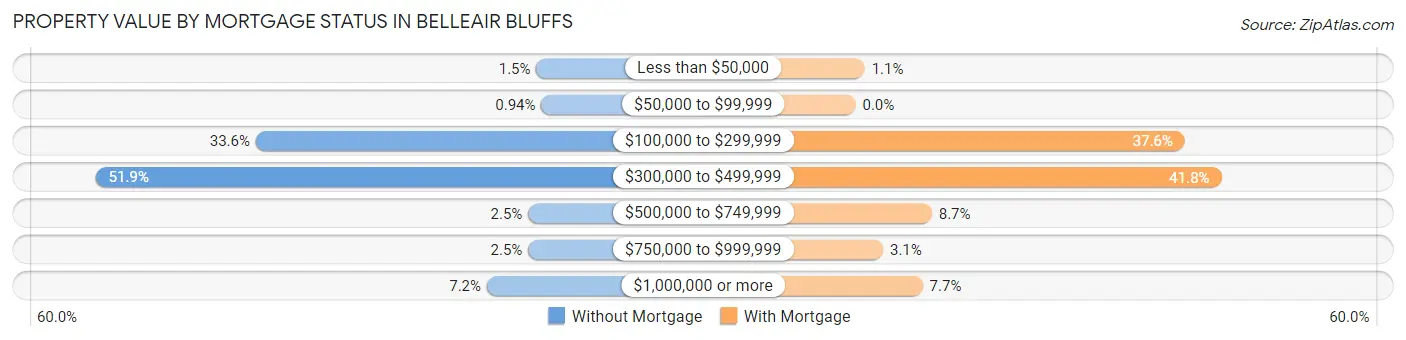
| Property Value | Without Mortgage | With Mortgage |
| Less than $50,000 | 8 (1.5%) | 3 (1.1%) |
| $50,000 to $99,999 | 5 (0.9%) | 0 (0.0%) |
| $100,000 to $299,999 | 178 (33.6%) | 108 (37.6%) |
| $300,000 to $499,999 | 275 (51.9%) | 120 (41.8%) |
| $500,000 to $749,999 | 13 (2.5%) | 25 (8.7%) |
| $750,000 to $999,999 | 13 (2.5%) | 9 (3.1%) |
| $1,000,000 or more | 38 (7.2%) | 22 (7.7%) |
| Total | 530 (100.0%) | 287 (100.0%) |
Household Income by Mortgage Status in Belleair Bluffs
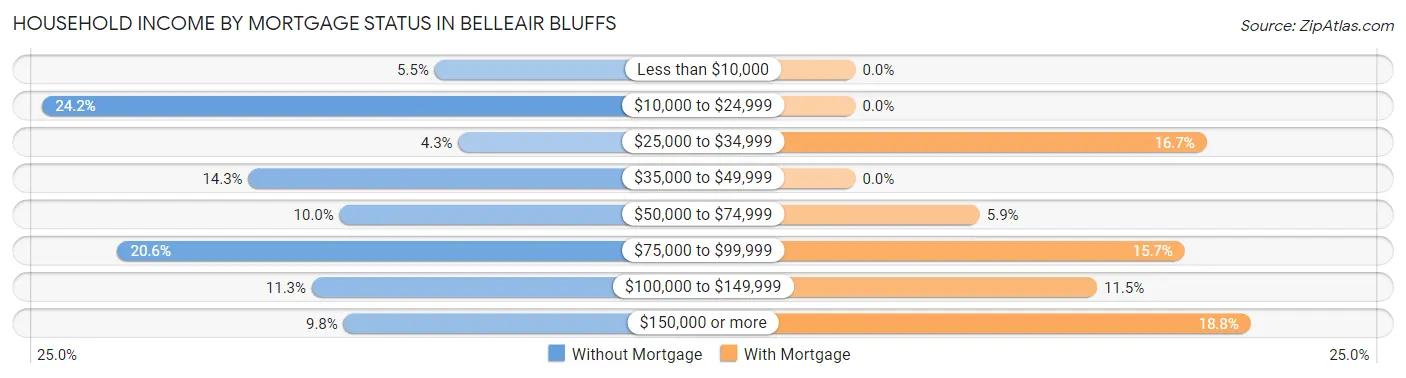
| Household Income | Without Mortgage | With Mortgage |
| Less than $10,000 | 29 (5.5%) | 0 (0.0%) |
| $10,000 to $24,999 | 128 (24.1%) | 0 (0.0%) |
| $25,000 to $34,999 | 23 (4.3%) | 48 (16.7%) |
| $35,000 to $49,999 | 76 (14.3%) | 0 (0.0%) |
| $50,000 to $74,999 | 53 (10.0%) | 17 (5.9%) |
| $75,000 to $99,999 | 109 (20.6%) | 45 (15.7%) |
| $100,000 to $149,999 | 60 (11.3%) | 33 (11.5%) |
| $150,000 or more | 52 (9.8%) | 54 (18.8%) |
| Total | 530 (100.0%) | 287 (100.0%) |
Property Value to Household Income Ratio in Belleair Bluffs
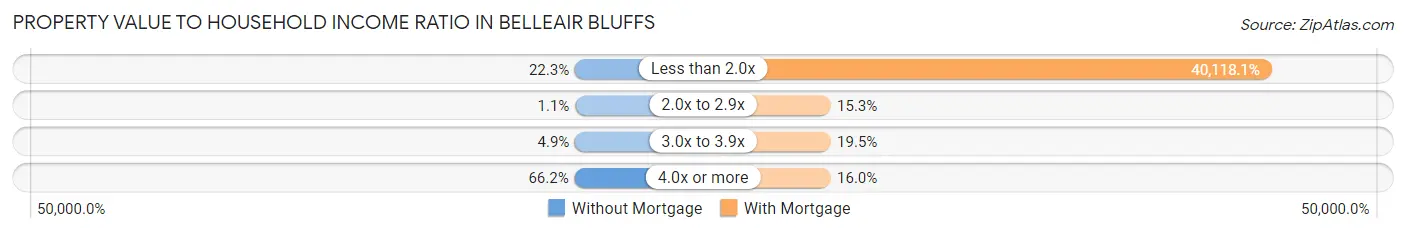
| Value-to-Income Ratio | Without Mortgage | With Mortgage |
| Less than 2.0x | 118 (22.3%) | 115,139 (40,118.1%) |
| 2.0x to 2.9x | 6 (1.1%) | 44 (15.3%) |
| 3.0x to 3.9x | 26 (4.9%) | 56 (19.5%) |
| 4.0x or more | 351 (66.2%) | 46 (16.0%) |
| Total | 530 (100.0%) | 287 (100.0%) |
Real Estate Taxes by Mortgage Status in Belleair Bluffs
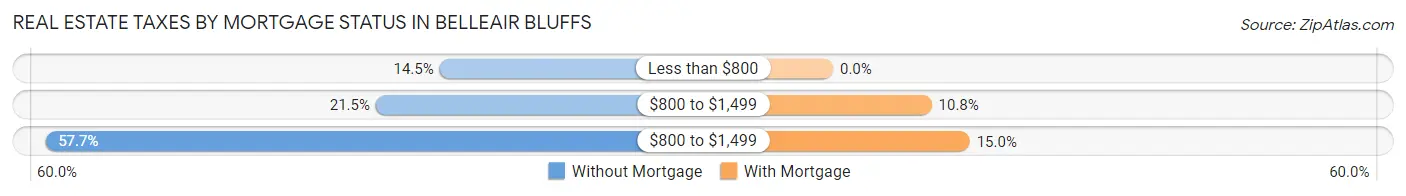
| Property Taxes | Without Mortgage | With Mortgage |
| Less than $800 | 77 (14.5%) | 0 (0.0%) |
| $800 to $1,499 | 114 (21.5%) | 31 (10.8%) |
| $800 to $1,499 | 306 (57.7%) | 43 (15.0%) |
| Total | 530 (100.0%) | 287 (100.0%) |
Health & Disability in Belleair Bluffs
Health Insurance Coverage by Age in Belleair Bluffs
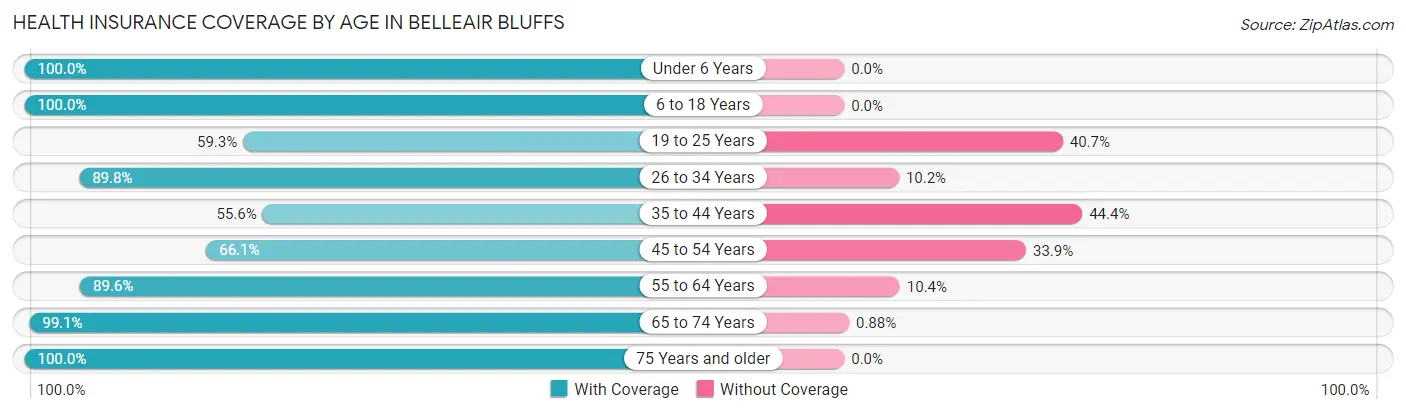
| Age Bracket | With Coverage | Without Coverage |
| Under 6 Years | 44 (100.0%) | 0 (0.0%) |
| 6 to 18 Years | 218 (100.0%) | 0 (0.0%) |
| 19 to 25 Years | 48 (59.3%) | 33 (40.7%) |
| 26 to 34 Years | 97 (89.8%) | 11 (10.2%) |
| 35 to 44 Years | 84 (55.6%) | 67 (44.4%) |
| 45 to 54 Years | 275 (66.1%) | 141 (33.9%) |
| 55 to 64 Years | 476 (89.6%) | 55 (10.4%) |
| 65 to 74 Years | 565 (99.1%) | 5 (0.9%) |
| 75 Years and older | 357 (100.0%) | 0 (0.0%) |
| Total | 2,164 (87.4%) | 312 (12.6%) |
Health Insurance Coverage by Citizenship Status in Belleair Bluffs
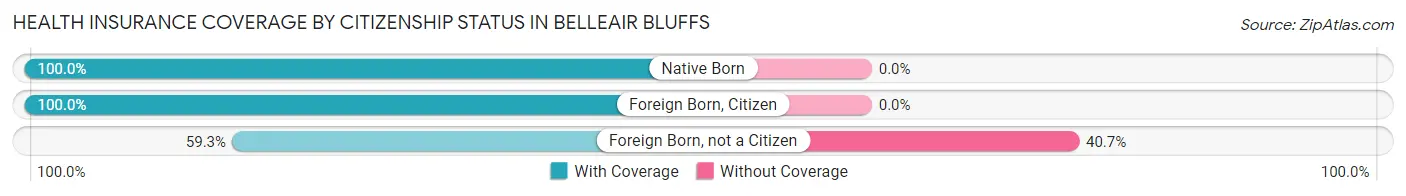
| Citizenship Status | With Coverage | Without Coverage |
| Native Born | 44 (100.0%) | 0 (0.0%) |
| Foreign Born, Citizen | 218 (100.0%) | 0 (0.0%) |
| Foreign Born, not a Citizen | 48 (59.3%) | 33 (40.7%) |
Health Insurance Coverage by Household Income in Belleair Bluffs
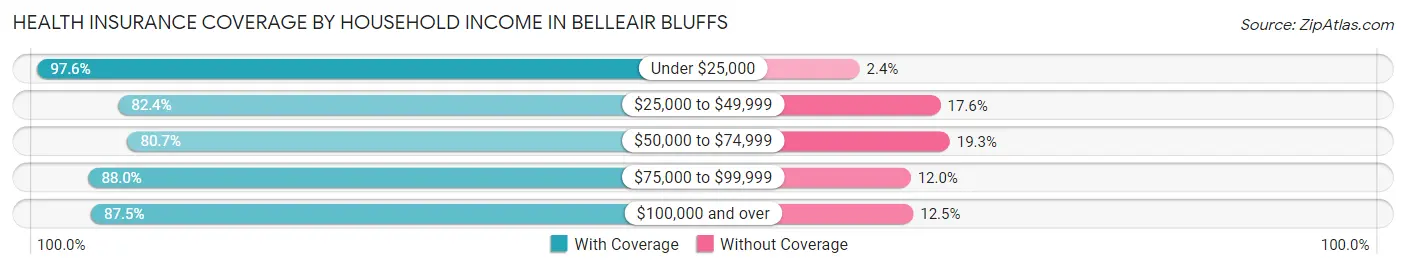
| Household Income | With Coverage | Without Coverage |
| Under $25,000 | 326 (97.6%) | 8 (2.4%) |
| $25,000 to $49,999 | 394 (82.4%) | 84 (17.6%) |
| $50,000 to $74,999 | 184 (80.7%) | 44 (19.3%) |
| $75,000 to $99,999 | 515 (88.0%) | 70 (12.0%) |
| $100,000 and over | 745 (87.5%) | 106 (12.5%) |
Public vs Private Health Insurance Coverage by Age in Belleair Bluffs
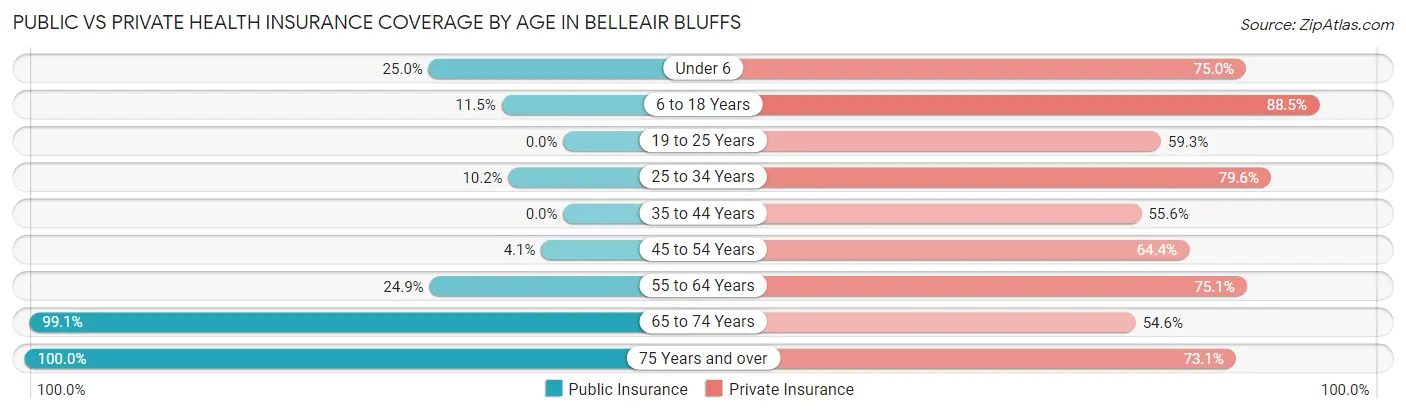
| Age Bracket | Public Insurance | Private Insurance |
| Under 6 | 11 (25.0%) | 33 (75.0%) |
| 6 to 18 Years | 25 (11.5%) | 193 (88.5%) |
| 19 to 25 Years | 0 (0.0%) | 48 (59.3%) |
| 25 to 34 Years | 11 (10.2%) | 86 (79.6%) |
| 35 to 44 Years | 0 (0.0%) | 84 (55.6%) |
| 45 to 54 Years | 17 (4.1%) | 268 (64.4%) |
| 55 to 64 Years | 132 (24.9%) | 399 (75.1%) |
| 65 to 74 Years | 565 (99.1%) | 311 (54.6%) |
| 75 Years and over | 357 (100.0%) | 261 (73.1%) |
| Total | 1,118 (45.2%) | 1,683 (68.0%) |
Disability Status by Sex by Age in Belleair Bluffs
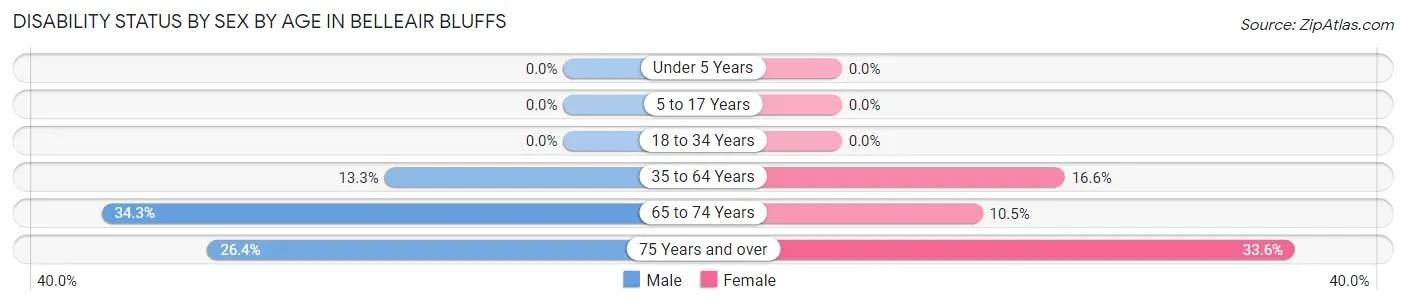
| Age Bracket | Male | Female |
| Under 5 Years | 0 (0.0%) | 0 (0.0%) |
| 5 to 17 Years | 0 (0.0%) | 0 (0.0%) |
| 18 to 34 Years | 0 (0.0%) | 0 (0.0%) |
| 35 to 64 Years | 68 (13.3%) | 97 (16.6%) |
| 65 to 74 Years | 97 (34.3%) | 30 (10.4%) |
| 75 Years and over | 37 (26.4%) | 73 (33.6%) |
Disability Class by Sex by Age in Belleair Bluffs
Disability Class: Hearing Difficulty
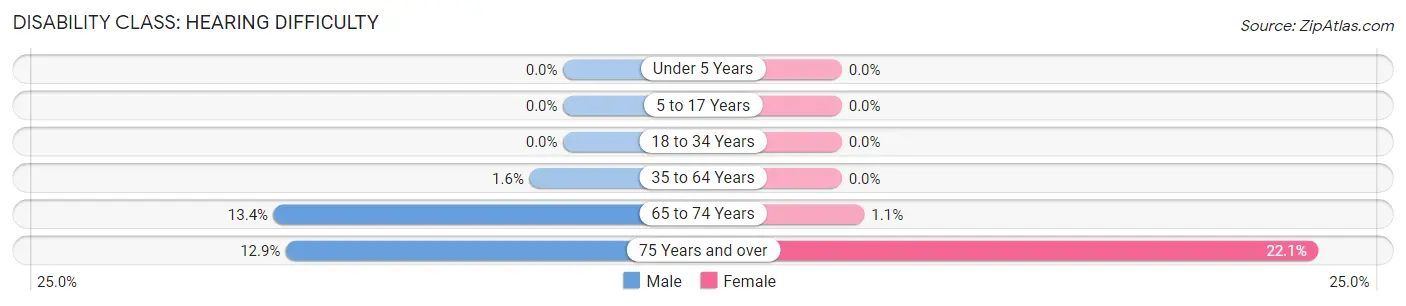
| Age Bracket | Male | Female |
| Under 5 Years | 0 (0.0%) | 0 (0.0%) |
| 5 to 17 Years | 0 (0.0%) | 0 (0.0%) |
| 18 to 34 Years | 0 (0.0%) | 0 (0.0%) |
| 35 to 64 Years | 8 (1.6%) | 0 (0.0%) |
| 65 to 74 Years | 38 (13.4%) | 3 (1.1%) |
| 75 Years and over | 18 (12.9%) | 48 (22.1%) |
Disability Class: Vision Difficulty
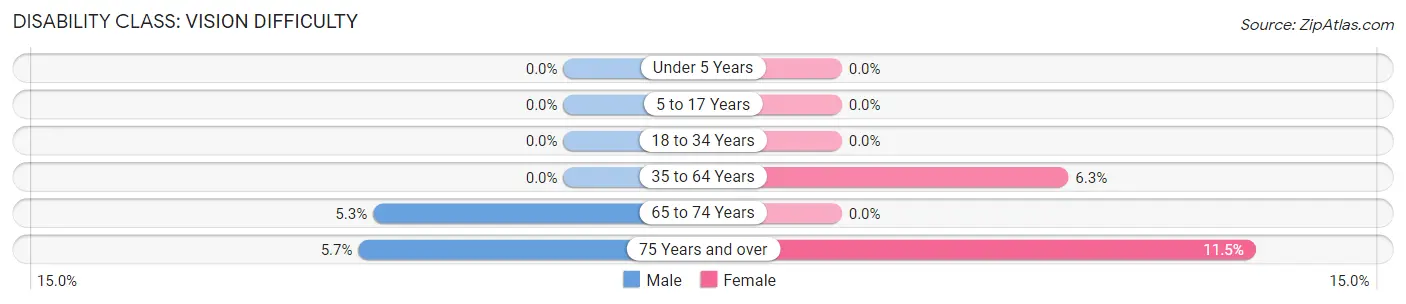
| Age Bracket | Male | Female |
| Under 5 Years | 0 (0.0%) | 0 (0.0%) |
| 5 to 17 Years | 0 (0.0%) | 0 (0.0%) |
| 18 to 34 Years | 0 (0.0%) | 0 (0.0%) |
| 35 to 64 Years | 0 (0.0%) | 37 (6.3%) |
| 65 to 74 Years | 15 (5.3%) | 0 (0.0%) |
| 75 Years and over | 8 (5.7%) | 25 (11.5%) |
Disability Class: Cognitive Difficulty
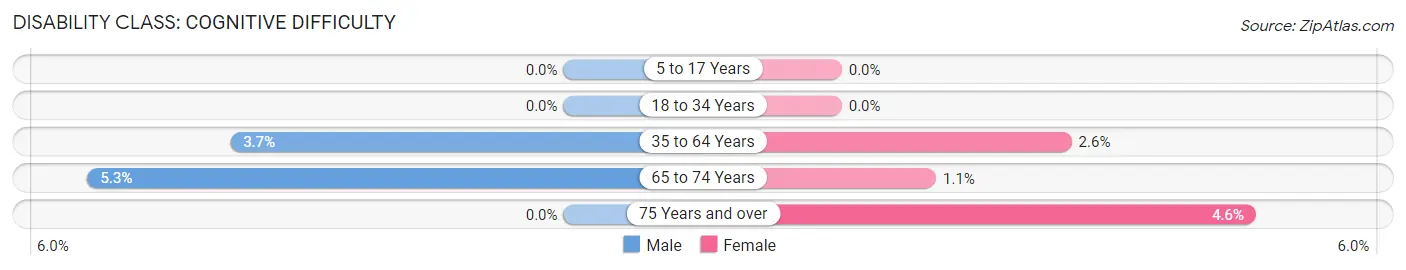
| Age Bracket | Male | Female |
| 5 to 17 Years | 0 (0.0%) | 0 (0.0%) |
| 18 to 34 Years | 0 (0.0%) | 0 (0.0%) |
| 35 to 64 Years | 19 (3.7%) | 15 (2.6%) |
| 65 to 74 Years | 15 (5.3%) | 3 (1.1%) |
| 75 Years and over | 0 (0.0%) | 10 (4.6%) |
Disability Class: Ambulatory Difficulty
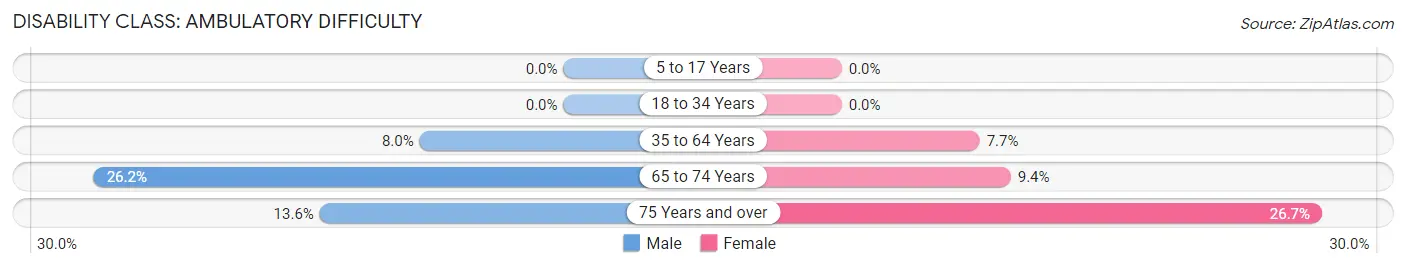
| Age Bracket | Male | Female |
| 5 to 17 Years | 0 (0.0%) | 0 (0.0%) |
| 18 to 34 Years | 0 (0.0%) | 0 (0.0%) |
| 35 to 64 Years | 41 (8.0%) | 45 (7.7%) |
| 65 to 74 Years | 74 (26.2%) | 27 (9.4%) |
| 75 Years and over | 19 (13.6%) | 58 (26.7%) |
Disability Class: Self-Care Difficulty
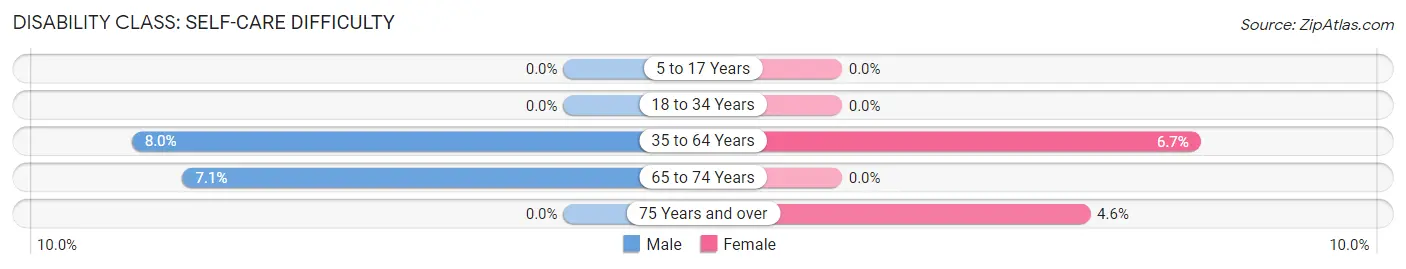
| Age Bracket | Male | Female |
| 5 to 17 Years | 0 (0.0%) | 0 (0.0%) |
| 18 to 34 Years | 0 (0.0%) | 0 (0.0%) |
| 35 to 64 Years | 41 (8.0%) | 39 (6.7%) |
| 65 to 74 Years | 20 (7.1%) | 0 (0.0%) |
| 75 Years and over | 0 (0.0%) | 10 (4.6%) |
Technology Access in Belleair Bluffs
Computing Device Access in Belleair Bluffs
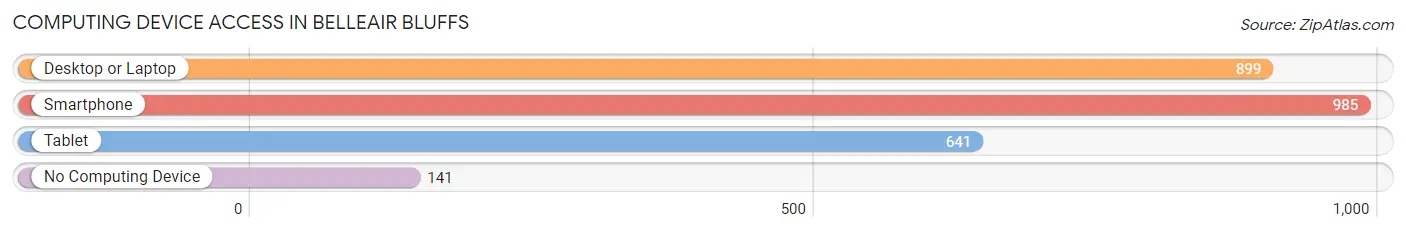
| Device Type | # Households | % Households |
| Desktop or Laptop | 899 | 73.2% |
| Smartphone | 985 | 80.1% |
| Tablet | 641 | 52.2% |
| No Computing Device | 141 | 11.5% |
| Total | 1,229 | 100.0% |
Internet Access in Belleair Bluffs
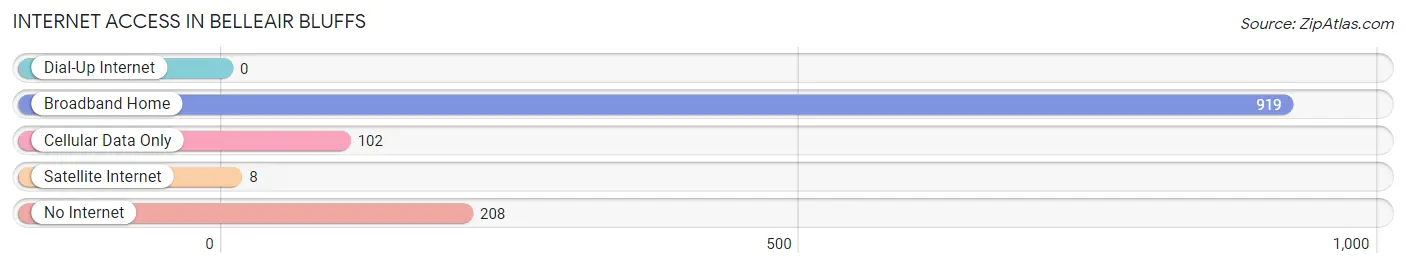
| Internet Type | # Households | % Households |
| Dial-Up Internet | 0 | 0.0% |
| Broadband Home | 919 | 74.8% |
| Cellular Data Only | 102 | 8.3% |
| Satellite Internet | 8 | 0.6% |
| No Internet | 208 | 16.9% |
| Total | 1,229 | 100.0% |
Belleair Bluffs Summary
Belleair Bluffs is a small city located in Pinellas County, Florida. It is situated on the Gulf of Mexico, just south of Clearwater and north of St. Petersburg. The city is part of the Tampa Bay Area and is home to a population of approximately 3,000 people.
Geography
Belleair Bluffs is located on the western coast of Florida, just south of Clearwater and north of St. Petersburg. The city is situated on the Gulf of Mexico and is bordered by the Intracoastal Waterway to the east. The city is located on a peninsula, with the Gulf of Mexico to the west and the Intracoastal Waterway to the east. The city is approximately 4.5 square miles in size and is home to a population of approximately 3,000 people.
The city is divided into two distinct areas: the mainland and the island. The mainland is located on the eastern side of the Intracoastal Waterway and is home to the majority of the city’s population. The island is located on the western side of the Intracoastal Waterway and is home to a smaller population.
History
Belleair Bluffs was first settled in the late 19th century by a group of settlers from the Midwest. The city was originally known as Belleair Beach, but the name was changed to Belleair Bluffs in the early 20th century. The city was incorporated in 1925 and has remained a small, quiet community ever since.
The city was originally a popular destination for tourists, but the city’s population began to decline in the 1950s and 1960s as the city’s economy shifted away from tourism. In the 1970s, the city began to experience a resurgence in population growth as the city’s economy shifted towards residential and commercial development.
Economy
The economy of Belleair Bluffs is largely based on residential and commercial development. The city is home to a variety of businesses, including restaurants, retail stores, and professional services. The city is also home to a number of medical facilities, including a hospital and several medical offices.
The city is also home to a number of recreational facilities, including a golf course, tennis courts, and a marina. The city is also home to a number of parks and beaches, which attract visitors from all over the Tampa Bay Area.
Demographics
As of the 2010 census, the population of Belleair Bluffs was 3,049. The population is largely white (90.2%), with a small percentage of African Americans (3.2%), Hispanics (2.7%), and Asians (1.7%). The median household income in the city is $50,945, and the median age is 44.
Belleair Bluffs is a small city with a rich history and a vibrant economy. The city is home to a diverse population and is a popular destination for tourists and residents alike. The city is home to a variety of businesses, recreational facilities, and medical facilities, making it an ideal place to live and work.
Common Questions
What is Per Capita Income in Belleair Bluffs?
Per Capita income in Belleair Bluffs is $58,043.
What is the Median Family Income in Belleair Bluffs?
Median Family Income in Belleair Bluffs is $95,583.
What is the Median Household income in Belleair Bluffs?
Median Household Income in Belleair Bluffs is $51,913.
What is Income or Wage Gap in Belleair Bluffs?
Income or Wage Gap in Belleair Bluffs is 12.8%.
Women in Belleair Bluffs earn 87.2 cents for every dollar earned by a man.
What is Family Income Deficit in Belleair Bluffs?
Family Income Deficit in Belleair Bluffs is $2,016.
Families that are below poverty line in Belleair Bluffs earn $2,016 less on average than the poverty threshold level.
What is Inequality or Gini Index in Belleair Bluffs?
Inequality or Gini Index in Belleair Bluffs is 0.61.
What is the Total Population of Belleair Bluffs?
Total Population of Belleair Bluffs is 2,476.
What is the Total Male Population of Belleair Bluffs?
Total Male Population of Belleair Bluffs is 1,145.
What is the Total Female Population of Belleair Bluffs?
Total Female Population of Belleair Bluffs is 1,331.
What is the Ratio of Males per 100 Females in Belleair Bluffs?
There are 86.03 Males per 100 Females in Belleair Bluffs.
What is the Ratio of Females per 100 Males in Belleair Bluffs?
There are 116.24 Females per 100 Males in Belleair Bluffs.
What is the Median Population Age in Belleair Bluffs?
Median Population Age in Belleair Bluffs is 60.1 Years.
What is the Average Family Size in Belleair Bluffs
Average Family Size in Belleair Bluffs is 3.0 People.
What is the Average Household Size in Belleair Bluffs
Average Household Size in Belleair Bluffs is 2.0 People.
How Large is the Labor Force in Belleair Bluffs?
There are 1,242 People in the Labor Forcein in Belleair Bluffs.
What is the Percentage of People in the Labor Force in Belleair Bluffs?
55.3% of People are in the Labor Force in Belleair Bluffs.
What is the Unemployment Rate in Belleair Bluffs?
Unemployment Rate in Belleair Bluffs is 4.7%.