Connerton, FL Map & Demographics
Connerton Map
Connerton Overview
$28,996
PER CAPITA INCOME
$116,199
AVG FAMILY INCOME
$115,757
AVG HOUSEHOLD INCOME
67.6%
WAGE / INCOME GAP [ % ]
32.4¢/ $1
WAGE / INCOME GAP [ $ ]
0.28
INEQUALITY / GINI INDEX
6,383
TOTAL POPULATION
3,515
MALE POPULATION
2,868
FEMALE POPULATION
122.56
MALES / 100 FEMALES
81.59
FEMALES / 100 MALES
32.4
MEDIAN AGE
3.8
AVG FAMILY SIZE
3.6
AVG HOUSEHOLD SIZE
2,338
LABOR FORCE [ PEOPLE ]
50.5%
PERCENT IN LABOR FORCE
4.4%
UNEMPLOYMENT RATE
Income in Connerton
Income Overview in Connerton
Per Capita Income in Connerton is $28,996, while median incomes of families and households are $116,199 and $115,757 respectively.
| Characteristic | Number | Measure |
| Per Capita Income | 6,383 | $28,996 |
| Median Family Income | 1,338 | $116,199 |
| Mean Family Income | 1,338 | $128,092 |
| Median Household Income | 1,442 | $115,757 |
| Mean Household Income | 1,442 | $123,699 |
| Income Deficit | 1,338 | $0 |
| Wage / Income Gap (%) | 6,383 | 67.64% |
| Wage / Income Gap ($) | 6,383 | 32.36¢ per $1 |
| Gini / Inequality Index | 6,383 | 0.28 |
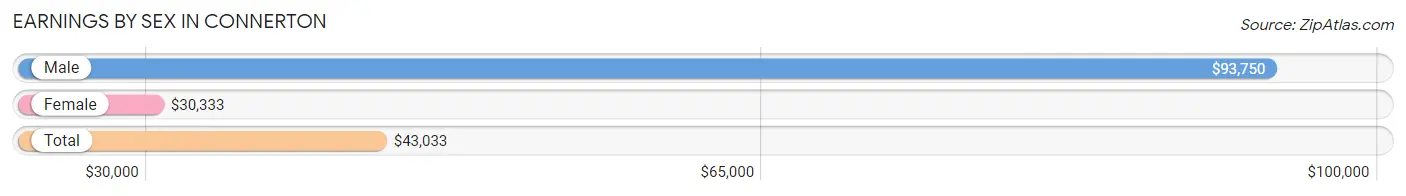
Earnings by Sex in Connerton
Average Earnings in Connerton are $43,033, $93,750 for men and $30,333 for women, a difference of 67.6%.
| Sex | Number | Average Earnings |
| Male | 1,372 (53.5%) | $93,750 |
| Female | 1,190 (46.5%) | $30,333 |
| Total | 2,562 (100.0%) | $43,033 |
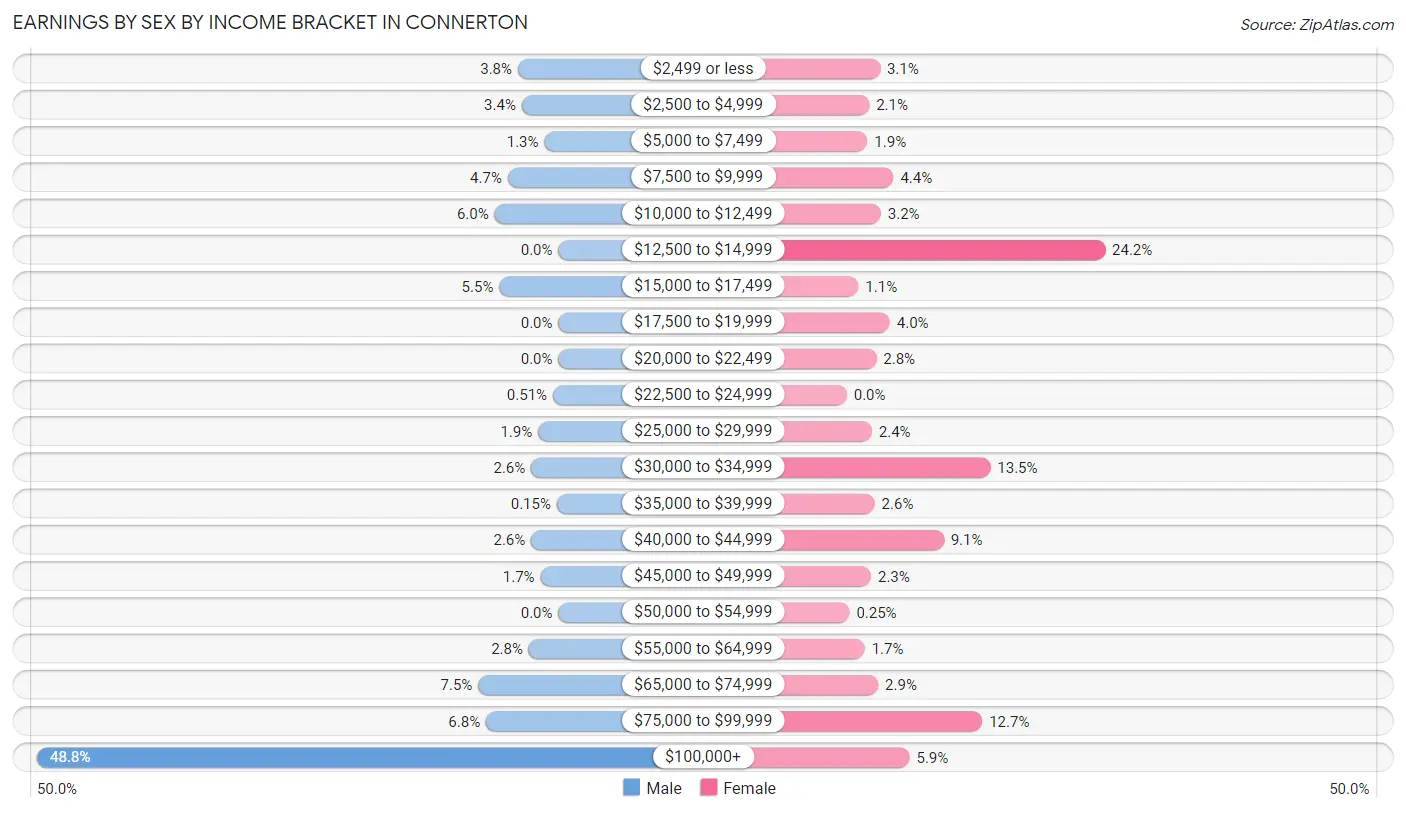
Earnings by Sex by Income Bracket in Connerton
The most common earnings brackets in Connerton are $100,000+ for men (670 | 48.8%) and $12,500 to $14,999 for women (288 | 24.2%).
| Income | Male | Female |
| $2,499 or less | 52 (3.8%) | 37 (3.1%) |
| $2,500 to $4,999 | 47 (3.4%) | 25 (2.1%) |
| $5,000 to $7,499 | 18 (1.3%) | 23 (1.9%) |
| $7,500 to $9,999 | 65 (4.7%) | 52 (4.4%) |
| $10,000 to $12,499 | 82 (6.0%) | 38 (3.2%) |
| $12,500 to $14,999 | 0 (0.0%) | 288 (24.2%) |
| $15,000 to $17,499 | 76 (5.5%) | 13 (1.1%) |
| $17,500 to $19,999 | 0 (0.0%) | 48 (4.0%) |
| $20,000 to $22,499 | 0 (0.0%) | 33 (2.8%) |
| $22,500 to $24,999 | 7 (0.5%) | 0 (0.0%) |
| $25,000 to $29,999 | 26 (1.9%) | 28 (2.4%) |
| $30,000 to $34,999 | 35 (2.5%) | 160 (13.5%) |
| $35,000 to $39,999 | 2 (0.2%) | 31 (2.6%) |
| $40,000 to $44,999 | 35 (2.5%) | 108 (9.1%) |
| $45,000 to $49,999 | 23 (1.7%) | 27 (2.3%) |
| $50,000 to $54,999 | 0 (0.0%) | 3 (0.3%) |
| $55,000 to $64,999 | 38 (2.8%) | 20 (1.7%) |
| $65,000 to $74,999 | 103 (7.5%) | 35 (2.9%) |
| $75,000 to $99,999 | 93 (6.8%) | 151 (12.7%) |
| $100,000+ | 670 (48.8%) | 70 (5.9%) |
| Total | 1,372 (100.0%) | 1,190 (100.0%) |
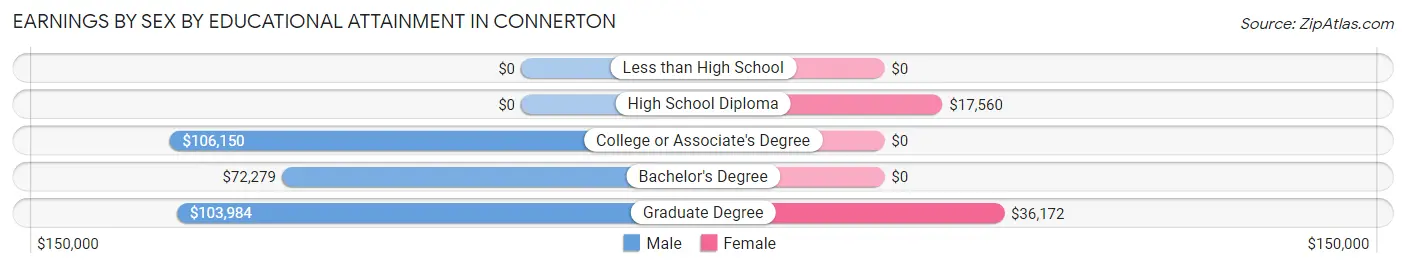
Earnings by Sex by Educational Attainment in Connerton
| Educational Attainment | Male Income | Female Income |
| Less than High School | - | - |
| High School Diploma | - | - |
| College or Associate's Degree | $106,150 | $0 |
| Bachelor's Degree | $72,279 | $0 |
| Graduate Degree | $103,984 | $36,172 |
| Total | $103,403 | $0 |
Family Income in Connerton
Family Income Brackets in Connerton
According to the Connerton family income data, there are 534 families falling into the $100,000 to $149,999 income range, which is the most common income bracket and makes up 39.9% of all families.
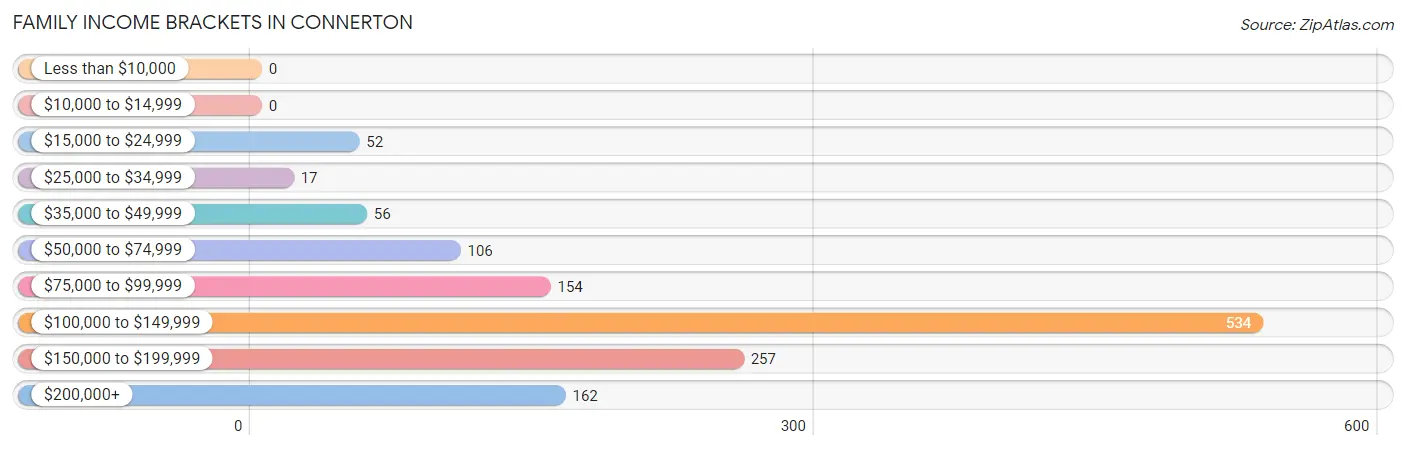
| Income Bracket | # Families | % Families |
| Less than $10,000 | 0 | 0.0% |
| $10,000 to $14,999 | 0 | 0.0% |
| $15,000 to $24,999 | 52 | 3.9% |
| $25,000 to $34,999 | 17 | 1.3% |
| $35,000 to $49,999 | 56 | 4.2% |
| $50,000 to $74,999 | 106 | 7.9% |
| $75,000 to $99,999 | 154 | 11.5% |
| $100,000 to $149,999 | 534 | 39.9% |
| $150,000 to $199,999 | 257 | 19.2% |
| $200,000+ | 162 | 12.1% |
Family Income by Famaliy Size in Connerton
6-person families (124 | 9.3%) account for the highest median family income in Connerton with $250,001 per family, while 2-person families (248 | 18.5%) have the highest median income of $48,465 per family member.
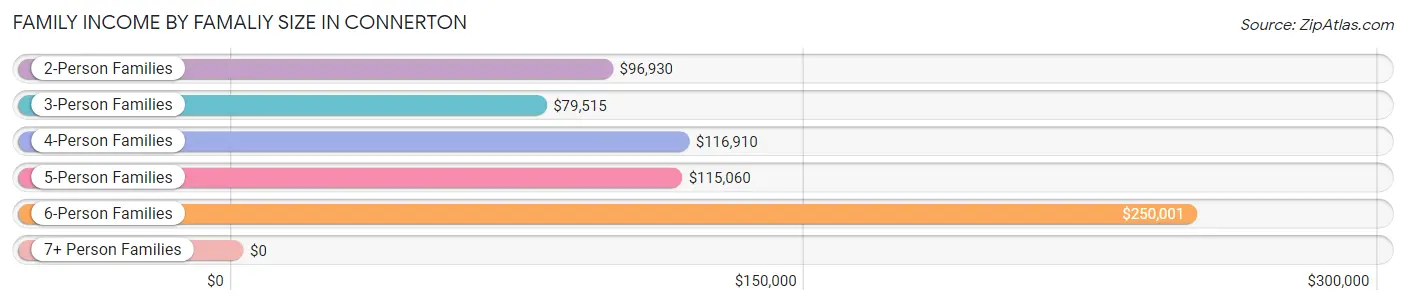
| Income Bracket | # Families | Median Income |
| 2-Person Families | 248 (18.5%) | $96,930 |
| 3-Person Families | 213 (15.9%) | $79,515 |
| 4-Person Families | 571 (42.7%) | $116,910 |
| 5-Person Families | 171 (12.8%) | $115,060 |
| 6-Person Families | 124 (9.3%) | $250,001 |
| 7+ Person Families | 11 (0.8%) | $0 |
| Total | 1,338 (100.0%) | $116,199 |
Family Income by Number of Earners in Connerton
The median family income in Connerton is $116,199, with families comprising 3+ earners (179) having the highest median family income of $177,841, while families with no earners (127) have the lowest median family income of $95,373, accounting for 13.4% and 9.5% of families, respectively.
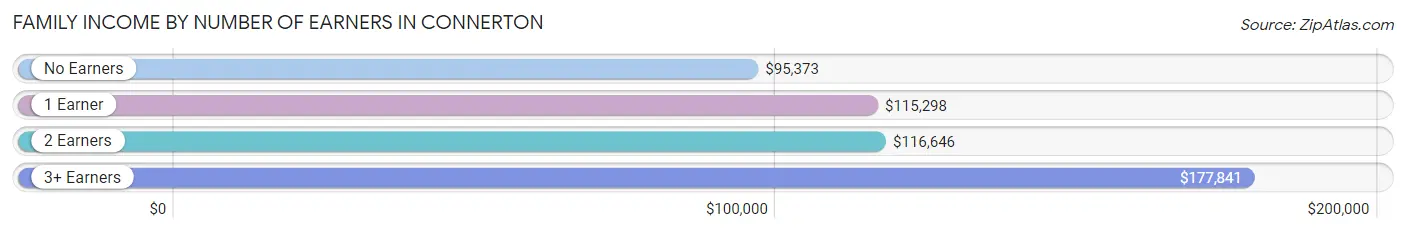
| Number of Earners | # Families | Median Income |
| No Earners | 127 (9.5%) | $95,373 |
| 1 Earner | 399 (29.8%) | $115,298 |
| 2 Earners | 633 (47.3%) | $116,646 |
| 3+ Earners | 179 (13.4%) | $177,841 |
| Total | 1,338 (100.0%) | $116,199 |
Household Income in Connerton
Household Income Brackets in Connerton
With 544 households falling in the category, the $100,000 to $149,999 income range is the most frequent in Connerton, accounting for 37.7% of all households.
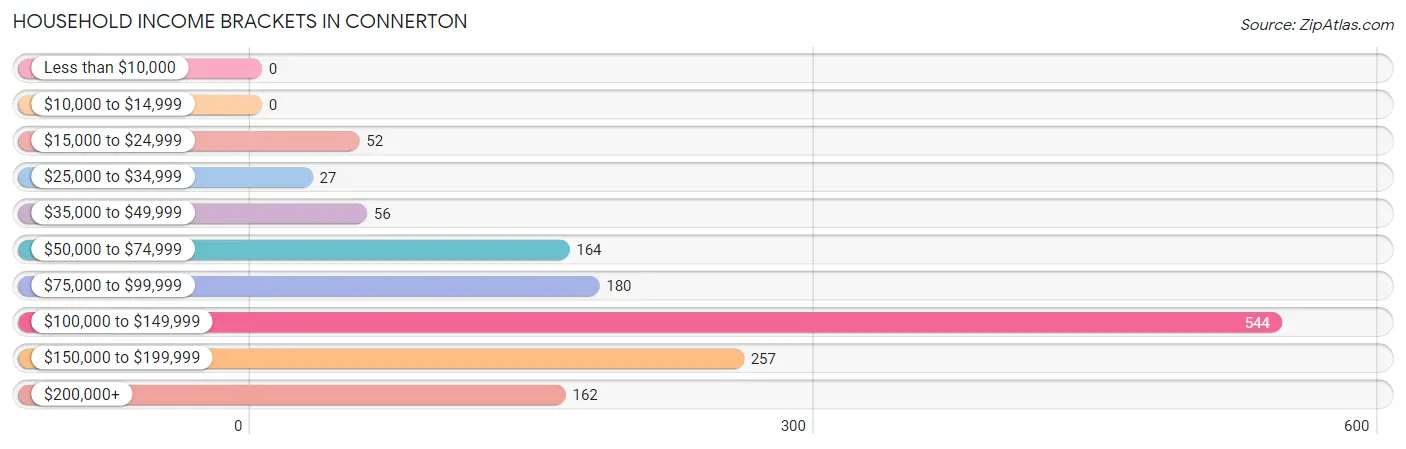
| Income Bracket | # Households | % Households |
| Less than $10,000 | 0 | 0.0% |
| $10,000 to $14,999 | 0 | 0.0% |
| $15,000 to $24,999 | 52 | 3.6% |
| $25,000 to $34,999 | 27 | 1.9% |
| $35,000 to $49,999 | 56 | 3.9% |
| $50,000 to $74,999 | 164 | 11.4% |
| $75,000 to $99,999 | 180 | 12.5% |
| $100,000 to $149,999 | 544 | 37.7% |
| $150,000 to $199,999 | 257 | 17.8% |
| $200,000+ | 162 | 11.2% |
Household Income by Householder Age in Connerton
The median household income in Connerton is $115,757, with the highest median household income of $148,864 found in the 45 to 64 years age bracket for the primary householder. A total of 392 households (27.2%) fall into this category.
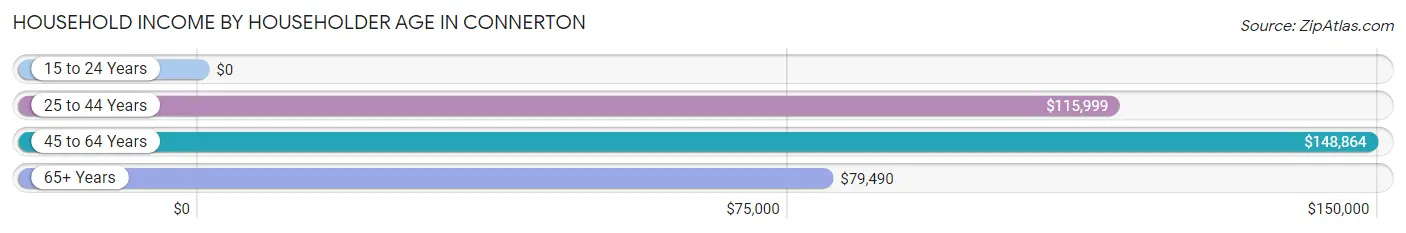
| Income Bracket | # Households | Median Income |
| 15 to 24 Years | 0 (0.0%) | $0 |
| 25 to 44 Years | 797 (55.3%) | $115,999 |
| 45 to 64 Years | 392 (27.2%) | $148,864 |
| 65+ Years | 253 (17.5%) | $79,490 |
| Total | 1,442 (100.0%) | $115,757 |
Poverty in Connerton
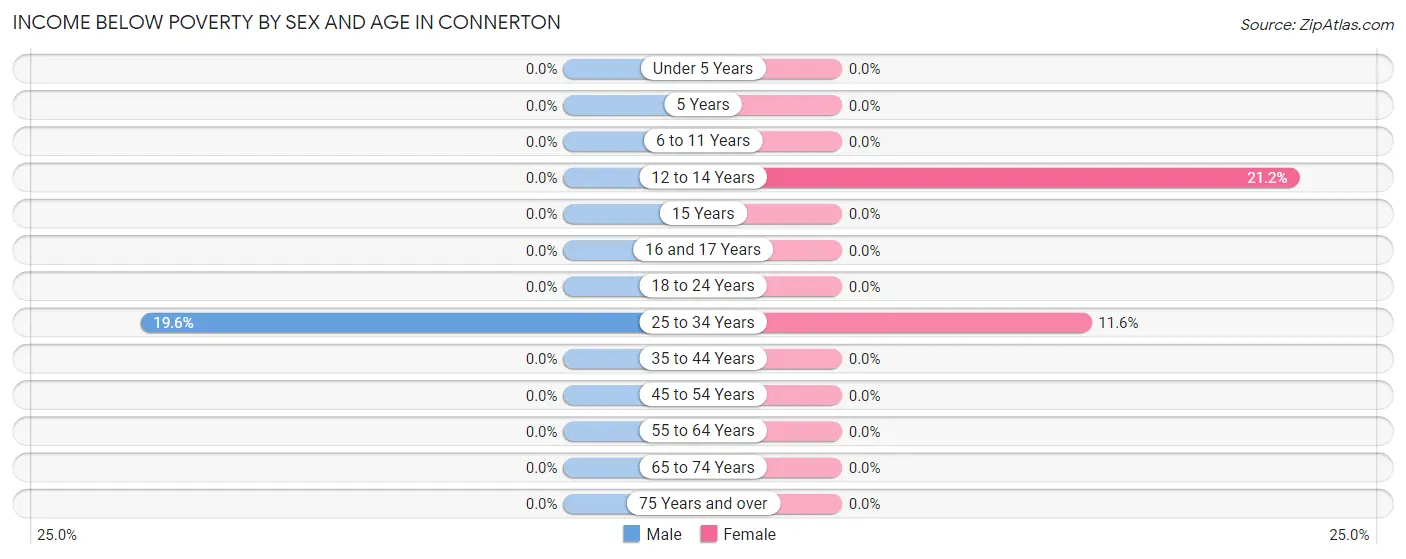
Income Below Poverty by Sex and Age in Connerton
With 2.0% poverty level for males and 3.5% for females among the residents of Connerton, 25 to 34 year old males and 12 to 14 year old females are the most vulnerable to poverty, with 53 males (19.6%) and 38 females (21.2%) in their respective age groups living below the poverty level.
| Age Bracket | Male | Female |
| Under 5 Years | 0 (0.0%) | 0 (0.0%) |
| 5 Years | 0 (0.0%) | 0 (0.0%) |
| 6 to 11 Years | 0 (0.0%) | 0 (0.0%) |
| 12 to 14 Years | 0 (0.0%) | 38 (21.2%) |
| 15 Years | 0 (0.0%) | 0 (0.0%) |
| 16 and 17 Years | 0 (0.0%) | 0 (0.0%) |
| 18 to 24 Years | 0 (0.0%) | 0 (0.0%) |
| 25 to 34 Years | 53 (19.6%) | 52 (11.6%) |
| 35 to 44 Years | 0 (0.0%) | 0 (0.0%) |
| 45 to 54 Years | 0 (0.0%) | 0 (0.0%) |
| 55 to 64 Years | 0 (0.0%) | 0 (0.0%) |
| 65 to 74 Years | 0 (0.0%) | 0 (0.0%) |
| 75 Years and over | 0 (0.0%) | 0 (0.0%) |
| Total | 53 (2.0%) | 90 (3.5%) |
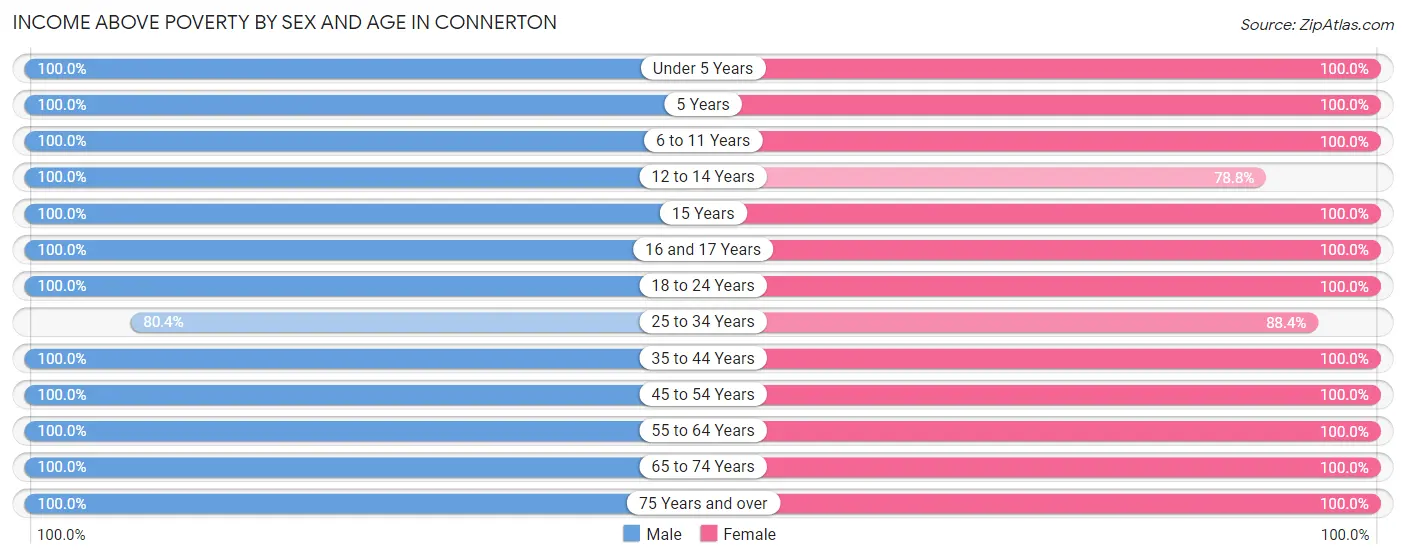
Income Above Poverty by Sex and Age in Connerton
According to the poverty statistics in Connerton, males aged under 5 years and females aged under 5 years are the age groups that are most secure financially, with 100.0% of males and 100.0% of females in these age groups living above the poverty line.
| Age Bracket | Male | Female |
| Under 5 Years | 366 (100.0%) | 181 (100.0%) |
| 5 Years | 90 (100.0%) | 26 (100.0%) |
| 6 to 11 Years | 393 (100.0%) | 211 (100.0%) |
| 12 to 14 Years | 144 (100.0%) | 141 (78.8%) |
| 15 Years | 24 (100.0%) | 139 (100.0%) |
| 16 and 17 Years | 120 (100.0%) | 116 (100.0%) |
| 18 to 24 Years | 115 (100.0%) | 174 (100.0%) |
| 25 to 34 Years | 217 (80.4%) | 397 (88.4%) |
| 35 to 44 Years | 524 (100.0%) | 464 (100.0%) |
| 45 to 54 Years | 286 (100.0%) | 237 (100.0%) |
| 55 to 64 Years | 106 (100.0%) | 216 (100.0%) |
| 65 to 74 Years | 150 (100.0%) | 157 (100.0%) |
| 75 Years and over | 44 (100.0%) | 42 (100.0%) |
| Total | 2,579 (98.0%) | 2,501 (96.5%) |
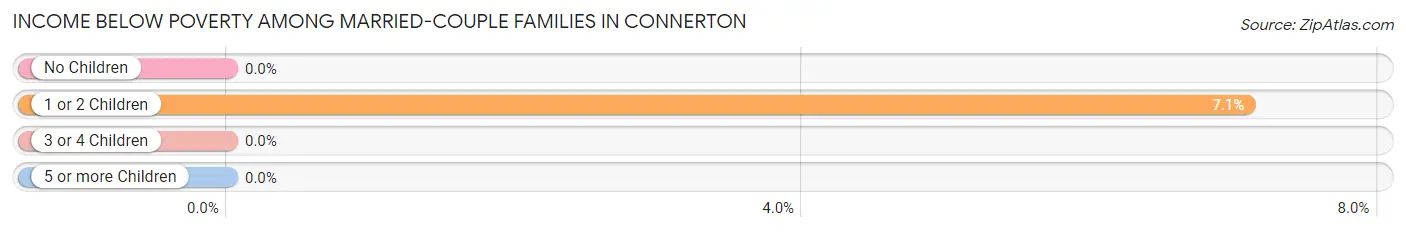
Income Below Poverty Among Married-Couple Families in Connerton
The poverty statistics for married-couple families in Connerton show that 4.0% or 52 of the total 1,316 families live below the poverty line. Families with 1 or 2 children have the highest poverty rate of 7.1%, comprising of 52 families. On the other hand, families with no children have the lowest poverty rate of 0.0%, which includes 0 families.
| Children | Above Poverty | Below Poverty |
| No Children | 326 (100.0%) | 0 (0.0%) |
| 1 or 2 Children | 681 (92.9%) | 52 (7.1%) |
| 3 or 4 Children | 257 (100.0%) | 0 (0.0%) |
| 5 or more Children | 0 (0.0%) | 0 (0.0%) |
| Total | 1,264 (96.1%) | 52 (4.0%) |
Income Below Poverty Among Single-Parent Households in Connerton
| Children | Single Father | Single Mother |
| No Children | 0 (0.0%) | 0 (0.0%) |
| 1 or 2 Children | 0 (0.0%) | 0 (0.0%) |
| 3 or 4 Children | 0 (0.0%) | 0 (0.0%) |
| 5 or more Children | 0 (0.0%) | 0 (0.0%) |
| Total | 0 (0.0%) | 0 (0.0%) |
Income Below Poverty Among Married-Couple vs Single-Parent Households in Connerton
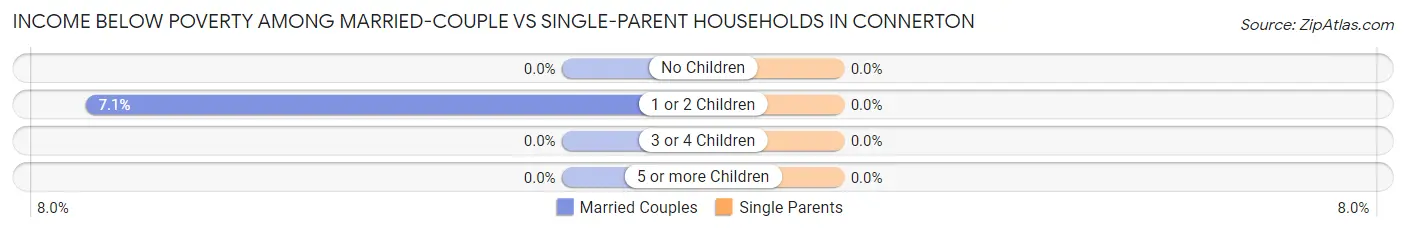
| Children | Married-Couple Families | Single-Parent Households |
| No Children | 0 (0.0%) | 0 (0.0%) |
| 1 or 2 Children | 52 (7.1%) | 0 (0.0%) |
| 3 or 4 Children | 0 (0.0%) | 0 (0.0%) |
| 5 or more Children | 0 (0.0%) | 0 (0.0%) |
| Total | 52 (4.0%) | 0 (0.0%) |
Race in Connerton
The most populous races in Connerton are White / Caucasian (4,813 | 75.4%), Hispanic or Latino (938 | 14.7%), and Two or more Races (497 | 7.8%).
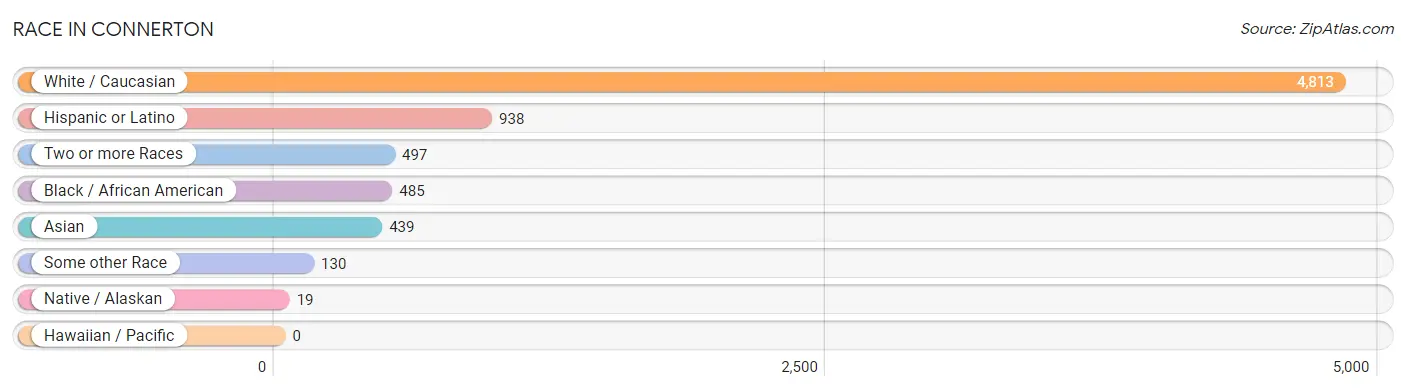
| Race | # Population | % Population |
| Asian | 439 | 6.9% |
| Black / African American | 485 | 7.6% |
| Hawaiian / Pacific | 0 | 0.0% |
| Hispanic or Latino | 938 | 14.7% |
| Native / Alaskan | 19 | 0.3% |
| White / Caucasian | 4,813 | 75.4% |
| Two or more Races | 497 | 7.8% |
| Some other Race | 130 | 2.0% |
| Total | 6,383 | 100.0% |
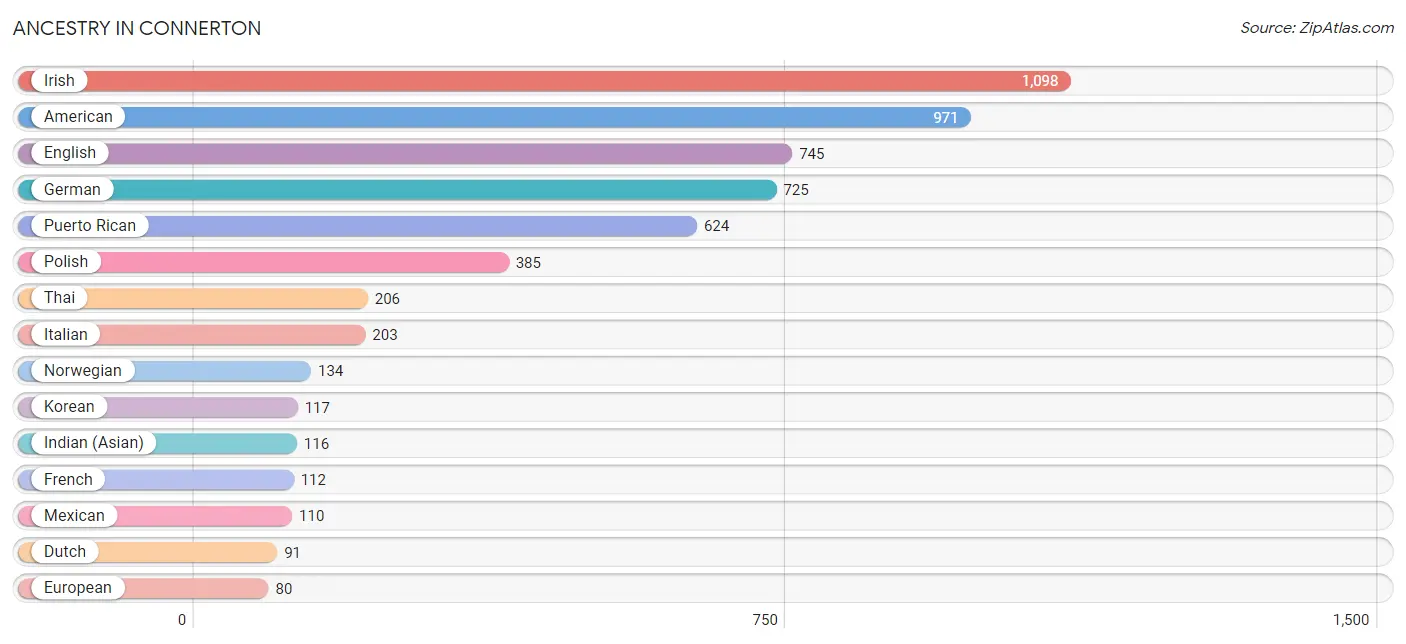
Ancestry in Connerton
The most populous ancestries reported in Connerton are Irish (1,098 | 17.2%), American (971 | 15.2%), English (745 | 11.7%), German (725 | 11.4%), and Puerto Rican (624 | 9.8%), together accounting for 65.2% of all Connerton residents.
| Ancestry | # Population | % Population |
| African | 62 | 1.0% |
| American | 971 | 15.2% |
| Austrian | 11 | 0.2% |
| Bhutanese | 19 | 0.3% |
| British | 17 | 0.3% |
| Central American | 44 | 0.7% |
| Colombian | 2 | 0.0% |
| Cuban | 61 | 1.0% |
| Danish | 53 | 0.8% |
| Dominican | 75 | 1.2% |
| Dutch | 91 | 1.4% |
| Dutch West Indian | 17 | 0.3% |
| English | 745 | 11.7% |
| European | 80 | 1.3% |
| French | 112 | 1.8% |
| German | 725 | 11.4% |
| Greek | 22 | 0.3% |
| Guatemalan | 25 | 0.4% |
| Hopi | 14 | 0.2% |
| Indian (Asian) | 116 | 1.8% |
| Inupiat | 19 | 0.3% |
| Irish | 1,098 | 17.2% |
| Italian | 203 | 3.2% |
| Korean | 117 | 1.8% |
| Mexican | 110 | 1.7% |
| Norwegian | 134 | 2.1% |
| Polish | 385 | 6.0% |
| Portuguese | 21 | 0.3% |
| Puerto Rican | 624 | 9.8% |
| Russian | 7 | 0.1% |
| Salvadoran | 19 | 0.3% |
| Scottish | 39 | 0.6% |
| South American | 2 | 0.0% |
| Spaniard | 22 | 0.3% |
| Subsaharan African | 62 | 1.0% |
| Swedish | 12 | 0.2% |
| Thai | 206 | 3.2% |
| Ukrainian | 21 | 0.3% |
| Welsh | 57 | 0.9% | View All 39 Rows |
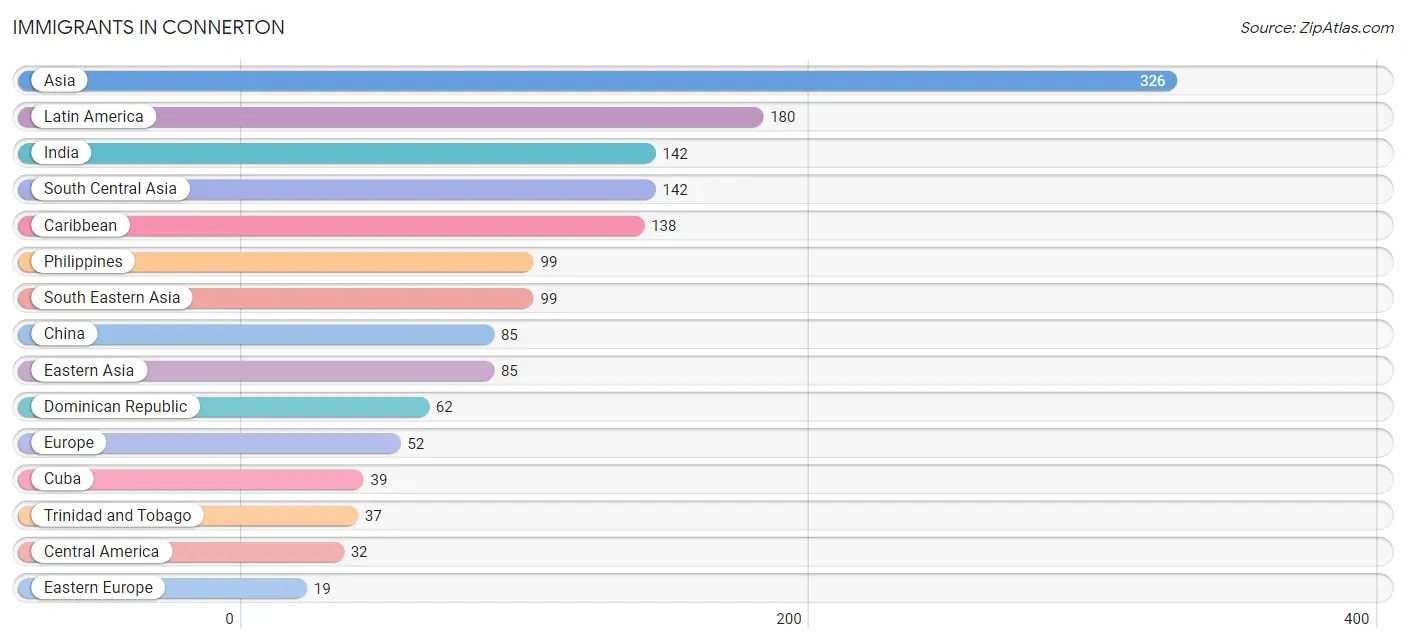
Immigrants in Connerton
The most numerous immigrant groups reported in Connerton came from Asia (326 | 5.1%), Latin America (180 | 2.8%), India (142 | 2.2%), South Central Asia (142 | 2.2%), and Caribbean (138 | 2.2%), together accounting for 14.5% of all Connerton residents.
| Immigration Origin | # Population | % Population |
| Asia | 326 | 5.1% |
| Brazil | 10 | 0.2% |
| Caribbean | 138 | 2.2% |
| Central America | 32 | 0.5% |
| China | 85 | 1.3% |
| Cuba | 39 | 0.6% |
| Dominican Republic | 62 | 1.0% |
| Eastern Asia | 85 | 1.3% |
| Eastern Europe | 19 | 0.3% |
| El Salvador | 19 | 0.3% |
| Europe | 52 | 0.8% |
| Guatemala | 13 | 0.2% |
| India | 142 | 2.2% |
| Latin America | 180 | 2.8% |
| Netherlands | 16 | 0.3% |
| Northern Europe | 17 | 0.3% |
| Philippines | 99 | 1.5% |
| Poland | 19 | 0.3% |
| South America | 10 | 0.2% |
| South Central Asia | 142 | 2.2% |
| South Eastern Asia | 99 | 1.5% |
| Trinidad and Tobago | 37 | 0.6% |
| Western Europe | 16 | 0.3% | View All 23 Rows |
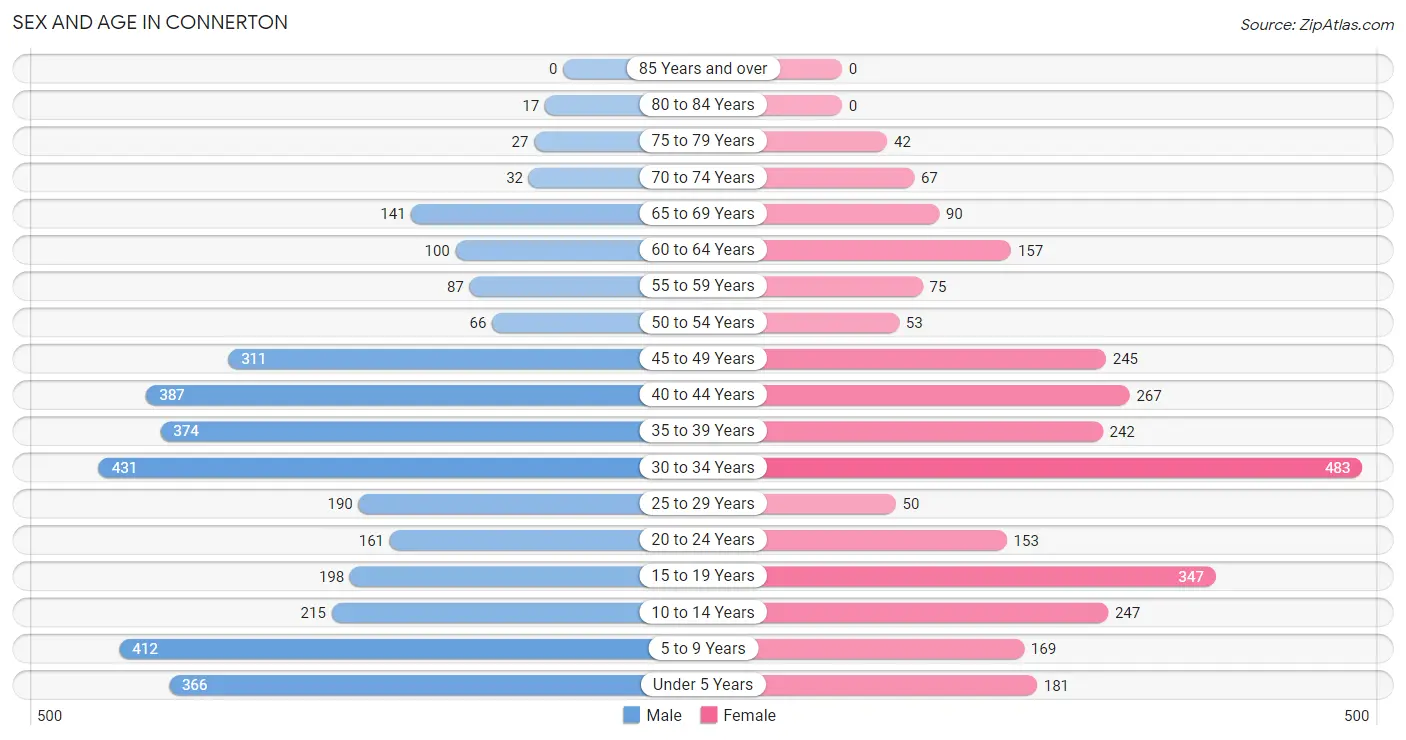
Sex and Age in Connerton
Sex and Age in Connerton
The most populous age groups in Connerton are 30 to 34 Years (431 | 12.3%) for men and 30 to 34 Years (483 | 16.8%) for women.
| Age Bracket | Male | Female |
| Under 5 Years | 366 (10.4%) | 181 (6.3%) |
| 5 to 9 Years | 412 (11.7%) | 169 (5.9%) |
| 10 to 14 Years | 215 (6.1%) | 247 (8.6%) |
| 15 to 19 Years | 198 (5.6%) | 347 (12.1%) |
| 20 to 24 Years | 161 (4.6%) | 153 (5.3%) |
| 25 to 29 Years | 190 (5.4%) | 50 (1.7%) |
| 30 to 34 Years | 431 (12.3%) | 483 (16.8%) |
| 35 to 39 Years | 374 (10.6%) | 242 (8.4%) |
| 40 to 44 Years | 387 (11.0%) | 267 (9.3%) |
| 45 to 49 Years | 311 (8.8%) | 245 (8.5%) |
| 50 to 54 Years | 66 (1.9%) | 53 (1.8%) |
| 55 to 59 Years | 87 (2.5%) | 75 (2.6%) |
| 60 to 64 Years | 100 (2.8%) | 157 (5.5%) |
| 65 to 69 Years | 141 (4.0%) | 90 (3.1%) |
| 70 to 74 Years | 32 (0.9%) | 67 (2.3%) |
| 75 to 79 Years | 27 (0.8%) | 42 (1.5%) |
| 80 to 84 Years | 17 (0.5%) | 0 (0.0%) |
| 85 Years and over | 0 (0.0%) | 0 (0.0%) |
| Total | 3,515 (100.0%) | 2,868 (100.0%) |
Families and Households in Connerton
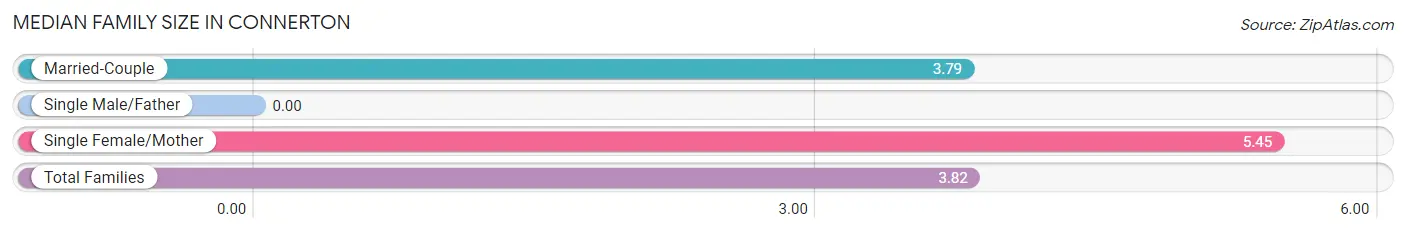
Median Family Size in Connerton
| Family Type | # Families | Family Size |
| Married-Couple | 1,316 (98.4%) | 3.79 |
| Single Male/Father | 0 (0.0%) | - |
| Single Female/Mother | 22 (1.6%) | 5.45 |
| Total Families | 1,338 (100.0%) | 3.82 |
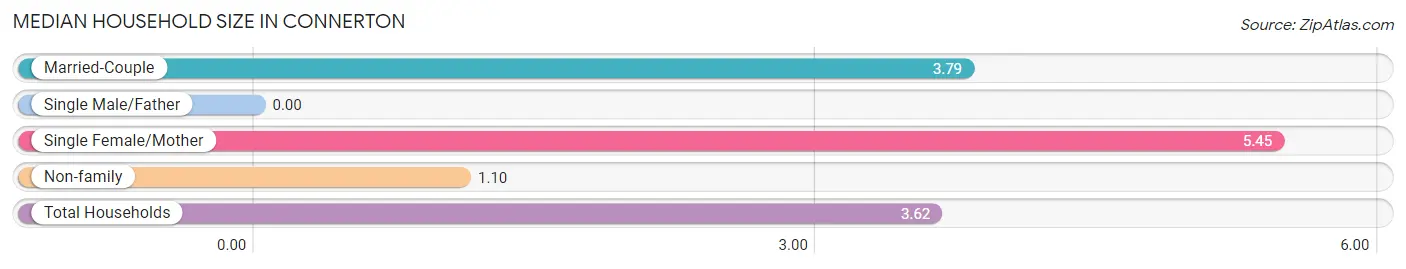
Median Household Size in Connerton
| Household Type | # Households | Household Size |
| Married-Couple | 1,316 (91.3%) | 3.79 |
| Single Male/Father | 0 (0.0%) | - |
| Single Female/Mother | 22 (1.5%) | 5.45 |
| Non-family | 104 (7.2%) | 1.10 |
| Total Households | 1,442 (100.0%) | 3.62 |
Household Size by Marriage Status in Connerton
Out of a total of 1,442 households in Connerton, 1,338 (92.8%) are family households, while 104 (7.2%) are nonfamily households. The most numerous type of family households are 4-person households, comprising 571, and the most common type of nonfamily households are 1-person households, comprising 95.
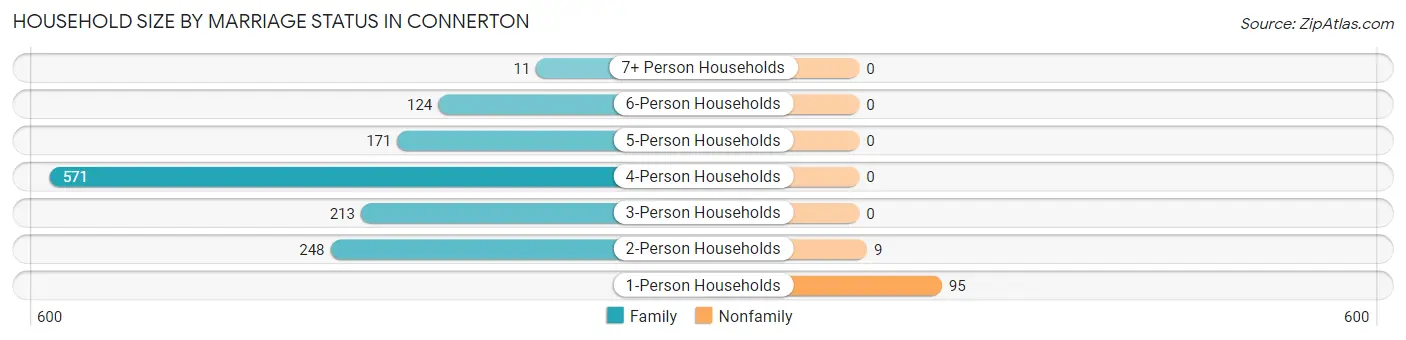
| Household Size | Family Households | Nonfamily Households |
| 1-Person Households | - | 95 (6.6%) |
| 2-Person Households | 248 (17.2%) | 9 (0.6%) |
| 3-Person Households | 213 (14.8%) | 0 (0.0%) |
| 4-Person Households | 571 (39.6%) | 0 (0.0%) |
| 5-Person Households | 171 (11.9%) | 0 (0.0%) |
| 6-Person Households | 124 (8.6%) | 0 (0.0%) |
| 7+ Person Households | 11 (0.8%) | 0 (0.0%) |
| Total | 1,338 (92.8%) | 104 (7.2%) |
Female Fertility in Connerton
Fertility by Age in Connerton
Average fertility rate in Connerton is 32.0 births per 1,000 women. Women in the age bracket of 20 to 34 years have the highest fertility rate with 57.0 births per 1,000 women. Women in the age bracket of 20 to 34 years acount for 67.2% of all women with births.
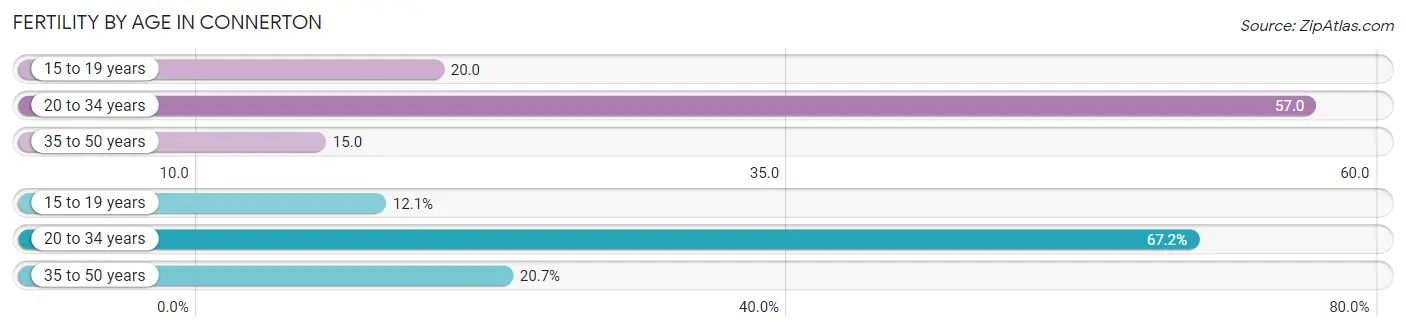
| Age Bracket | Women with Births | Births / 1,000 Women |
| 15 to 19 years | 7 (12.1%) | 20.0 |
| 20 to 34 years | 39 (67.2%) | 57.0 |
| 35 to 50 years | 12 (20.7%) | 15.0 |
| Total | 58 (100.0%) | 32.0 |
Fertility by Age by Marriage Status in Connerton
56.9% of women with births (58) in Connerton are married. The highest percentage of unmarried women with births falls into 15 to 19 years age bracket with 100.0% of them unmarried at the time of birth, while the lowest percentage of unmarried women with births belong to 35 to 50 years age bracket with 0.0% of them unmarried.
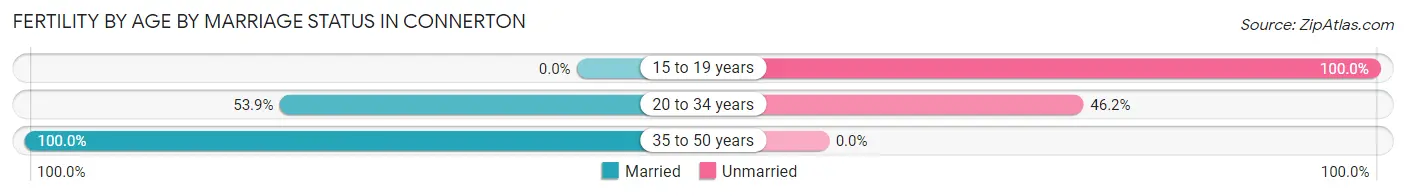
| Age Bracket | Married | Unmarried |
| 15 to 19 years | 0 (0.0%) | 7 (100.0%) |
| 20 to 34 years | 21 (53.8%) | 18 (46.2%) |
| 35 to 50 years | 12 (100.0%) | 0 (0.0%) |
| Total | 33 (56.9%) | 25 (43.1%) |
Fertility by Education in Connerton
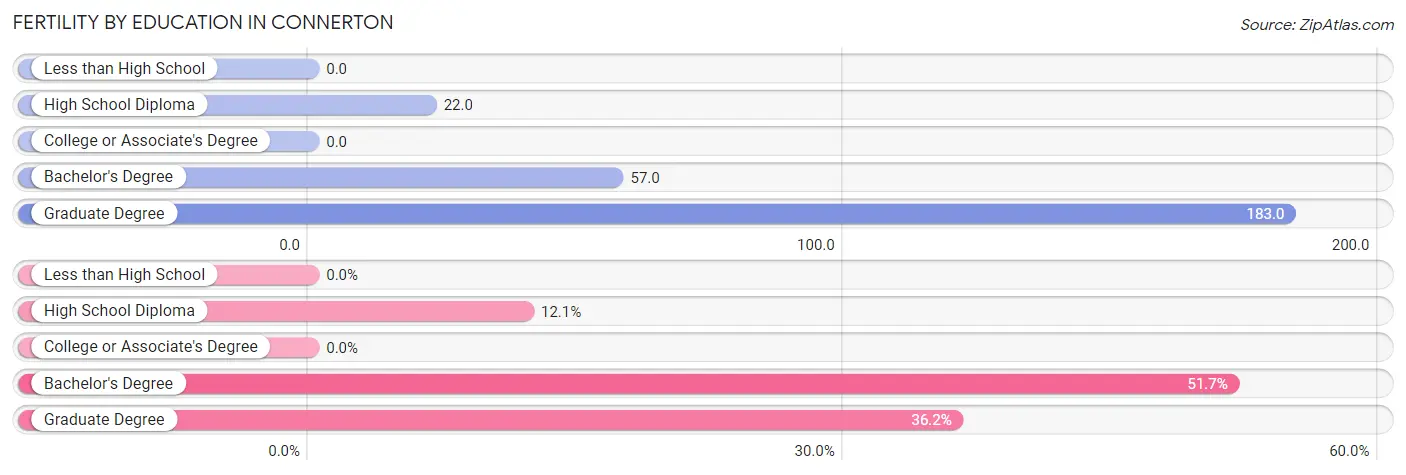
| Educational Attainment | Women with Births | Births / 1,000 Women |
| Less than High School | 0 (0.0%) | 0.0 |
| High School Diploma | 7 (12.1%) | 22.0 |
| College or Associate's Degree | 0 (0.0%) | 0.0 |
| Bachelor's Degree | 30 (51.7%) | 57.0 |
| Graduate Degree | 21 (36.2%) | 183.0 |
| Total | 58 (100.0%) | 32.0 |
Fertility by Education by Marriage Status in Connerton
43.1% of women with births in Connerton are unmarried. Women with the educational attainment of graduate degree are most likely to be married with 100.0% of them married at childbirth, while women with the educational attainment of high school diploma are least likely to be married with 100.0% of them unmarried at childbirth.
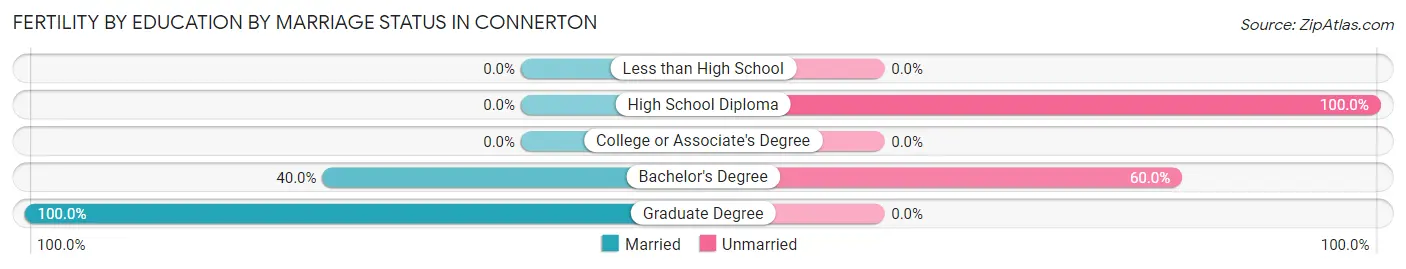
| Educational Attainment | Married | Unmarried |
| Less than High School | 0 (0.0%) | 0 (0.0%) |
| High School Diploma | 0 (0.0%) | 7 (100.0%) |
| College or Associate's Degree | 0 (0.0%) | 0 (0.0%) |
| Bachelor's Degree | 12 (40.0%) | 18 (60.0%) |
| Graduate Degree | 21 (100.0%) | 0 (0.0%) |
| Total | 33 (56.9%) | 25 (43.1%) |
Employment Characteristics in Connerton
Employment by Class of Employer in Connerton
Among the 2,229 employed individuals in Connerton, private company employees (1,610 | 72.2%), local government employees (316 | 14.2%), and self-employed (not incorporated) (81 | 3.6%) make up the most common classes of employment.
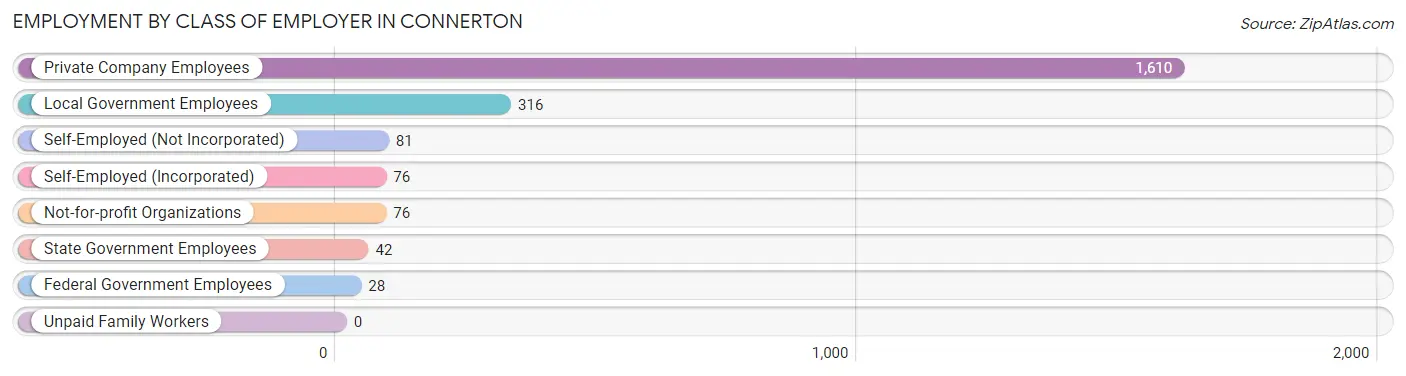
| Employer Class | # Employees | % Employees |
| Private Company Employees | 1,610 | 72.2% |
| Self-Employed (Incorporated) | 76 | 3.4% |
| Self-Employed (Not Incorporated) | 81 | 3.6% |
| Not-for-profit Organizations | 76 | 3.4% |
| Local Government Employees | 316 | 14.2% |
| State Government Employees | 42 | 1.9% |
| Federal Government Employees | 28 | 1.3% |
| Unpaid Family Workers | 0 | 0.0% |
| Total | 2,229 | 100.0% |
Employment Status by Age in Connerton
According to the labor force statistics for Connerton, out of the total population over 16 years of age (4,630), 50.5% or 2,338 individuals are in the labor force, with 4.4% or 103 of them unemployed. The age group with the highest labor force participation rate is 30 to 34 years, with 68.9% or 630 individuals in the labor force. Within the labor force, the 16 to 19 years age range has the highest percentage of unemployed individuals, with 43.4% or 92 of them being unemployed.
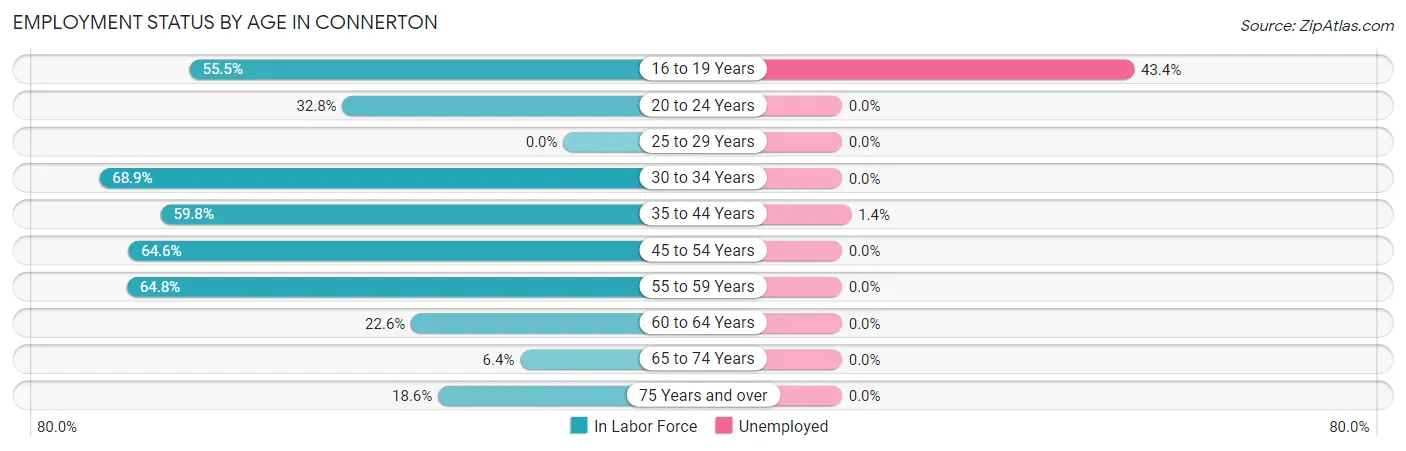
| Age Bracket | In Labor Force | Unemployed |
| 16 to 19 Years | 212 (55.5%) | 92 (43.4%) |
| 20 to 24 Years | 103 (32.8%) | 0 (0.0%) |
| 25 to 29 Years | 0 (0.0%) | 0 (0.0%) |
| 30 to 34 Years | 630 (68.9%) | 0 (0.0%) |
| 35 to 44 Years | 759 (59.8%) | 11 (1.4%) |
| 45 to 54 Years | 436 (64.6%) | 0 (0.0%) |
| 55 to 59 Years | 105 (64.8%) | 0 (0.0%) |
| 60 to 64 Years | 58 (22.6%) | 0 (0.0%) |
| 65 to 74 Years | 21 (6.4%) | 0 (0.0%) |
| 75 Years and over | 16 (18.6%) | 0 (0.0%) |
| Total | 2,338 (50.5%) | 103 (4.4%) |
Employment Status by Educational Attainment in Connerton
According to labor force statistics for Connerton, 56.5% of individuals (1,988) out of the total population between 25 and 64 years of age (3,518) are in the labor force, with 0.6% or 12 of them being unemployed. The group with the highest labor force participation rate are those with the educational attainment of bachelor's degree or higher, with 91.5% or 1,184 individuals in the labor force. Within the labor force, individuals with bachelor's degree or higher education have the highest percentage of unemployment, with 0.9% or 11 of them being unemployed.
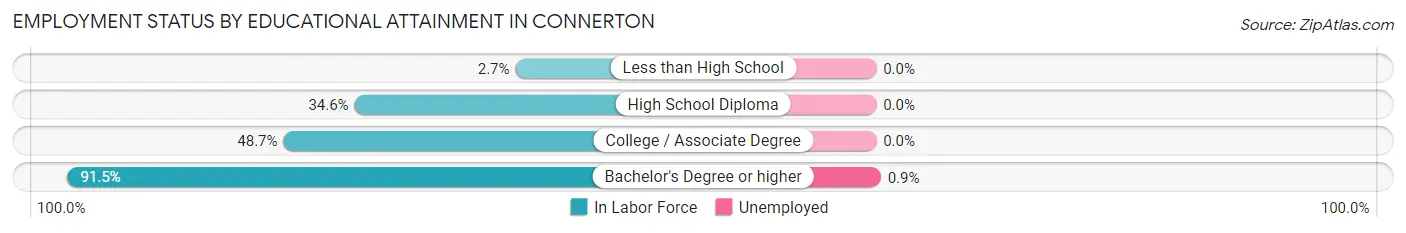
| Educational Attainment | In Labor Force | Unemployed |
| Less than High School | 9 (2.7%) | 0 (0.0%) |
| High School Diploma | 303 (34.6%) | 0 (0.0%) |
| College / Associate Degree | 492 (48.7%) | 0 (0.0%) |
| Bachelor's Degree or higher | 1,184 (91.5%) | 12 (0.9%) |
| Total | 1,988 (56.5%) | 21 (0.6%) |
Employment Occupations by Sex in Connerton
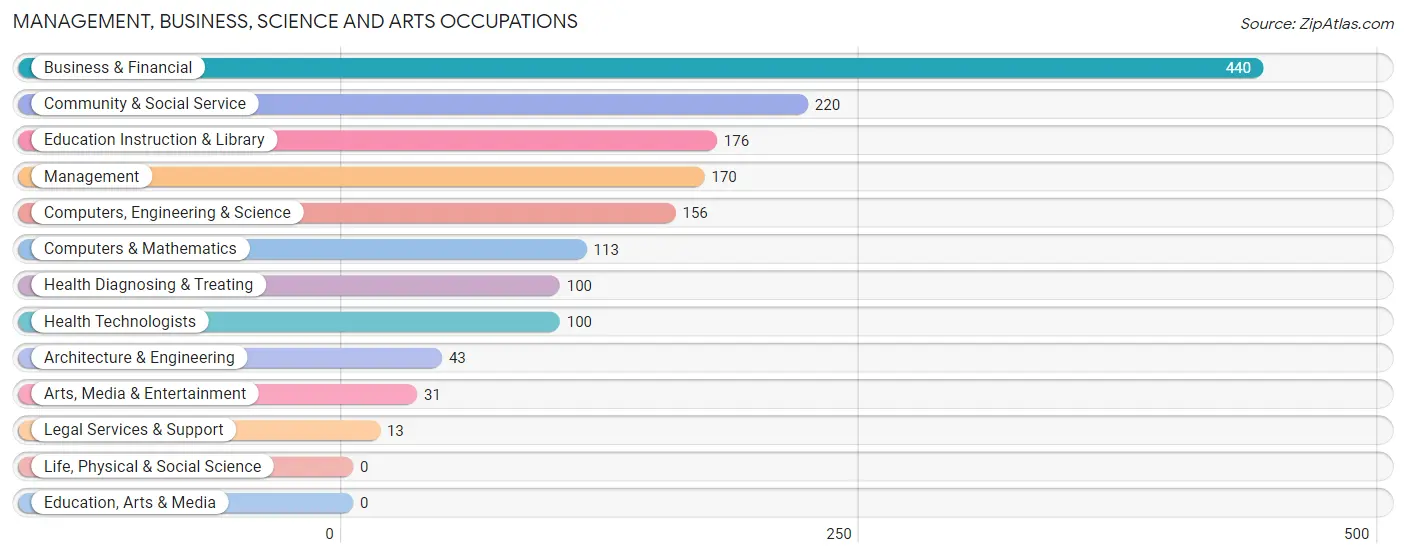
Management, Business, Science and Arts Occupations
The most common Management, Business, Science and Arts occupations in Connerton are Business & Financial (440 | 19.7%), Community & Social Service (220 | 9.8%), Education Instruction & Library (176 | 7.9%), Management (170 | 7.6%), and Computers, Engineering & Science (156 | 7.0%).
Management, Business, Science and Arts Occupations by Sex
Within the Management, Business, Science and Arts occupations in Connerton, the most male-oriented occupations are Computers, Engineering & Science (100.0%), Computers & Mathematics (100.0%), and Architecture & Engineering (100.0%), while the most female-oriented occupations are Legal Services & Support (100.0%), Arts, Media & Entertainment (100.0%), and Health Diagnosing & Treating (80.0%).

| Occupation | Male | Female |
| Management | 141 (82.9%) | 29 (17.1%) |
| Business & Financial | 383 (87.1%) | 57 (13.0%) |
| Computers, Engineering & Science | 156 (100.0%) | 0 (0.0%) |
| Computers & Mathematics | 113 (100.0%) | 0 (0.0%) |
| Architecture & Engineering | 43 (100.0%) | 0 (0.0%) |
| Life, Physical & Social Science | 0 (0.0%) | 0 (0.0%) |
| Community & Social Service | 63 (28.6%) | 157 (71.4%) |
| Education, Arts & Media | 0 (0.0%) | 0 (0.0%) |
| Legal Services & Support | 0 (0.0%) | 13 (100.0%) |
| Education Instruction & Library | 63 (35.8%) | 113 (64.2%) |
| Arts, Media & Entertainment | 0 (0.0%) | 31 (100.0%) |
| Health Diagnosing & Treating | 20 (20.0%) | 80 (80.0%) |
| Health Technologists | 20 (20.0%) | 80 (80.0%) |
| Total (Category) | 763 (70.3%) | 323 (29.7%) |
| Total (Overall) | 1,149 (51.4%) | 1,088 (48.6%) |
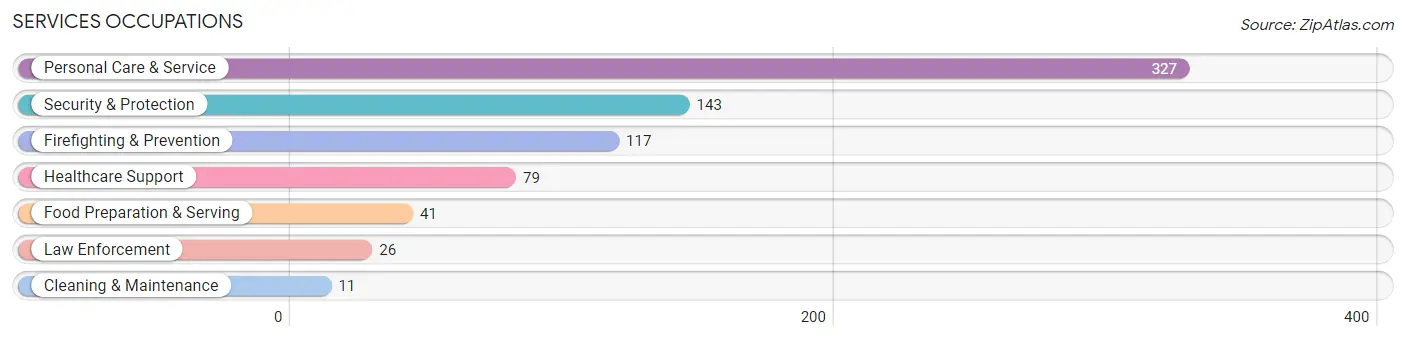
Services Occupations
The most common Services occupations in Connerton are Personal Care & Service (327 | 14.6%), Security & Protection (143 | 6.4%), Firefighting & Prevention (117 | 5.2%), Healthcare Support (79 | 3.5%), and Food Preparation & Serving (41 | 1.8%).
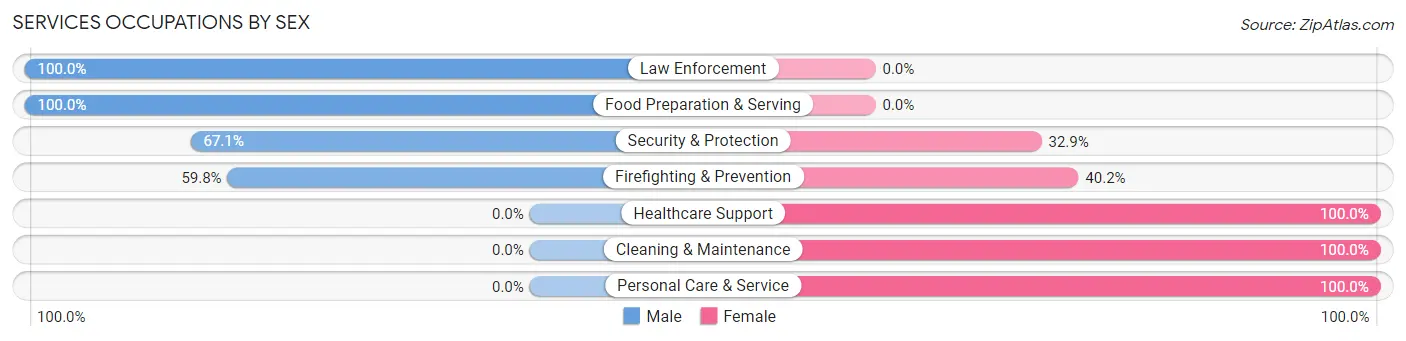
Services Occupations by Sex
Within the Services occupations in Connerton, the most male-oriented occupations are Law Enforcement (100.0%), Food Preparation & Serving (100.0%), and Security & Protection (67.1%), while the most female-oriented occupations are Healthcare Support (100.0%), Cleaning & Maintenance (100.0%), and Personal Care & Service (100.0%).
| Occupation | Male | Female |
| Healthcare Support | 0 (0.0%) | 79 (100.0%) |
| Security & Protection | 96 (67.1%) | 47 (32.9%) |
| Firefighting & Prevention | 70 (59.8%) | 47 (40.2%) |
| Law Enforcement | 26 (100.0%) | 0 (0.0%) |
| Food Preparation & Serving | 41 (100.0%) | 0 (0.0%) |
| Cleaning & Maintenance | 0 (0.0%) | 11 (100.0%) |
| Personal Care & Service | 0 (0.0%) | 327 (100.0%) |
| Total (Category) | 137 (22.8%) | 464 (77.2%) |
| Total (Overall) | 1,149 (51.4%) | 1,088 (48.6%) |
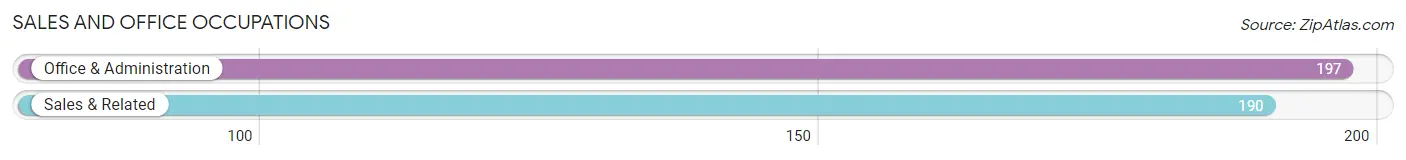
Sales and Office Occupations
The most common Sales and Office occupations in Connerton are Office & Administration (197 | 8.8%), and Sales & Related (190 | 8.5%).
Sales and Office Occupations by Sex
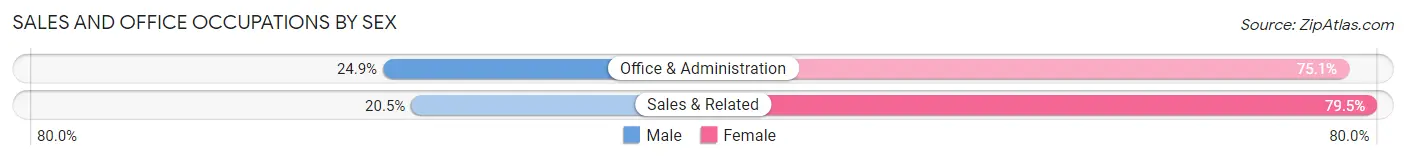
| Occupation | Male | Female |
| Sales & Related | 39 (20.5%) | 151 (79.5%) |
| Office & Administration | 49 (24.9%) | 148 (75.1%) |
| Total (Category) | 88 (22.7%) | 299 (77.3%) |
| Total (Overall) | 1,149 (51.4%) | 1,088 (48.6%) |
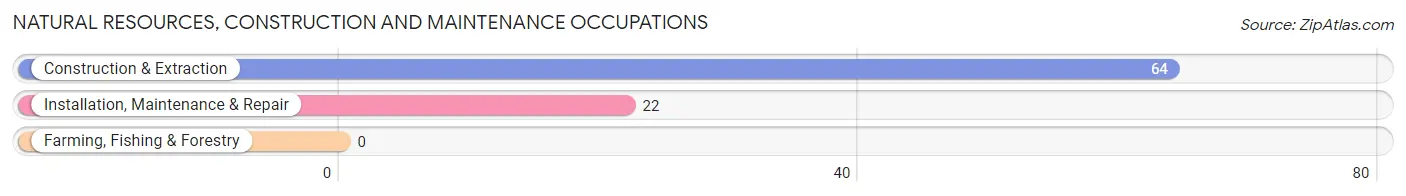
Natural Resources, Construction and Maintenance Occupations
The most common Natural Resources, Construction and Maintenance occupations in Connerton are Construction & Extraction (64 | 2.9%), and Installation, Maintenance & Repair (22 | 1.0%).
Natural Resources, Construction and Maintenance Occupations by Sex
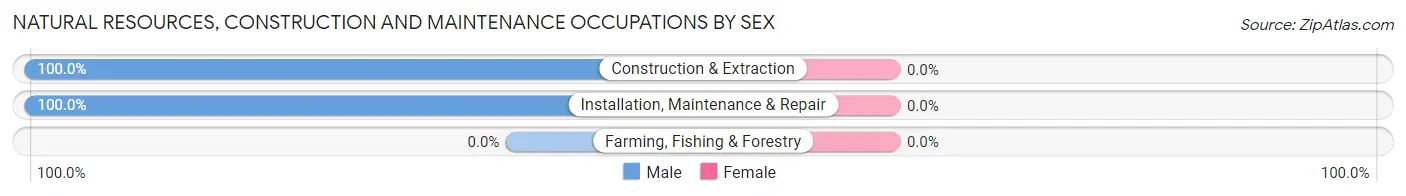
| Occupation | Male | Female |
| Farming, Fishing & Forestry | 0 (0.0%) | 0 (0.0%) |
| Construction & Extraction | 64 (100.0%) | 0 (0.0%) |
| Installation, Maintenance & Repair | 22 (100.0%) | 0 (0.0%) |
| Total (Category) | 86 (100.0%) | 0 (0.0%) |
| Total (Overall) | 1,149 (51.4%) | 1,088 (48.6%) |
Production, Transportation and Moving Occupations
The most common Production, Transportation and Moving occupations in Connerton are Production (55 | 2.5%), Transportation (12 | 0.5%), and Material Moving (10 | 0.4%).
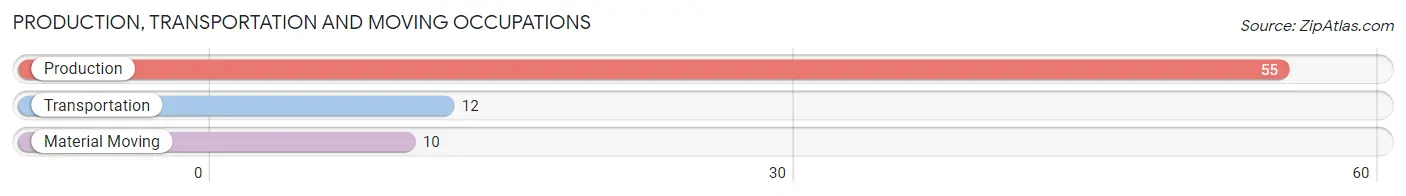
Production, Transportation and Moving Occupations by Sex
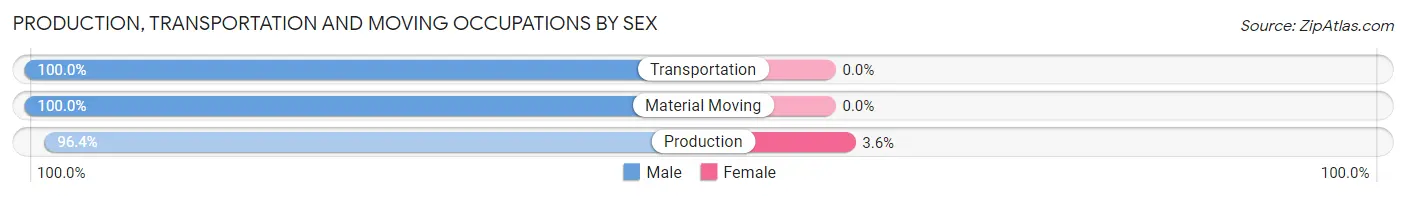
| Occupation | Male | Female |
| Production | 53 (96.4%) | 2 (3.6%) |
| Transportation | 12 (100.0%) | 0 (0.0%) |
| Material Moving | 10 (100.0%) | 0 (0.0%) |
| Total (Category) | 75 (97.4%) | 2 (2.6%) |
| Total (Overall) | 1,149 (51.4%) | 1,088 (48.6%) |
Employment Industries by Sex in Connerton
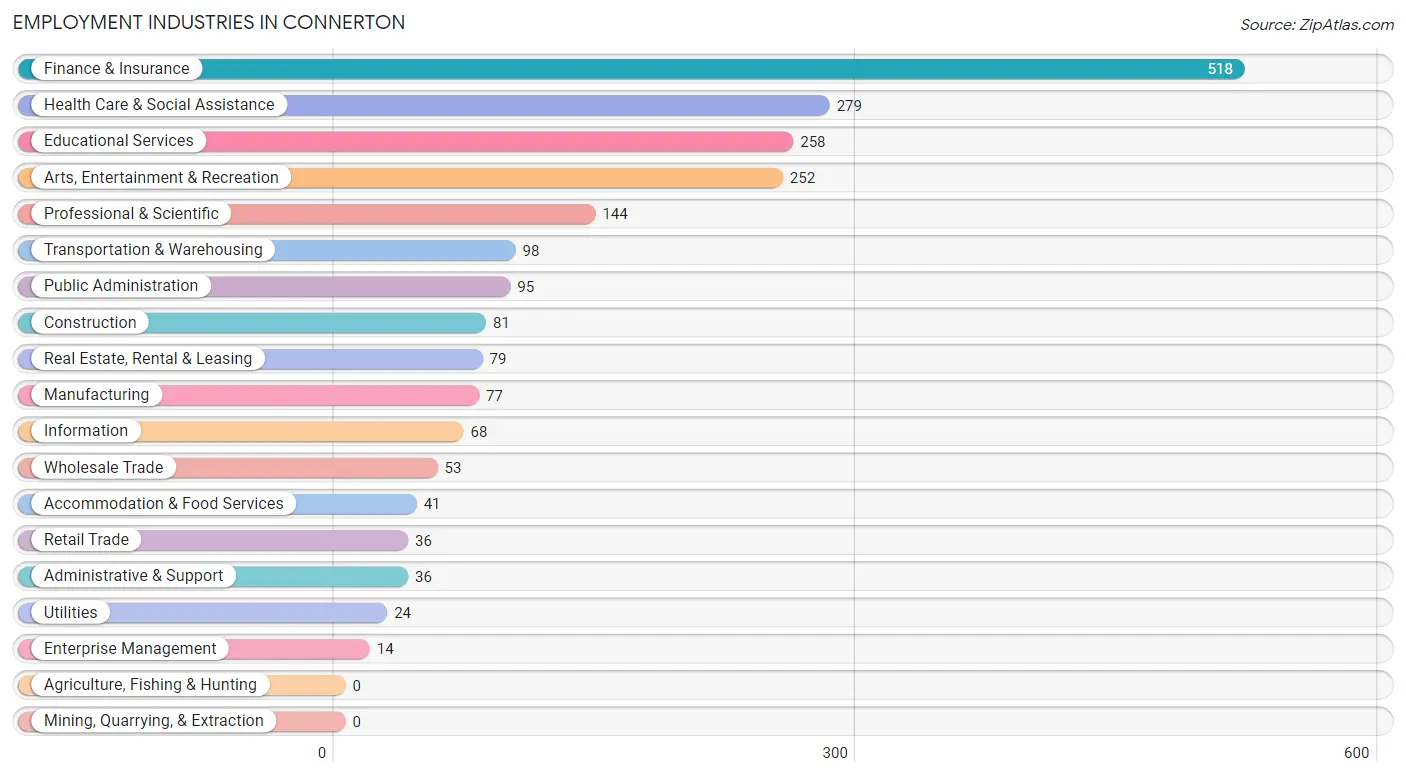
Employment Industries in Connerton
The major employment industries in Connerton include Finance & Insurance (518 | 23.2%), Health Care & Social Assistance (279 | 12.5%), Educational Services (258 | 11.5%), Arts, Entertainment & Recreation (252 | 11.3%), and Professional & Scientific (144 | 6.4%).
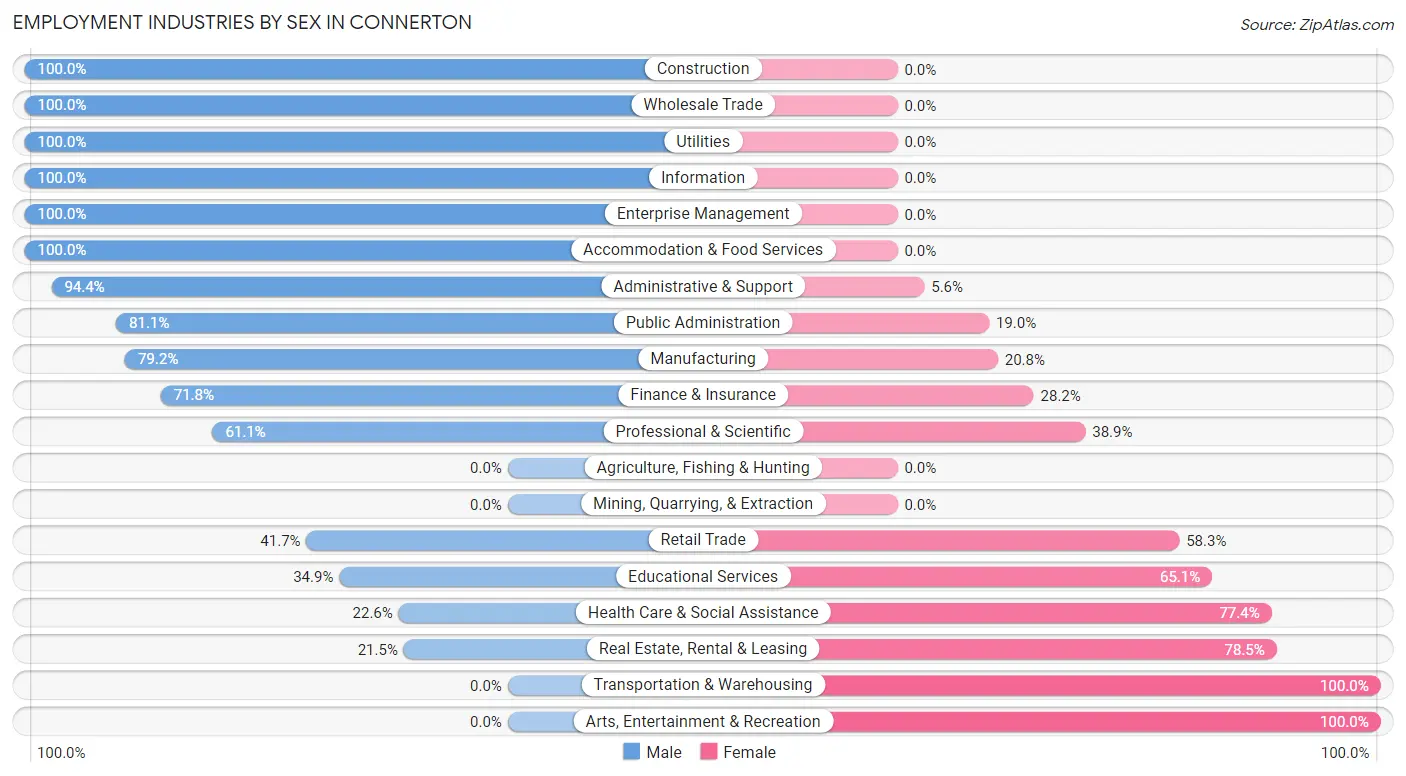
Employment Industries by Sex in Connerton
The Connerton industries that see more men than women are Construction (100.0%), Wholesale Trade (100.0%), and Utilities (100.0%), whereas the industries that tend to have a higher number of women are Transportation & Warehousing (100.0%), Arts, Entertainment & Recreation (100.0%), and Real Estate, Rental & Leasing (78.5%).
| Industry | Male | Female |
| Agriculture, Fishing & Hunting | 0 (0.0%) | 0 (0.0%) |
| Mining, Quarrying, & Extraction | 0 (0.0%) | 0 (0.0%) |
| Construction | 81 (100.0%) | 0 (0.0%) |
| Manufacturing | 61 (79.2%) | 16 (20.8%) |
| Wholesale Trade | 53 (100.0%) | 0 (0.0%) |
| Retail Trade | 15 (41.7%) | 21 (58.3%) |
| Transportation & Warehousing | 0 (0.0%) | 98 (100.0%) |
| Utilities | 24 (100.0%) | 0 (0.0%) |
| Information | 68 (100.0%) | 0 (0.0%) |
| Finance & Insurance | 372 (71.8%) | 146 (28.2%) |
| Real Estate, Rental & Leasing | 17 (21.5%) | 62 (78.5%) |
| Professional & Scientific | 88 (61.1%) | 56 (38.9%) |
| Enterprise Management | 14 (100.0%) | 0 (0.0%) |
| Administrative & Support | 34 (94.4%) | 2 (5.6%) |
| Educational Services | 90 (34.9%) | 168 (65.1%) |
| Health Care & Social Assistance | 63 (22.6%) | 216 (77.4%) |
| Arts, Entertainment & Recreation | 0 (0.0%) | 252 (100.0%) |
| Accommodation & Food Services | 41 (100.0%) | 0 (0.0%) |
| Public Administration | 77 (81.0%) | 18 (19.0%) |
| Total | 1,149 (51.4%) | 1,088 (48.6%) |
Education in Connerton
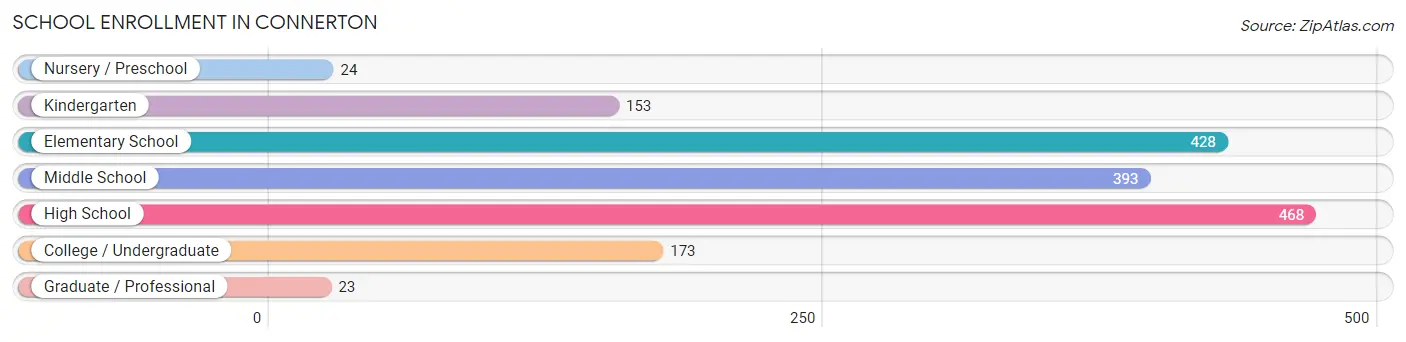
School Enrollment in Connerton
The most common levels of schooling among the 1,662 students in Connerton are high school (468 | 28.2%), elementary school (428 | 25.8%), and middle school (393 | 23.6%).
| School Level | # Students | % Students |
| Nursery / Preschool | 24 | 1.4% |
| Kindergarten | 153 | 9.2% |
| Elementary School | 428 | 25.8% |
| Middle School | 393 | 23.6% |
| High School | 468 | 28.2% |
| College / Undergraduate | 173 | 10.4% |
| Graduate / Professional | 23 | 1.4% |
| Total | 1,662 | 100.0% |
School Enrollment by Age by Funding Source in Connerton
Out of a total of 1,662 students who are enrolled in schools in Connerton, 346 (20.8%) attend a private institution, while the remaining 1,316 (79.2%) are enrolled in public schools. The age group of 3 to 4 year olds has the highest likelihood of being enrolled in private schools, with 24 (100.0% in the age bracket) enrolled. Conversely, the age group of 15 to 17 year olds has the lowest likelihood of being enrolled in a private school, with 399 (100.0% in the age bracket) attending a public institution.
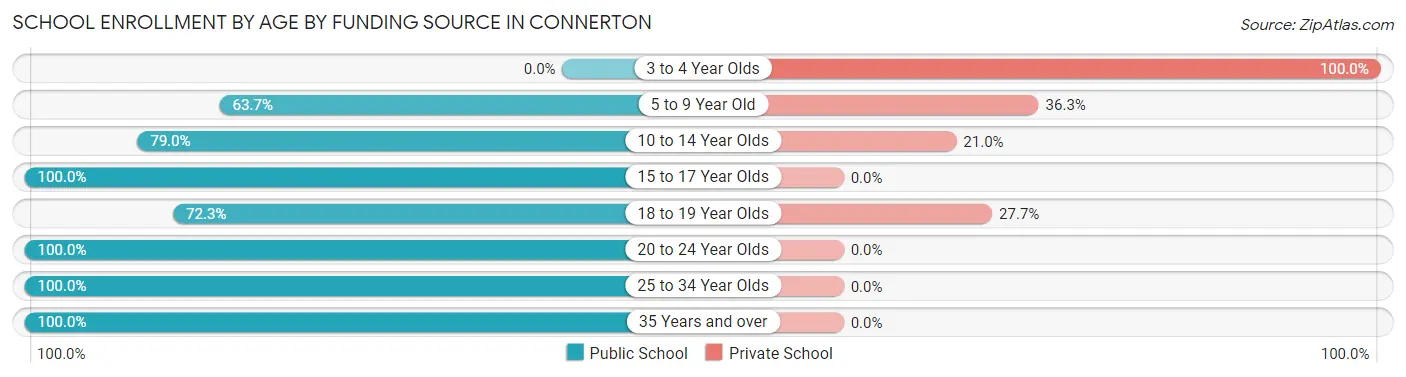
| Age Bracket | Public School | Private School |
| 3 to 4 Year Olds | 0 (0.0%) | 24 (100.0%) |
| 5 to 9 Year Old | 370 (63.7%) | 211 (36.3%) |
| 10 to 14 Year Olds | 365 (79.0%) | 97 (21.0%) |
| 15 to 17 Year Olds | 399 (100.0%) | 0 (0.0%) |
| 18 to 19 Year Olds | 34 (72.3%) | 13 (27.7%) |
| 20 to 24 Year Olds | 43 (100.0%) | 0 (0.0%) |
| 25 to 34 Year Olds | 14 (100.0%) | 0 (0.0%) |
| 35 Years and over | 92 (100.0%) | 0 (0.0%) |
| Total | 1,316 (79.2%) | 346 (20.8%) |
Educational Attainment by Field of Study in Connerton
Business (493 | 31.2%), arts & humanities (288 | 18.2%), liberal arts & history (203 | 12.8%), science & technology (155 | 9.8%), and bio, nature & agricultural (99 | 6.3%) are the most common fields of study among 1,581 individuals in Connerton who have obtained a bachelor's degree or higher.
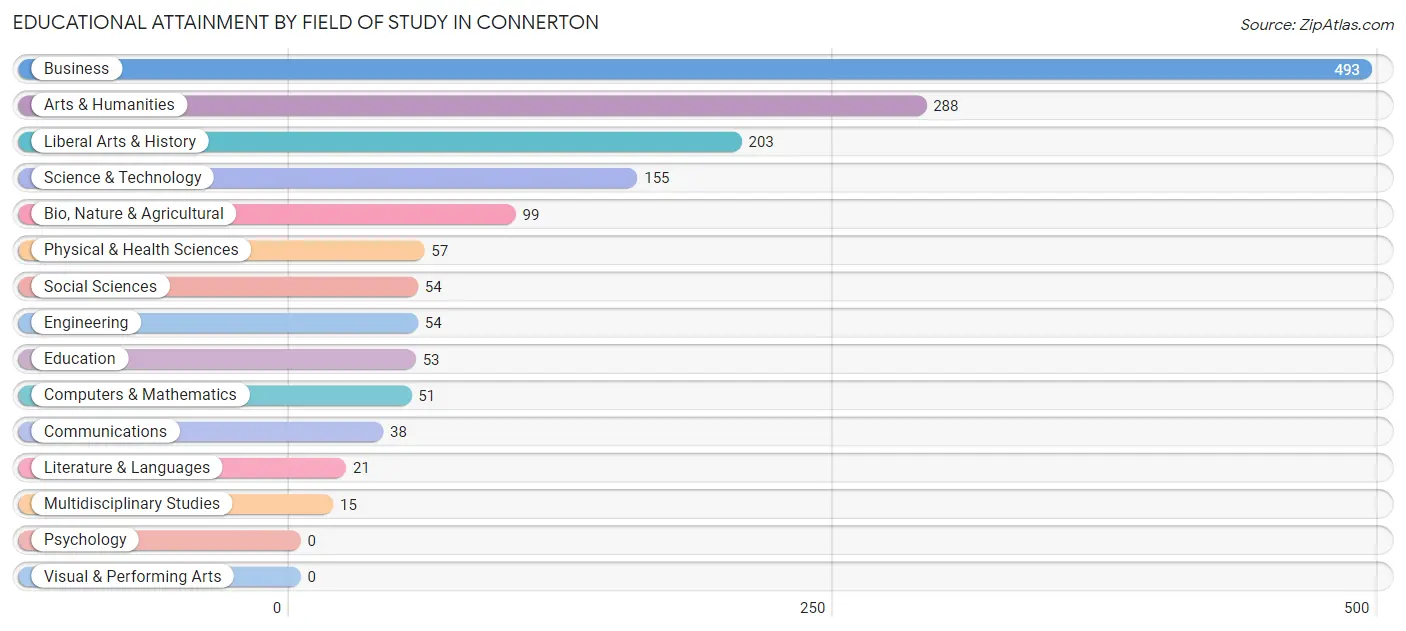
| Field of Study | # Graduates | % Graduates |
| Computers & Mathematics | 51 | 3.2% |
| Bio, Nature & Agricultural | 99 | 6.3% |
| Physical & Health Sciences | 57 | 3.6% |
| Psychology | 0 | 0.0% |
| Social Sciences | 54 | 3.4% |
| Engineering | 54 | 3.4% |
| Multidisciplinary Studies | 15 | 0.9% |
| Science & Technology | 155 | 9.8% |
| Business | 493 | 31.2% |
| Education | 53 | 3.4% |
| Literature & Languages | 21 | 1.3% |
| Liberal Arts & History | 203 | 12.8% |
| Visual & Performing Arts | 0 | 0.0% |
| Communications | 38 | 2.4% |
| Arts & Humanities | 288 | 18.2% |
| Total | 1,581 | 100.0% |
Transportation & Commute in Connerton
Vehicle Availability by Sex in Connerton
The most prevalent vehicle ownership categories in Connerton are males with 2 vehicles (659, accounting for 57.4%) and females with 2 vehicles (562, making up 61.0%).
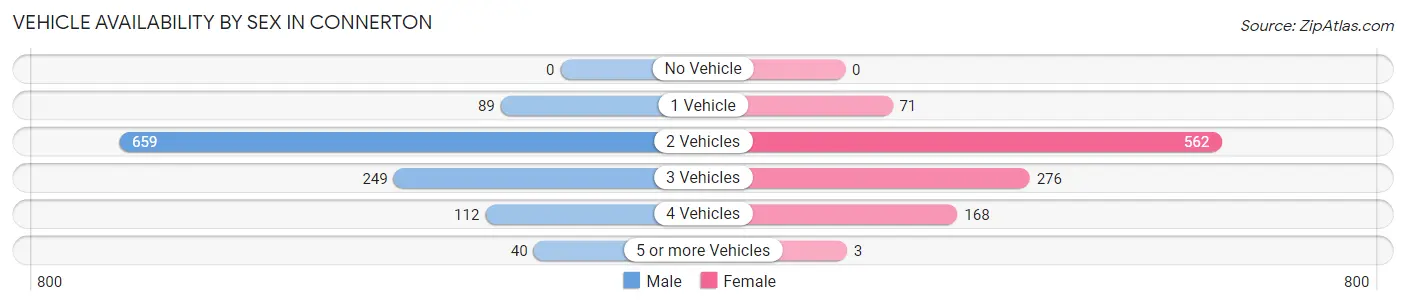
| Vehicles Available | Male | Female |
| No Vehicle | 0 (0.0%) | 0 (0.0%) |
| 1 Vehicle | 89 (7.7%) | 71 (6.6%) |
| 2 Vehicles | 659 (57.4%) | 562 (52.0%) |
| 3 Vehicles | 249 (21.7%) | 276 (25.6%) |
| 4 Vehicles | 112 (9.8%) | 168 (15.6%) |
| 5 or more Vehicles | 40 (3.5%) | 3 (0.3%) |
| Total | 1,149 (100.0%) | 1,080 (100.0%) |
Commute Time in Connerton
The most frequently occuring commute durations in Connerton are 30 to 34 minutes (396 commuters, 21.5%), 5 to 9 minutes (286 commuters, 15.6%), and 40 to 44 minutes (198 commuters, 10.8%).

| Commute Time | # Commuters | % Commuters |
| Less than 5 Minutes | 47 | 2.6% |
| 5 to 9 Minutes | 286 | 15.6% |
| 10 to 14 Minutes | 74 | 4.0% |
| 15 to 19 Minutes | 41 | 2.2% |
| 20 to 24 Minutes | 179 | 9.7% |
| 25 to 29 Minutes | 69 | 3.7% |
| 30 to 34 Minutes | 396 | 21.5% |
| 35 to 39 Minutes | 181 | 9.9% |
| 40 to 44 Minutes | 198 | 10.8% |
| 45 to 59 Minutes | 137 | 7.4% |
| 60 to 89 Minutes | 132 | 7.2% |
| 90 or more Minutes | 98 | 5.3% |
Commute Time by Sex in Connerton
The most common commute times in Connerton are 5 to 9 minutes (220 commuters, 23.6%) for males and 30 to 34 minutes (267 commuters, 29.5%) for females.
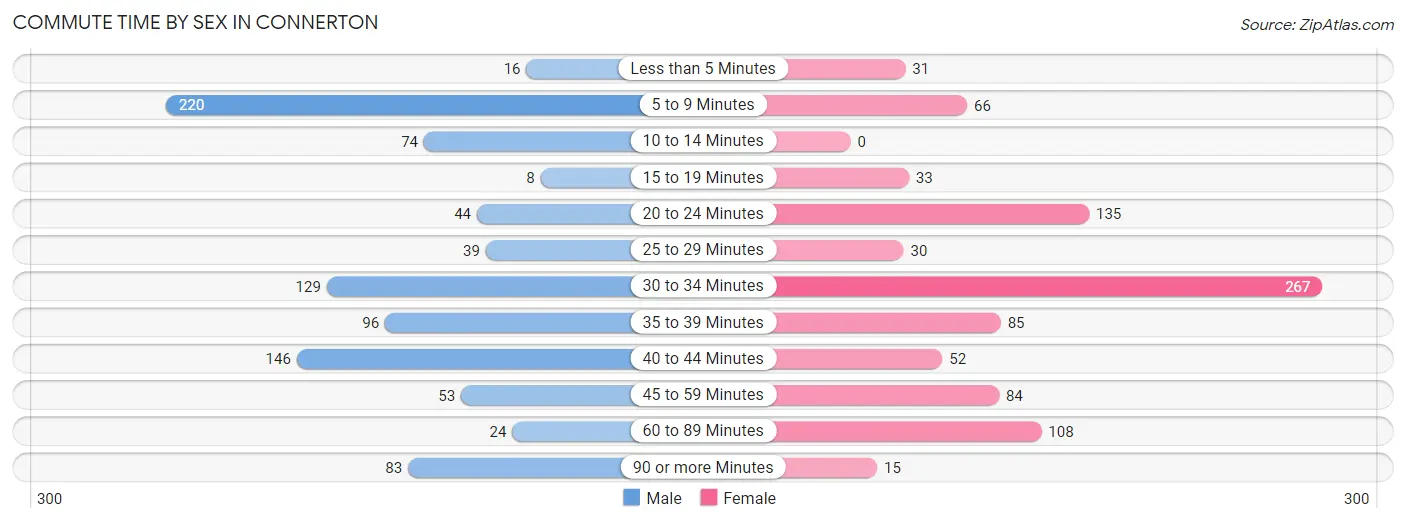
| Commute Time | Male | Female |
| Less than 5 Minutes | 16 (1.7%) | 31 (3.4%) |
| 5 to 9 Minutes | 220 (23.6%) | 66 (7.3%) |
| 10 to 14 Minutes | 74 (7.9%) | 0 (0.0%) |
| 15 to 19 Minutes | 8 (0.9%) | 33 (3.6%) |
| 20 to 24 Minutes | 44 (4.7%) | 135 (14.9%) |
| 25 to 29 Minutes | 39 (4.2%) | 30 (3.3%) |
| 30 to 34 Minutes | 129 (13.8%) | 267 (29.5%) |
| 35 to 39 Minutes | 96 (10.3%) | 85 (9.4%) |
| 40 to 44 Minutes | 146 (15.7%) | 52 (5.7%) |
| 45 to 59 Minutes | 53 (5.7%) | 84 (9.3%) |
| 60 to 89 Minutes | 24 (2.6%) | 108 (11.9%) |
| 90 or more Minutes | 83 (8.9%) | 15 (1.7%) |
Time of Departure to Work by Sex in Connerton
The most frequent times of departure to work in Connerton are 8:00 AM to 8:29 AM (320, 34.3%) for males and 4:00 PM to 11:59 PM (252, 27.8%) for females.
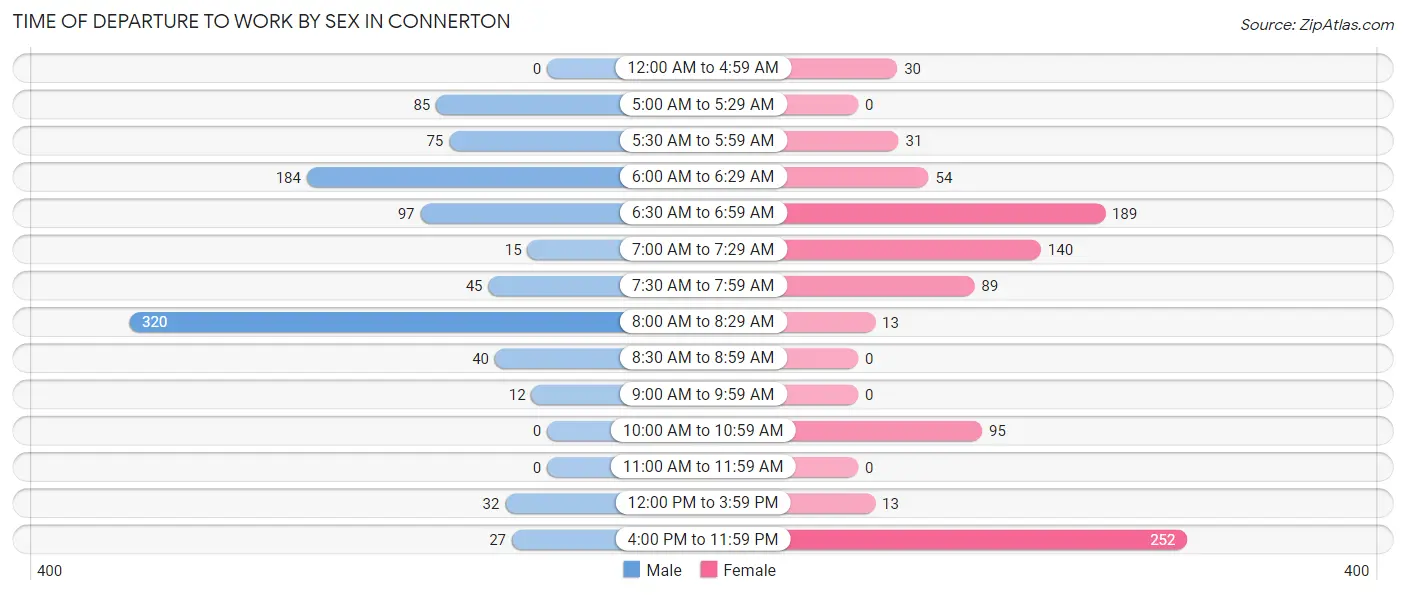
| Time of Departure | Male | Female |
| 12:00 AM to 4:59 AM | 0 (0.0%) | 30 (3.3%) |
| 5:00 AM to 5:29 AM | 85 (9.1%) | 0 (0.0%) |
| 5:30 AM to 5:59 AM | 75 (8.1%) | 31 (3.4%) |
| 6:00 AM to 6:29 AM | 184 (19.7%) | 54 (6.0%) |
| 6:30 AM to 6:59 AM | 97 (10.4%) | 189 (20.9%) |
| 7:00 AM to 7:29 AM | 15 (1.6%) | 140 (15.4%) |
| 7:30 AM to 7:59 AM | 45 (4.8%) | 89 (9.8%) |
| 8:00 AM to 8:29 AM | 320 (34.3%) | 13 (1.4%) |
| 8:30 AM to 8:59 AM | 40 (4.3%) | 0 (0.0%) |
| 9:00 AM to 9:59 AM | 12 (1.3%) | 0 (0.0%) |
| 10:00 AM to 10:59 AM | 0 (0.0%) | 95 (10.5%) |
| 11:00 AM to 11:59 AM | 0 (0.0%) | 0 (0.0%) |
| 12:00 PM to 3:59 PM | 32 (3.4%) | 13 (1.4%) |
| 4:00 PM to 11:59 PM | 27 (2.9%) | 252 (27.8%) |
| Total | 932 (100.0%) | 906 (100.0%) |
Housing Occupancy in Connerton
Occupancy by Ownership in Connerton
Of the total 1,442 dwellings in Connerton, owner-occupied units account for 1,427 (99.0%), while renter-occupied units make up 15 (1.0%).
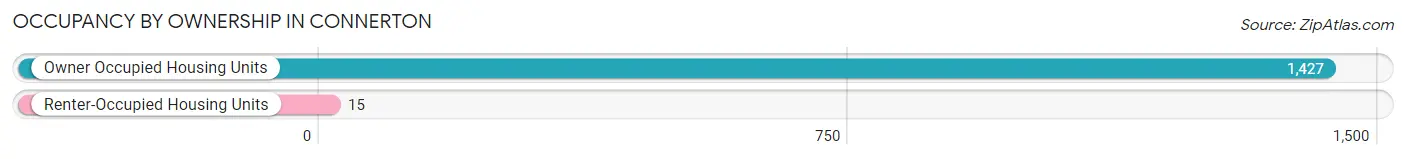
| Occupancy | # Housing Units | % Housing Units |
| Owner Occupied Housing Units | 1,427 | 99.0% |
| Renter-Occupied Housing Units | 15 | 1.0% |
| Total Occupied Housing Units | 1,442 | 100.0% |
Occupancy by Household Size in Connerton
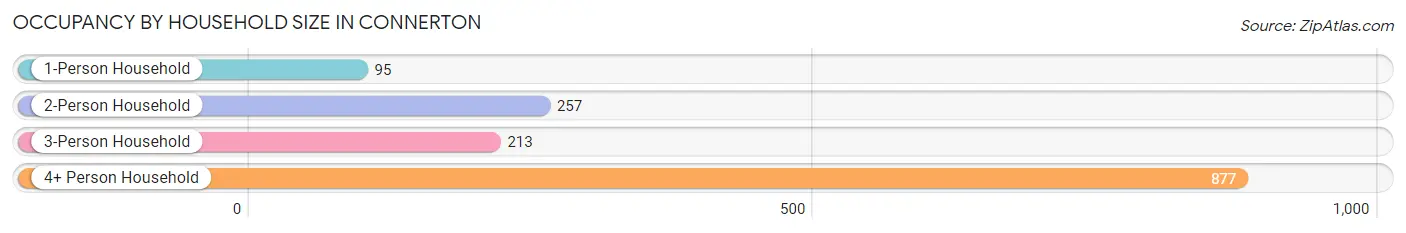
| Household Size | # Housing Units | % Housing Units |
| 1-Person Household | 95 | 6.6% |
| 2-Person Household | 257 | 17.8% |
| 3-Person Household | 213 | 14.8% |
| 4+ Person Household | 877 | 60.8% |
| Total Housing Units | 1,442 | 100.0% |
Occupancy by Ownership by Household Size in Connerton
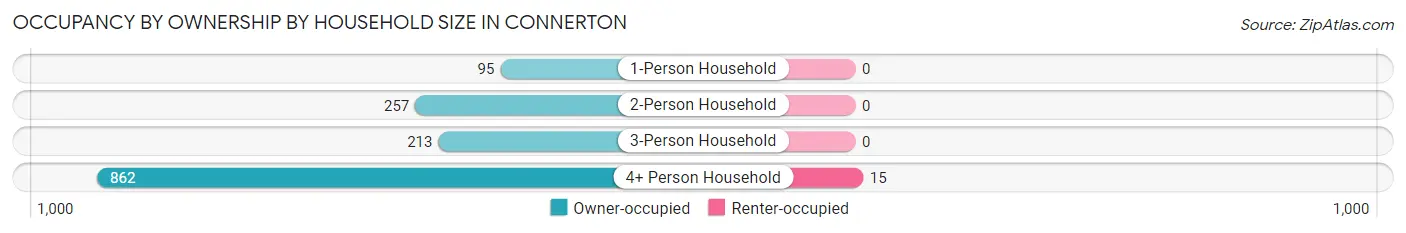
| Household Size | Owner-occupied | Renter-occupied |
| 1-Person Household | 95 (100.0%) | 0 (0.0%) |
| 2-Person Household | 257 (100.0%) | 0 (0.0%) |
| 3-Person Household | 213 (100.0%) | 0 (0.0%) |
| 4+ Person Household | 862 (98.3%) | 15 (1.7%) |
| Total Housing Units | 1,427 (99.0%) | 15 (1.0%) |
Occupancy by Educational Attainment in Connerton
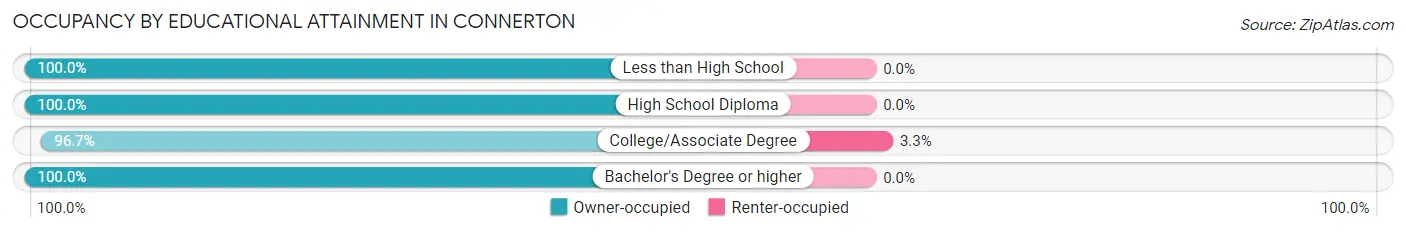
| Household Size | Owner-occupied | Renter-occupied |
| Less than High School | 25 (100.0%) | 0 (0.0%) |
| High School Diploma | 143 (100.0%) | 0 (0.0%) |
| College/Associate Degree | 436 (96.7%) | 15 (3.3%) |
| Bachelor's Degree or higher | 823 (100.0%) | 0 (0.0%) |
Occupancy by Age of Householder in Connerton
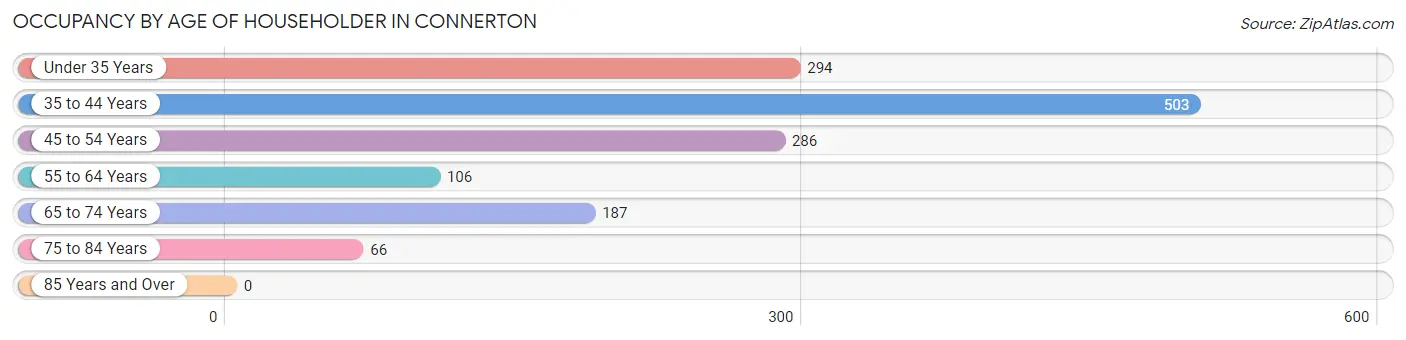
| Age Bracket | # Households | % Households |
| Under 35 Years | 294 | 20.4% |
| 35 to 44 Years | 503 | 34.9% |
| 45 to 54 Years | 286 | 19.8% |
| 55 to 64 Years | 106 | 7.3% |
| 65 to 74 Years | 187 | 13.0% |
| 75 to 84 Years | 66 | 4.6% |
| 85 Years and Over | 0 | 0.0% |
| Total | 1,442 | 100.0% |
Housing Finances in Connerton
Median Income by Occupancy in Connerton
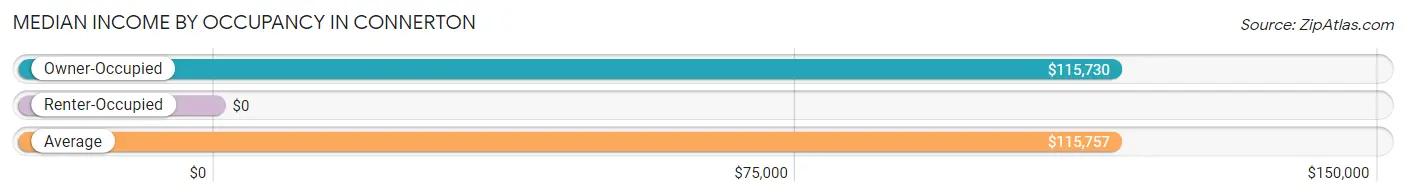
| Occupancy Type | # Households | Median Income |
| Owner-Occupied | 1,427 (99.0%) | $115,730 |
| Renter-Occupied | 15 (1.0%) | $0 |
| Average | 1,442 (100.0%) | $115,757 |
Occupancy by Householder Income Bracket in Connerton
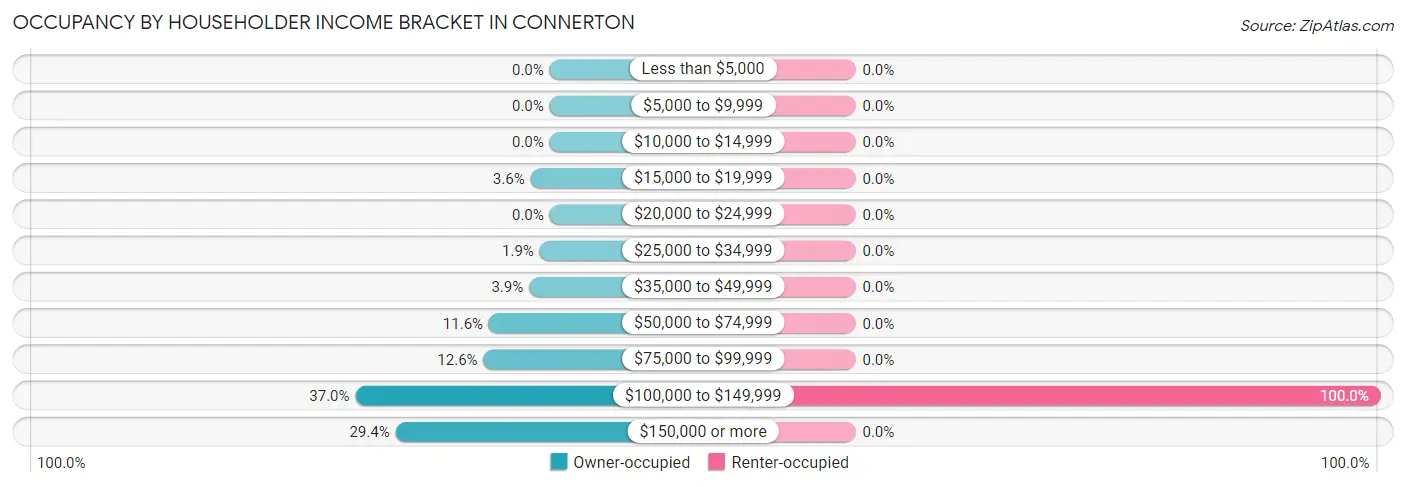
| Income Bracket | Owner-occupied | Renter-occupied |
| Less than $5,000 | 0 (0.0%) | 0 (0.0%) |
| $5,000 to $9,999 | 0 (0.0%) | 0 (0.0%) |
| $10,000 to $14,999 | 0 (0.0%) | 0 (0.0%) |
| $15,000 to $19,999 | 52 (3.6%) | 0 (0.0%) |
| $20,000 to $24,999 | 0 (0.0%) | 0 (0.0%) |
| $25,000 to $34,999 | 27 (1.9%) | 0 (0.0%) |
| $35,000 to $49,999 | 56 (3.9%) | 0 (0.0%) |
| $50,000 to $74,999 | 165 (11.6%) | 0 (0.0%) |
| $75,000 to $99,999 | 180 (12.6%) | 0 (0.0%) |
| $100,000 to $149,999 | 528 (37.0%) | 15 (100.0%) |
| $150,000 or more | 419 (29.4%) | 0 (0.0%) |
| Total | 1,427 (100.0%) | 15 (100.0%) |
Monthly Housing Cost Tiers in Connerton
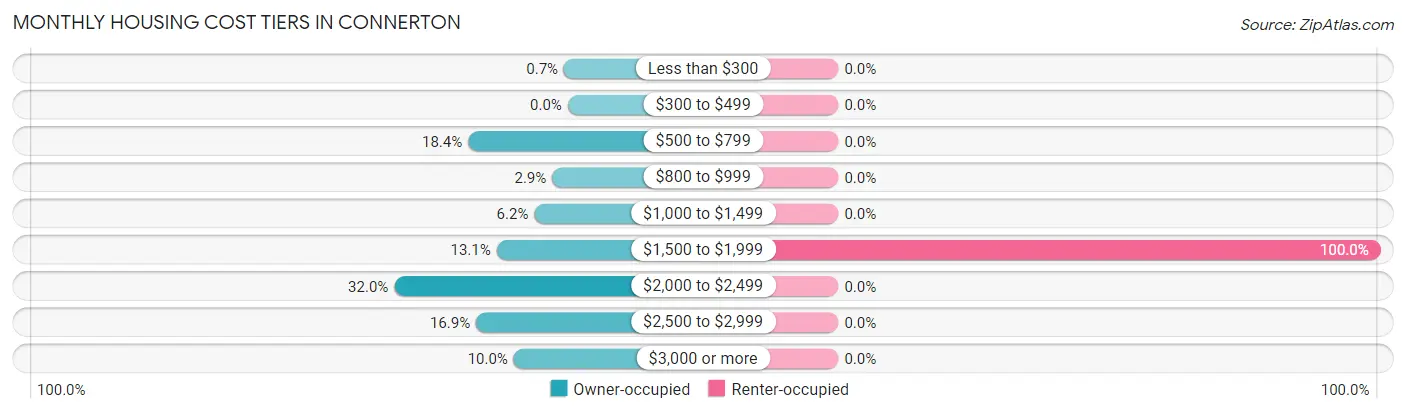
| Monthly Cost | Owner-occupied | Renter-occupied |
| Less than $300 | 10 (0.7%) | 0 (0.0%) |
| $300 to $499 | 0 (0.0%) | 0 (0.0%) |
| $500 to $799 | 262 (18.4%) | 0 (0.0%) |
| $800 to $999 | 41 (2.9%) | 0 (0.0%) |
| $1,000 to $1,499 | 88 (6.2%) | 0 (0.0%) |
| $1,500 to $1,999 | 187 (13.1%) | 15 (100.0%) |
| $2,000 to $2,499 | 456 (32.0%) | 0 (0.0%) |
| $2,500 to $2,999 | 241 (16.9%) | 0 (0.0%) |
| $3,000 or more | 142 (10.0%) | 0 (0.0%) |
| Total | 1,427 (100.0%) | 15 (100.0%) |
Physical Housing Characteristics in Connerton
Housing Structures in Connerton
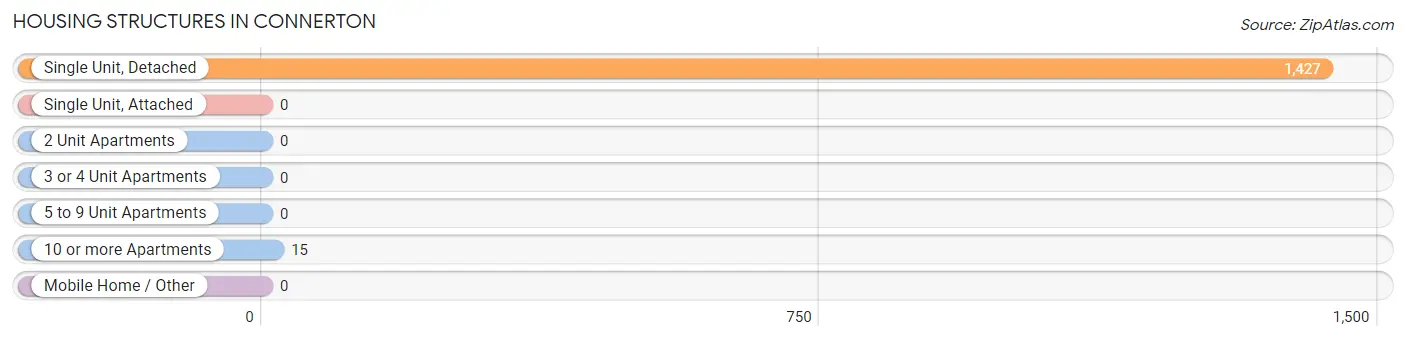
| Structure Type | # Housing Units | % Housing Units |
| Single Unit, Detached | 1,427 | 99.0% |
| Single Unit, Attached | 0 | 0.0% |
| 2 Unit Apartments | 0 | 0.0% |
| 3 or 4 Unit Apartments | 0 | 0.0% |
| 5 to 9 Unit Apartments | 0 | 0.0% |
| 10 or more Apartments | 15 | 1.0% |
| Mobile Home / Other | 0 | 0.0% |
| Total | 1,442 | 100.0% |
Housing Structures by Occupancy in Connerton
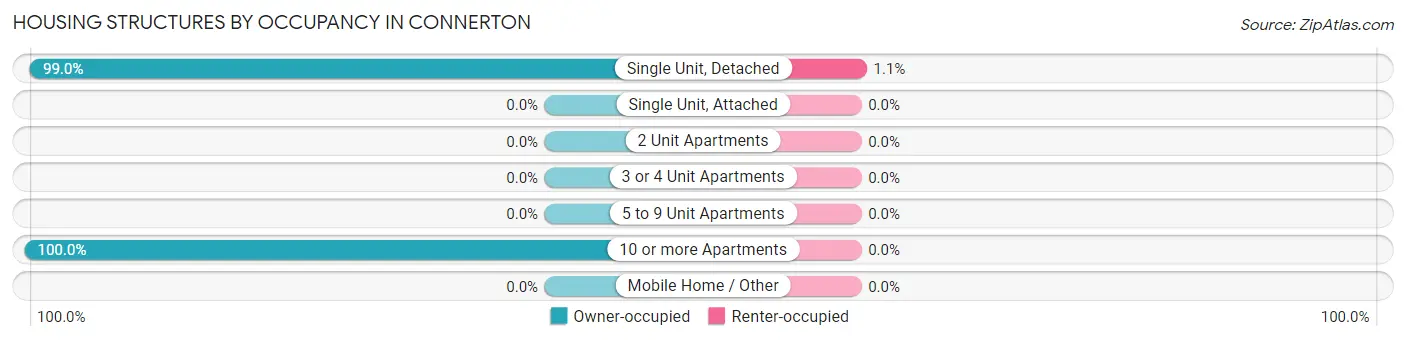
| Structure Type | Owner-occupied | Renter-occupied |
| Single Unit, Detached | 1,412 (99.0%) | 15 (1.1%) |
| Single Unit, Attached | 0 (0.0%) | 0 (0.0%) |
| 2 Unit Apartments | 0 (0.0%) | 0 (0.0%) |
| 3 or 4 Unit Apartments | 0 (0.0%) | 0 (0.0%) |
| 5 to 9 Unit Apartments | 0 (0.0%) | 0 (0.0%) |
| 10 or more Apartments | 15 (100.0%) | 0 (0.0%) |
| Mobile Home / Other | 0 (0.0%) | 0 (0.0%) |
| Total | 1,427 (99.0%) | 15 (1.0%) |
Housing Structures by Number of Rooms in Connerton
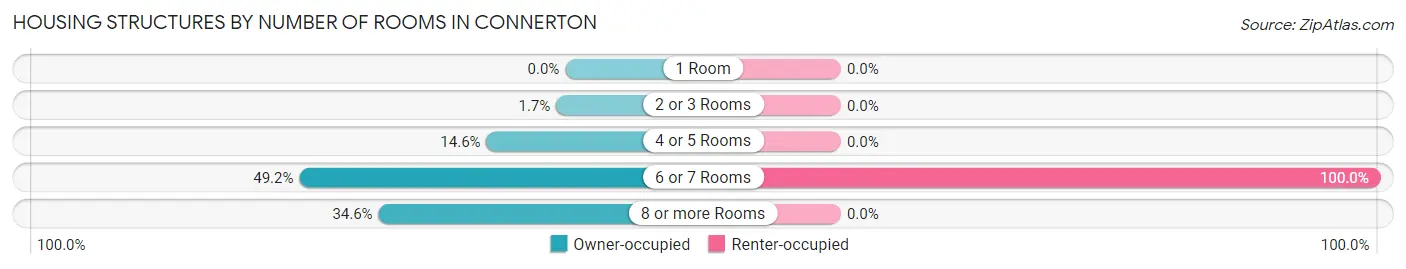
| Number of Rooms | Owner-occupied | Renter-occupied |
| 1 Room | 0 (0.0%) | 0 (0.0%) |
| 2 or 3 Rooms | 24 (1.7%) | 0 (0.0%) |
| 4 or 5 Rooms | 208 (14.6%) | 0 (0.0%) |
| 6 or 7 Rooms | 702 (49.2%) | 15 (100.0%) |
| 8 or more Rooms | 493 (34.5%) | 0 (0.0%) |
| Total | 1,427 (100.0%) | 15 (100.0%) |
Housing Structure by Heating Type in Connerton
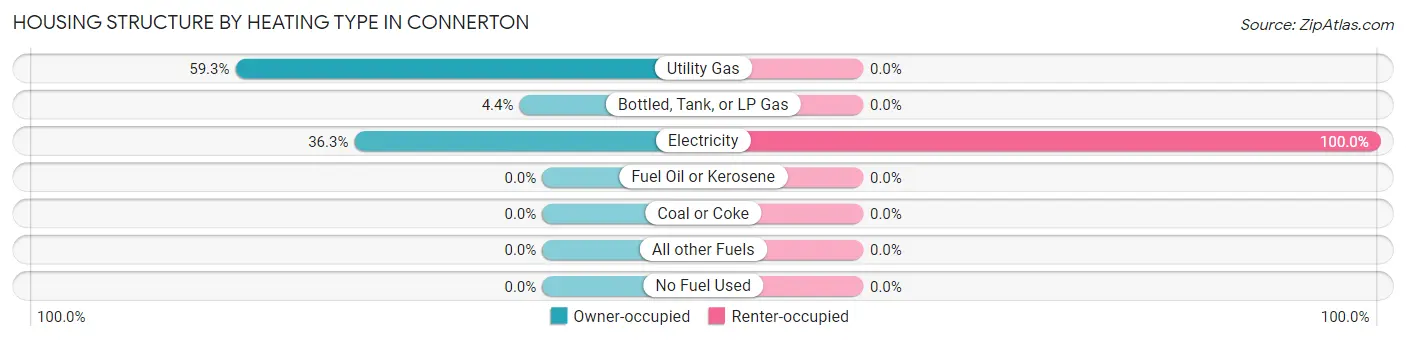
| Heating Type | Owner-occupied | Renter-occupied |
| Utility Gas | 846 (59.3%) | 0 (0.0%) |
| Bottled, Tank, or LP Gas | 63 (4.4%) | 0 (0.0%) |
| Electricity | 518 (36.3%) | 15 (100.0%) |
| Fuel Oil or Kerosene | 0 (0.0%) | 0 (0.0%) |
| Coal or Coke | 0 (0.0%) | 0 (0.0%) |
| All other Fuels | 0 (0.0%) | 0 (0.0%) |
| No Fuel Used | 0 (0.0%) | 0 (0.0%) |
| Total | 1,427 (100.0%) | 15 (100.0%) |
Household Vehicle Usage in Connerton
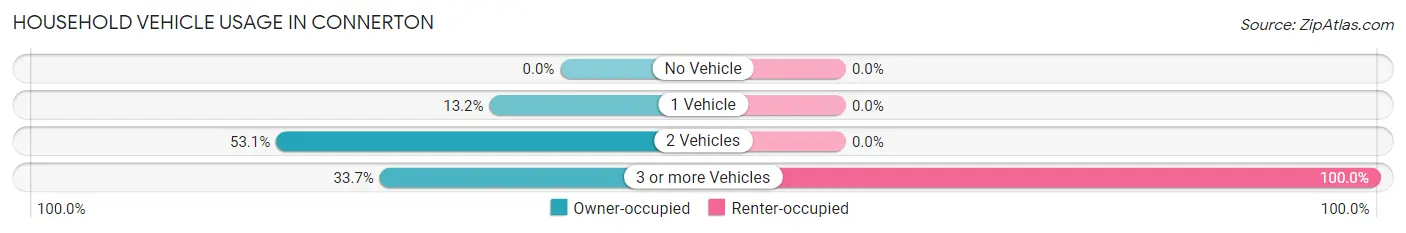
| Vehicles per Household | Owner-occupied | Renter-occupied |
| No Vehicle | 0 (0.0%) | 0 (0.0%) |
| 1 Vehicle | 189 (13.2%) | 0 (0.0%) |
| 2 Vehicles | 757 (53.0%) | 0 (0.0%) |
| 3 or more Vehicles | 481 (33.7%) | 15 (100.0%) |
| Total | 1,427 (100.0%) | 15 (100.0%) |
Real Estate & Mortgages in Connerton
Real Estate and Mortgage Overview in Connerton
| Characteristic | Without Mortgage | With Mortgage |
| Housing Units | 354 | 1,073 |
| Median Property Value | $362,400 | $430,600 |
| Median Household Income | $115,517 | $419 |
| Monthly Housing Costs | $663 | $142 |
| Real Estate Taxes | $5,809 | $57 |
Property Value by Mortgage Status in Connerton
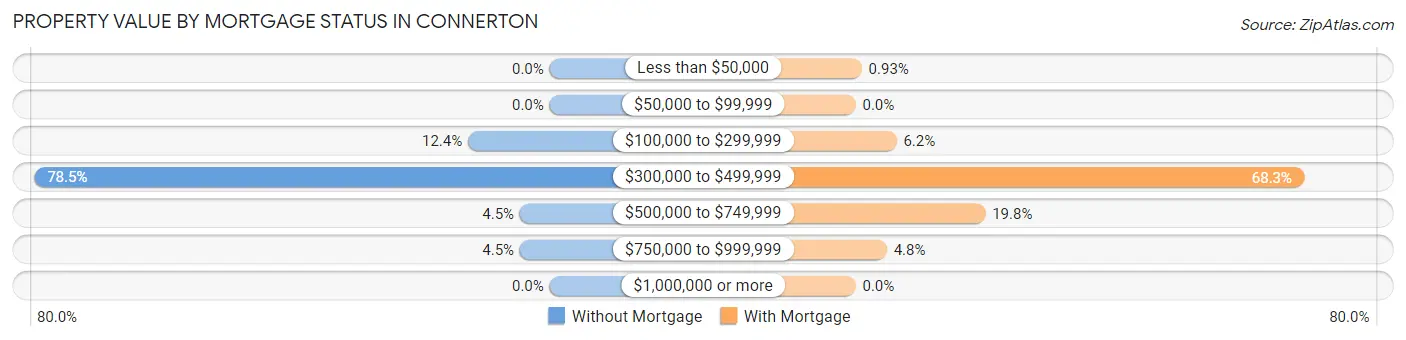
| Property Value | Without Mortgage | With Mortgage |
| Less than $50,000 | 0 (0.0%) | 10 (0.9%) |
| $50,000 to $99,999 | 0 (0.0%) | 0 (0.0%) |
| $100,000 to $299,999 | 44 (12.4%) | 67 (6.2%) |
| $300,000 to $499,999 | 278 (78.5%) | 733 (68.3%) |
| $500,000 to $749,999 | 16 (4.5%) | 212 (19.8%) |
| $750,000 to $999,999 | 16 (4.5%) | 51 (4.8%) |
| $1,000,000 or more | 0 (0.0%) | 0 (0.0%) |
| Total | 354 (100.0%) | 1,073 (100.0%) |
Household Income by Mortgage Status in Connerton
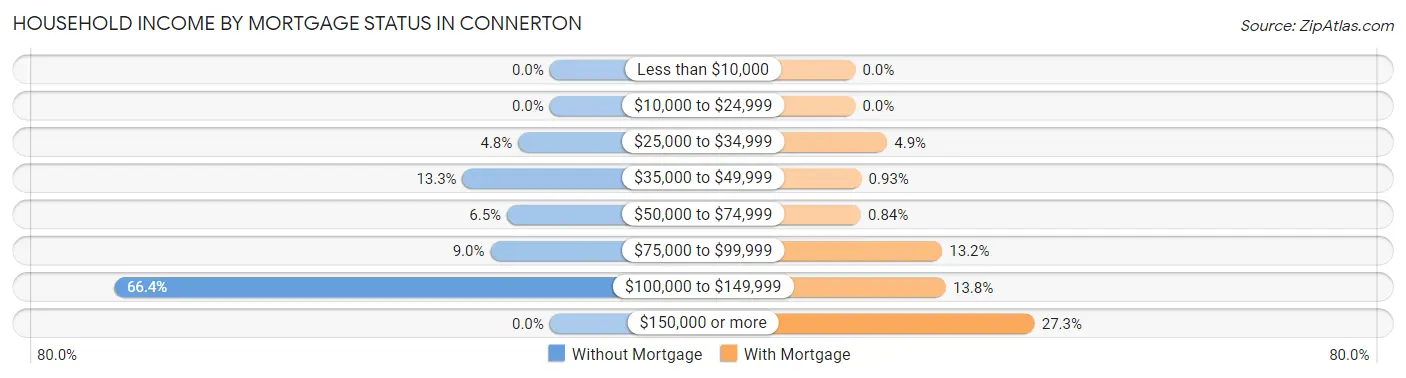
| Household Income | Without Mortgage | With Mortgage |
| Less than $10,000 | 0 (0.0%) | 0 (0.0%) |
| $10,000 to $24,999 | 0 (0.0%) | 0 (0.0%) |
| $25,000 to $34,999 | 17 (4.8%) | 52 (4.9%) |
| $35,000 to $49,999 | 47 (13.3%) | 10 (0.9%) |
| $50,000 to $74,999 | 23 (6.5%) | 9 (0.8%) |
| $75,000 to $99,999 | 32 (9.0%) | 142 (13.2%) |
| $100,000 to $149,999 | 235 (66.4%) | 148 (13.8%) |
| $150,000 or more | 0 (0.0%) | 293 (27.3%) |
| Total | 354 (100.0%) | 1,073 (100.0%) |
Property Value to Household Income Ratio in Connerton
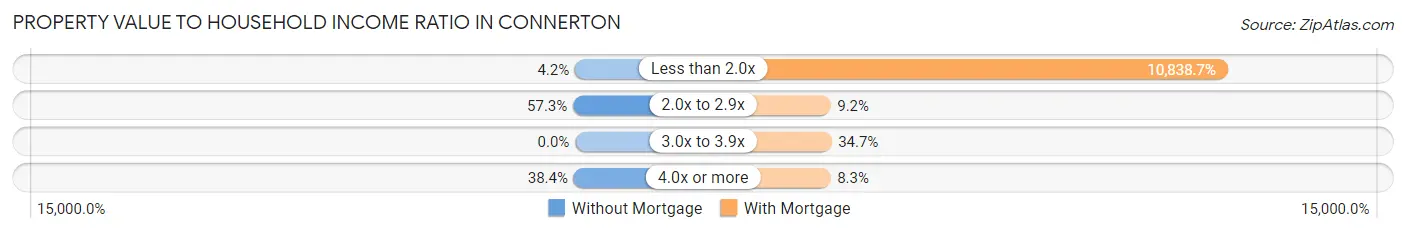
| Value-to-Income Ratio | Without Mortgage | With Mortgage |
| Less than 2.0x | 15 (4.2%) | 116,299 (10,838.7%) |
| 2.0x to 2.9x | 203 (57.3%) | 99 (9.2%) |
| 3.0x to 3.9x | 0 (0.0%) | 372 (34.7%) |
| 4.0x or more | 136 (38.4%) | 89 (8.3%) |
| Total | 354 (100.0%) | 1,073 (100.0%) |
Real Estate Taxes by Mortgage Status in Connerton
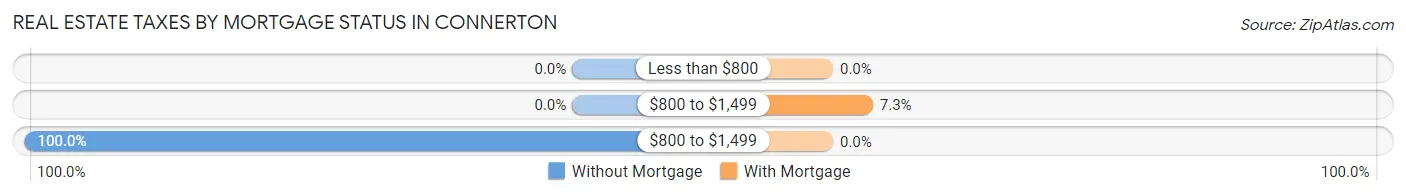
| Property Taxes | Without Mortgage | With Mortgage |
| Less than $800 | 0 (0.0%) | 0 (0.0%) |
| $800 to $1,499 | 0 (0.0%) | 78 (7.3%) |
| $800 to $1,499 | 354 (100.0%) | 0 (0.0%) |
| Total | 354 (100.0%) | 1,073 (100.0%) |
Health & Disability in Connerton
Health Insurance Coverage by Age in Connerton
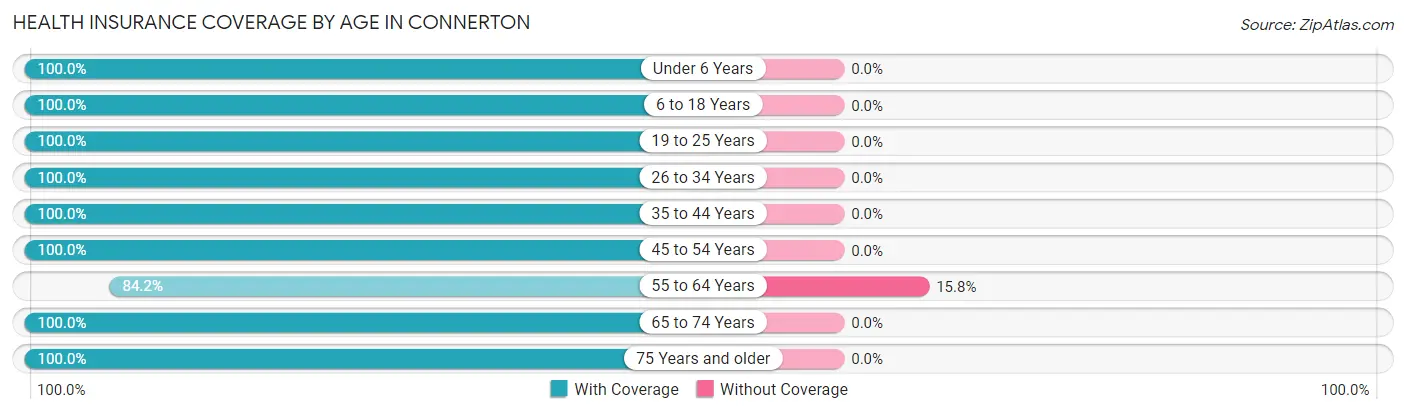
| Age Bracket | With Coverage | Without Coverage |
| Under 6 Years | 663 (100.0%) | 0 (0.0%) |
| 6 to 18 Years | 1,326 (100.0%) | 0 (0.0%) |
| 19 to 25 Years | 307 (100.0%) | 0 (0.0%) |
| 26 to 34 Years | 701 (100.0%) | 0 (0.0%) |
| 35 to 44 Years | 988 (100.0%) | 0 (0.0%) |
| 45 to 54 Years | 523 (100.0%) | 0 (0.0%) |
| 55 to 64 Years | 271 (84.2%) | 51 (15.8%) |
| 65 to 74 Years | 307 (100.0%) | 0 (0.0%) |
| 75 Years and older | 86 (100.0%) | 0 (0.0%) |
| Total | 5,172 (99.0%) | 51 (1.0%) |
Health Insurance Coverage by Citizenship Status in Connerton
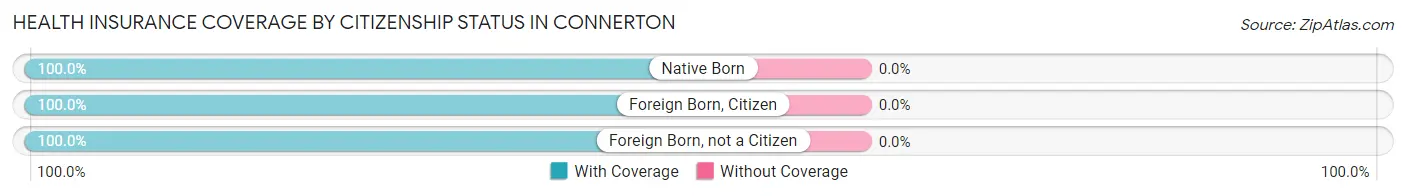
| Citizenship Status | With Coverage | Without Coverage |
| Native Born | 663 (100.0%) | 0 (0.0%) |
| Foreign Born, Citizen | 1,326 (100.0%) | 0 (0.0%) |
| Foreign Born, not a Citizen | 307 (100.0%) | 0 (0.0%) |
Health Insurance Coverage by Household Income in Connerton
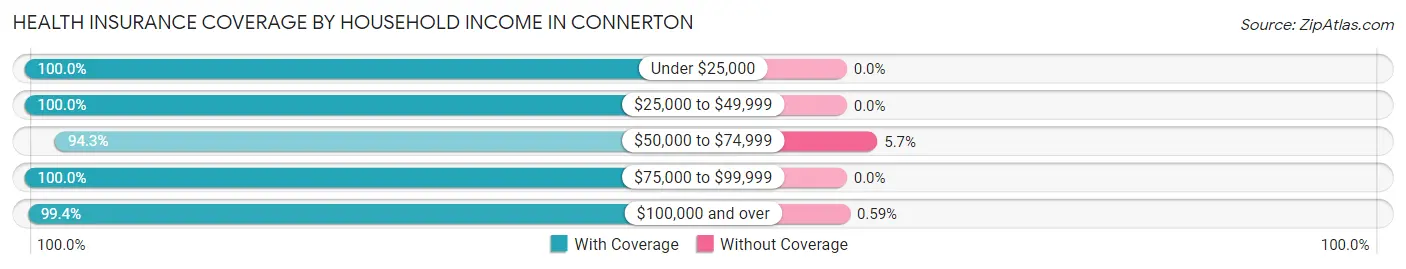
| Household Income | With Coverage | Without Coverage |
| Under $25,000 | 143 (100.0%) | 0 (0.0%) |
| $25,000 to $49,999 | 222 (100.0%) | 0 (0.0%) |
| $50,000 to $74,999 | 462 (94.3%) | 28 (5.7%) |
| $75,000 to $99,999 | 467 (100.0%) | 0 (0.0%) |
| $100,000 and over | 3,878 (99.4%) | 23 (0.6%) |
Public vs Private Health Insurance Coverage by Age in Connerton
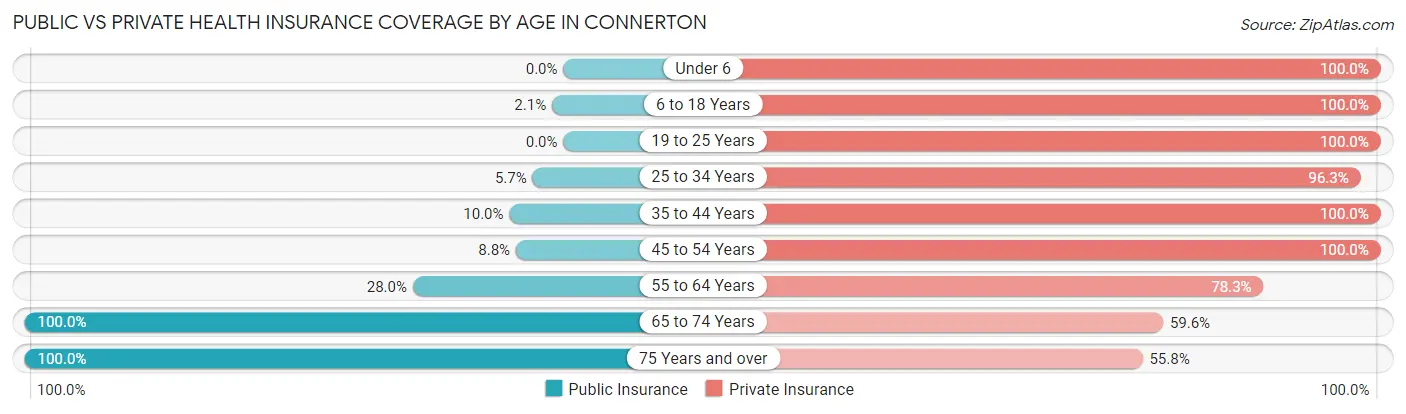
| Age Bracket | Public Insurance | Private Insurance |
| Under 6 | 0 (0.0%) | 663 (100.0%) |
| 6 to 18 Years | 28 (2.1%) | 1,326 (100.0%) |
| 19 to 25 Years | 0 (0.0%) | 307 (100.0%) |
| 25 to 34 Years | 40 (5.7%) | 675 (96.3%) |
| 35 to 44 Years | 99 (10.0%) | 988 (100.0%) |
| 45 to 54 Years | 46 (8.8%) | 523 (100.0%) |
| 55 to 64 Years | 90 (28.0%) | 252 (78.3%) |
| 65 to 74 Years | 307 (100.0%) | 183 (59.6%) |
| 75 Years and over | 86 (100.0%) | 48 (55.8%) |
| Total | 696 (13.3%) | 4,965 (95.1%) |
Disability Status by Sex by Age in Connerton
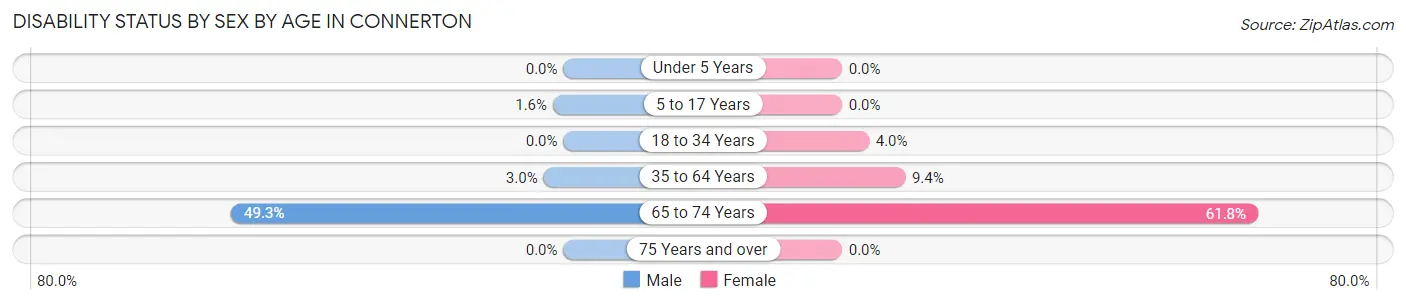
| Age Bracket | Male | Female |
| Under 5 Years | 0 (0.0%) | 0 (0.0%) |
| 5 to 17 Years | 12 (1.6%) | 0 (0.0%) |
| 18 to 34 Years | 0 (0.0%) | 25 (4.0%) |
| 35 to 64 Years | 27 (2.9%) | 86 (9.4%) |
| 65 to 74 Years | 74 (49.3%) | 97 (61.8%) |
| 75 Years and over | 0 (0.0%) | 0 (0.0%) |
Disability Class by Sex by Age in Connerton
Disability Class: Hearing Difficulty
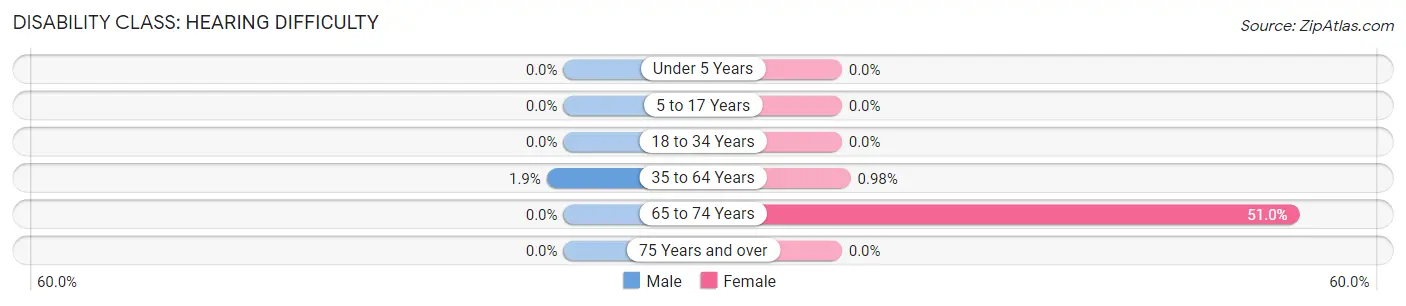
| Age Bracket | Male | Female |
| Under 5 Years | 0 (0.0%) | 0 (0.0%) |
| 5 to 17 Years | 0 (0.0%) | 0 (0.0%) |
| 18 to 34 Years | 0 (0.0%) | 0 (0.0%) |
| 35 to 64 Years | 17 (1.9%) | 9 (1.0%) |
| 65 to 74 Years | 0 (0.0%) | 80 (51.0%) |
| 75 Years and over | 0 (0.0%) | 0 (0.0%) |
Disability Class: Vision Difficulty
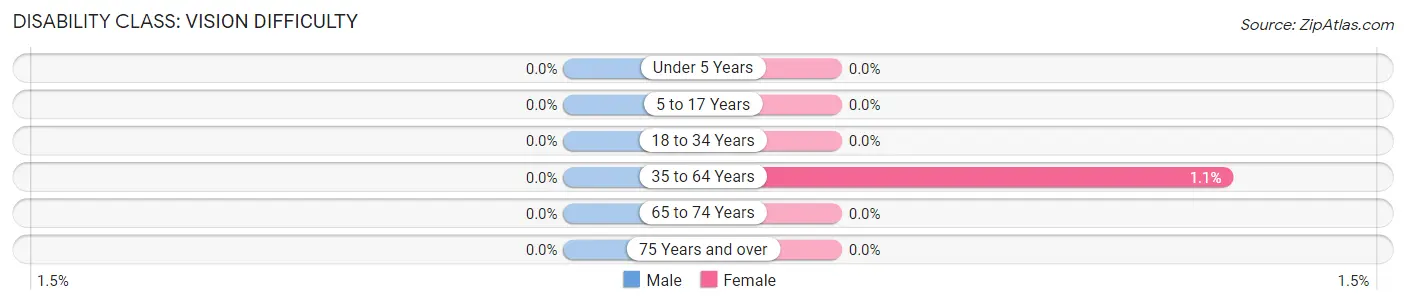
| Age Bracket | Male | Female |
| Under 5 Years | 0 (0.0%) | 0 (0.0%) |
| 5 to 17 Years | 0 (0.0%) | 0 (0.0%) |
| 18 to 34 Years | 0 (0.0%) | 0 (0.0%) |
| 35 to 64 Years | 0 (0.0%) | 10 (1.1%) |
| 65 to 74 Years | 0 (0.0%) | 0 (0.0%) |
| 75 Years and over | 0 (0.0%) | 0 (0.0%) |
Disability Class: Cognitive Difficulty
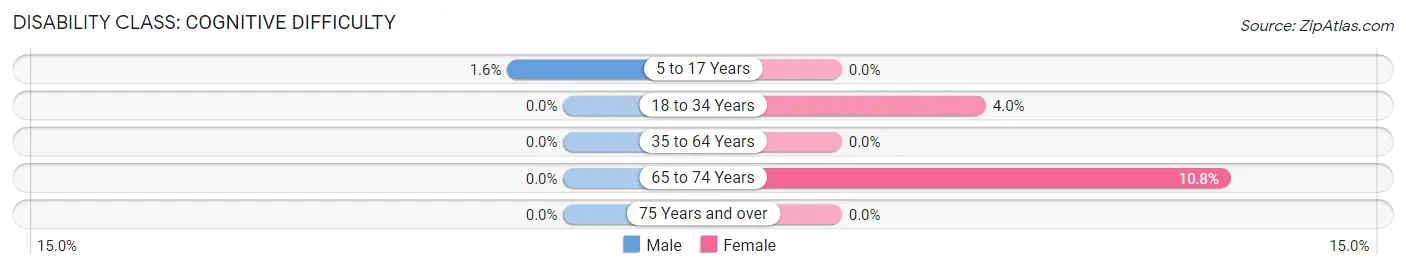
| Age Bracket | Male | Female |
| 5 to 17 Years | 12 (1.6%) | 0 (0.0%) |
| 18 to 34 Years | 0 (0.0%) | 25 (4.0%) |
| 35 to 64 Years | 0 (0.0%) | 0 (0.0%) |
| 65 to 74 Years | 0 (0.0%) | 17 (10.8%) |
| 75 Years and over | 0 (0.0%) | 0 (0.0%) |
Disability Class: Ambulatory Difficulty
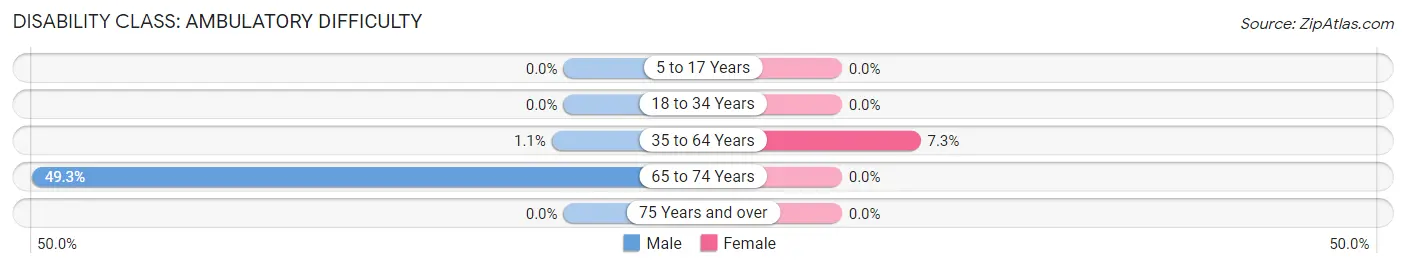
| Age Bracket | Male | Female |
| 5 to 17 Years | 0 (0.0%) | 0 (0.0%) |
| 18 to 34 Years | 0 (0.0%) | 0 (0.0%) |
| 35 to 64 Years | 10 (1.1%) | 67 (7.3%) |
| 65 to 74 Years | 74 (49.3%) | 0 (0.0%) |
| 75 Years and over | 0 (0.0%) | 0 (0.0%) |
Disability Class: Self-Care Difficulty
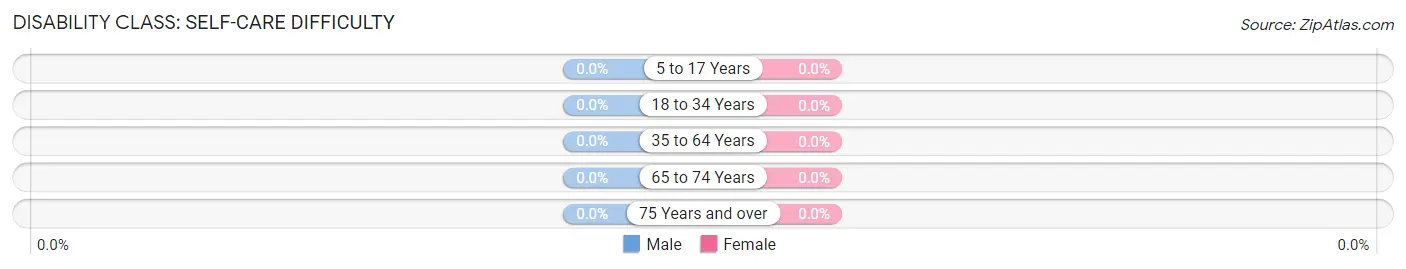
| Age Bracket | Male | Female |
| 5 to 17 Years | 0 (0.0%) | 0 (0.0%) |
| 18 to 34 Years | 0 (0.0%) | 0 (0.0%) |
| 35 to 64 Years | 0 (0.0%) | 0 (0.0%) |
| 65 to 74 Years | 0 (0.0%) | 0 (0.0%) |
| 75 Years and over | 0 (0.0%) | 0 (0.0%) |
Technology Access in Connerton
Computing Device Access in Connerton
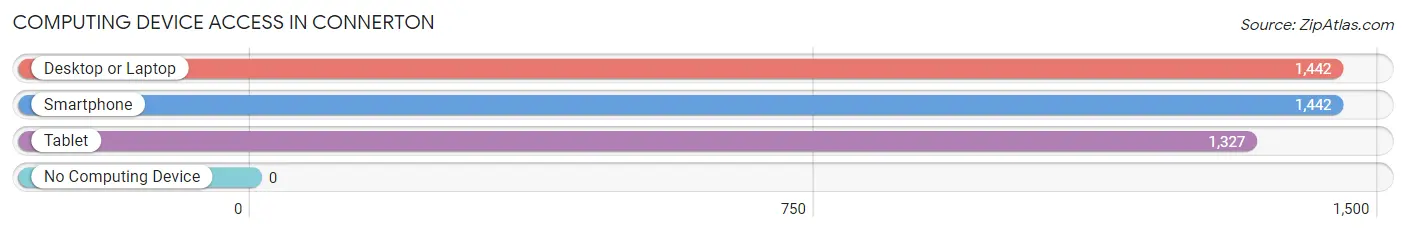
| Device Type | # Households | % Households |
| Desktop or Laptop | 1,442 | 100.0% |
| Smartphone | 1,442 | 100.0% |
| Tablet | 1,327 | 92.0% |
| No Computing Device | 0 | 0.0% |
| Total | 1,442 | 100.0% |
Internet Access in Connerton
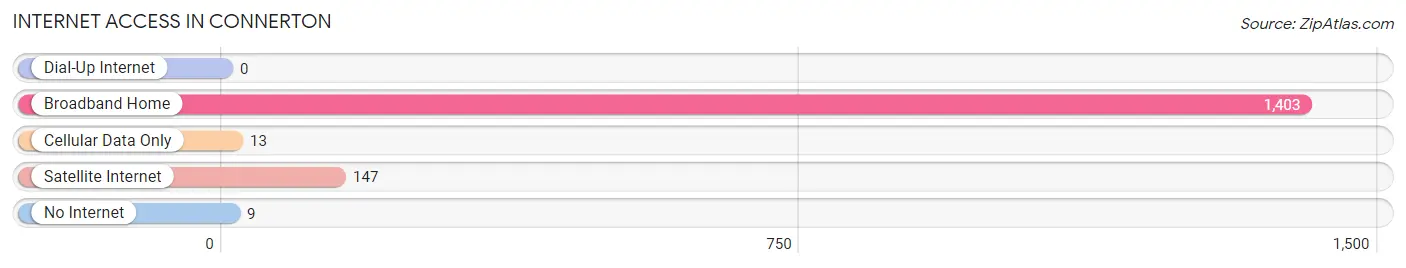
| Internet Type | # Households | % Households |
| Dial-Up Internet | 0 | 0.0% |
| Broadband Home | 1,403 | 97.3% |
| Cellular Data Only | 13 | 0.9% |
| Satellite Internet | 147 | 10.2% |
| No Internet | 9 | 0.6% |
| Total | 1,442 | 100.0% |
Connerton Summary
Connerton, Florida is a small unincorporated community located in Pasco County, Florida. It is situated approximately 25 miles north of Tampa and is part of the Tampa-St. Petersburg-Clearwater Metropolitan Statistical Area. The population of Connerton was estimated to be 1,845 in 2019.
History
Connerton was founded in the late 1800s by a group of settlers from Connecticut. The town was named after the settlers’ home state. The settlers were attracted to the area due to its fertile soil and abundant wildlife. The town was officially incorporated in 1925 and was home to a variety of businesses, including a general store, a post office, a sawmill, and a grist mill.
In the 1950s, Connerton began to experience a population boom as people moved to the area to take advantage of the booming citrus industry. The town was also home to a number of small businesses, including a grocery store, a hardware store, and a gas station.
In the late 1970s, Connerton began to experience a decline in population as people moved away from the area. The town was eventually annexed by Pasco County in 1982.
Geography
Connerton is located in Pasco County, Florida. It is situated approximately 25 miles north of Tampa and is part of the Tampa-St. Petersburg-Clearwater Metropolitan Statistical Area. The town is located on the western shore of Lake Tarpon, a freshwater lake that is part of the Hillsborough River system. The town is bordered by the cities of Land O’ Lakes to the north, Lutz to the east, and New Port Richey to the south.
The town has a total area of 4.3 square miles, all of which is land. The terrain is mostly flat and the town is located at an elevation of 25 feet above sea level. The climate is classified as humid subtropical, with hot, humid summers and mild winters.
Economy
The economy of Connerton is largely based on agriculture and tourism. The town is home to a number of citrus groves, as well as a number of small businesses. The town is also home to a number of restaurants, bars, and other tourist attractions.
The town is also home to a number of manufacturing and industrial businesses, including a paper mill and a plastics factory. The town is also home to a number of retail stores, including a Walmart Supercenter.
Demographics
As of 2019, the population of Connerton was estimated to be 1,845. The population is predominantly white (90.2%), with a small percentage of African Americans (4.2%), Hispanics (3.2%), and Asians (1.2%). The median household income is $50,945, and the median home value is $179,400.
The town is served by the Pasco County School District, which operates a number of elementary, middle, and high schools in the area. The town is also home to a number of private schools, including Connerton Christian Academy and Connerton Montessori School.
Conclusion
Connerton, Florida is a small unincorporated community located in Pasco County, Florida. It is situated approximately 25 miles north of Tampa and is part of the Tampa-St. Petersburg-Clearwater Metropolitan Statistical Area. The town was founded in the late 1800s by a group of settlers from Connecticut and was officially incorporated in 1925. The town has a total area of 4.3 square miles, all of which is land. The economy of Connerton is largely based on agriculture and tourism, and the population is predominantly white. The town is served by the Pasco County School District and is home to a number of private schools.
Common Questions
What is Per Capita Income in Connerton?
Per Capita income in Connerton is $28,996.
What is the Median Family Income in Connerton?
Median Family Income in Connerton is $116,199.
What is the Median Household income in Connerton?
Median Household Income in Connerton is $115,757.
What is Income or Wage Gap in Connerton?
Income or Wage Gap in Connerton is 67.6%.
Women in Connerton earn 32.4 cents for every dollar earned by a man.
What is Inequality or Gini Index in Connerton?
Inequality or Gini Index in Connerton is 0.28.
What is the Total Population of Connerton?
Total Population of Connerton is 6,383.
What is the Total Male Population of Connerton?
Total Male Population of Connerton is 3,515.
What is the Total Female Population of Connerton?
Total Female Population of Connerton is 2,868.
What is the Ratio of Males per 100 Females in Connerton?
There are 122.56 Males per 100 Females in Connerton.
What is the Ratio of Females per 100 Males in Connerton?
There are 81.59 Females per 100 Males in Connerton.
What is the Median Population Age in Connerton?
Median Population Age in Connerton is 32.4 Years.
What is the Average Family Size in Connerton
Average Family Size in Connerton is 3.8 People.
What is the Average Household Size in Connerton
Average Household Size in Connerton is 3.6 People.
How Large is the Labor Force in Connerton?
There are 2,338 People in the Labor Forcein in Connerton.
What is the Percentage of People in the Labor Force in Connerton?
50.5% of People are in the Labor Force in Connerton.
What is the Unemployment Rate in Connerton?
Unemployment Rate in Connerton is 4.4%.